Embed Size (px)
Citation preview

Welcome To The 3rd Annual
#scotdata

#scotdata
Ray BuggScot-Tech

#scotdata
Conference App & Wifi on badges

#scotdata
The Data DoctorsAppointments
#scotdata

Our next events
#digiscot
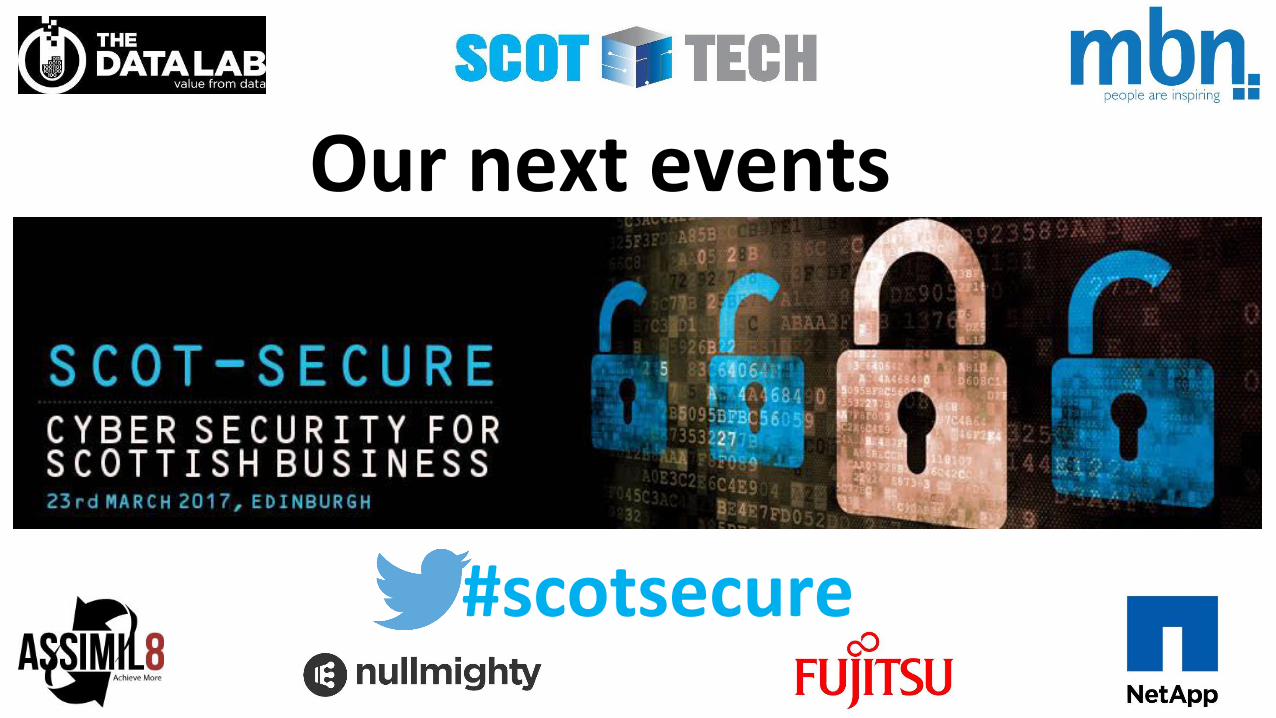
Our next events
#scotsecure

#scotdata

#scotdata
Mark StephenBBC Scotland

#scotdata
Martin SquiresWalgreen Boots
Alliance

Martin Squires
Global Lead, Customer Intelligence & Data
Health & Beauty International and Brands

Boots UK
* Figures are approximations as at 31 March 2012 and include associates and joint ventures
88% of population within 10 minutes of a
Boots store
Nearly 2,500 Boots stores
60m visitors each year to boots.com
Nearly 625 Boots Opticians practices
17.8 million Boots Advantage Card members
45% order online and collect in-store

To be the world’s leading
pharmacy-led health and
beauty retailer
Boots mission

“Champion everyone’s right to feel good”
Built on being customer led

We have to really “Get Women”
Truly Customer Led
Boots Understands Women
Through Great Insight

Advantage card at the coreShops on weekdays at
lunchtime in a local store
Buys vitamins –health conscious
Is a parent with a young baby
3 for 2 offers
Boots Advantage Card number
Buys into meal deal offer

Every time our customer shops
Shops in large store Saturday
mornings
Redeems coupons
Purchases self-selection cosmetics,
but also premium cosmetics
Could have a partner?
Boots Advantage Card number –same as previous receipt!

Building an holistic picture

Understanding each customer
• What they are doing
• Where they are doing it
• Why they are doing it
• What they feel about it

Context of the empowered customer
• More touch points
• More complex and faster changing
opinions
• Expectation that you use insight
• Seamless multi-channel delivery

Our multi-channel approach
UK’s No1 visited health and beauty website*
* excludes National Health Service, based on most recent information provided by Experian Hitwise

Our multi-channel approach
Trusted health and wellbeing advice and information
The most read health and beauty magazine in the UK

Our multi-channel approach
iPads in over 600 storesNo1 in UK AppStore
download chart 20% of boots.com visitors via mobile

Single view of the customer
Web metrics by device
Role of different devices in the same customer journey
Impact of Advice & Info on customer behaviour
Identifying and understanding the same customer online and offline – browsing, purchasing, sharing
How do consumers influence one another? And who is reallyinfluential?

Single view of the customer
Cheryl – 33
Living alone no childrenActive Ad Card Member

Drives insight driven communication
Transactional Data: We know what they
bought
Who to speak to? About what?
Demographic Data: We know who
the customer is
Response Data:We know who
responds to offers
Contact Data: We know whoreceived offers
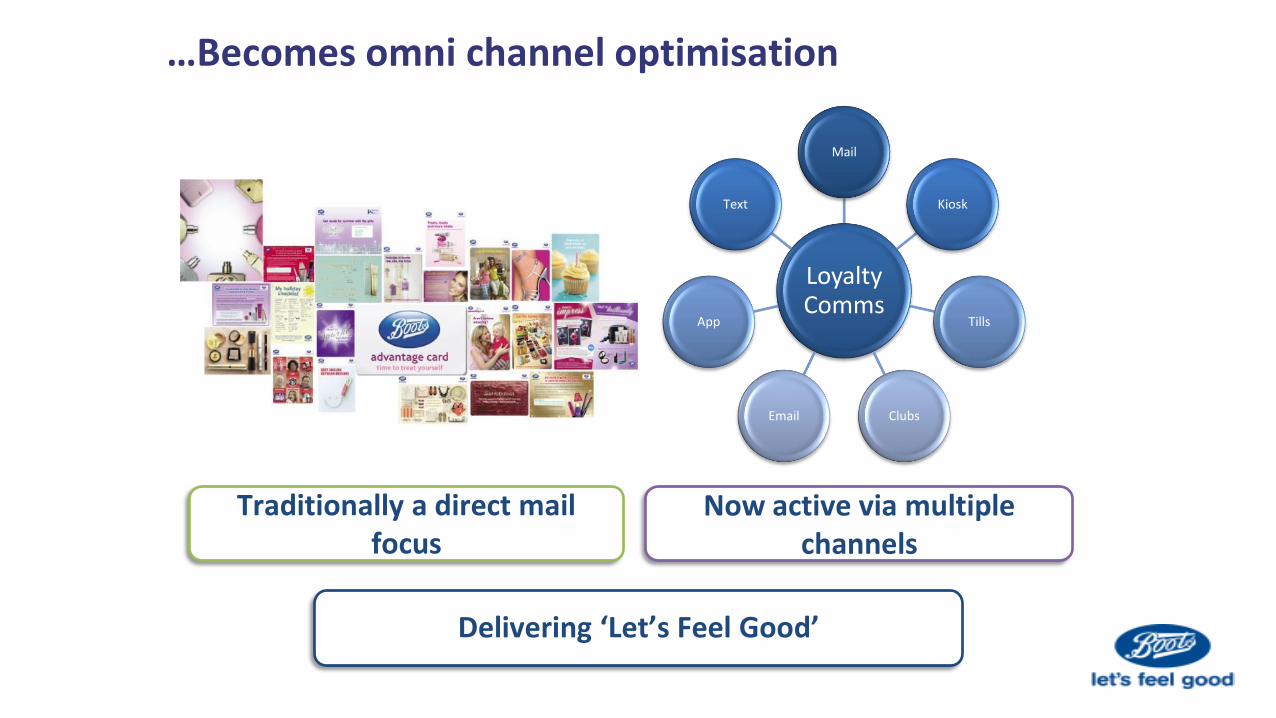
…Becomes omni channel optimisation
Delivering ‘Let’s Feel Good’
Traditionally a direct mail focus
Loyalty Comms
Kiosk
Tills
ClubsEmail
App
Text
Now active via multiple channels

Needs the right technology & process

Freeing the analysts
• Renaissance analysts!
• Art meets science
• Computer science & stats
• Creating a story

Insight Portal
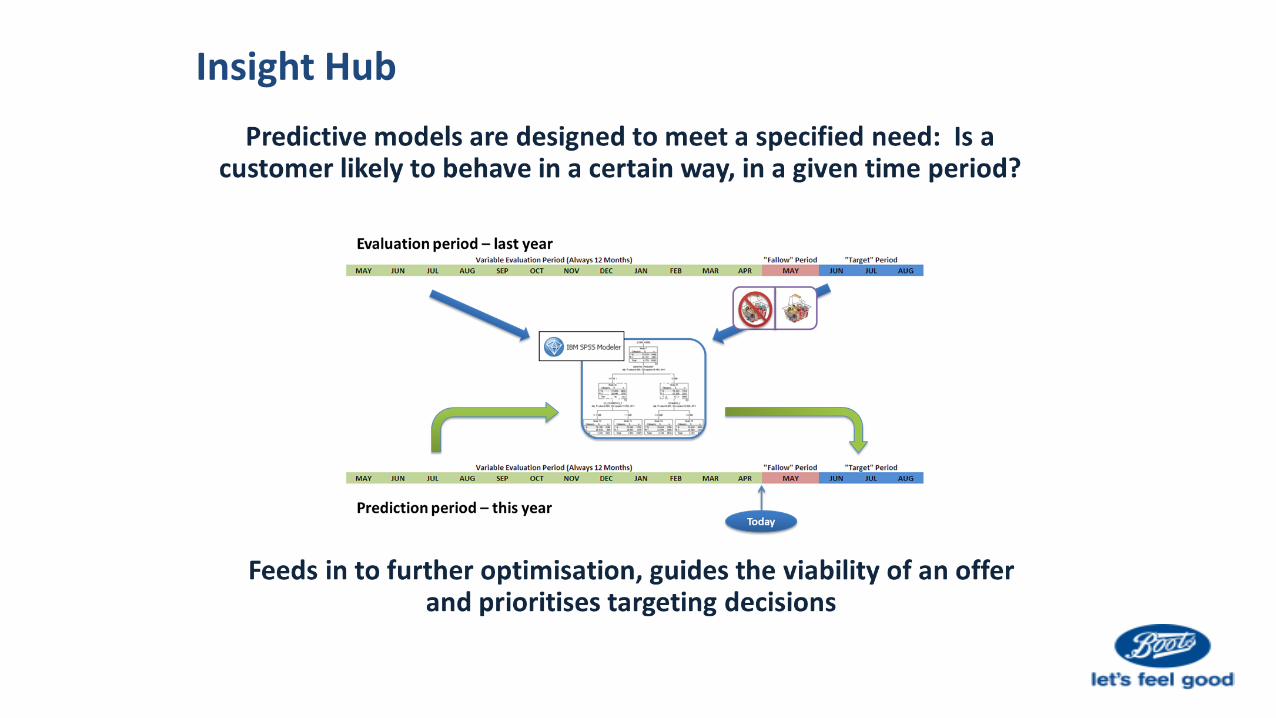
Insight Hub

Personalisation Hub

Segment of 1?

Content is key

Case study: No 7 CRM programme

Integration

Why do we do all this?
Generate great insight into what
women want
Deliver it in the ways they want
Develop a customer offer
they love

Personalisation delivers results
Generic 3 for 2 offerPersonalised to each customers
favourite skincare productsvs
Redemption rates (%)
“I like that the coupons relate to the
products which I buy. It makes it feel
like you have gone that bit extra to
know your customers.”“If coupons are
more relevant, you
are more likely to
go out of your way
and make a
special visit”


#scotdata
Vlasios VasileiouZopa

Zopa – a story of growth
Vlasios VasileiouHead of Data Science

44
Peer to Peer Lending at Zopa
• Credit & fraud risk• ID verification• Pricing• Loan servicing
Retail & Institutional Lenders Borrowers

45
Peer to Peer Lending at Zopa
• Credit & fraud risk• ID verification• Pricing• Loan servicing
Retail & Institutional Lenders Borrowers
~3 - 6% annualized return Better interest rates
Faster, simpler service

46
Zopa
Launched 2005, inventing peer to peer (P2P) lending
Largest P2P platform in Europe
56,000 active retail lenders
Lent £1.8bn of unsecured personal loans to over
230,000 UK borrowers

Fintech Industry

Zopa during analytical infancy (2005 – 2014)
• SQL
• Excel
• Externally produced credit scores & insight
£0
£100
£200
£300
£400
£500
£600
£700
2005 2007 2009 2011 2013 2015
Dis
bu
rsals
(M
illio
ns)
Year
Annual disbursals

49
Zopa during analytical renaissance (2014 – 2015)
2014, £15m investment
Board recognized need for data-driven growth Creation of Data Science function
Systematization of Data Analytics

50
Systematizing Machine Learning at Zopa (2014)
Wanted to be able to produce ML models that were: Rapidly generated
easily-vettable
highly-predictive
easily deployable
Several considerations:• Common codebase or personal choice of tools?
• Buy or build?
• Which language? Which package?

51
Systematizing Machine Learning at Zopa (2014)
Wanted to be able to produce ML models that were: Rapidly generated
easily-vettable
highly-predictive
easily deployable
Several considerations:• Buy or build?
• Which language? Which package?
Common codebase

52
Systematizing Machine Learning at Zopa (2014)
Wanted to be able to produce ML models that were: Rapidly generated
easily-vettable
highly-predictive
easily deployable
Several considerations:• Which language?
Common codebase
Built in-house

53
Systematizing Machine Learning at Zopa (2014)
Wanted to be able to produce ML models that were: Rapidly generated
easily-vettable
highly-predictive
easily deployable
Common codebase
Built in-house

54
Streamlined and Automated ML Application
• Leverage PyData Tools (sklearn, pandas, xgboost, keras, …)
• 9k lines
• Used and improved by all Zopa data scientists
• Combines external toolkits + best practices in ML
Predictor – Zopa’s ML Toolkit (2014)

55
First big win – our Credit Risk Model (2015)
• Credit-risk estimation: a core component of our operations
• Pre 2015, using externally obtained credit-risk scores & models
£0
£100
£200
£300
£400
£500
£600
£700
2005 2007 2009 2011 2013 2015
Dis
bu
rsals
(M
illio
ns)
Year
Annual disbursals

56
First big win – our Credit Risk Model (2015)
• Q1 2015, built and deployed own credit-risk model in-house
£0
£100
£200
£300
£400
£500
£600
£700
2005 2007 2009 2011 2013 2015
Dis
bu
rsals
(M
illio
ns)
Year
Annual disbursals
57
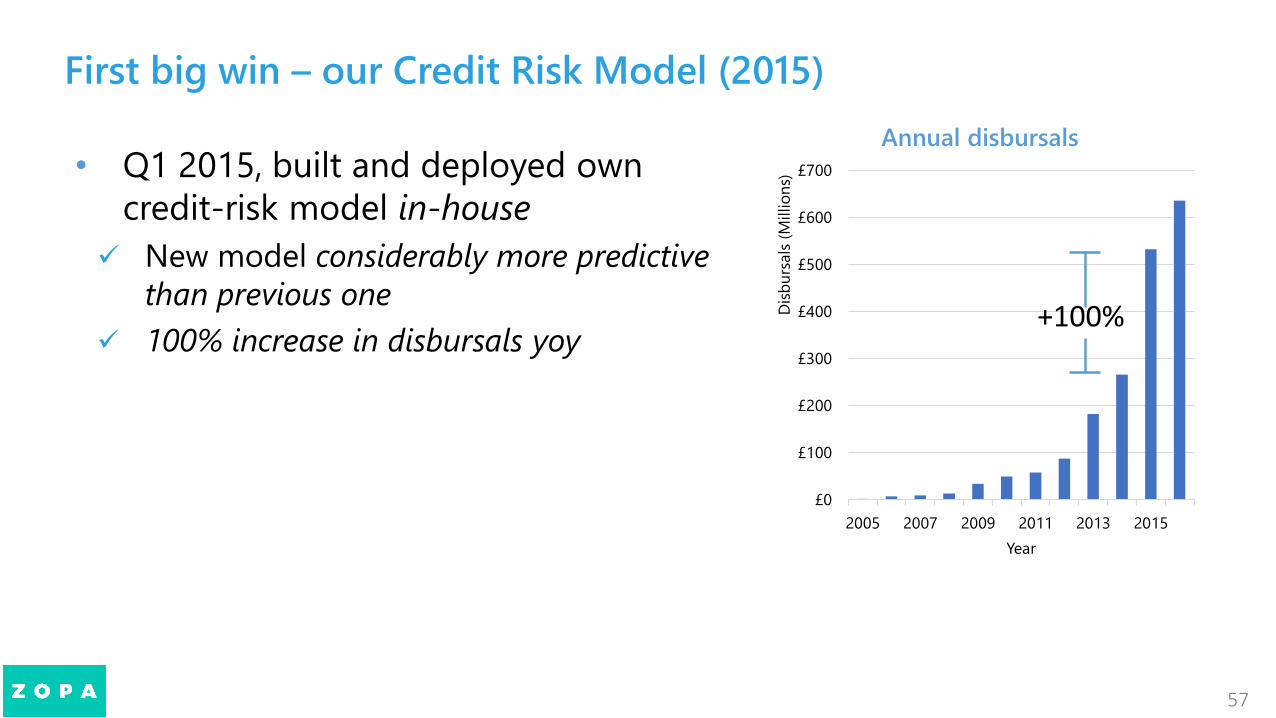
First big win – our Credit Risk Model (2015)
£0
£100
£200
£300
£400
£500
£600
£700
2005 2007 2009 2011 2013 2015
Dis
bu
rsals
(M
illio
ns)
Year
Annual disbursals
+100%
• Q1 2015, built and deployed own
credit-risk model in-house
New model considerably more predictive
than previous one
100% increase in disbursals yoy

58
2015 – 2016, Emerging Data Culture
Data-driven wins
Commitment to data

59
2015 – 2016, Emerging Data Culture
Data-driven wins
Commitment to data
Accelerators
• Embedded data science• Two-way training/outreach• Tool sharing

60
10 ML Models currently used for decisioning, more under consideration
• Borrower application pipeline (7 active models)• Pricing (2 models)• Marketing (1 model)• Customer satisfaction• Collections
2015 – 2016, Machine Learning Proliferation at Zopa
61
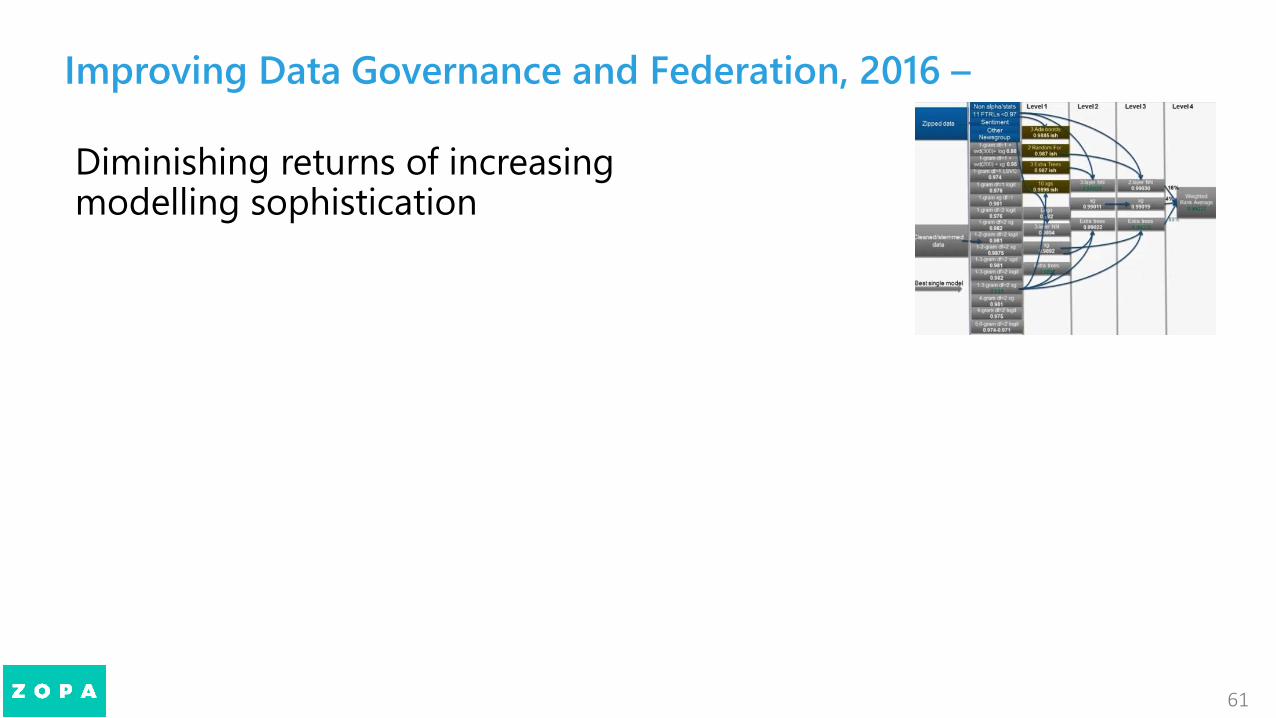
Improving Data Governance and Federation, 2016 –
Diminishing returns of increasing modelling sophistication

62
Improving Data Governance and Federation, 2016 –
Diminishing returns of increasing modelling sophistication Need better & more data

63
Improving Data Governance and Federation, 2016 –
Diminishing returns of increasing modelling sophistication Need better & more data
Data analytics only as good as your data quality/availability
govdelivery.com

64
Improving Data Governance and Federation, 2016 –
Diminishing returns of increasing modelling sophistication Need better & more data
Data analytics only as good as your data quality/availability Break down the silos!
govdelivery.com

65
Improving Data Governance and Federation, 2016 –
Data warehouse with AWS Redshift In progress
Data lake Planned

66
Thank you!
Further readingblog.zopa.com/2016/10/21/the-birth-of-predictor/
blog.zopa.com/2016/12/02/data-democratization/
Come work with us!zopa.recruitee.com

67

About me
• Education in Physics/Astrophysics
• Researcher in Astrophysics
• Joined Zopa as a data scientist, 2014
• “Head of Data Science”, late 2015

#scotdata
Regina BergholtClear Returns

Achieving OptimisationFrom Analytics & AI
@ClearReturns

A Classic Business Problem
£0
£100
£200
£300
£400
£500
£600
£700
£800
QTR1 QTR2 QTR3 QTR4
Quarterly Sales and Revenues(in millions)

A Classic Approach

A Big Data Approach

Big Data Case Studies

£0
£100
£200
£300
£400
£500
£600
£700
£800
QTR1 QTR2 QTR3 QTR4
Quarterly Sales and Revenues(in millions)
$
$
$
$
$
$$
$
$
$
Has the Problem Been Solved?

“We have grown gross sales and market share across both
Waitrose and John Lewis, but our profits are down.”
- Sir Charlie Mayfield, Chairman of JLP
Maybe not…

Faulty Can’t be resold as
new
Up to 60% returned
*IHL Group, Retail Analysts, June 2015
Returns cost retailers £435billion globally* £221 billion preventable retail returns
& returns are growing faster than sales
It’s not a sale until the customer decides to keep it

6.5%
80%Returns
1% of customers cause up to 10% of returns costs

Accessories
Purchased 96 items
Gross Sales = £1,144
Womenswear
Purchased 104 items
Gross Sales = £1,845
Menswear
Purchased 28 items
Gross Sales = £349
Health & Beauty
Purchased 8 items
Gross Sales = £352
Total Net after Refunds & Costs = £63
-£45 Net after refunds & costs. -£203 Net after refunds & costs.
-£41 Net after refunds & costs. £352 Net
Returned 88 Returned 100
Returned 25 Returned 0
Total Sales = £3,690
A Retailer’s Dream Turned into a NightmareTurned Nightmare

Knowing Your Customers

“Feminine and figure
enhancing”
Stiff structure only
fits one particular
body type
“Berry lace panel fit…
wear with heels and a
statement clutch”
Too bright, poor design
gets caught on all
accessories
Finding the Toxic Products

Improving the Bottom Line
DataFocus on the Right Metrics
Reward the Right
Behaviours
Optimize Profits

CLEAR RETURNS
intelligently protecting profits

#scotdata
Questions & Discussion

#scotdata
Breakouts on rear of badges

#scotdata
Refreshments & networking
Welcome Back
#scotdata

#scotdata
Panel Discussion

#scotdata
• Dr Nava Tintarev, Bournemouth University• Ken Macdonald, ICO• Martin Squires, Walgreen Boots Alliance• Dr Hannah Rudman, Rudman Consulting

DATA ANALYTICS: BALANCING INSIGHT, PRIVACY & TRUST
Big Data Scotland, Dynamic Earth, Edinburgh
8th of December, 2016

MOTIVATION
• Chartered Institute of Marketing (CIM) survey with 2500 people
• Nine in ten people have no idea what companies do with the personal
information the firms hold about them.
• Personal data policies on websites should be clearer and simpler.
Source: http://www.bbc.co.uk/news/business-37476335, published September 2016
• ESRC event ``What is the Internet Hiding From You’’?
• In May 2016, the EU passed a General Data Protection Regulation (effective
from 2018) which will also create a ``right to explanation'’: user can ask for
an explanation of an algorithmic decision that was made about them.

WHAT IS THIS IS AND IS NOT.
• This session is not about pointing fingers.
• It is about having a conversation about what happens with personal DATA.
• What users are willing to share
• … and what they should expect to receive in return.
• This is new ground, we have not been here before.
• We will need to have a lot of conversations.

PANEL MEMBERS
• Dr Hannah Rudman, Director, Rudman Consulting
• Ken Macdonald, Head of ICO Regions, Scotland, NI & Wales, ICO
• Martin Squires, Global Lead, Customer Intelligence and Data, Walgreen Boots Alliance
• Nava Tintarev, Assistant Professor, Intelligent Interactive Systems, Bournemouth University

TOPICS
• Intrusive data analytics
• Transparency of analytics
• Legislation of privacy


INTRUSIVE DATA ANALYTICS
When do analytics become too intrusive?
When can we make inferences across data sources, or
inferences that users did not consent to being made when
they initially provide the data?


TRANSPARENCY OF ANALYTICS
How should we make algorithmic biases visible to users?
How do we avoid filter bubbles like the one that happened
during Brexit? How can explanations be used to improve
transparency?


LEGISLATION OF PRIVACY
Is there going to be a swing in the balance of power towards
individuals / consumers? How do we balance this with
businesses' need to be competitive?

OPEN FLOOR
Your thoughts and comments? #scotdata @scot_tech
@navatintarev

EXTRA

DATA ANONYMIZATION AND RE-IDENTIFICATION
• 87% of US residents can be uniquely identified by zip+DOB+gender
• Sent the Massachusetts Governor his own medical records based on
publically available data
• Working paper: Uniqueness of Simple Demographics in the U.S.
Population. Latanya Sweeney

DATA ANONYMIZATION AND RE-IDENTIFICATION
• In 2006, AOL (America OnLine) released detailed web search logs of a large number of its users.
• The release was intentional, and aimed at promoting academic research; however, there was no restriction on who could see the information.
• The user information (named and usernames) was anonymized (by replacing it with a unique number). However, AOL did not redact search query.
• Soon, it was clear that search queries were enough to identify the users:
• The New York Times was able to locate an individual from the released and anonymized search records by cross referencing them with phonebook listingsSource: A Face Is Exposed for AOL Searcher No. 4417749. M. Barbaro and T. Zeller Jr. August 9, 2006
• As many search information contained sensitive details (medical, sexual orientation, …) and re-identification was possible, AOL removed the data.
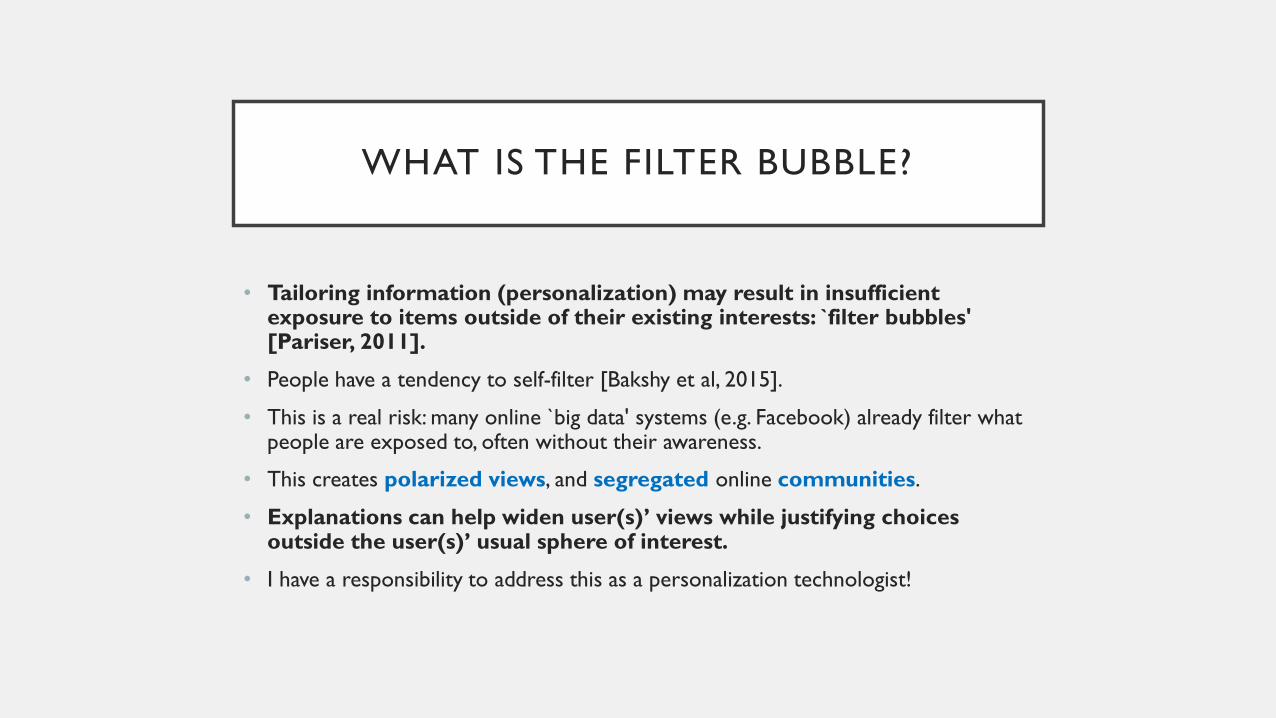
WHAT IS THE FILTER BUBBLE?
• Tailoring information (personalization) may result in insufficient exposure to items outside of their existing interests: `filter bubbles' [Pariser, 2011].
• People have a tendency to self-filter [Bakshy et al, 2015].
• This is a real risk: many online `big data' systems (e.g. Facebook) already filter what people are exposed to, often without their awareness.
• This creates polarized views, and segregated online communities.
• Explanations can help widen user(s)’ views while justifying choices outside the user(s)’ usual sphere of interest.
• I have a responsibility to address this as a personalization technologist!

BREXIT FILTER BUBBLE

#scotdata
Shahid AliCompareTheMarket

part of the
Shahid Ali
Snr. Big Data Engineer
“Real-time ETL using Spark”
Introduction

Introduction
109t
part of the

Extract using Python.
110t
part of the
• Weblog data source on SFTP server.
• Create Amazon EC2/Azure VM Instance
• Sample python Script to get/copy filesftp.get(file, local_file)
s3_client.upload_file(local_file, bucket, s3_file_base)
• Copy Python/shell script on VM
• Automate script using cron job on Linux VM.
• Sample cron job15 * * * * /usr/bin/python <path to python script>

Transform using Spark Scala/Python
111t
part of the
• Apache Spark on AWS/Azure
• SBT (Source build Tool for Scala Java).
• Package up source code in a Jar file.
• Create AWS EMR cluster/Azure HDInsight Cluster of desired configuration with
Apache Spark running.
• Add an EMR step to run jar file.
• Create AWS Data Pipeline to automate the Transform process.
• If using MS Azure Orchestrate using Azure Data Factory.

Load into AWS Redshift db
112t
part of the
• Create Redshift cluster of desired configuration.
• Create a sample database/role/user.
• Use AWS Copy command to load spark output file into redshift db.
COPY dbo.customer
FROM 's3://EdinburghDemo/myfile.txt.gz'
CREDENTIALS 'aws_access_key_id=<>;aws_secret_access_key=<>'
delimiter ',' IGNOREHEADER 1 gzip;
COMMIT;

Visualization
113t
part of the
• AWS Quicksight
• MS Power BI.

Next Steps…
114t
part of the
• Create a free account
• AWS or MS Azure
• Create EMR/HDInsight cluster.
• Copy jar file to AWS S3 or MS Blob Storage.
• Run jar file using spark step.
• Save output on cloud storage of your choice.
• Load output file into AWS Redshift db or MS Azure Sql db.

#scotdata
Questions & Discussion

#scotdata
Ian BirdCERN

Harnessing the CERN network
for analysis, insight and
understanding
Dr. Ian Bird
CERN Senior Staff Scientist &
LHC Computing Project Lead
Edinburgh; 8th December 2016

The Mission of CERN
Push back the frontiers of knowledge
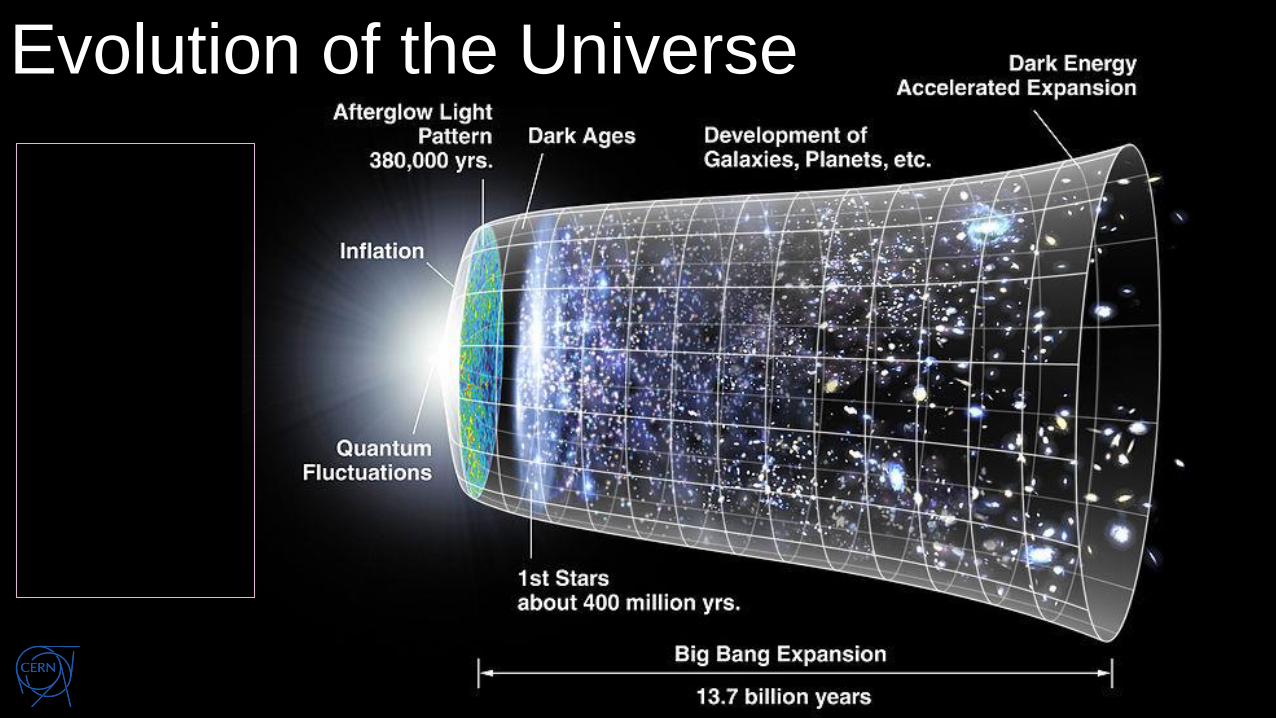
E.g. the secrets of the Big Bang …what was the matter like within the first
moments of the Universe’s existence?
Develop new technologies for accelerators and detectors
Information technology - the Web and the GRID
Medicine - diagnosis and therapy
Train scientists and engineers of tomorrow
Unite people from different countries and cultures
8 Dec 2016 [email protected]
9

120
CERN: founded in 1954: 12 European States
“Science for Peace”
Today: 22 Member States
Member States: Austria, Belgium, Bulgaria, Czech Republic, Denmark, Finland, France, Germany, Greece, Hungary, Israel, Italy, Netherlands, Norway, Poland,
Portugal, Romania, Slovak Republic, Spain, Sweden, Switzerland and United Kingdom
Associate Member States: Pakistan, Turkey
States in accession to Membership: Cyprus, Serbia
Applications for Membership or Associate Membership:Brazil, Croatia, India, Lithuania, Russia, Slovenia, Ukraine
Observers to Council: India, Japan, Russia, United States of America; European Union, JINR and UNESCO
~ 2300 staff
~ 1600 other paid personnel
~ 12700 scientific users
Budget (2016) ~1000 MCHF
8 Dec 2016 [email protected]
0
8 Dec 2016 [email protected]
2
Evolution of the Universe
Test the
Standard
Model?
Dark Matter?
Dark Energy?
Anti-matter?
(Gravity?)

The Large Hadron Collider (LHC)
• Largest Scientific Apparatus ever built
• World’s most powerful particle accelerator
• Two multi-purpose and two specialized
detectors
• Probes the conditions of the universe a
fraction of a second after the big bang
8 Dec 2016 [email protected]
3

Data Analysis at the LHCThe process to transform raw data into useful physics datasets
This is a complicated series of steps at the LHC (Run2)
Data
Volume
Processing
and people
HLT Reconstruction Reprocessing Organized
Analysis
Final
Selection
40k
core
s
60k c
ore
s
20k
core
s
30k
core
s
DA
Q and T
rig
ger
(le
ss than 2
00)
Op
era
tio
ns
(le
ss th
an
100)
Opera
tio
ns
(le
ss than
100)
Analy
sis
Users
(lM
ore
than 1
000)
Analy
sis
Users
(lM
ore
than 1
000)
Sele
cte
d R
AW
(1 G
B/s
)
De
rive
d D
ata
(2
GB
/s)
Fro
m D
ete
cto
r (1
PB
/s)
Analy
sis
Sele
ctio
n
(100M
B/s
)
Aft
er
Hard
ware
Trig
ger
(TB
/s)
De
rive
d D
ata
(2
GB
/s)
8 Dec 2016 [email protected]
5

12
6
Tier-1: permanent
storage, re-processing,
analysis
Tier-0
(CERN and Hungary):
data recording,
reconstruction and
distribution
Tier-2: Simulation,
end-user analysis
> 2 million jobs/day
~650k CPU cores
500 PB of storage
~170 sites,
42 countries
10-100 Gb links
WLCG:
An International collaboration to distribute and analyse LHC data
Integrates computer centres worldwide that provide computing and storage
resource into a single infrastructure accessible by all LHC physicists
The Worldwide LHC Computing Grid
8 Dec 2016 [email protected]

8 Dec 2016 [email protected]
7
Optical Private Network
Support T0 – T1 transfers
& T1 – T1 traffic
Managed by LHC Tier 0 and
Tier 1 sites
Networks
Up to 340 Gbps transatlantic

8 Dec 2016 [email protected]
8
Asia North America
South America
Europe
LHCOne: Overlay network
Allows NREN’s to manage HEP
traffic on general purpose network
Managed by NREN collaboration
0
10
20
30
40
50
60
70
JAN FEB MAR APR MAY JUN JUL AUG SEPT OCT NOV DEC JAN FEB MAR APR MAY

Data distribution
8 Dec
13
1
CERN (CPU)
CERN (Disk)
WLCG
LHC expts
FTS
CERN (Tape)
Regular transfers of >80 PB/month with ~100 PB/month during July-October
(many billions of files) (>50 GB/s globally)

Compute services
Cloud compute on OpenStack at CERN
- heart of the global federated structure
Moving towards Elastic
Hybrid IaaS model:• In house resources at full
occupation
• Elastic use of commercial
& public clouds• Assume “spot-market”
style pricing
OpenStack Resource Provisioning
HTCondor
Public Cloud
VMsContainersBare Metal and HPC
LSF
Volunteer
Computing
IT & Experiment
ServicesEnd Users CI/CD
APIs
CLIs
GUIs
Experiment Pilot Factories
8 Dec 2016 [email protected]
3

Archive storage – tape Tape system – key optimisation:
per stream speed
High throughput/high latency
Largest physics data repository
worldwide: 200 PB / 500 M files
8 Dec 2016 [email protected]
4
LHC Raw Data Recording11 PB in July
Total LHC Data : 160 PB
Tape technology for data repositories: TCO
media
power
density
Reliability/resilience
4 Oracle SL8500 libraries: 40k slots
3 IBM TS3500 libraries: 26k slots
104 drives; 8 & 10 TB tapes Tape stores at all Tier 1 sites

Disk pools – extreme performance Designed for very high performance open/read; low
latency In-memory namespace
Highly scalable
Open source
JBOD commodity hardware Ignore failed disks
Use replication and erasure coding for reliability and performance Geo-localisation (distributed Data Centre)
Tunable QoS Choose level of reliability/cost/performance
Many protocols supported
Strong security (Kerberos, X509)
Fine grained access control, quotas
8 Dec 2016 [email protected]
5

Data distribution – file transferReliability/performance are the key
Open source low level data mover “Move file F from A to B”
Highly scalable >80 PB per month
1 million files per day
Adaptive optimisation of storage and network
Supports GridFTP, HTTP, S3, [SRM, xrootd, ...]
8 Dec 2016 [email protected]
6
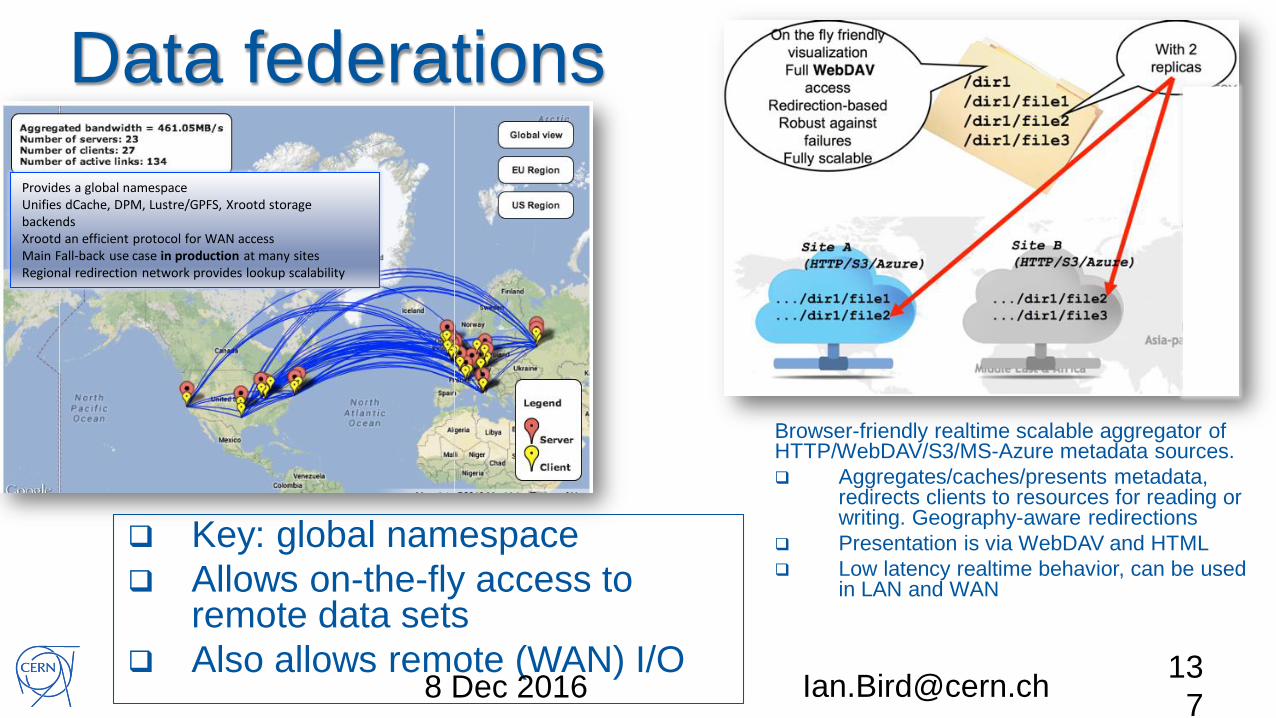
Data federations
Key: global namespace
Allows on-the-fly access to remote data sets
Also allows remote (WAN) I/O8 Dec 2016 [email protected]
13
7
Provides a global namespaceUnifies dCache, DPM, Lustre/GPFS, Xrootd storage backendsXrootd an efficient protocol for WAN accessMain Fall-back use case in production at many sitesRegional redirection network provides lookup scalability
Browser-friendly realtime scalable aggregator of HTTP/WebDAV/S3/MS-Azure metadata sources.
Aggregates/caches/presents metadata, redirects clients to resources for reading or writing. Geography-aware redirections
Presentation is via WebDAV and HTML
Low latency realtime behavior, can be used in LAN and WAN

13
8
Storage federation – R&Daka “exploring the 300 ms region”…
ASGC
AARNET
CERN
AARNET, ASGC and CERN collaboration 8 Dec 2016 [email protected]

CERNBox CERNBox provides a cloud synchronisation service
Synchronise files (data at CERN) and offline data access
Easy way to share with other users
All major platforms supported
Based on ownCloud integrated with EOS
• Available for all CERN users (1TB/user initial quota)
Much more than a Dropbox™ replacement!
13
98 Dec 2016 [email protected]

Hadoop and Analytics Hadoop Production Service
New scalable data services Scalable databases
Hadoop ecosystem
Time Series databases
Big Data Analytics
Activities and objectives Develop projects and services with/for users
Support of Hadoop Components
Further value of Analytics solutions
Define scalable platform evolution based on requirements
142
8 Dec 2016 [email protected]

Future Challenges
Raw data volume for LHC increases
exponentially and with it processing
and analysis load
Technology at ~20%/year will bring
x6-10 in 10-11 years
Estimates of resource needs at HL-
LHC x10 above what is realistic to
expect from technology with
reasonably constant costP
B
First run LS1 Second run LS2 Third run LS3 HL-LHC
…
FCC?
2009 2013 2014 2015 2016 2017 201820112010 2012 2019 2023 2024 2030?20212020 2022 …
0
100
200
300
400
500
600
700
800
900
1000
Raw Derived
Dataestimatesfor1styearofHL-LHC(PB)
ALICE ATLAS CMS LHCb
0
50000
100000
150000
200000
250000
CPU(HS06)
CPUNeedsfor1stYearofHL-LHC(kHS06)
ALICE ATLAS CMS LHCb
2025
CPU:• x60 from 2016
Data:• Raw 2016: 50 PB 2027: 600 PB
• Derived (1 copy): 2016: 80 PB 2027: 900 PB
8 Dec 2016 [email protected]
4
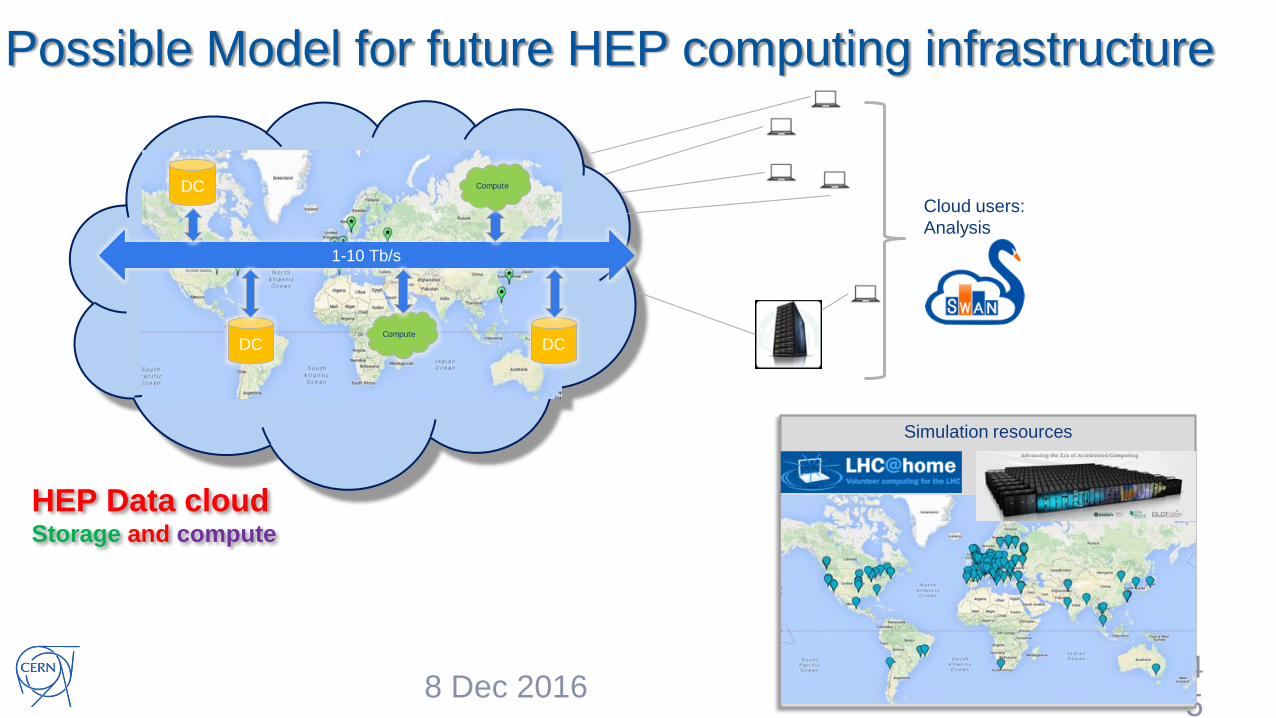
HEP Data cloudStorage and compute
1-10 Tb/s
DC
DC DCCompute
Compute
Cloud users:
Analysis
8 Dec 2016 [email protected]
5
Possible Model for future HEP computing infrastructure
Simulation resources


#scotdata
Questions & Discussion

Our next events
#digiscot

Our next events
#scotsecure

#scotdata
Drinks & Networking Upstairs

154 Copyright 2016 FUJITSU
Smart Cities, Big Data
Michael Mooney
Smart Cities Advisor, Fujitsu
Vasilis Kapsalis
Converged Infrastructure EMEIA, NetApp

155 Copyright 2016 FUJITSU
Overview
Overview of Smart City Projects: Examples of the types of Smart
Cities projects currently rolling out in the UK, Europe and Japan
Big Data Demands from Smart Cities: Are there unique challenges
coming out of IoT and Smart Cities Projects?
DM

156 Copyright 2016 FUJITSU
Definitions of a Smart City
British Standards Institute: A city is smart when it displays effective
integration of physical, digital and human systems in the built environment
to deliver a sustainable, prosperous and inclusive future for its citizens.
DM

157 Copyright 2016 FUJITSU
Definitions of a Smart City
BSI: A city is smart when it displays effective integration of physical, digital and human systems in the built environment to
deliver a sustainable, prosperous and inclusive future for its citizens.
Japanese Smart Community Alliance : “A smart community is a community
where various next-generation technologies and advanced social systems are
effectively integrated and utilized, including the efficient use of energy, utilization of
heat and unused energy sources, improvement of local transportation systems and
transformation of the everyday lives of citizens.”
DM

158 Copyright 2016 FUJITSU
Definitions of a Smart City
BSI: A city is smart when it displays effective integration of physical, digital and human systems in the built
environment to deliver a sustainable, prosperous and inclusive future for its citizens.
Japanese Smart Community Alliance : “A smart community is a community where various next-generation
technologies and advanced social systems are effectively integrated and utilized, including the efficient use
of energy, utilization of heat and unused energy sources, improvement of local transportation systems and
transformation of the everyday lives of citizens.”
International Standards Organisation: A ‘Smart City’ is one that……
dramatically increases the pace at which it improves its social economic and
environmental (sustainability) outcomes, responding to challenges such as climate
change, rapid population growth, and political and economic instability …… by
fundamentally improving how it engages society, how it applies collaborative
leadership methods, how it works across disciplines and city systems, and how it
uses data information and modern technologies……in order to provide better
services and quality of life to those in and involved with the city now and for the
foreseeable future, without unfair disadvantage of others or degradation of the
natural environmentDM

159 Copyright 2016 FUJITSU
Definitions of a Smart City
BSI: A city is smart when it displays effective integration of physical, digital and human systems in the built environment to
deliver a sustainable, prosperous and inclusive future for its citizens.
ISO: A ‘Smart City’ is one that…… dramatically increases the pace at which it improves its social economic and
environmental (sustainability) outcomes, responding to challenges such as climate change, rapid population growth, and
political and economic instability …… by fundamentally improving how it engages society, how it applies collaborative
leadership methods, how it works across disciplines and city systems, and how it uses data information and modern
technologies……in order to provide better services and quality of life to those in and involved with the city now and for the
foreseeable future, without unfair disadvantage of others or degradation of the natural environment
Japanese Smart Community Alliance : “A smart community is a community where various next-generation technologies
and advanced social systems are effectively integrated and utilized, including the efficient use of energy, utilization of heat
and unused energy sources, improvement of local transportation systems and transformation of the everyday lives of
citizens.”
Smart Cities are easier to live in.
DM

160 Copyright 2016 FUJITSU
Smart City –Plan for Kerala
DM

161 Copyright 2016 FUJITSU
Not So Smart City
DM

162 Copyright 2016 FUJITSU
Smart City Projects– Data Generators
DM-MM

163 Copyright 2016 FUJITSU
Smart Transport (Mobility as a Service)

164 Copyright 2016 FUJITSU
Smart Parking - Advanced Image Analytics

165 Copyright 2016 FUJITSU
Assisted Living

166 Copyright 2016 FUJITSU
Digital Living

167 Copyright 2016 FUJITSU
Challenges in adopting IoT
Technology
Protocols – standard are emerging, but are they appropriate for your use
case?
Choice of wireless technology, range, interference
Security – zero day and DDoS
Battery life.
Business / commercial
Managing coopetition successfully.
Integration of Operational Technology and traditional IT.
Supportability and maintenance e.g. bespoke sensors from startup firms.© 2016 NetApp, Inc. All rights reserved. ---
NETAPP CONFIDENTIAL ---
1
6
7

168 Copyright 2016 FUJITSU
Predictions for IoT and Smart Cities
IoT will eclipse the corporate datacenter and other IT markets
© 2016 NetApp, Inc. All rights reserved. ---
NETAPP CONFIDENTIAL ---
1
6
8*IDC Directions 2016 Data management across your entire data infrastructure is the key to unlocking value from connected devices.
20B
Devices
1.46Trillion
loT Spend
2020 WW
Spending
Share
512
Zetabytes
of Data
169 Copyright 2016 FUJITSU
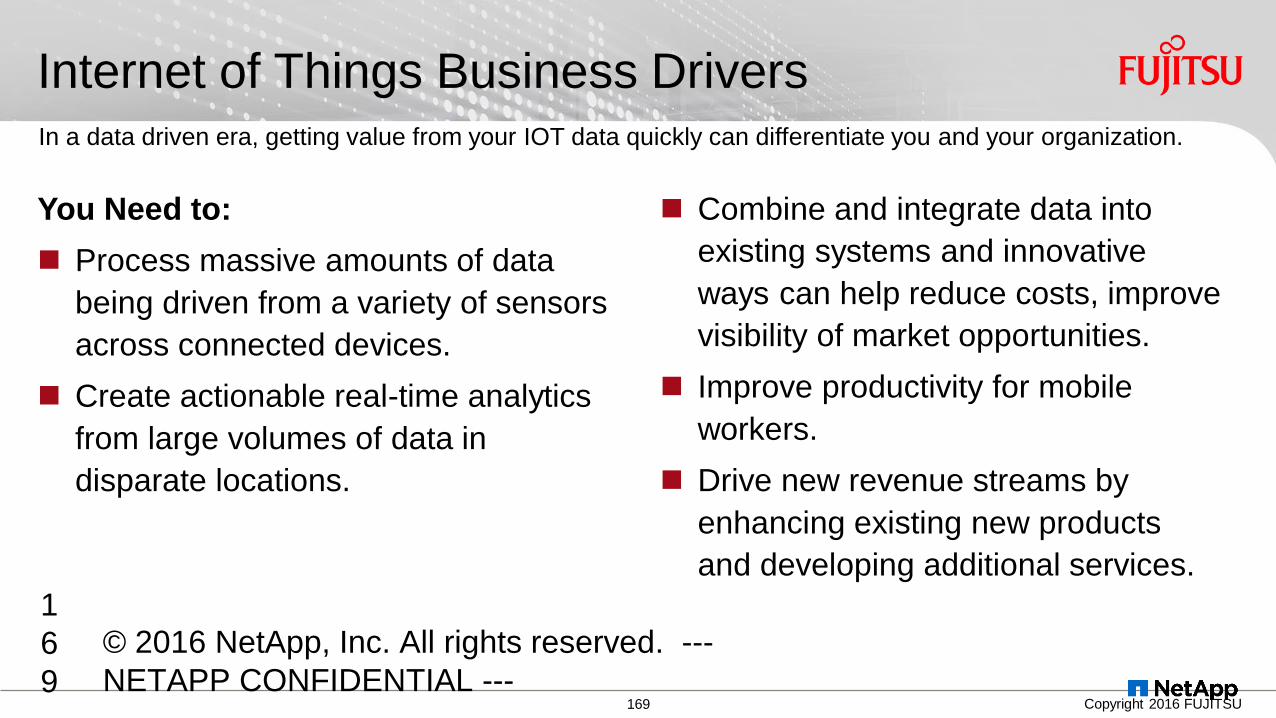
You Need to:
Process massive amounts of data
being driven from a variety of sensors
across connected devices.
Create actionable real-time analytics
from large volumes of data in
disparate locations.
Internet of Things Business Drivers
Combine and integrate data into
existing systems and innovative
ways can help reduce costs, improve
visibility of market opportunities.
Improve productivity for mobile
workers.
Drive new revenue streams by
enhancing existing new products
and developing additional services.
In a data driven era, getting value from your IOT data quickly can differentiate you and your organization.
© 2016 NetApp, Inc. All rights reserved. ---
NETAPP CONFIDENTIAL ---
1
6
9

170 Copyright 2016 FUJITSU
The need for a Data Fabric
A Data Fabric lets you manage and secure information from connected
devices across flash, disk and cloud. It helps you process large volumes of
data from a variety of IoT sources with the visibility and performance you need
to respond quickly. In addition, NetApp’s global ecosystem of partners helps
you build a compliant IoT platform that connects and automates resources in
the data center, near the cloud and in the cloud.
© 2016 NetApp, Inc. All rights reserved. ---
NETAPP CONFIDENTIAL ---
Data management across the entire hybrid cloud is the key to unlocking
value from connected devices

171 Copyright 2016 FUJITSU
Deriving Value from IoT Data in the Data-Driven Digital Era
A Data Fabric that unlocks the value from connected devices across the entire data infrastructure.
© 2016 NetApp, Inc. All rights reserved. ---
NETAPP CONFIDENTIAL ---
1
7
1
Choose from a global ecosystem of
NetApp partners who help you build a
compliant IoT platform
Process large volumes of data from a
variety of sources with high levels of
visibility and performance
Manage and secure data from
connected devices across flash, disk
and cloud
LUN Single

172 Copyright 2016 FUJITSU
StorageGridNetApp Vertical IoT
ISV Integration
IoT Data Aggregators and Cleansers
IoT Sensors and Data Generators
S-DOTFlexPod Express
Edge SensorVM
Edge SensorVM
Edge SensorVM
FlexPod
Managed Edge Cloud
FlexPod Express
HyperScaler Cloud with CloudOnTap
Cloud Service Providers with
ONTAP
Private Cloud
with ONTAP
IoT Platforms, Big Data Analytics And Predictors + archive
Wireless Devices
Edge SensorVM
Edge SensorVM
Edge SensorVM
Controllers – Near and Real Time
Customer owned products
Enterprise Apps/DB
IoT Framework and Ecosystem

173 Copyright 2016 FUJITSU
Example - Ecosystem of IoT Partners
1
7
3
HyperscalersService Providers
Technology Partners

174 Copyright 2016 FUJITSU
Business Challenge
Understand and predict the behavior of customers’
storage environments, while maintaining high
availability and performance.
Solution
The AutoSupport Ecosystem uses NetApp’s IoT
platform to always connect to our customers’ devices
and provide ongoing analytics.
Benefits
80% fewer P1 cases reduces downtime
60% faster issue resolution minimizes disruptions
80% of AutoSupport cases closed automatically
to improve self-service efficiency
NetApp AutoSupport – Making It Work
“We use AutoSupport Analytics to measure
critical quality programs against preventative risk
and critical quality metrics. This data provides a
feedback loop that allows us
to continually improve our systems.”
Marty Mayer, Director for AutoSupport, NetApp
© 2016 NetApp, Inc. All rights reserved. ---
NETAPP CONFIDENTIAL ---
1
7
4

175 Copyright 2016 FUJITSU
Smart Cities, Big Data
Any
Questions?

Transforming Enterprise BI from a
Possibility into a Promise
Will Boyle


An automatic system
developed to disseminate
information to the various sections
of any industrial, scientific, or
government organisation.
Hans Peter Luhn, IBM Researcher
1958


Concepts and
methods to improve business
decision making by using
fact-based systems.Howard Dresner, future Gartner Analyst
1989

1995-2005

2007


2010-2015


Average number of BI tools by company size
Source: TDWI Research


To deliver the original promise,
multiple platforms need a
consolidated view and a
single version of the truth.
BI, has a BI problem.


Attempt to standardise
under one tool
Option #1

Many organisations are looking to pursue
standardisation
Source: TDWI Research
A third of organisations plan to
standardise on a single BI tool within two
years

But standardisation comes with many
challenges
Source: TDWI Research
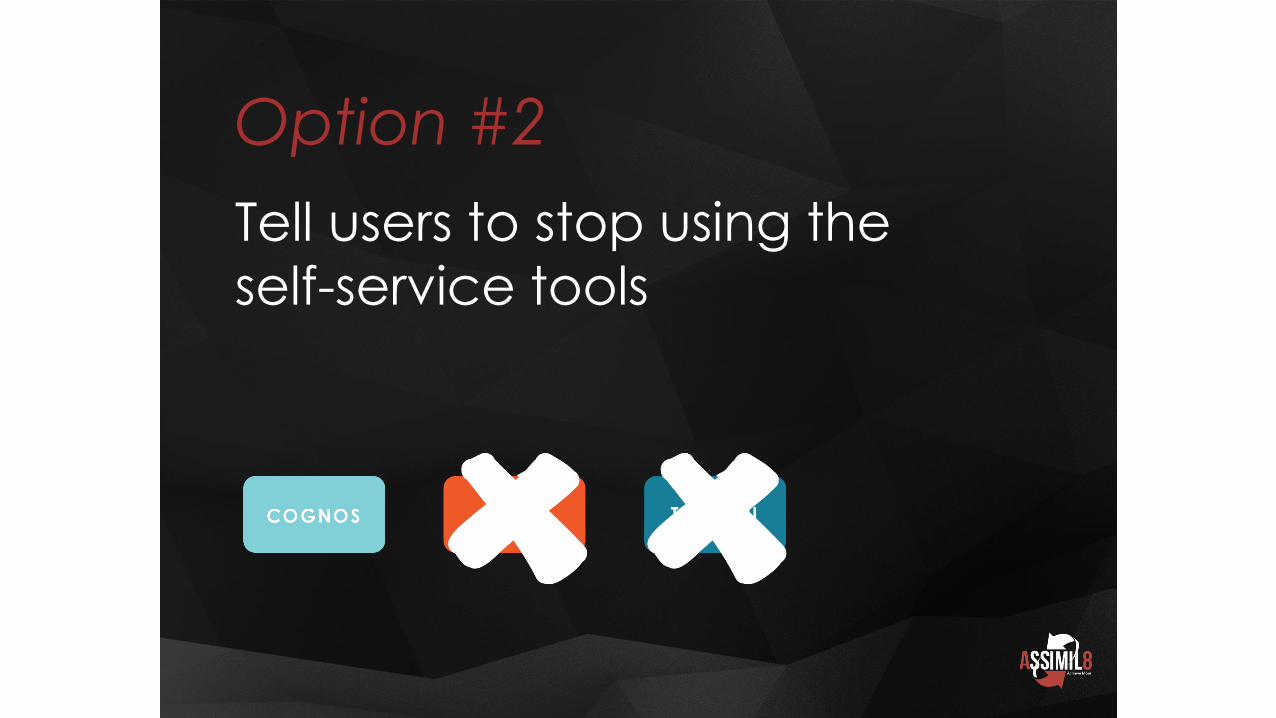
Tell users to stop using the
self-service tools
Option #2

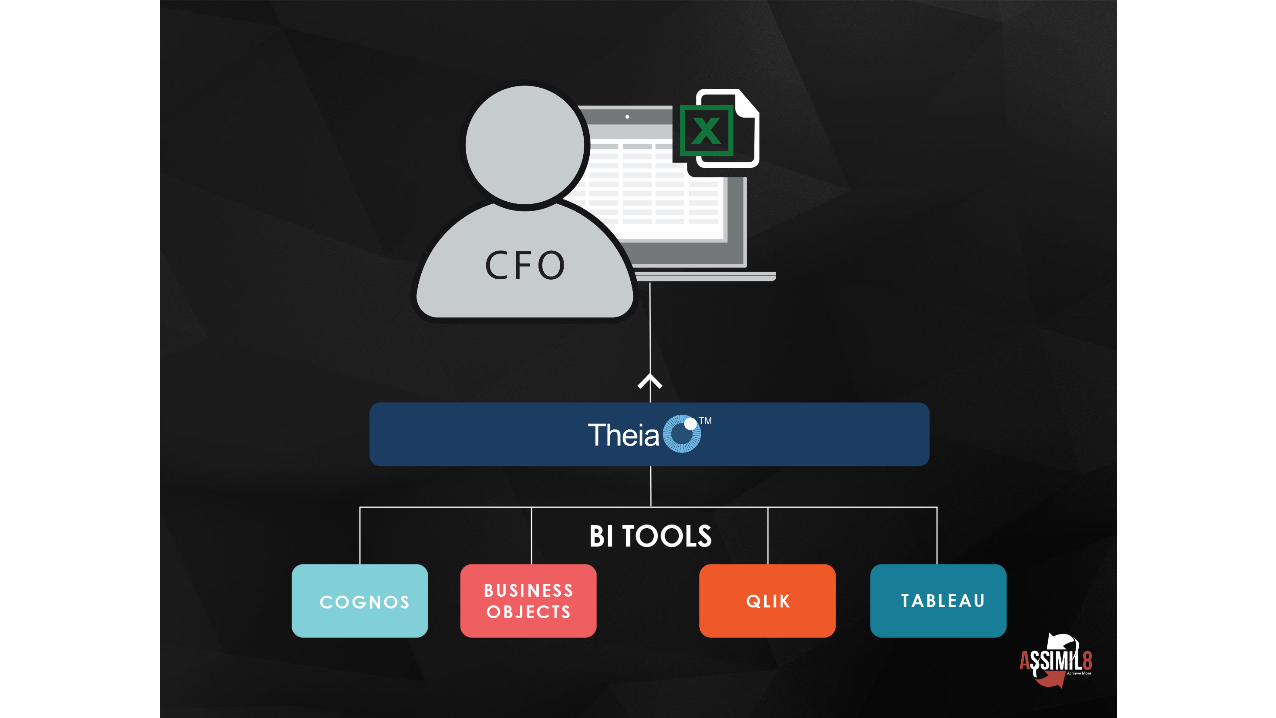
Give users the freedom and
flexibility to work the way
they want
Option #3

x4


• Radically reduce the risk and
expense of standardising a
business intelligence estate
• Future-proof technology and
information for changes in
direction, leadership or from
mergers and acquisitions
• Gets the security, controls
and scalability they require
• No longer needs to learn
multiple BI systems or hunt for
information across them
• Able to make joined-up,
strategic decisions based on
one version of the truth across
the entire organisation
• Free to keep using the tool
that they know and love
IT USERS


Thank you