Embed Size (px)
Citation preview
BI in the Digital Era
How to do Data Science & Big Data Analytics
Maloy MANNA linkedin.com/in/maloy biguru.wordpress.com
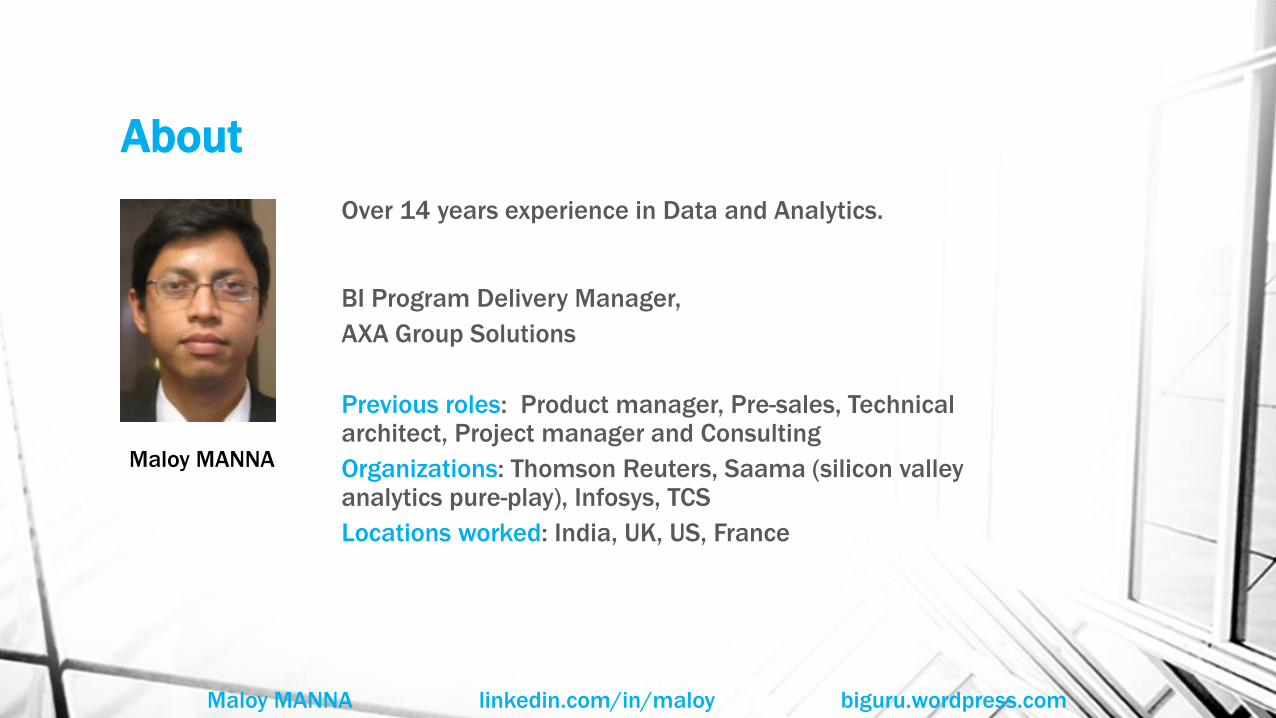
About
Over 14 years experience in Data and Analytics.
BI Program Delivery Manager,
AXA Group Solutions
Previous roles: Product manager, Pre-sales, Technical architect, Project manager and Consulting
Organizations: Thomson Reuters, Saama (silicon valley analytics pure-play), Infosys, TCS
Locations worked: India, UK, US, France
Maloy MANNA linkedin.com/in/maloy biguru.wordpress.com
Maloy MANNA
Introduction
The future is digital.
The digital revolution is changing the way we do business and live our lives. With increasing adoption of social media, smartphones, cloud computing and technological advancements in data storage and processing, the age of big data is upon us.
In the digital era it is no more sufficient to have look-back reports and graphs when the competition is deriving insights from big data. It is time to test and learn new strategies and learn new skills of data science and big data analytics.
In this webinar we'll look at the rapid changes in the way we do analytics and go beyond the hype to learn about practical approaches and tools you will need to do data science.
Maloy MANNA linkedin.com/in/maloy biguru.wordpress.com
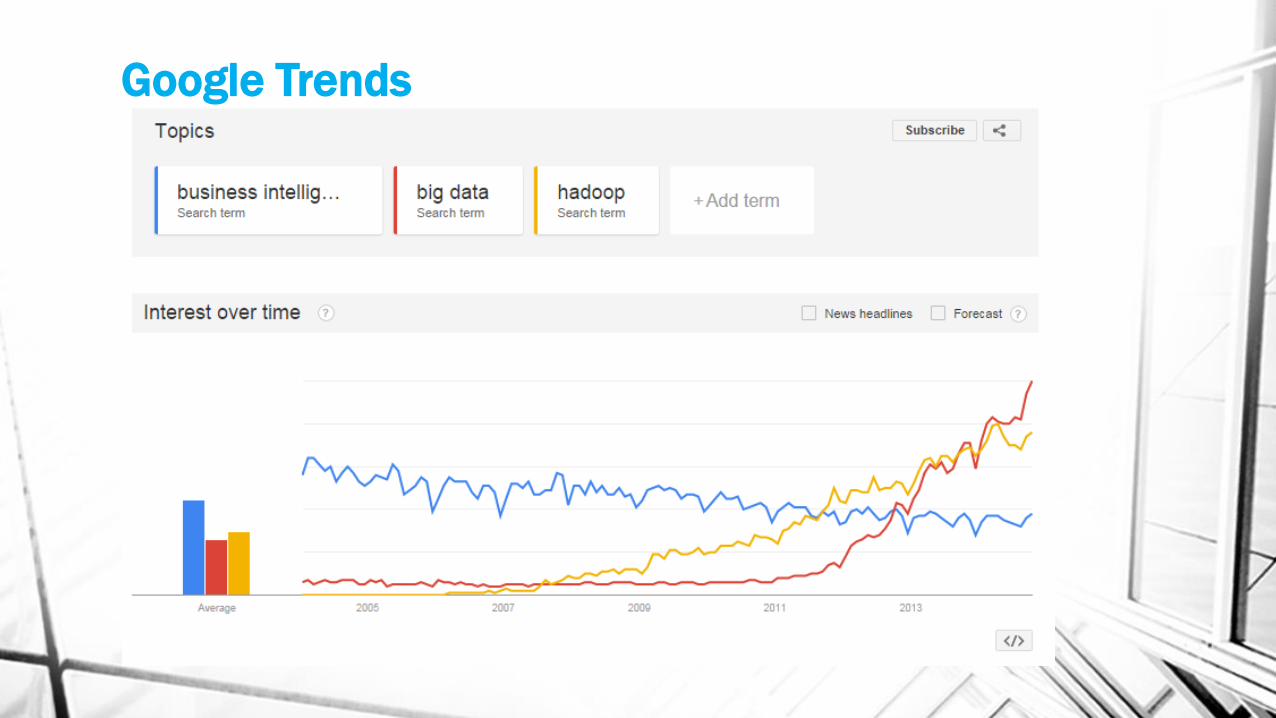
Google Trends
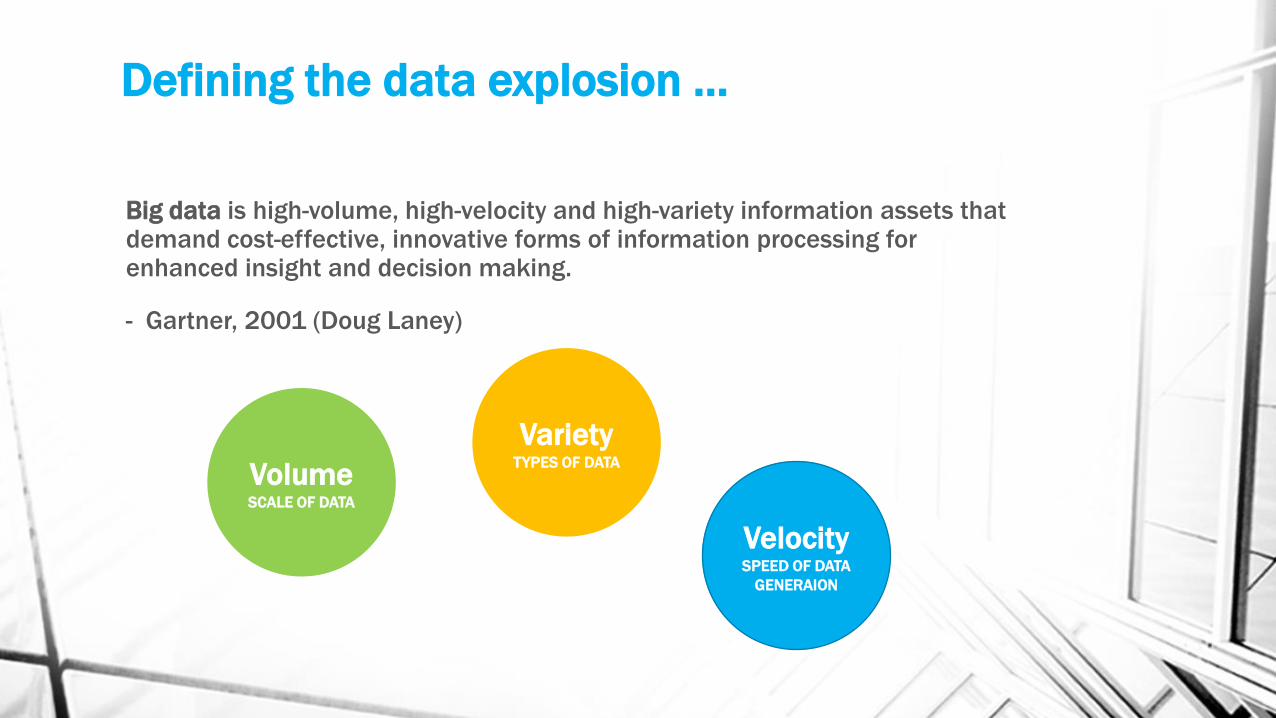
Defining the data explosion …
Big data is high-volume, high-velocity and high-variety information assets that demand cost-effective, innovative forms of information processing for enhanced insight and decision making.
- Gartner, 2001 (Doug Laney)
Volume SCALE OF DATA
Variety TYPES OF DATA
Velocity SPEED OF DATA
GENERAION
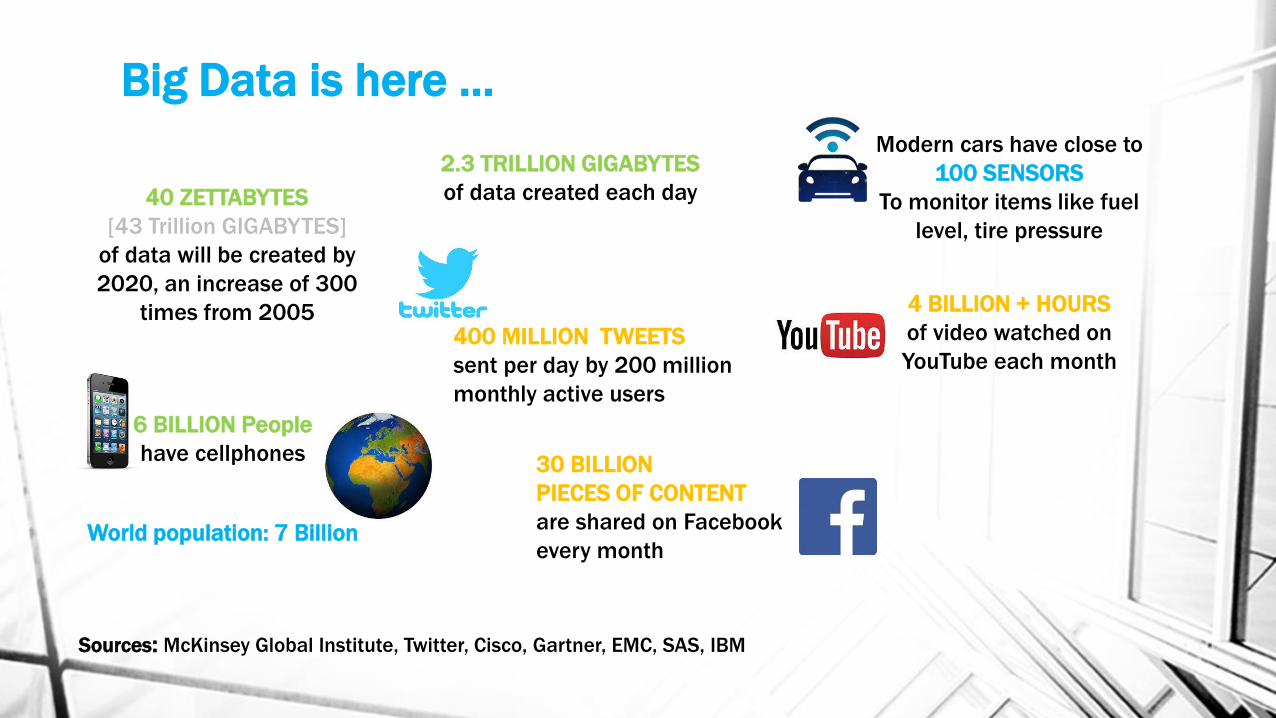
Big Data is here …
2.3 TRILLION GIGABYTES
of data created each day 40 ZETTABYTES
[43 Trillion GIGABYTES]
of data will be created by
2020, an increase of 300
times from 2005
6 BILLION People
have cellphones
World population: 7 Billion
4 BILLION + HOURS
of video watched on
YouTube each month
30 BILLION
PIECES OF CONTENT
are shared on Facebook
every month
400 MILLION TWEETS
sent per day by 200 million
monthly active users
Sources: McKinsey Global Institute, Twitter, Cisco, Gartner, EMC, SAS, IBM
Modern cars have close to
100 SENSORS
To monitor items like fuel
level, tire pressure
… and the Digital Revolution
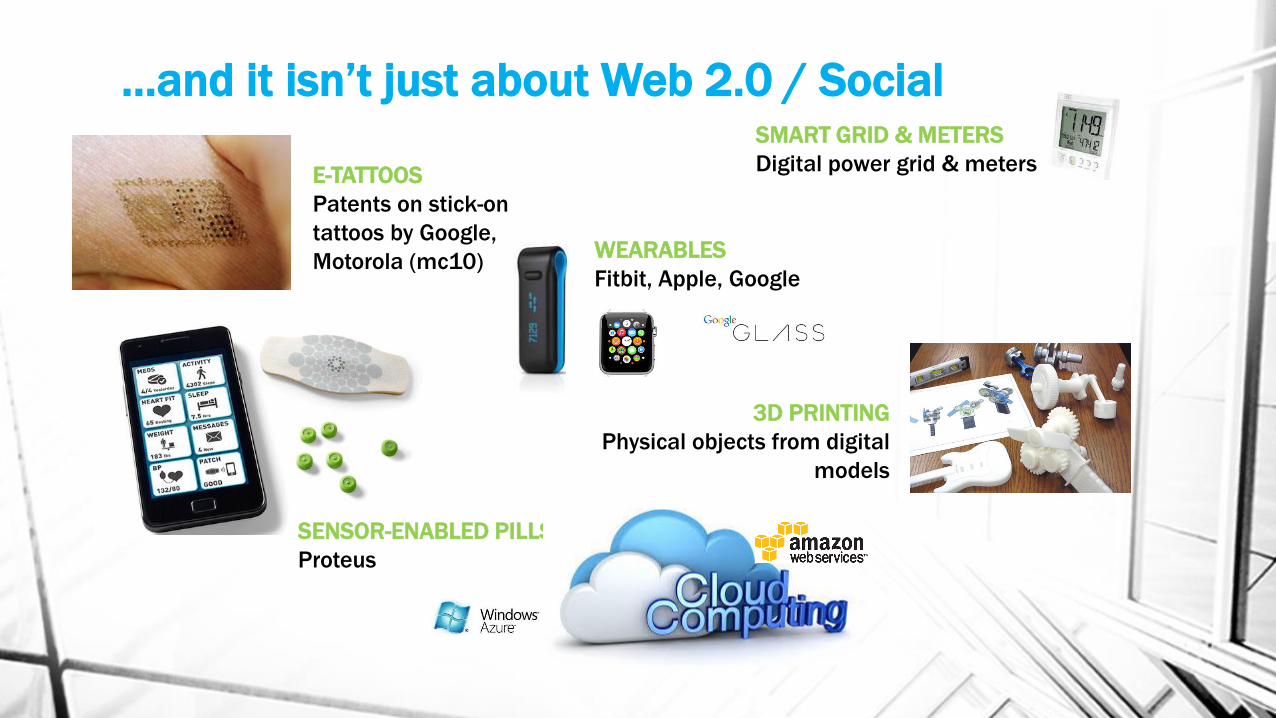
…and it isn’t just about Web 2.0 / Social
E-TATTOOS
Patents on stick-on
tattoos by Google,
Motorola (mc10) WEARABLES
Fitbit, Apple, Google
SENSOR-ENABLED PILLS
Proteus
3D PRINTING
Physical objects from digital
models
SMART GRID & METERS
Digital power grid & meters
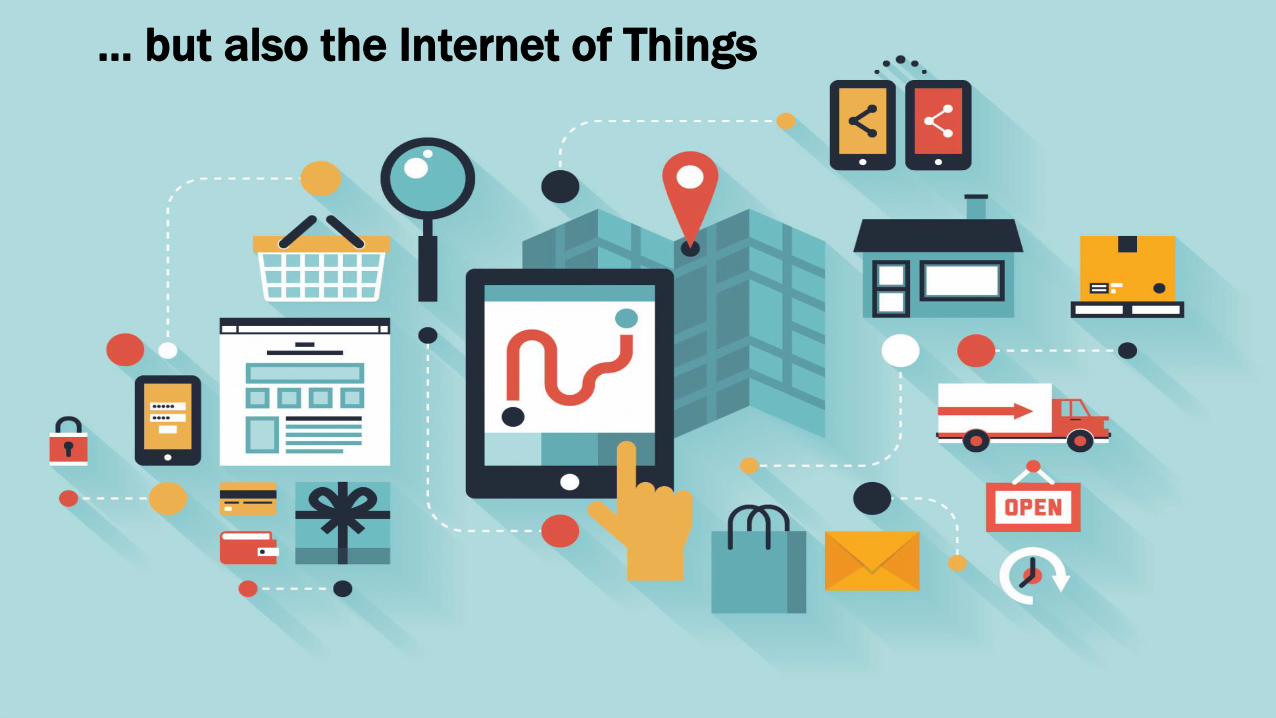
… but also the Internet of Things
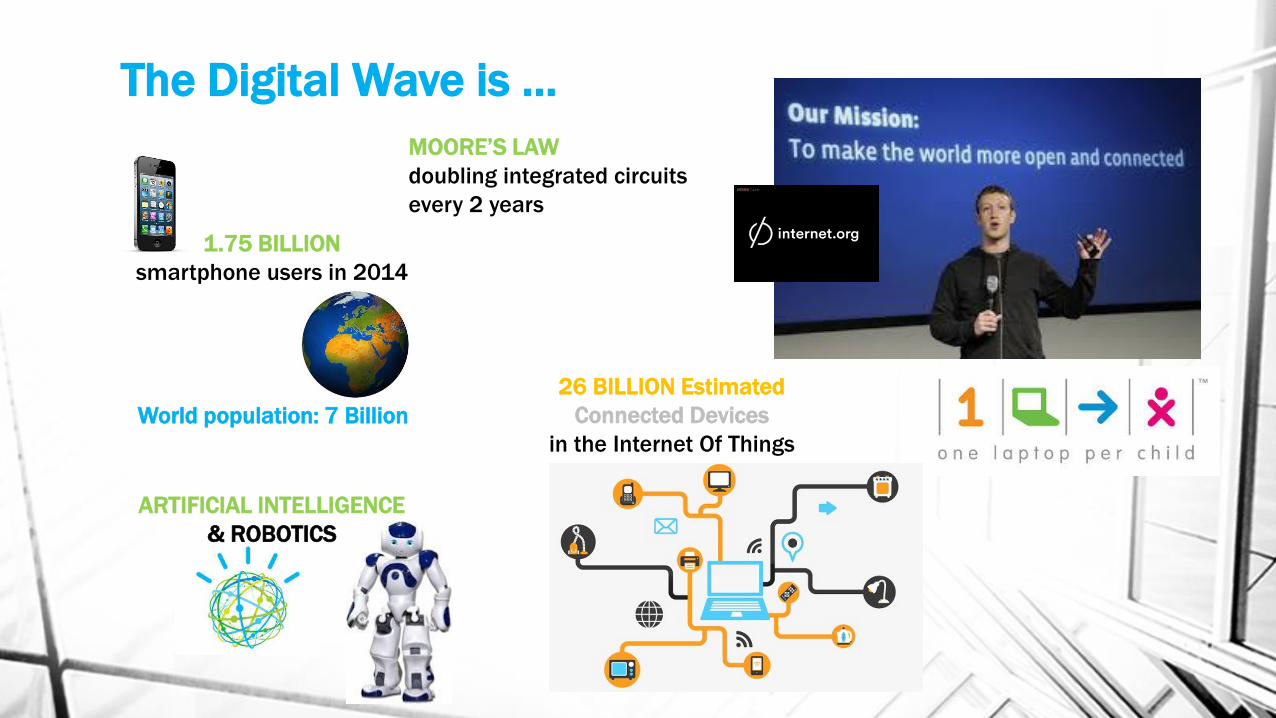
The Digital Wave is …
1.75 BILLION
smartphone users in 2014
World population: 7 Billion
MOORE’S LAW
doubling integrated circuits
every 2 years
26 BILLION Estimated
Connected Devices
in the Internet Of Things
ARTIFICIAL INTELLIGENCE
& ROBOTICS
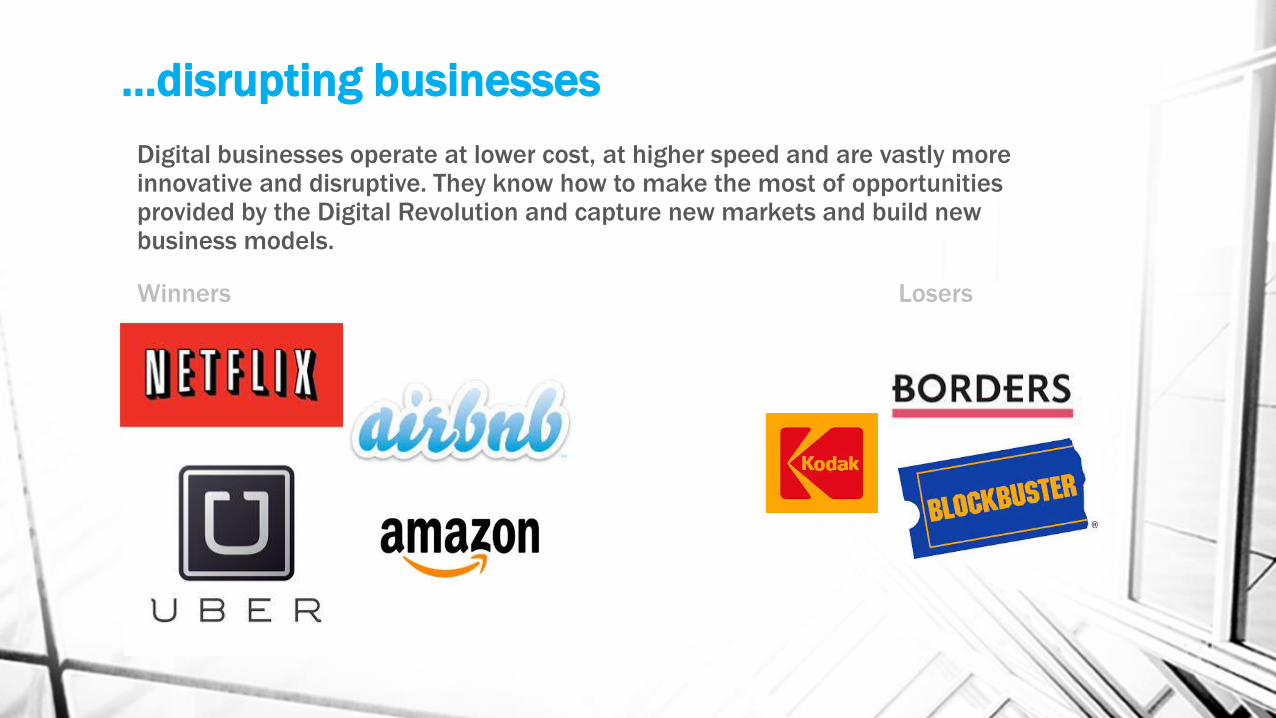
…disrupting businesses
Digital businesses operate at lower cost, at higher speed and are vastly more innovative and disruptive. They know how to make the most of opportunities provided by the Digital Revolution and capture new markets and build new business models.
Winners Losers
Expectations have changed…
Business expectations have changed.
Digital disruption is forcing business to move faster. The need for speed is the single most crucial expectation of BI from business.
Business cannot afford to wait for months while IT integrates data sources and builds ETL to get to the “single version of truth”.
Questions have evolved.
It is no longer sufficient to have look-back reports. Newer business models ask newer questions: what-if, why, experiment, anticipate and predict.
BI needs to evolve too.
Expectations have changed…
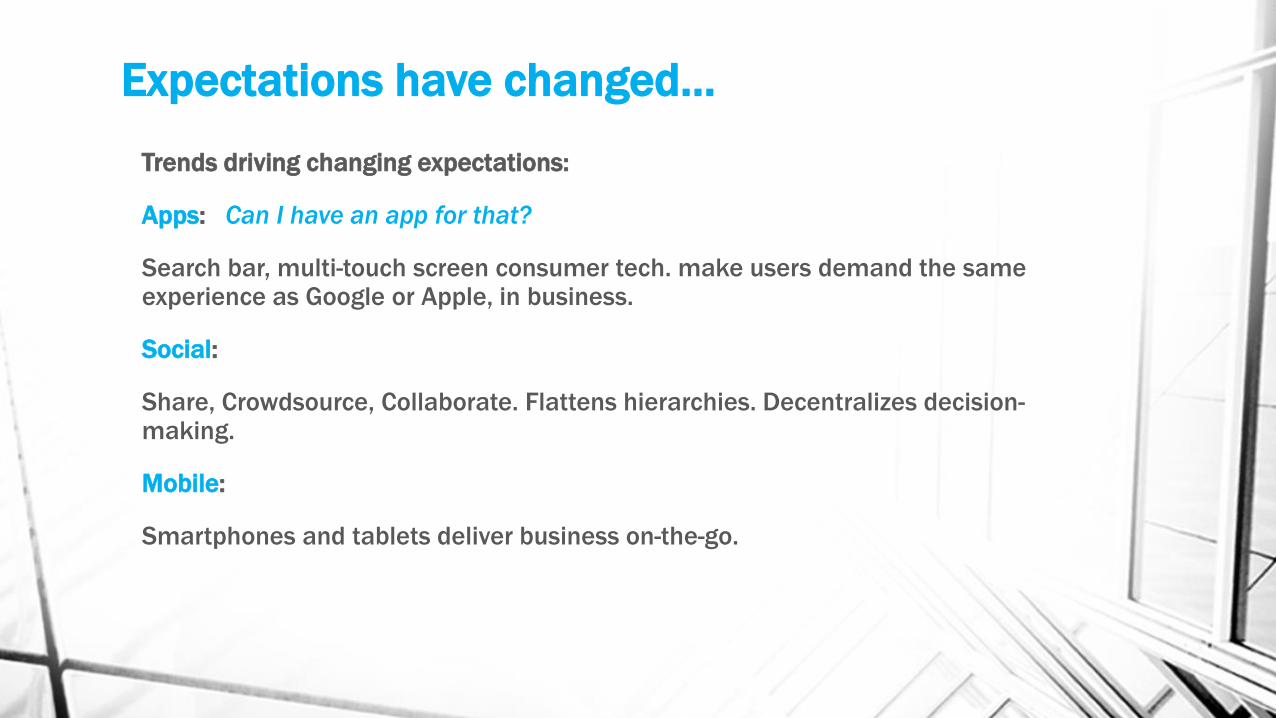
Trends driving changing expectations:
Apps: Can I have an app for that?
Search bar, multi-touch screen consumer tech. make users demand the same experience as Google or Apple, in business.
Social:
Share, Crowdsource, Collaborate. Flattens hierarchies. Decentralizes decision-making.
Mobile:
Smartphones and tablets deliver business on-the-go.
Traditional BI
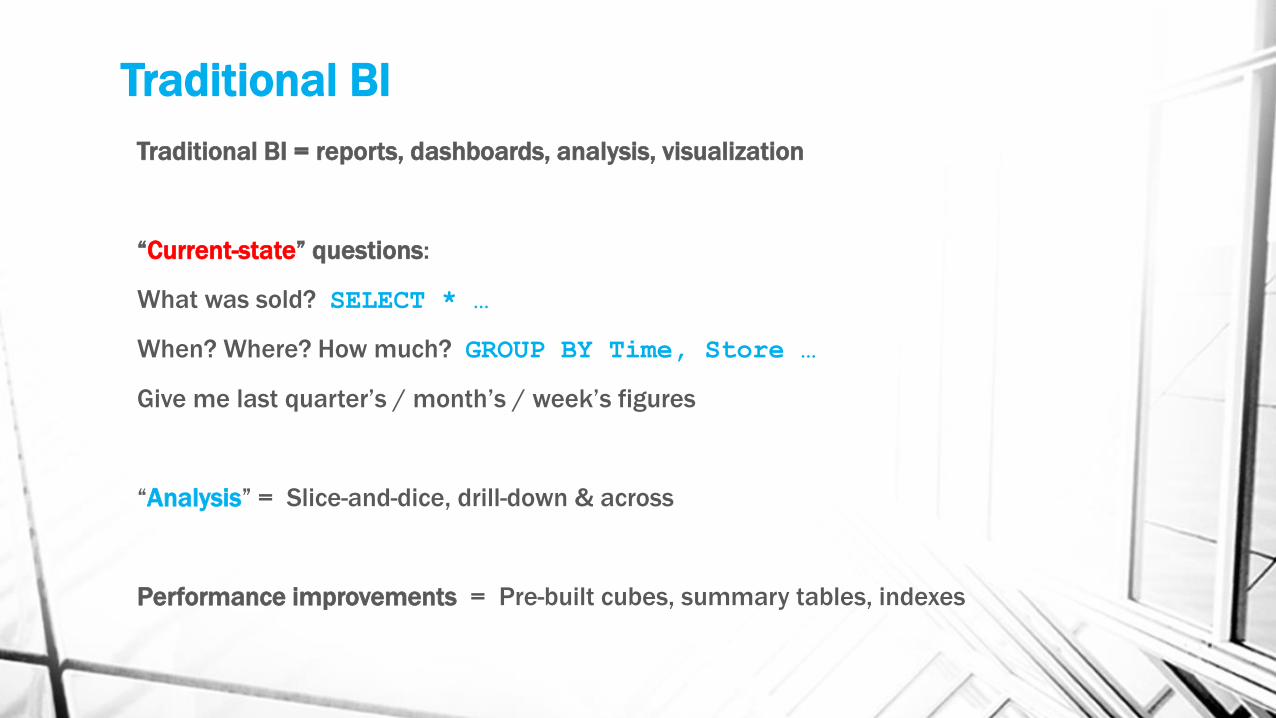
Traditional BI = reports, dashboards, analysis, visualization
“Current-state” questions:
What was sold? SELECT * …
When? Where? How much? GROUP BY Time, Store …
Give me last quarter’s / month’s / week’s figures
“Analysis” = Slice-and-dice, drill-down & across
Performance improvements = Pre-built cubes, summary tables, indexes
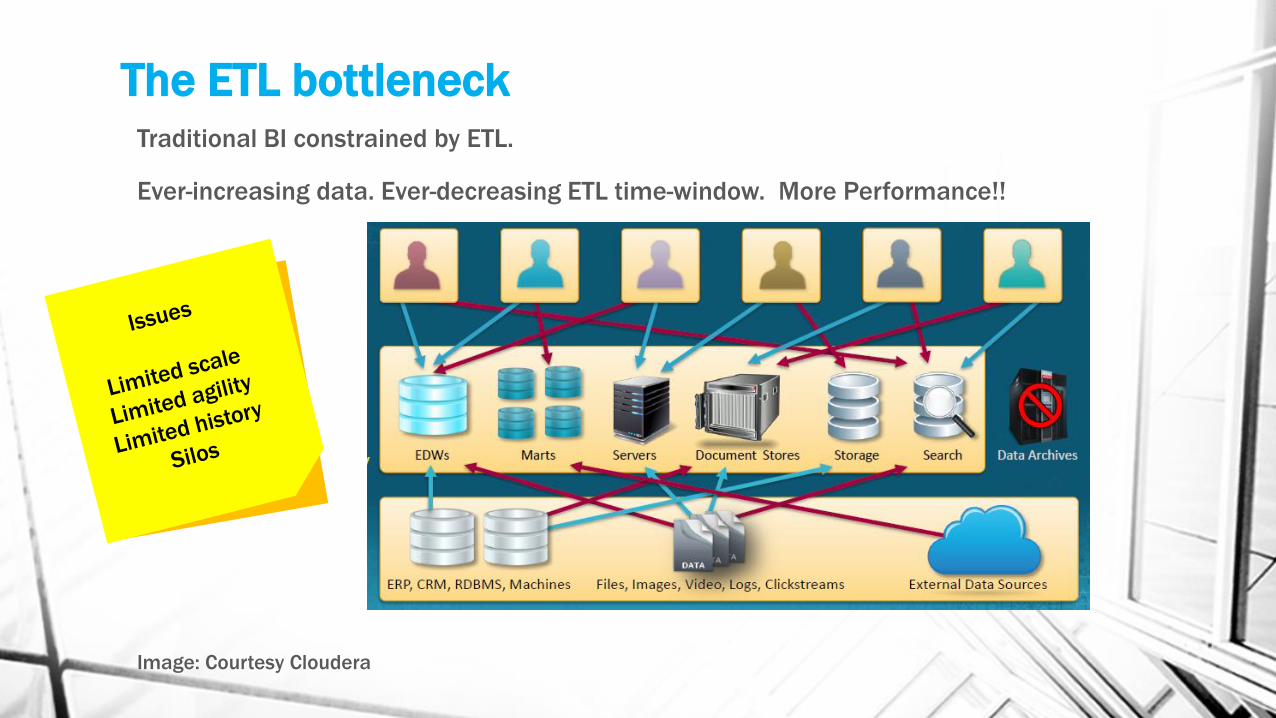
The ETL bottleneck Traditional BI constrained by ETL.
Ever-increasing data. Ever-decreasing ETL time-window. More Performance!!
Image: Courtesy Cloudera
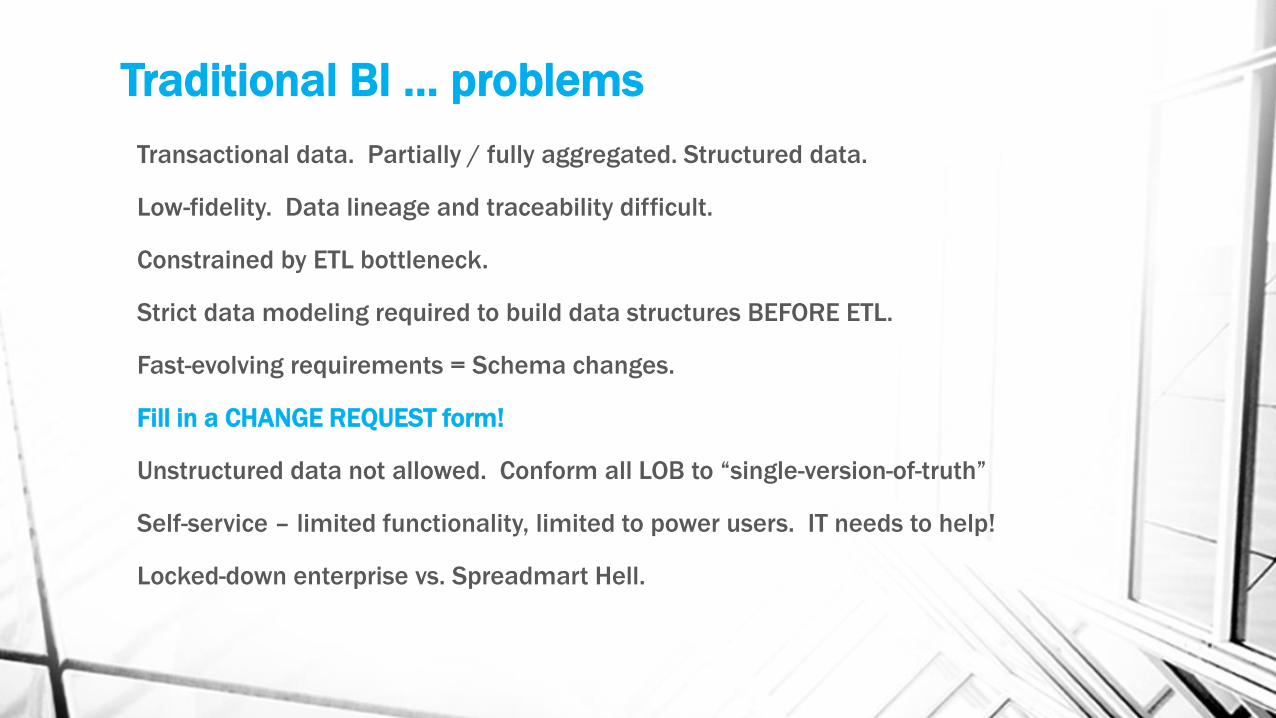
Traditional BI … problems
Transactional data. Partially / fully aggregated. Structured data.
Low-fidelity. Data lineage and traceability difficult.
Constrained by ETL bottleneck.
Strict data modeling required to build data structures BEFORE ETL.
Fast-evolving requirements = Schema changes.
Fill in a CHANGE REQUEST form!
Unstructured data not allowed. Conform all LOB to “single-version-of-truth”
Self-service – limited functionality, limited to power users. IT needs to help!
Locked-down enterprise vs. Spreadmart Hell.
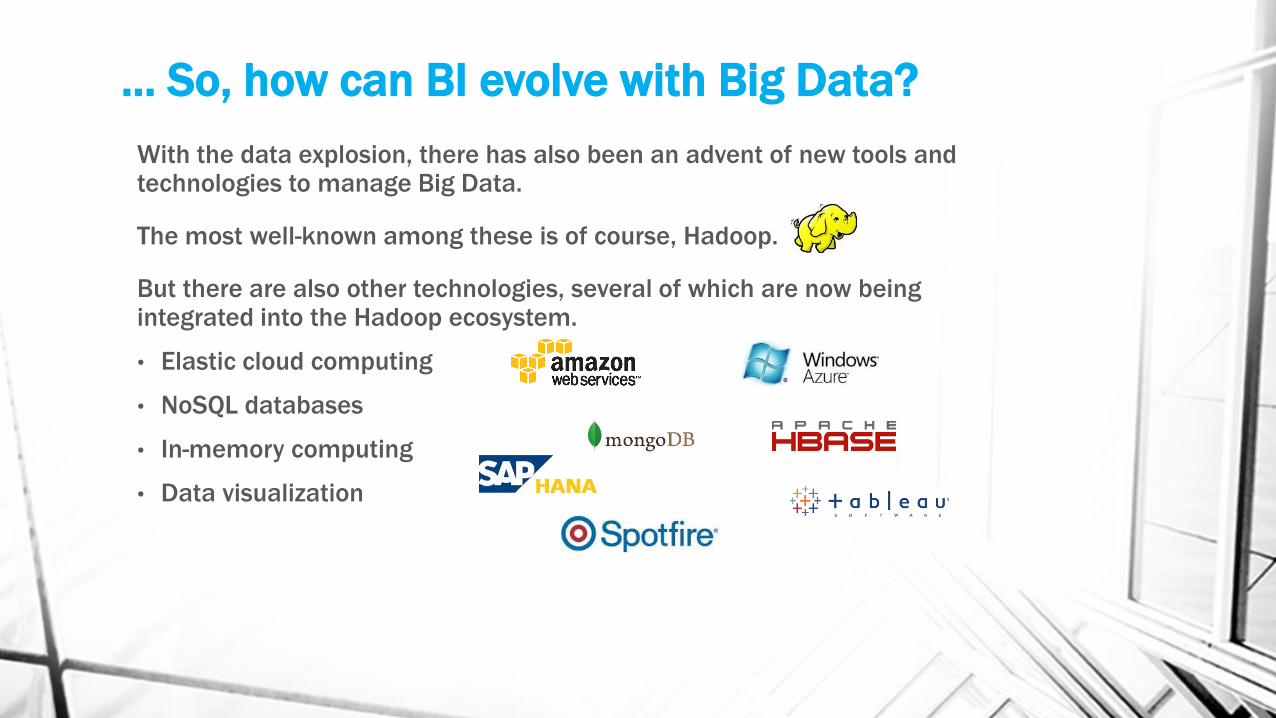
... So, how can BI evolve with Big Data?
With the data explosion, there has also been an advent of new tools and technologies to manage Big Data.
The most well-known among these is of course, Hadoop.
But there are also other technologies, several of which are now being integrated into the Hadoop ecosystem.
• Elastic cloud computing
• NoSQL databases
• In-memory computing
• Data visualization
Changing paradigm
Business expectations have changed. Questions have evolved.
Big Data = “Next State” questions
What will happen? PREDICTIVE
Why did this happen / why didn’t this happen? EXPLANATORY
What would happen if we did… HYPOTHESIS
How can we prevent …/ How to make this happen? RESPONSE
Focus shift away from transactions to sub-transactions & behaviors.
Changing paradigm
With changing business expectations BI needs to evolve.
BI in the Digital Era:
A paradigm shift from “Current state” to “Next State” questions.
Answering “Next State” questions requires a scientific approach.
Design experiments, test hypothesis, derive inference / interpret results.
This is Data Science.
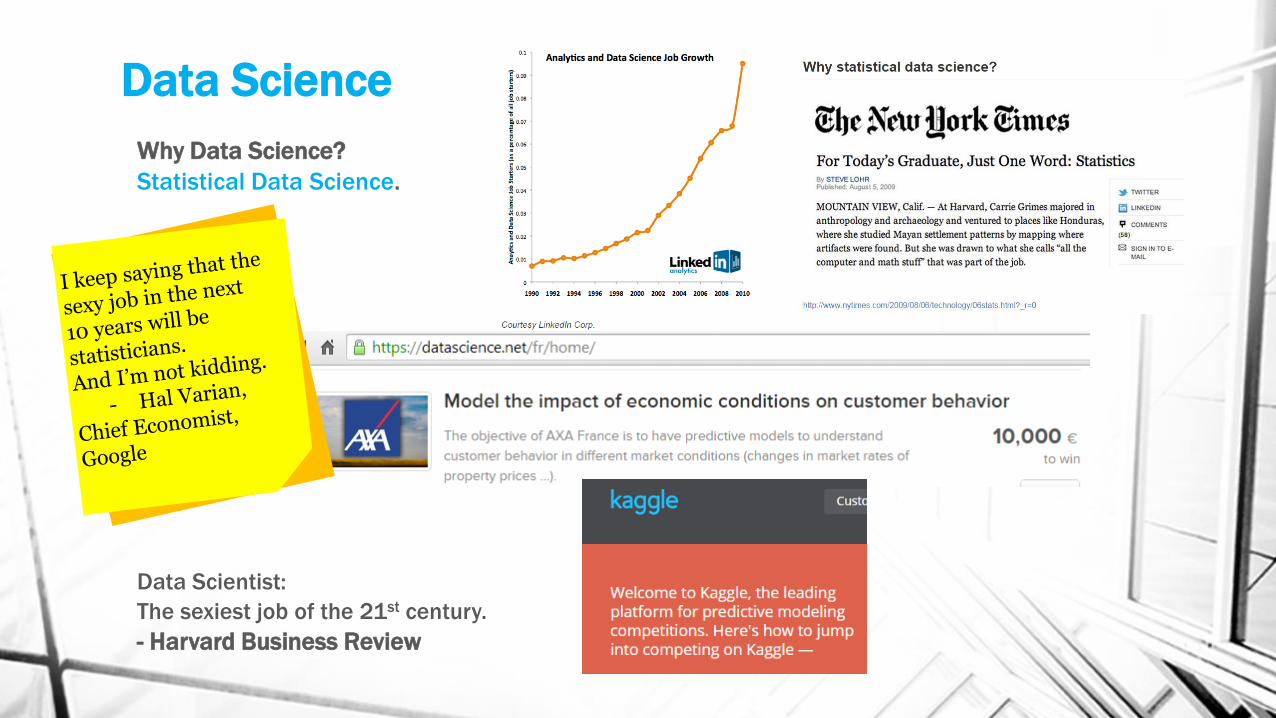
Data Science
Why Data Science?
Statistical Data Science.
Data Scientist:
The sexiest job of the 21st century.
- Harvard Business Review
Data Science
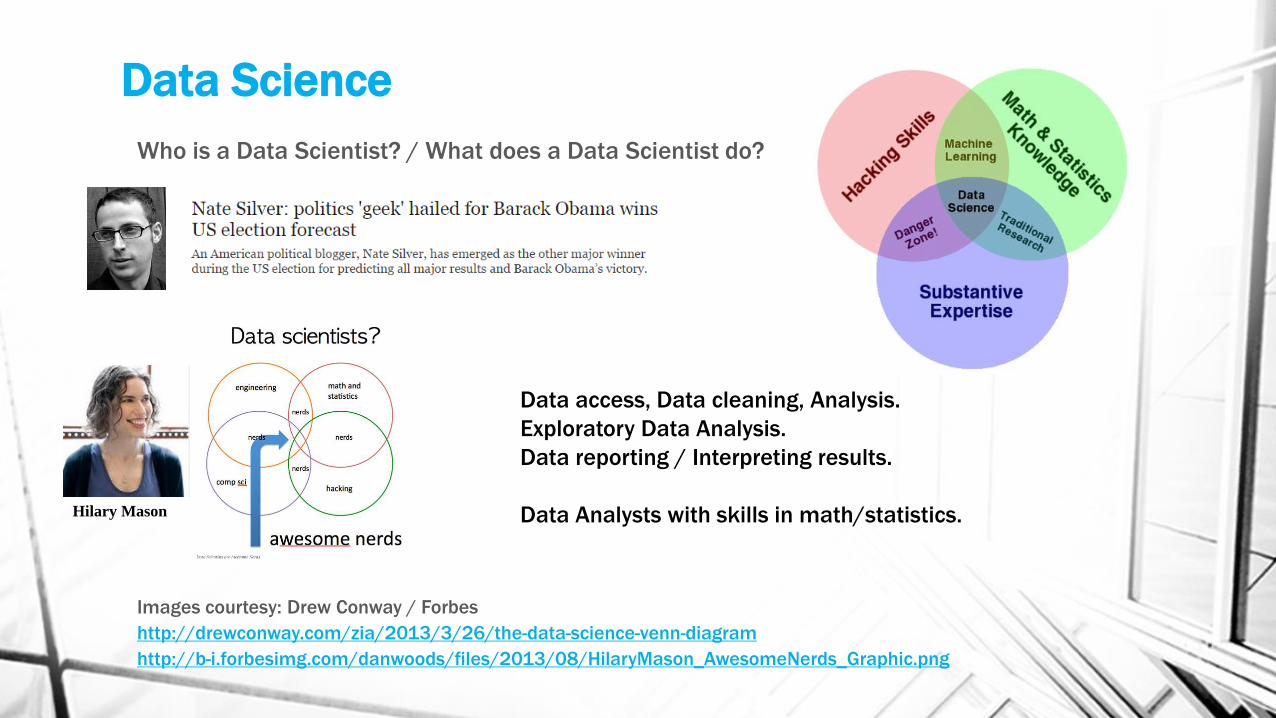
Who is a Data Scientist? / What does a Data Scientist do?
Images courtesy: Drew Conway / Forbes
http://drewconway.com/zia/2013/3/26/the-data-science-venn-diagram
http://b-i.forbesimg.com/danwoods/files/2013/08/HilaryMason_AwesomeNerds_Graphic.png
Data access, Data cleaning, Analysis.
Exploratory Data Analysis.
Data reporting / Interpreting results.
Data Analysts with skills in math/statistics. Hilary Mason
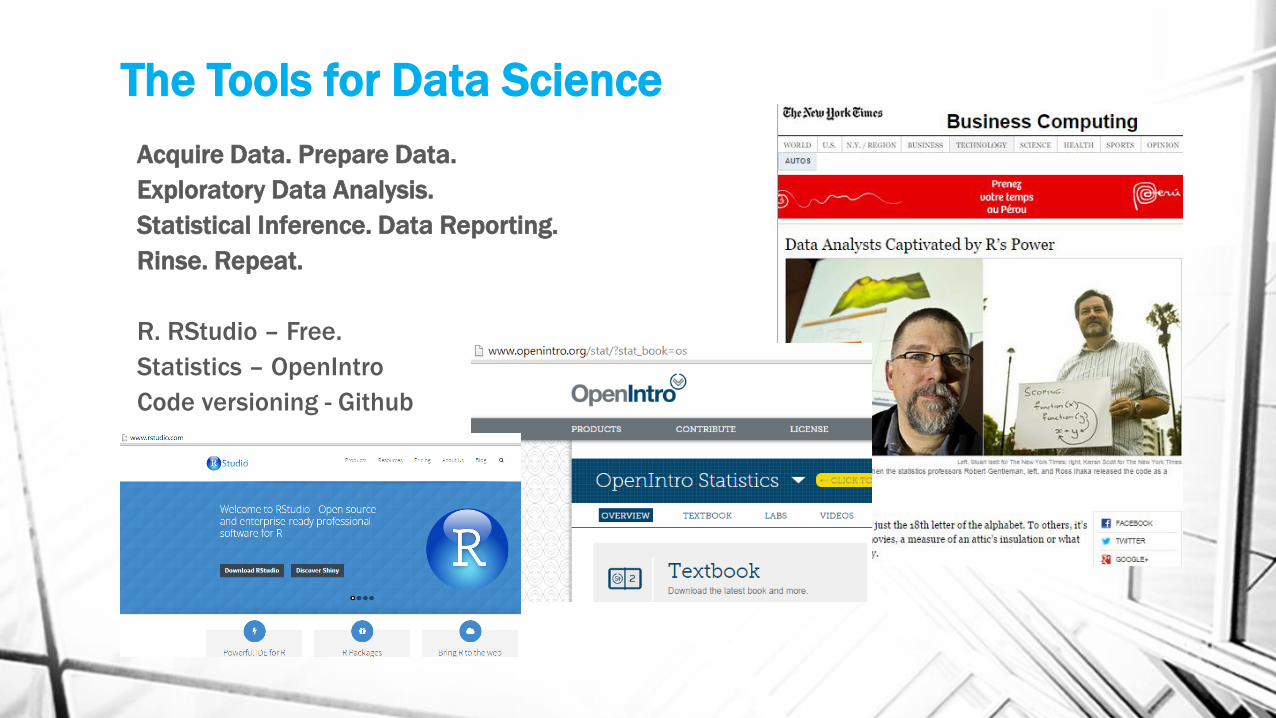
The Tools for Data Science
Acquire Data. Prepare Data.
Exploratory Data Analysis.
Statistical Inference. Data Reporting.
Rinse. Repeat.
R. RStudio – Free.
Statistics – OpenIntro
Code versioning - Github
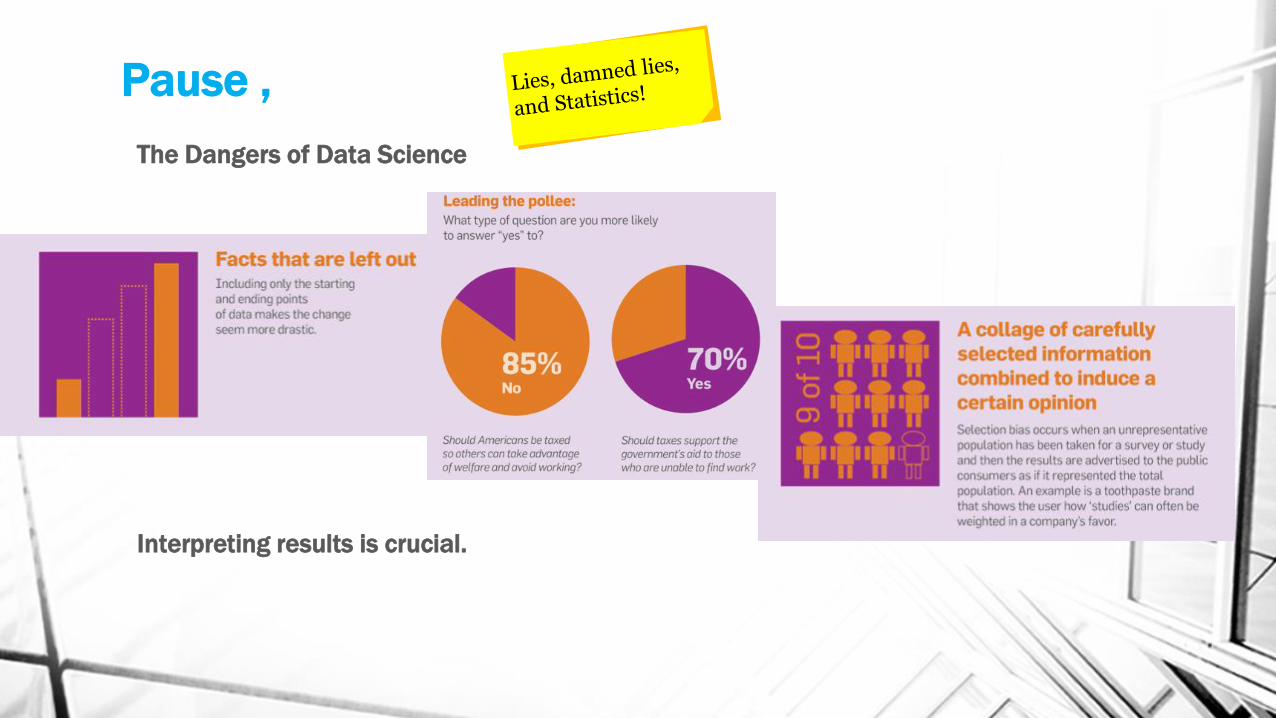
Pause ,
The Dangers of Data Science
Interpreting results is crucial.
Downsides…
The Dangers of Data Science
$1M Netflix prize, 2009
Contest to build a recommendation engine that could more accurately predict the movies customers would like than Netflix’s in-house Cinematch.
Result: Not implemented.
“Additional accuracy gains that we measured did not seem to justify the engineering effort needed to bring them into a production environment.”
- Netflix
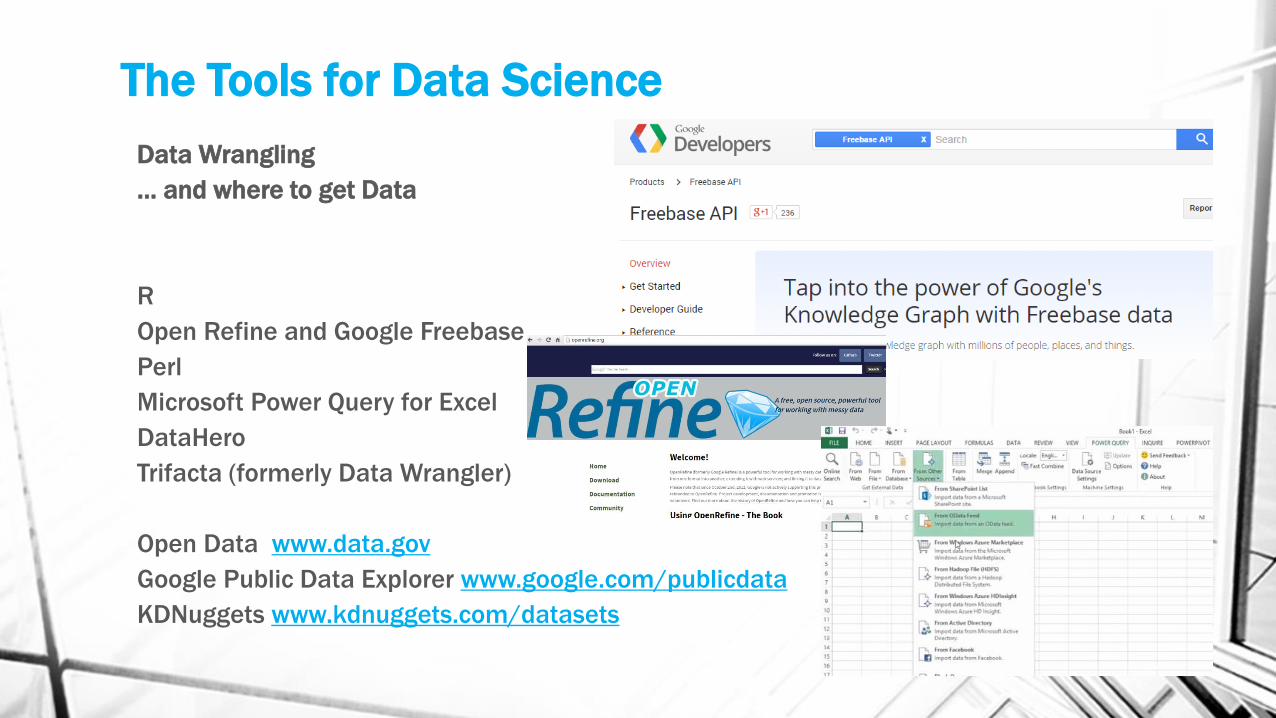
The Tools for Data Science
Data Wrangling
… and where to get Data
R
Open Refine and Google Freebase
Perl
Microsoft Power Query for Excel
DataHero
Trifacta (formerly Data Wrangler)
Open Data www.data.gov
Google Public Data Explorer www.google.com/publicdata
KDNuggets www.kdnuggets.com/datasets
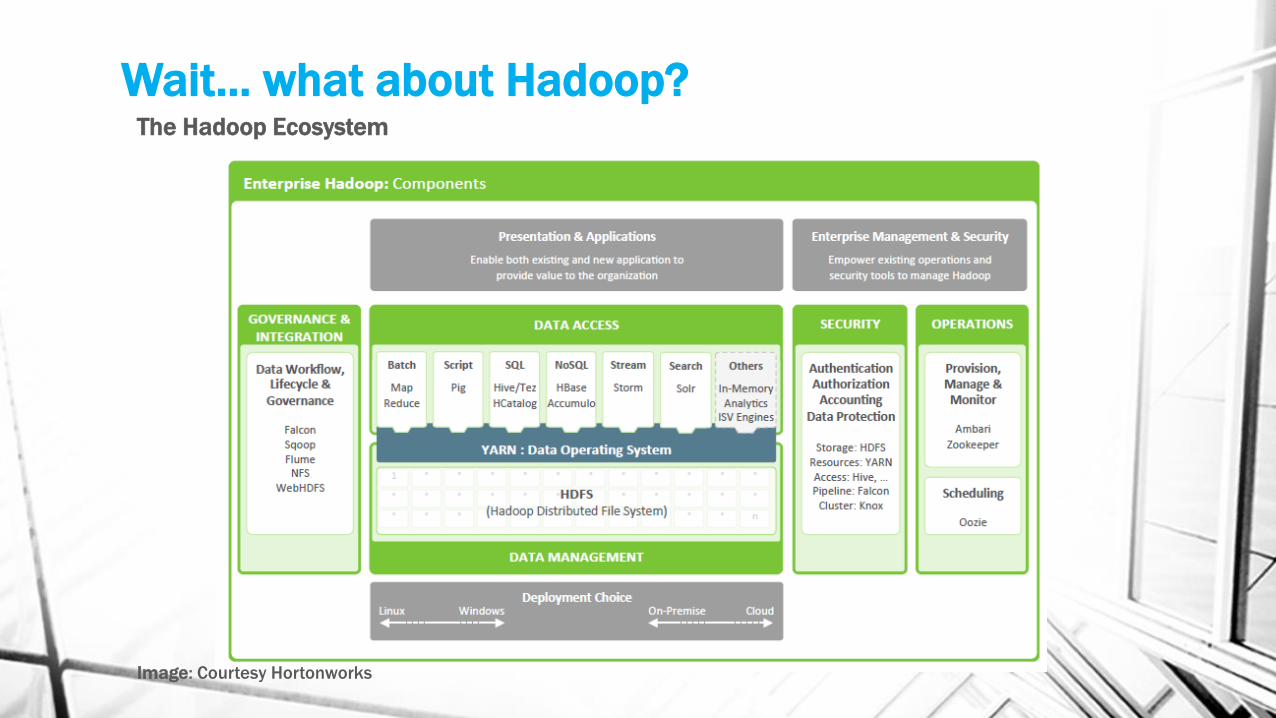
Wait… what about Hadoop? The Hadoop Ecosystem
Image: Courtesy Hortonworks
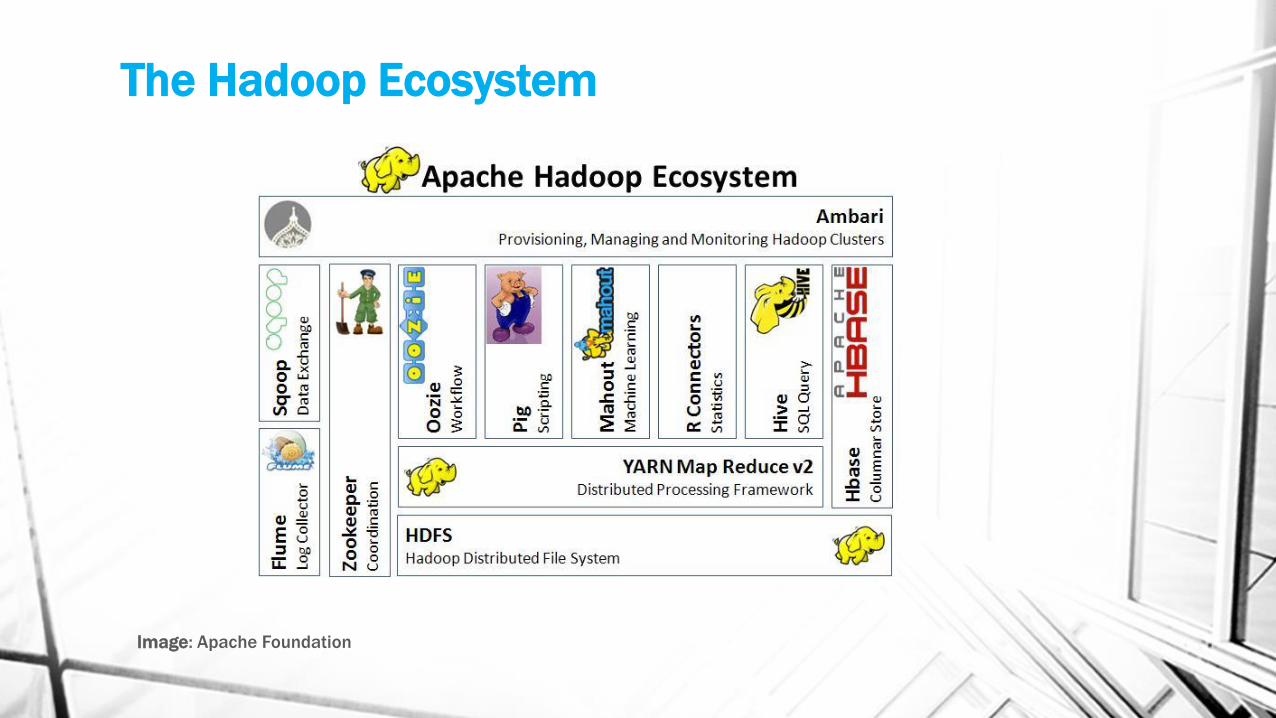
The Hadoop Ecosystem
Image: Apache Foundation
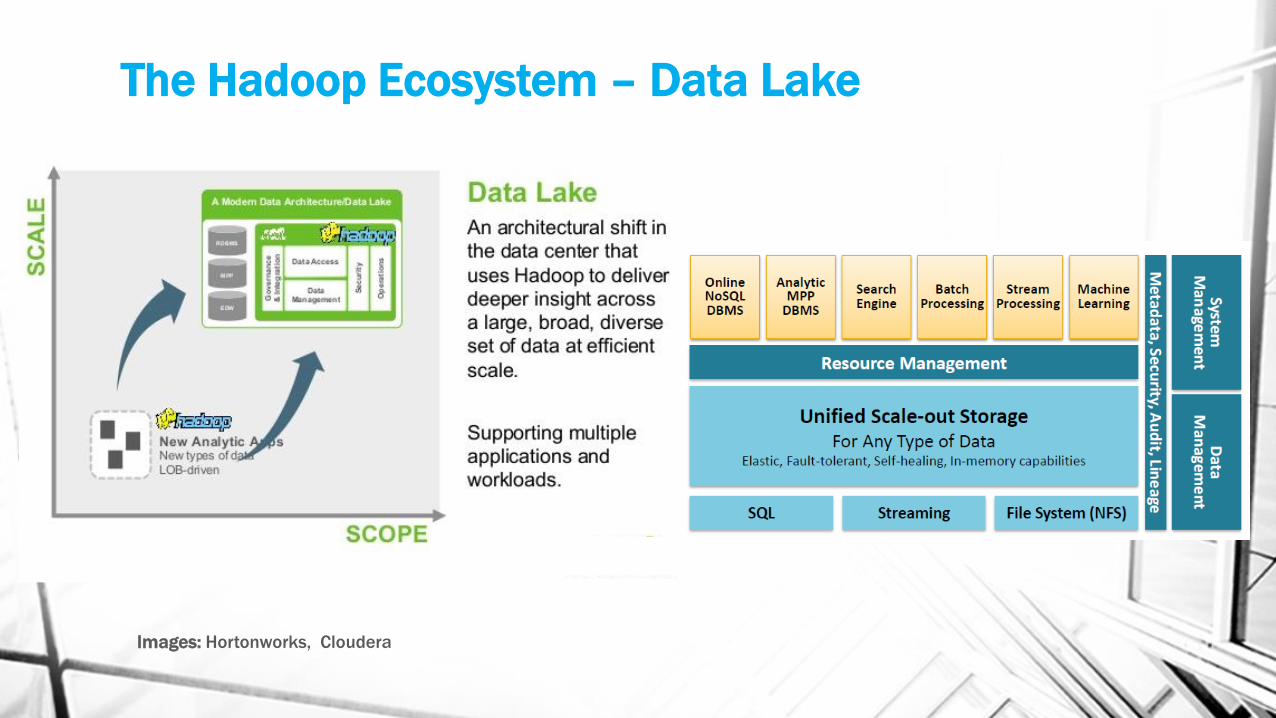
The Hadoop Ecosystem – Data Lake
Images: Hortonworks, Cloudera
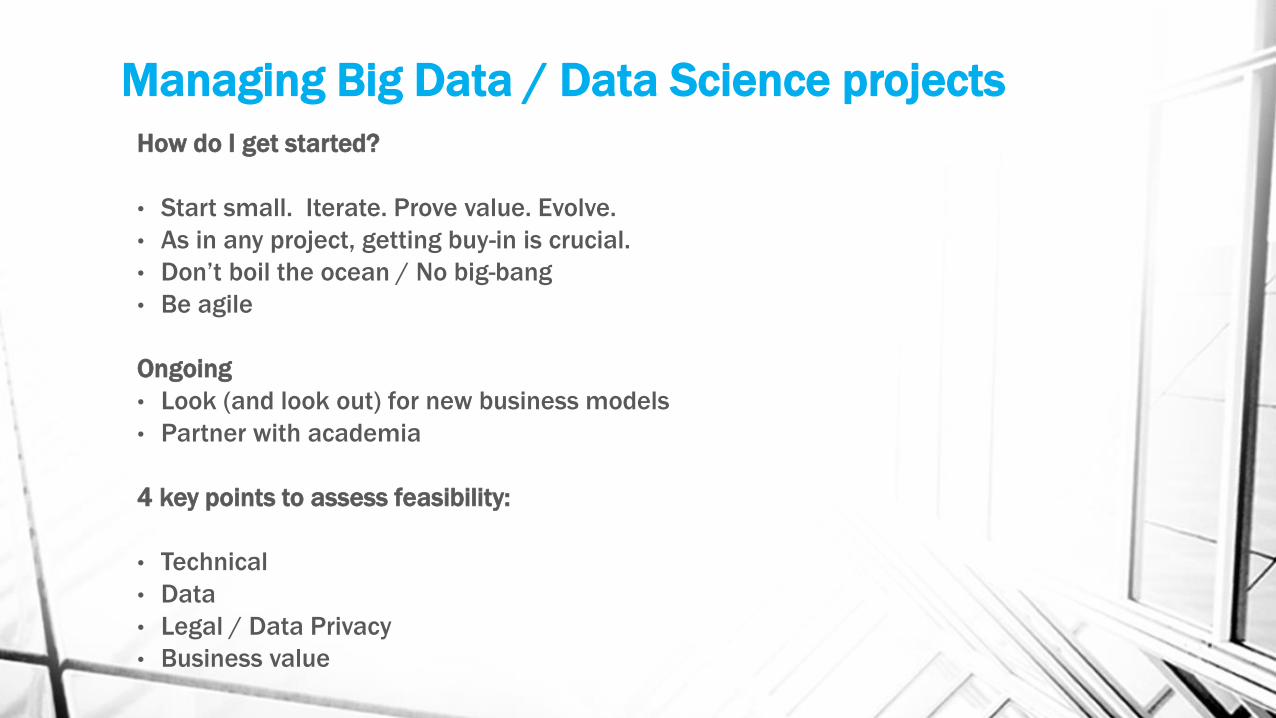
Managing Big Data / Data Science projects
How do I get started?
• Start small. Iterate. Prove value. Evolve.
• As in any project, getting buy-in is crucial.
• Don’t boil the ocean / No big-bang
• Be agile
Ongoing
• Look (and look out) for new business models
• Partner with academia
4 key points to assess feasibility:
• Technical
• Data
• Legal / Data Privacy
• Business value
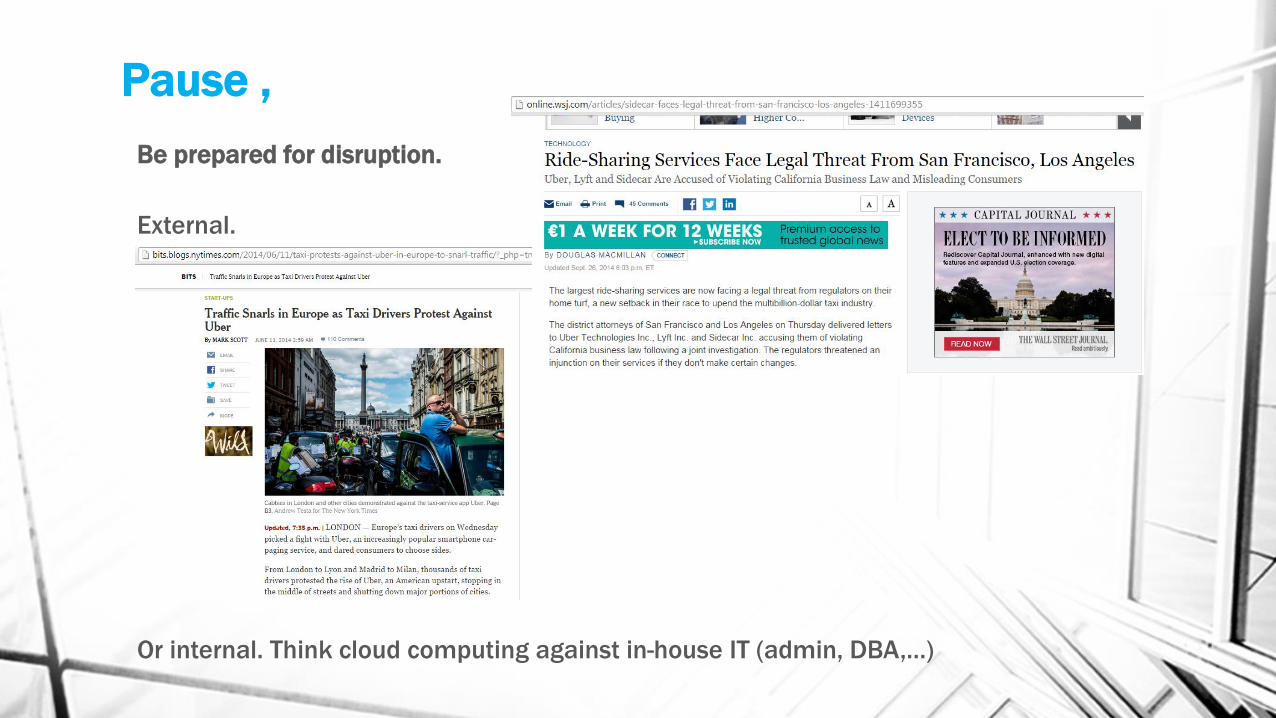
Pause ,
Be prepared for disruption.
External.
Or internal. Think cloud computing against in-house IT (admin, DBA,…)
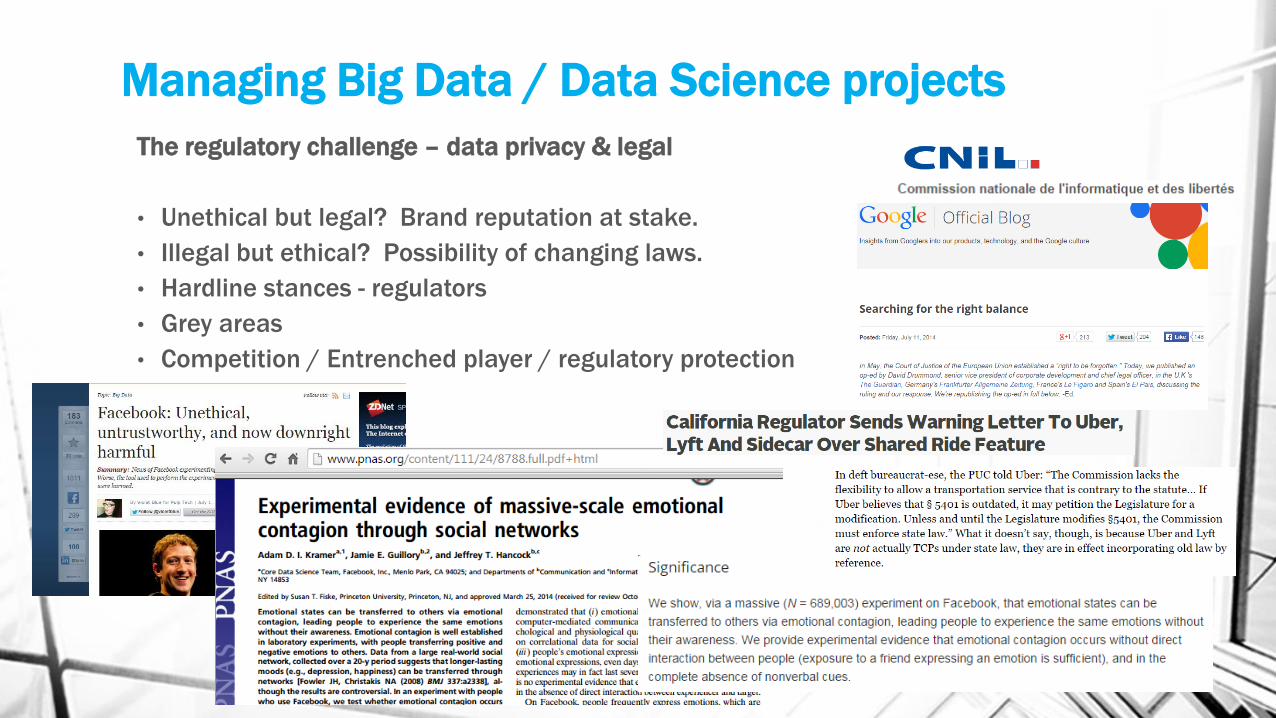
Managing Big Data / Data Science projects
The regulatory challenge – data privacy & legal
• Unethical but legal? Brand reputation at stake.
• Illegal but ethical? Possibility of changing laws.
• Hardline stances - regulators
• Grey areas
• Competition / Entrenched player / regulatory protection
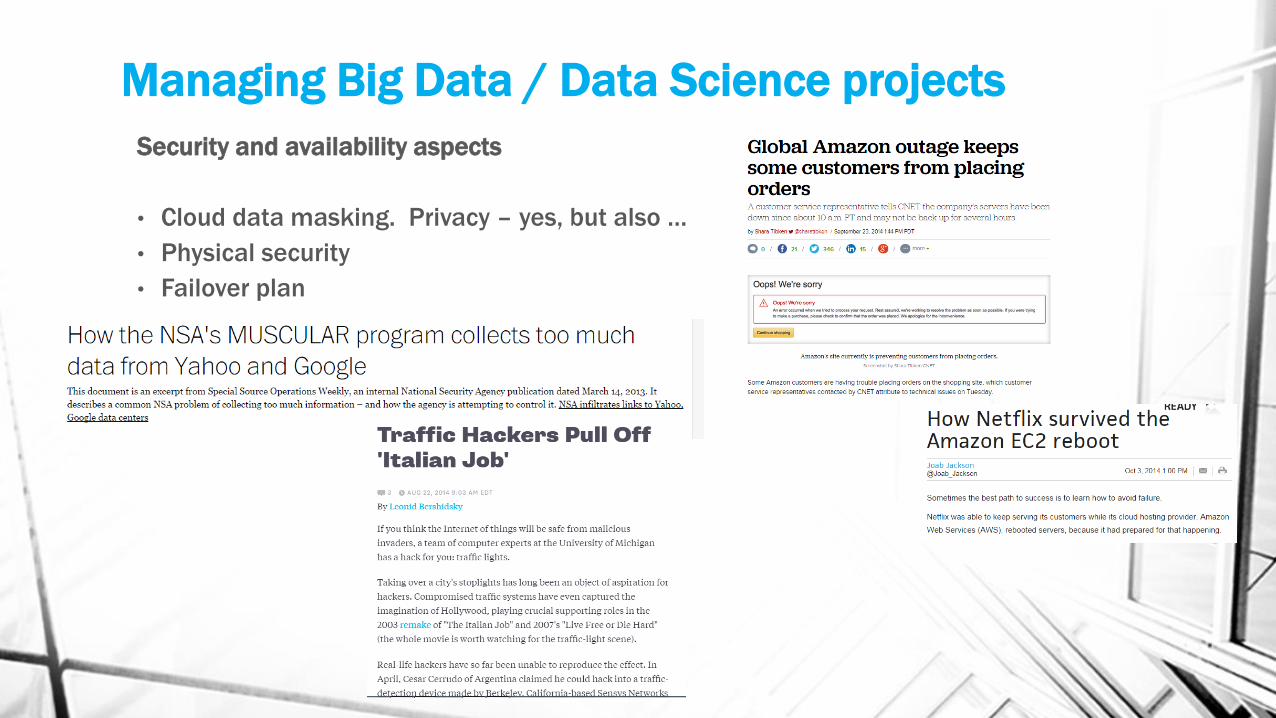
Managing Big Data / Data Science projects
Security and availability aspects
• Cloud data masking. Privacy – yes, but also …
• Physical security
• Failover plan
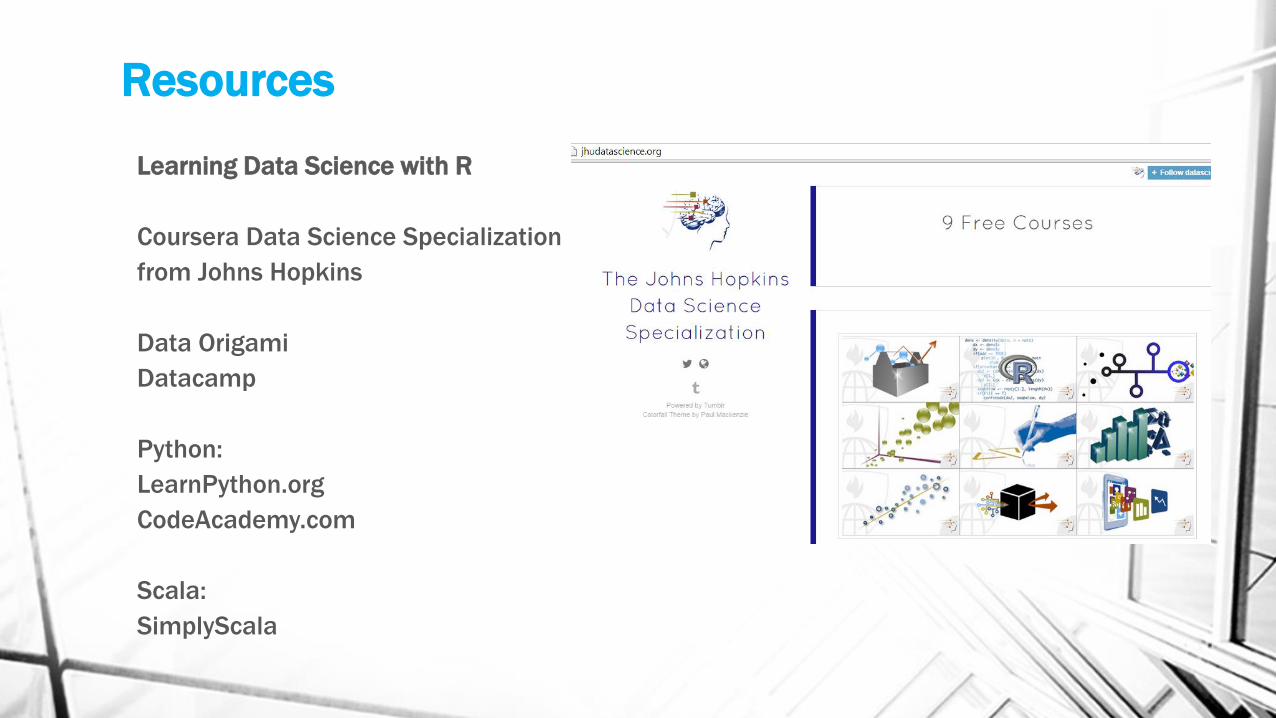
Resources
Learning Data Science with R
Coursera Data Science Specialization
from Johns Hopkins
Data Origami
Datacamp
Python:
LearnPython.org
CodeAcademy.com
Scala:
SimplyScala
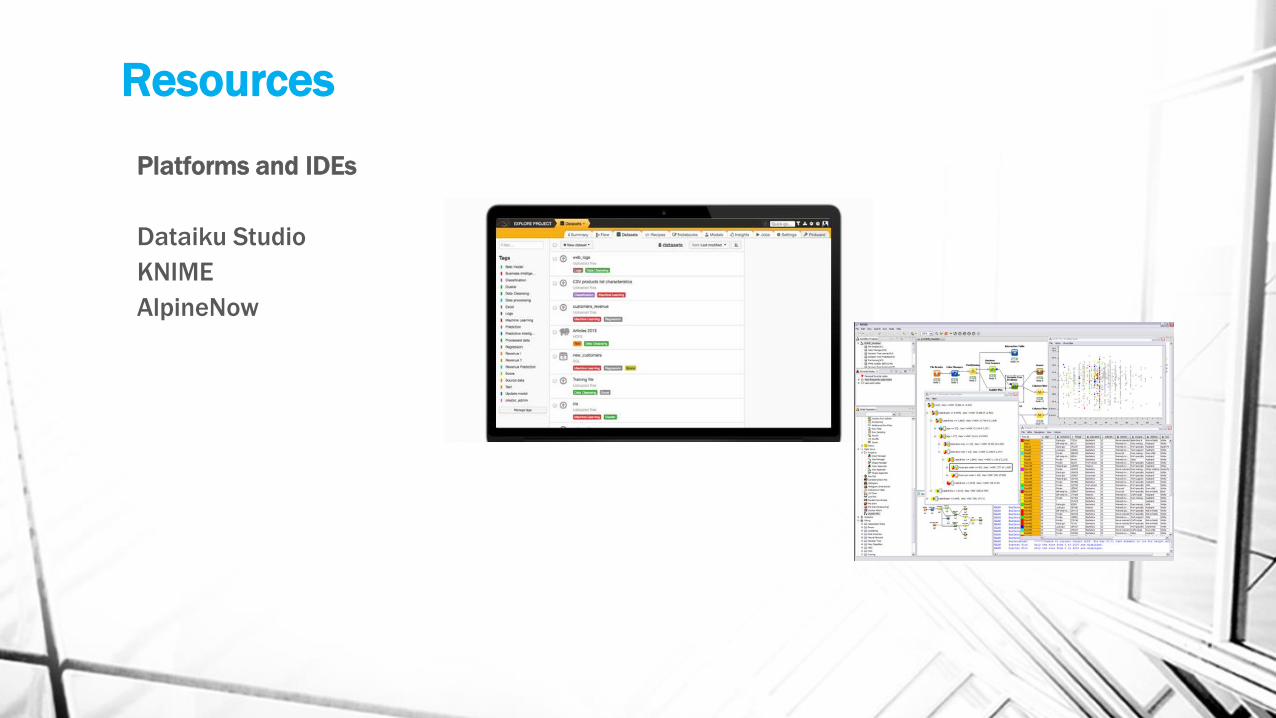
Resources
Platforms and IDEs
Dataiku Studio
KNIME
AlpineNow
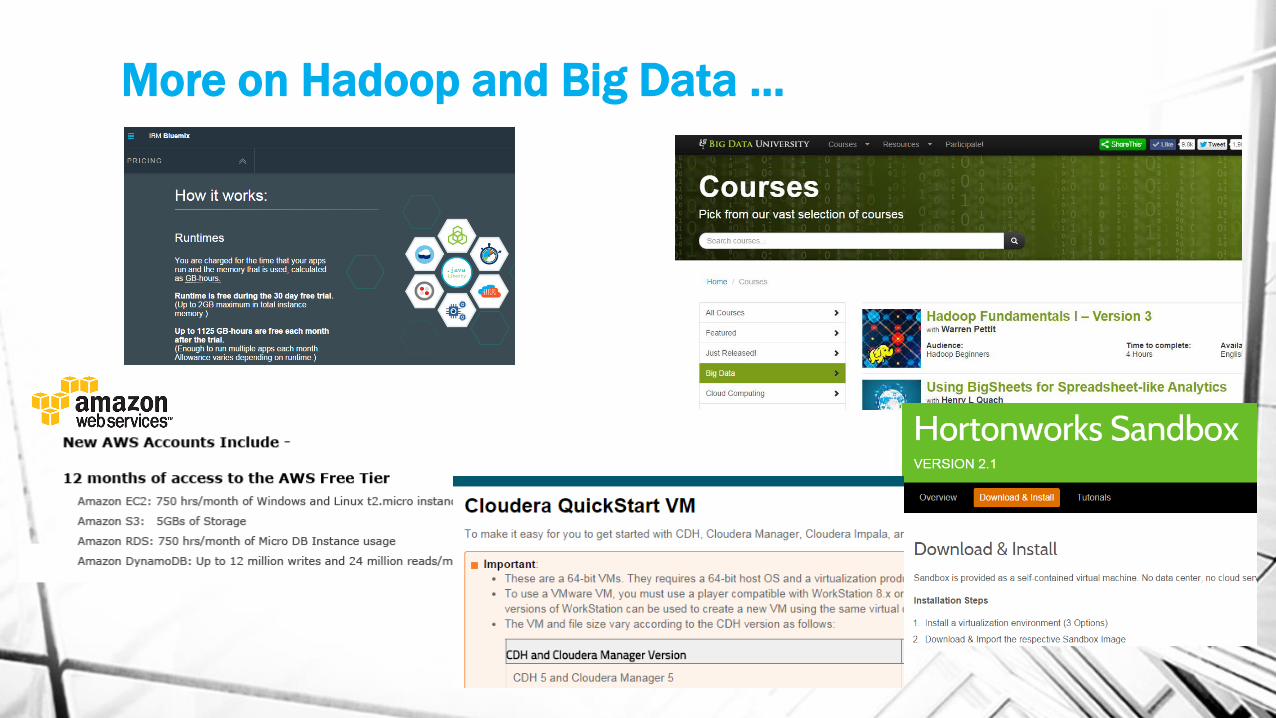
More on Hadoop and Big Data …
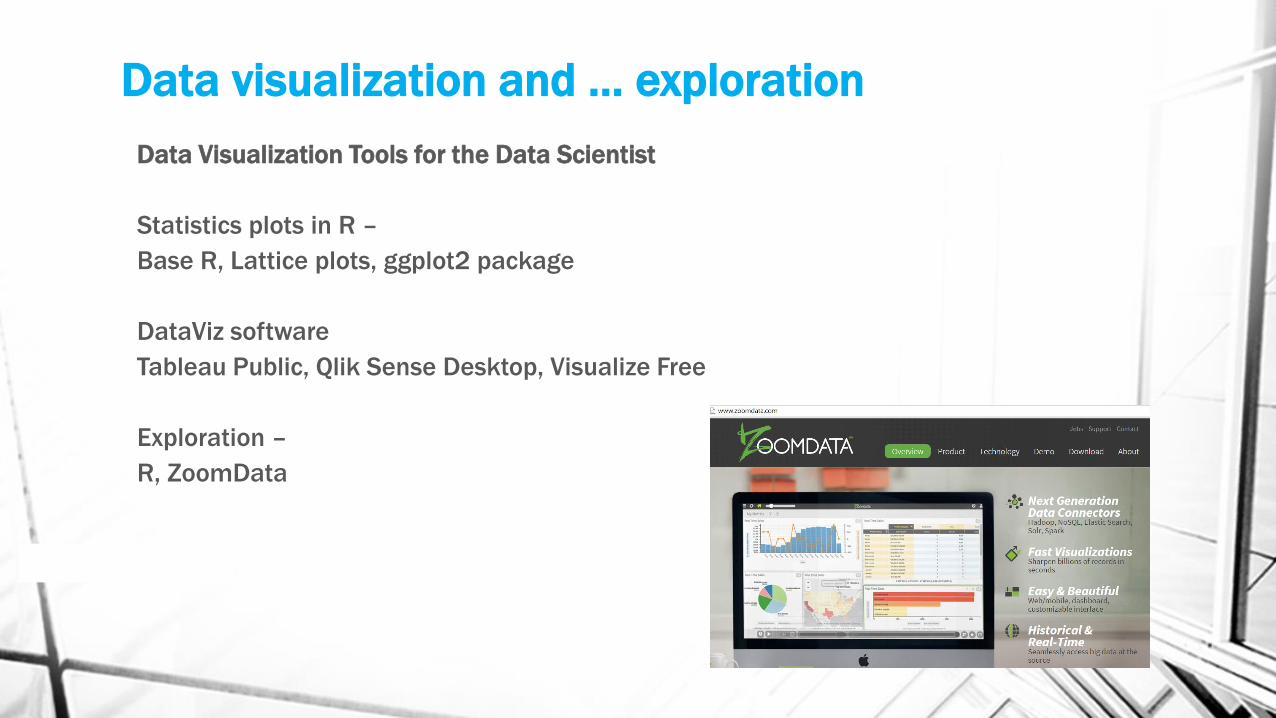
Data visualization and … exploration
Data Visualization Tools for the Data Scientist
Statistics plots in R –
Base R, Lattice plots, ggplot2 package
DataViz software
Tableau Public, Qlik Sense Desktop, Visualize Free
Exploration –
R, ZoomData
Questions BI in the Digital Era How to do Data Science & Big Data Analytics
Connect Maloy MANNA linkedin.com/in/maloy biguru.wordpress.com