Embed Size (px)
Citation preview
Beltway Arithmetic: Political Goals and Quantitative Analysis
in Energy and Environment Policy
AEI Enterprise Club Dallas Informal Discussion
March 31, 2015
Dr. Benjamin Zycher
John G. Searle Chair and Resident Scholar
American Enterprise Institute

AEI Enterprise Club Dallas March 31, 2015
2
Topics To Be Addressed
• The EIA projections of declining costs for wind and solar power in 2016-2019.– As presented in the Annual Energy Outlook, 2010-2014.
• The Obama administration benefit/cost analysis of the social cost of carbon.
• The evidence on the effects of increasing atmospheric GHG concentrations.
• Why has the Obama administration not told us the future temperature/climate effects of their policies?
Benjamin Zycher Beltway Arithmetic
AEI Enterprise Club Dallas March 31, 2015
3
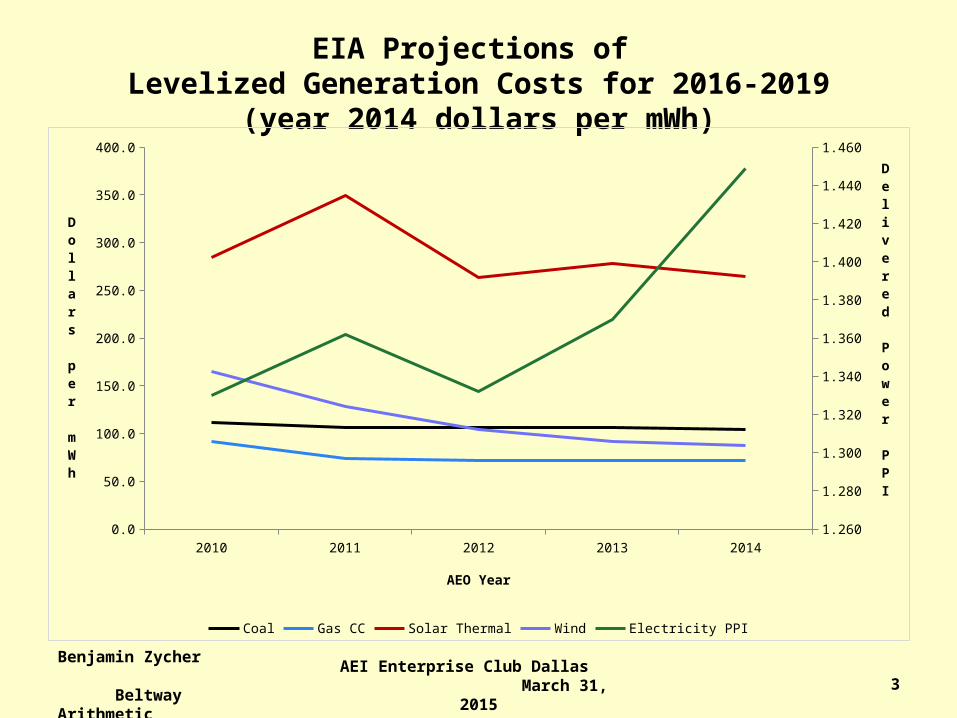
EIA Projections of Levelized Generation Costs for 2016-2019
(year 2014 dollars per mWh)
Benjamin Zycher Beltway Arithmetic
2010 2011 2012 2013 20140.0
50.0
100.0
150.0
200.0
250.0
300.0
350.0
400.0
1.260
1.280
1.300
1.320
1.340
1.360
1.380
1.400
1.420
1.440
1.460
Coal Gas CC Solar Thermal Wind Electricity PPI
AEO Year
Dollars per
mWh
Delivered Power PPI

AEI Enterprise Club Dallas March 31, 2015
4
It’s A Mystery
• While the electricity PPI 2010-2014 was increasing by 8.9 percent (CPI-U: 8.6 percent), the contemporaneous EIA projections of future (2016-2019) generation costs declined in real terms by:– Coal-fired: 6.6 percent.– Gas Combined Cycle: 21.7 percent.– Solar thermal: 7.0 percent.–Wind: 47.2 percent.
Benjamin Zycher Beltway Arithmetic

AEI Enterprise Club Dallas March 31, 2015
5
How Can This Be?• Why has the electricity PPI increased?• After all, since 2010 coal and natural gas prices have
declined in real terms.– Coal per short ton: 5 percent.– Gas per mcf: 11 percent.
• Obviously, the electricity PPI has increased in substantial part because wind and solar power are expensive but provide an increasing share of generation.– From 2.3 percent in 2010 to 4.8 percent in 2014.– As a result of mandates both explicit and implicit.
• The fruits of government planning: Use more of the costly power, and less of the cheap kind.
Benjamin Zycher Beltway Arithmetic

AEI Enterprise Club Dallas March 31, 2015
6
Magic? Or Politics?• Why does EIA believe that wind and solar power will
become cheaper?– Major imminent technological advances? By 2019!?
• If that is the assumption, then it is legitimate to assume similar technological advances for conventional generation.– This would mean that technological advance for renewables
would not imply increased competitiveness.
• Another common answer is “scale economies,” but that almost certainly is not correct.
• Or is the assumed downward cost path for wind and solar power more likely to be the product of the politics of renewables in this administration?
Benjamin Zycher Beltway Arithmetic
AEI Enterprise Club Dallas March 31, 2015
7
The Social Cost of Carbon
• Four analytic problems underlying the SCC technical support analyses from the IWG.
• The evidence on whether increasing GHG concentrations are important.
• What temperature effects would GHG policies have?– That is: Whether U.S. policy can achieve even remotely
the global benefits implied by the SCC calculation.– And those benefits are not believable anyway.
• A brief observation on political language and policy analytics.
Benjamin Zycher Beltway Arithmetic

AEI Enterprise Club Dallas March 31, 2015
8
Problem 1: Use of Global Benefit Estimates (1)
• 2010 IWG: Domestic SCC is about 7-23 percent of the global value.– That works out to about $2-7 per ton if we believe
the 2013 IWG $32 estimate.
• The use of the global estimate typically is justified by the global nature of the GHG externality.– This is the argument promoted by the Council of
Economic Advisers.
• It is an utter non sequitur. Benjamin Zycher Beltway Arithmetic

AEI Enterprise Club Dallas March 31, 2015
9
Problem 1: Use of Global Benefit Estimates (2)
• If the U.S. adopts policies equating the supposed global marginal benefits and costs of GHG reductions, it would be both rational and efficient for the rest of the world to do nothing.– This is one central reason that OMB Circular A-4 specifies clearly
that only domestic benefits and costs are to be used in benefit/cost analysis.
• That outcome is inconsistent with standard externality theory: the equation of the marginal cost of effluent reductions across emitters.
• It is inconsistent also with the current EPA objective under the proposed clean power rule of regionalizing emissions reductions.– Ostensibly to equate marginal costs across states. – In reality: To force all states into regional cap-and-trade systems.
Benjamin Zycher Beltway Arithmetic

AEI Enterprise Club Dallas March 31, 2015
10
Problem 2: SCC Estimates Conflate GDP and Climate Effects (1)
• In Bill Nordhaus’ DICE model, the scenario with the highest future GDP and a mid-range climate effect has the highest SCC.
• The scenario with the smallest future GDP and the greatest climate change has the smallest SCC.
• Why? In the IAMs, the SCC is a percent decline in assumed GDP, translated into a dollar figure and then divided by total assumed GHG emissions.
• This is a case in which conflation really is confusion.
Benjamin Zycher Beltway Arithmetic

AEI Enterprise Club Dallas March 31, 2015
11
Problem 3: The Choice Among Discount Rates (1)
• IWG analyses fail to use a 7 percent discount rate despite the requirement to do so under OMB Circular A-4.– A-4 allows a 3 percent discount rate in addition
to the 7 percent rate if a consumption displacement model is deemed appropriate.
– IWG used 2.5, 3, and 5 percent discount rates.
• But not 7 percent. Why?
Benjamin Zycher Beltway Arithmetic

AEI Enterprise Club Dallas March 31, 2015
12
Problem 3: The Choice Among Discount Rates (2)
• The reason is obvious: At 7 percent, the SCC becomes small or zero or negative.– DICE: SCC declines by 80 percent.– FUND (Richard Tol): SCC declines to zero or becomes
negative.
• The SCC calculation is highly sensitive to the assumed discount rate.– In the 2013 IWG analysis, the 2010 SCC is $11 per ton
at a 5 percent rate, but $52 per ton at a 2.5 percent rate.– PAGE (Chris Hope): SCC is $266 per ton at 1 percent
and $122 per ton at 1.5 percent.
Benjamin Zycher Beltway Arithmetic
AEI Enterprise Club Dallas March 31, 2015
13
Problem 3: The Choice Among Discount Rates (3)
• In the 2013 IWG update, even at a 5 percent rate, more than a fifth of the simulations show a SCC close to zero or negative for 2020.
• Another problem: The IWG analyses simply ignore the larger uncertainty of the purported benefits of reductions in GHG emissions relative to the costs.– This means that the assumed benefit stream
should be discounted at a rate higher than that applied to the cost stream.
Benjamin Zycher Beltway Arithmetic

AEI Enterprise Club Dallas March 31, 2015
14
Problem 3: The Choice Among Discount Rates (4)
• At a minimum, the sensitivity of the SCC to the choice among discount rates suggests that great caution is required before adoption of regulations imposing substantial economic costs.
• Why has this caution been lacking?• The bureaucracy is an interest group with
incentives to incorporate analytic assumptions yielding a preferred finding, even apart from the effects of political pressures from above.– Its pronouncements are not to be taken at face value.
Benjamin Zycher Beltway Arithmetic

AEI Enterprise Club Dallas March 31, 2015
15
What Is the Interest of Future Generations?
• If we care about future generations, an artificially-low discount rate is not appropriate.
• Why? Future generations want to inherit the biggest possible capital stock.– Within which environmental quality is one important
dimension among many.
• That requires efficient resource allocation by the current generation, that is, a discount rate reflecting the true opportunity costs of alternative investments.
Benjamin Zycher Beltway Arithmetic
AEI Enterprise Club Dallas March 31, 2015
16
Problem 4: Ozone and Particulates As Policy Co-Benefits (1)
• The EPA RIA for the clean power rule is explicit: The domestic “climate” net benefits are negative.– This is the real reason that they use a global benefits
approach in the SCC.
• Domestically, they justify the rule by invoking the benefits of associated reductions in other pollutants, in particular ozone and fine particulates (PM2.5).– These effects are 94 percent of the purported benefits
in 2030.
Benjamin Zycher Beltway Arithmetic

AEI Enterprise Club Dallas March 31, 2015
17
Problem 4: Ozone and Particulates As Policy Co-Benefits (2)
• This is deeply problematic.• The CAA is explicit: An endangerment finding requires
EPA to promulgate a NAAQS that “protects the public health” with “an adequate margin of safety.”
• So, either (1) the existing ozone and particulate standards fail to satisfy the requirements of the law, or (2) EPA is double-counting benefits for the clean power rule, or (3) the rule will reduce ozone and particulate emissions to levels that are inefficiently low.
• One of these has to be true. Which one? • Note: EPA uses assumed particulate reductions to justify
the proposed utility MATS (mercury) rule also.Benjamin Zycher Beltway Arithmetic

AEI Enterprise Club Dallas March 31, 2015
18
The 5th Percentile/95th Percentile Issue
• The benefit/cost analysis underlying application of the SCC computations ignores the nontrivial probability of a future exogenous cooling/glaciation dynamic.– The Little Ice Age ended only in the mid-19th
century.
• This means that a future anthropogenic warming effect might yield significant net benefits.– Analysis should incorporate this effect, however
uncertain, but the SCC framework does not.Benjamin Zycher Beltway Arithmetic
AEI Enterprise Club Dallas March 31, 2015
19
What Is the Evidence on the Climate Effects of Increasing GHG
Concentrations?
• GHG concentrations have increased from about 337 ppm in 1979 to about 370 ppm in 2000 to about 399 ppm in 2014.– An 18.4 percent increase for 1979-2014.
• So: What are the data telling us about the impacts?
Benjamin Zycher Beltway Arithmetic

AEI Enterprise Club Dallas March 31, 2015
20
Despite Increasing GHG Concentrations (1)
• The temperature record is ambiguous.• The correlation of GHG concentrations and
the rate of sea level increase is ambiguous.• The Arctic and Antarctic ice covers do not
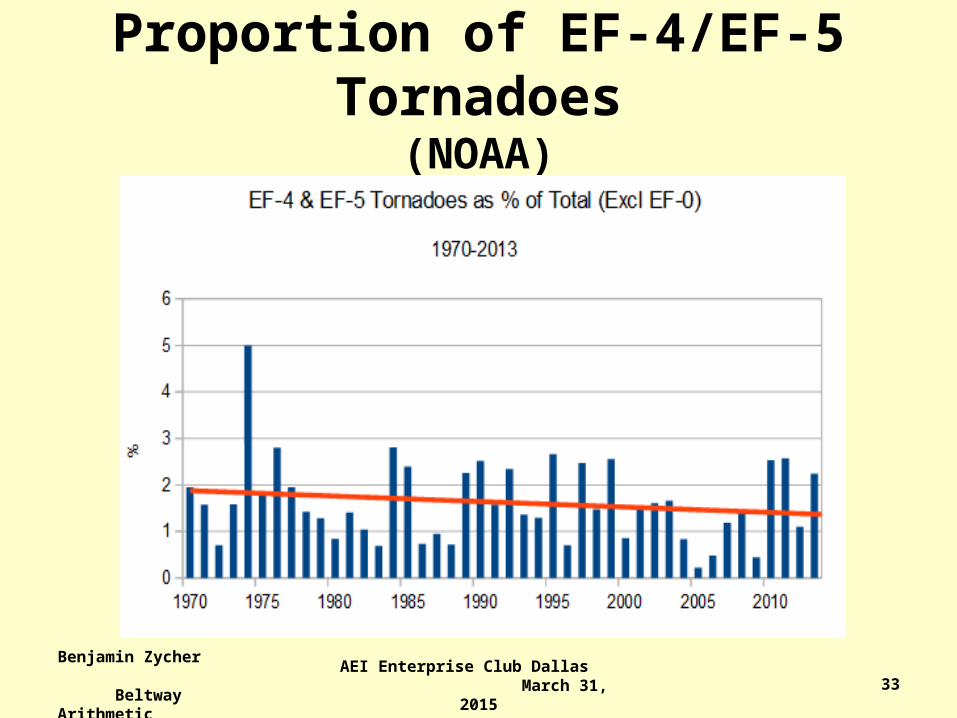
differ statistically from the 1981-2010 averages.• Tornado counts and intensities are falling.• Tropical cyclone frequency and energy are
near their lowest levels since satellite measurements began in the early 1970s.
Benjamin Zycher Beltway Arithmetic

AEI Enterprise Club Dallas March 31, 2015
21
Despite Increasing GHG Concentrations (2)
• U.S. wildfires are not correlated with the temperature record.
• The Palmer Drought Severity Index shows no trend since 1895.
• U.S. flooding is not correlated with increased GHG concentrations over the last century.
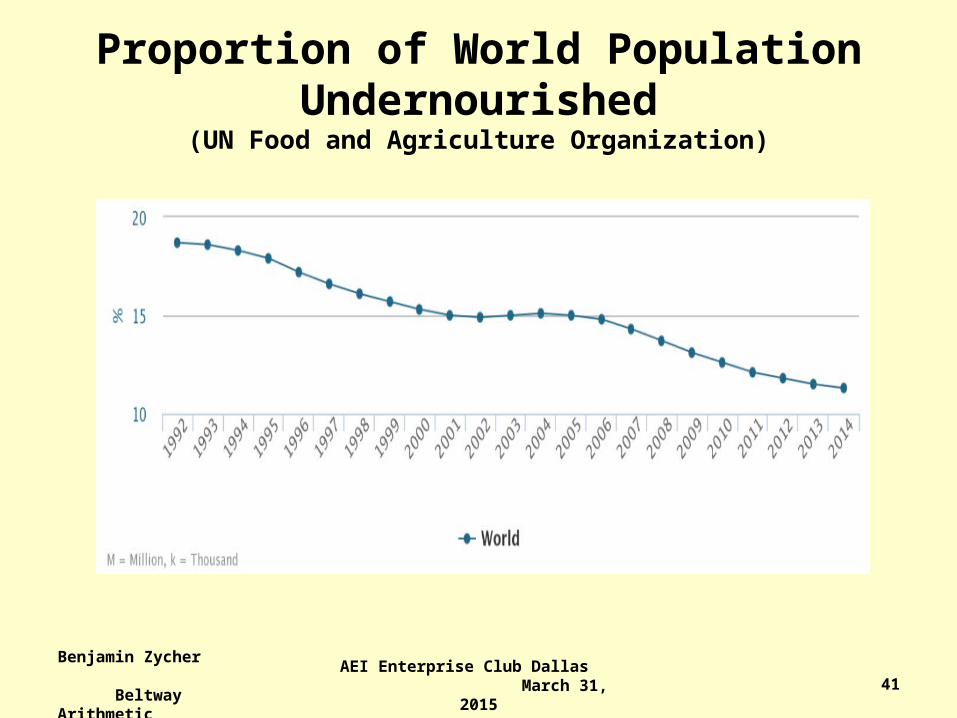
• Per capita food production has increased and undernourishment has decreased, both more-or-less monotonically, since 1993.
Benjamin Zycher Beltway Arithmetic

AEI Enterprise Club Dallas March 31, 2015
22
Land-Ocean Reconstruction 1880-2013
Benjamin Zycher Beltway Arithmetic

AEI Enterprise Club Dallas March 31, 2015
23
The NOAA/RSS Satellite Data
– IPCC AR4 mean projection: 0.68° C (2.78° C/century). – IPCC AR5 mean projection: 2.2° C/century.
Benjamin Zycher Beltway Arithmetic

AEI Enterprise Club Dallas March 31, 2015
24
RSS Satellite Land-Ocean Trend
Benjamin Zycher Beltway Arithmetic

AEI Enterprise Club Dallas March 31, 2015
25
Long-Term Sea Level Increases (Professor Judith Curry, Georgia Tech)
Benjamin Zycher Beltway Arithmetic

AEI Enterprise Club Dallas March 31, 2015
26
Roughly Constant Sea-Level Increases Despite Rising GHG Concentrations?(Cazenave et. al., Nature Climate Change March 2014)
Benjamin Zycher Beltway Arithmetic

AEI Enterprise Club Dallas March 31, 2015
27
Or Are Sea Levels Increasing Faster?
• Roughly constant rate of increase since 1992 of about 3.2mm per year. (About 10.7 inches from now to 2100)– (University of Colorado)
• 20th century: 6.7 inches.– Proudman Oceanographic Laboratory.
• So: The data might be showing accelerating sea level increases.
• If so, is it mainly anthropogenic?– Remember: Temperatures have been increasing
in fits and starts since roughly 1850.Benjamin Zycher Beltway Arithmetic

AEI Enterprise Club Dallas March 31, 2015
28
Or Are Natural Phenomena Dominant?(University of Colorado)
Benjamin Zycher Beltway Arithmetic

AEI Enterprise Club Dallas March 31, 2015
29
Arctic Sea Ice(National Snow & Ice Data Center)
Benjamin Zycher Beltway Arithmetic

AEI Enterprise Club Dallas March 31, 2015
30
Antarctic Sea Ice(National Snow & Ice Data Center)
Benjamin Zycher Beltway Arithmetic

AEI Enterprise Club Dallas March 31, 2015
31
Strong U.S. Tornadoes(NOAA)
Benjamin Zycher Beltway Arithmetic

AEI Enterprise Club Dallas March 31, 2015
32
Proportion of EF-3 Tornadoes(NOAA)
Benjamin Zycher Beltway Arithmetic
AEI Enterprise Club Dallas March 31, 2015
33
Proportion of EF-4/EF-5 Tornadoes(NOAA)
Benjamin Zycher Beltway Arithmetic

AEI Enterprise Club Dallas March 31, 2015
34
Global Frequency of Tropical Cyclones(Ryan Maue, Geoph. Res. Let., 2011, updated February 2015)
Benjamin Zycher Beltway Arithmetic

AEI Enterprise Club Dallas March 31, 2015
35
Global Frequency of Tropical Hurricanes(Ryan Maue, Geoph. Res. Let., 2011, updated February 2015)
Benjamin Zycher Beltway Arithmetic

AEI Enterprise Club Dallas March 31, 2015
36
Accumulated Tropical Cyclone Energy(Ryan Maue, Geoph. Res. Let., 2011, updated February 2015)
Benjamin Zycher Beltway Arithmetic

AEI Enterprise Club Dallas March 31, 2015
37
U.S. Wildfires 1960-2013(National Interagency Fire Center)
Benjamin Zycher Beltway Arithmetic
0
50
100
150
200
250
300
Year
Thousands

AEI Enterprise Club Dallas March 31, 2015
38
Palmer Drought Severity Index(NOAA)
Benjamin Zycher Beltway Arithmetic

AEI Enterprise Club Dallas March 31, 2015
39
U.S. Flooding Over the Last Century(Hirsch and Ryberg, Hydrological Sciences Journal, 2012)
Benjamin Zycher Beltway Arithmetic

AEI Enterprise Club Dallas March 31, 2015
40
Global Per Capita Food Production(UN Food and Agriculture Organization)
Benjamin Zycher Beltway Arithmetic
AEI Enterprise Club Dallas March 31, 2015
41
Proportion of World Population Undernourished
(UN Food and Agriculture Organization)
Benjamin Zycher Beltway Arithmetic

AEI Enterprise Club Dallas March 31, 2015
42
Has the Beltway Been Forthright About the “Benefits” of GHG Policies? (1)
• The Obama administration asserts that reduced GHG emissions will yield a lowered temperature trend, a reduction in climate effects, and net economic benefits.
• Current administration policy is a reduction in GHG emissions of 17 percent below 2005 levels by 2020.– Under the U.S.-China announcement (last November) this notionally
is changed to 26-28 percent by 2025.
• So: What would the future temperature effect be?• Let’s apply the NCAR MAGICC/SCENGEN model under a
climate sensitivity assumption of 4.5° C. (IPCC’s current guess: 3° C, which is about 40 percent higher than fifteen recent peer-reviewed estimates.)– Using the IPCC midrange emissions path (A1B) as the baseline.
Benjamin Zycher Beltway Arithmetic
AEI Enterprise Club Dallas March 31, 2015
43
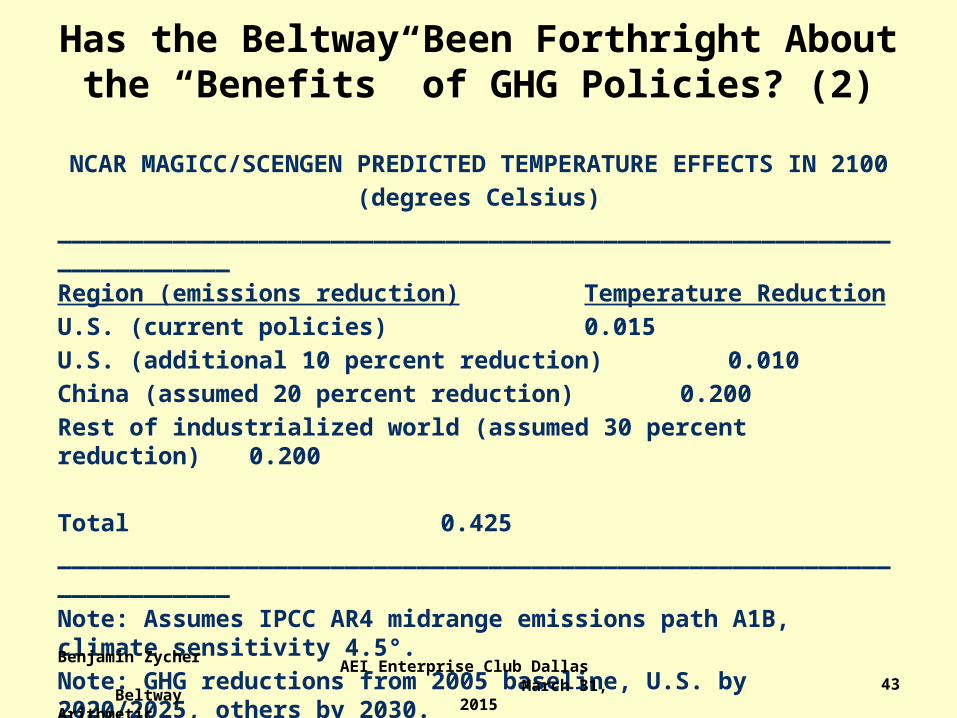
Has the Beltway Been Forthright About the “Benefits” of GHG Policies? (2)
NCAR MAGICC/SCENGEN PREDICTED TEMPERATURE EFFECTS IN 2100
(degrees Celsius)
______________________________________________________________________
Region (emissions reduction) Temperature Reduction
U.S. (current policies) 0.015
U.S. (additional 10 percent reduction) 0.010
China (assumed 20 percent reduction) 0.200
Rest of industrialized world (assumed 30 percent reduction) 0.200
Total 0.425
______________________________________________________________________
Note: Assumes IPCC AR4 midrange emissions path A1B, climate sensitivity 4.5°.
Note: GHG reductions from 2005 baseline, U.S. by 2020/2025, others by 2030.
Note: The standard deviation of the temperature record is about 0.11°.
Benjamin Zycher Beltway Arithmetic

AEI Enterprise Club Dallas March 31, 2015
44
Has the Beltway Been Forthright About the “Benefits” of GHG Policies? (3)
• Those embarrassing numbers are why EPA has never published or stated an estimate of the actual temperature effect of its GHG policies.– Or of sea-level increases, droughts, tropical storms,
polar bear populations, or any other parameter purported to be affected by increasing GHG concentrations.
• Instead, the IWG claims $31 billion in climate change benefits in 2030 despite trivial or unmeasurable temperature effects in 2100!
Benjamin Zycher Beltway Arithmetic
AEI Enterprise Club Dallas March 31, 2015
45
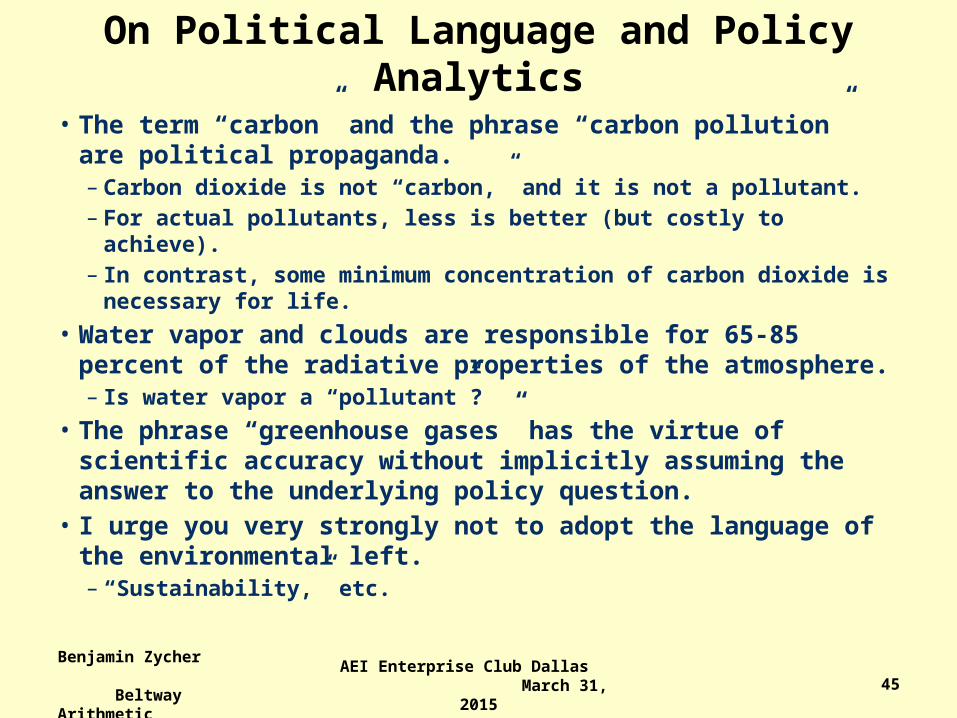
On Political Language and Policy Analytics
• The term “carbon” and the phrase “carbon pollution” are political propaganda.– Carbon dioxide is not “carbon,” and it is not a pollutant.– For actual pollutants, less is better (but costly to achieve).– In contrast, some minimum concentration of carbon dioxide is
necessary for life.
• Water vapor and clouds are responsible for 65-85 percent of the radiative properties of the atmosphere.– Is water vapor a “pollutant”?
• The phrase “greenhouse gases” has the virtue of scientific accuracy without implicitly assuming the answer to the underlying policy question.
• I urge you very strongly not to adopt the language of the environmental left.– “Sustainability,” etc.
Benjamin Zycher Beltway Arithmetic

AEI Enterprise Club Dallas March 31, 2015
46
Concluding Thought
• The bureaucracy is an interest group with incentives to incorporate analytic assumptions yielding a preferred finding.– Even apart from the effects of top-down
political pressures from above.
• Their analyses and pronouncements must be interpreted in that context.
Benjamin Zycher Beltway Arithmetic

AEI Enterprise Club Dallas March 31, 2015
47
Thank You!
202-862-4883
Benjamin Zycher Beltway Arithmetic