Embed Size (px)
Citation preview

FATMA ÇINAR, MBA, Capital Markets Board of Turkeye-mail: [email protected] @fatma_cinar_ftm, @TRUserGroup
KUTLU MERİH, PhD e-mail: [email protected] @cortexien https://www.riskonomi.com
R ile Veri Madenciliği Yaz Okulu, 07 – 13 Eylül 2015, Muğla,TOVAK ULUSLARARSI MARMARİS AKADEMİSİ
AUTOMOTIVE DISTRIBUTERS ASSOCIATION (ADA) Chart Of
Turkey: Graphical Data-Mining Analysis with R Software
DATA VISUALIZATION WITH GGPLOT2

Wednesday, September 02, 2015
Visualization of multidimensional multi factorial big data is not large data, big
data is complex data.
What is big data?
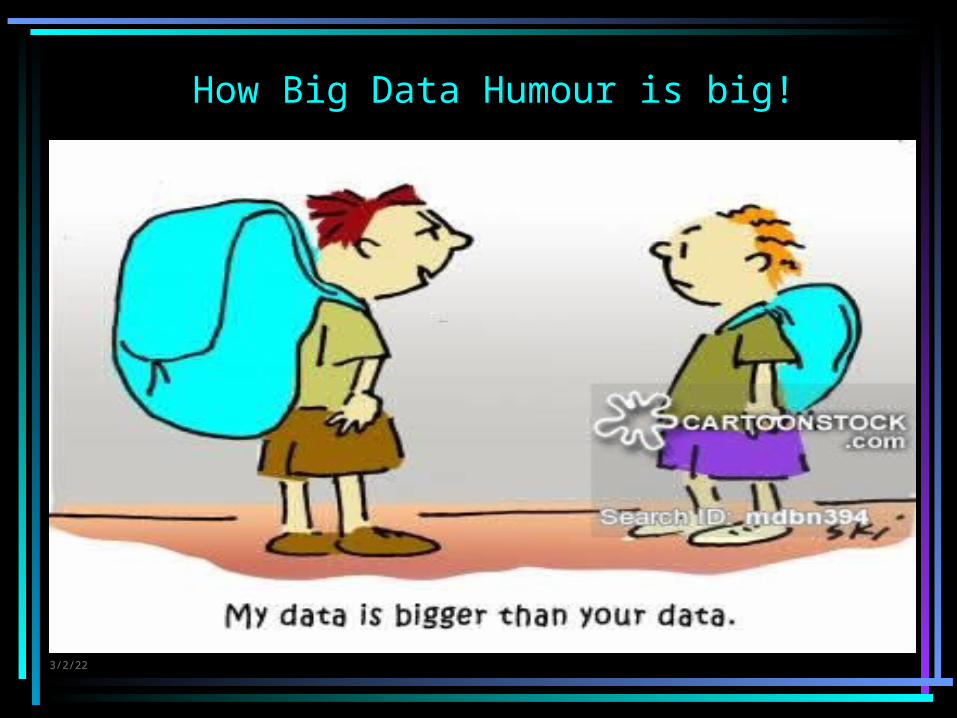
How Big Data Humour is big!
Monday, May 1, 2023

• We are trainnig decipher this complexcity data Visualization.
• Data Visualization packages of R software lattice and ggplot 2.
Monday, May 1, 2023

• What is data analysis?• Why use a programming language?• Why use R ?• Why lattice packages?• What is lattice packages grammer of
graphics?• Why ggplot2 ?• What is ggplot2 grammer of graphics?
Monday, May 1, 2023
Agenda • Case study: AUTOMOTIVE DISTRIBUTERS ASSOCIATION (ADA) DataSet - 2010
Case Study
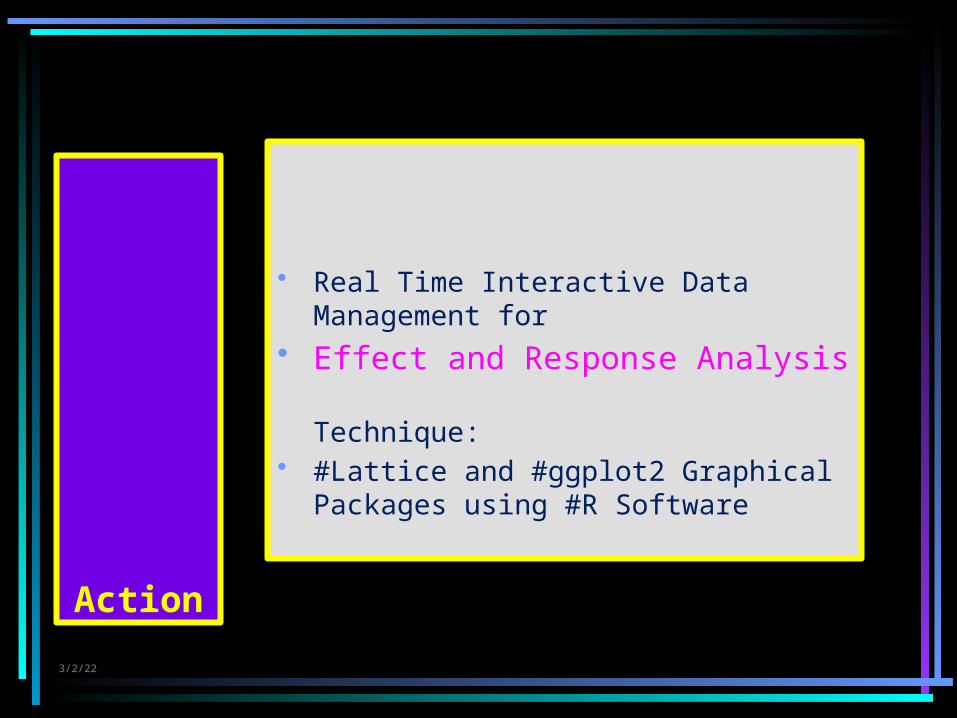
Action
• Real Time Interactive Data Management for
• Effect and Response Analysis
Technique: • #Lattice and #ggplot2 Graphical Packages
using #R Software
Monday, May 1, 2023
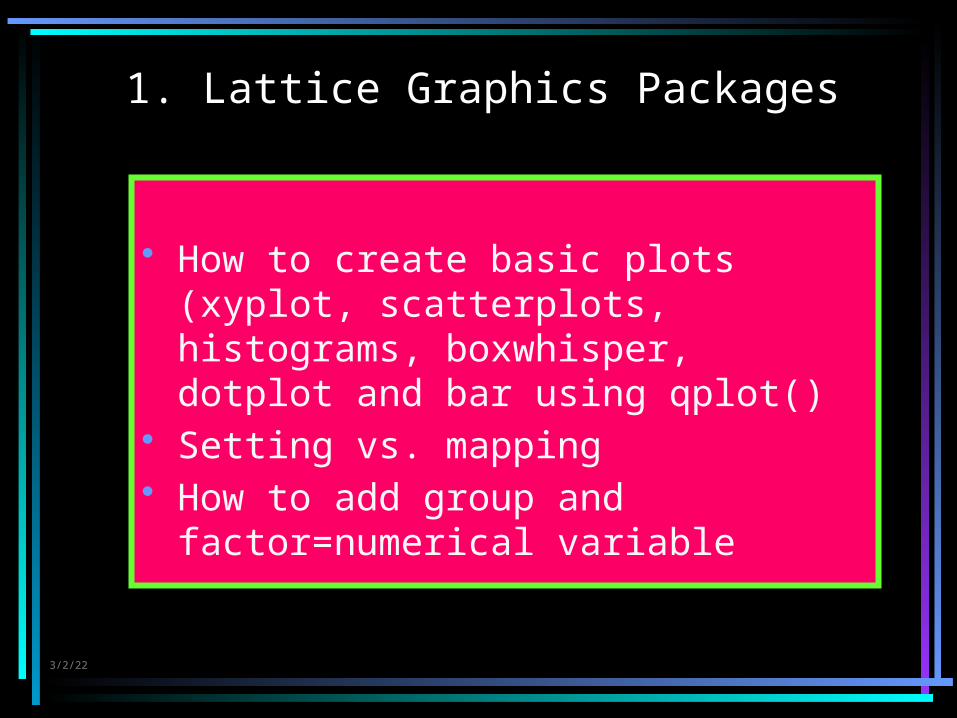
• How to create basic plots (xyplot, scatterplots, histograms, boxwhisper, dotplot and bar using qplot()
• Setting vs. mapping• How to add group and factor=numerical
variable
Monday, May 1, 2023
1. Lattice Graphics Packages

• library(lattice)• p<-xyplot(NUMERIC ~ NUMERIC) | FACTOR1,
group= FACTOR2, data=dataset)• p• p<-xyplot( NUM ~ NUM ) | FAC1+FAC2, group=
FAC3, data=dataset)• p
Monday, May 1, 2023
Description of XYPlot
Graphs
1.1. XYPlot Graphic Module
1. Lattice Graphics Packages
XYPlot graph of the lattice packakge for 2 numerical 3
factors values

• library(lattice)• p<-xyplot(NUMERIC ~ NUMERIC) | FACTOR1, group= FACTOR2,
data=dataset)• p<-xyplot(log10(NUMERIC) ~ log10(NUMERIC) | FACTOR1, group=
FACTOR2, data=dataset)
• p<-xyplot(MOTORHACMI ~ MOTORGUCU) | GOVDETIPI, group=CEKERTIPI, data=dataset)
• p<-xyplot(log10(MOTORHACMI) ~ log10(MOTORGUCU) | GOVDETIPI, group=CEKERTIPI, auto.key=list(border=TRUE),data=dataset)
• p<-xyplot(CEKERTIPI) ~ MOTORGUCU) | GOVDETIPI, group=YAKITTIPI, auto.key=list(border=TRUE),data=dataset)
• p<-xyplot(factor(KAPISAYISI) ~ (MOTORGUCU) | YAKITTIPI+CEKERTIPI, group= GOVDETIPI, auto.key=list(border=TRUE),data=dataset)
Monday, May 1, 2023
1.1.1. XYPlot Graphic Module and Legand

Monday, May 1, 2023
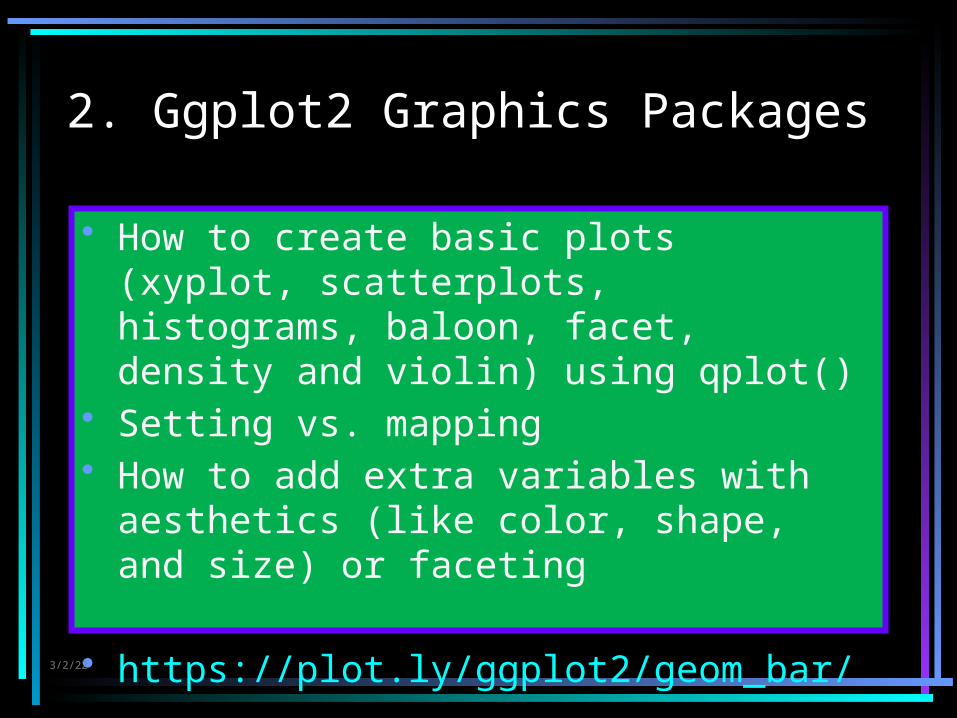
2. Ggplot2 Graphics Packages
• How to create basic plots (xyplot, scatterplots, histograms, baloon, facet, density and violin) using qplot()
• Setting vs. mapping• How to add extra variables with aesthetics
(like color, shape, and size) or faceting
• https://plot.ly/ggplot2/geom_bar/
Monday, May 1, 2023

What is ggplot2 ?
Grammer of graphics represents and abstraction of graphics ideas/objects
Think ‘verb’, ‘noun’, ‘adjective’ for graphics Allows for a ‘theory’ of graphics on which to build
new graphics and graphics ogjects ‘Shorten the distence from mind to page’
Monday, May 1, 2023

Grammer of Graphics ?
‘In brief, the grammer tells us that a statistical graphic is a mapping from data to aesthetic attributes (color, shape, size) of geometric object (point, lines, bars).The plot may also contain stastistical transformations of data and drawn on a specific coordinate system’
Hadley Wickham
Monday, May 1, 2023

2.1.Logarithm Module
• library(ggplot2)• ds<-ggplot(dataset)• #as<-aes(log10(NUMERIC), log10(NUMERIC), color=FACTOR)• lx<-scale_x_log10()• ly<-scale_y_log10()• p<-ds+as+gp+lx+ly• p
Monday, May 1, 2023

How to add extra variables with aesthetics (like color, shape, and size)
#as<-(NUMERIC, NUMERIC, color=FACTOR, shape=factor(NUMERIC), size=NUMERIC
gp<-geom_point()ds<-ggplot(dataset)ds<-ggplot(dataset)p<-ds+as+gpp enter
Monday, May 1, 2023
2.1.1. Baloon Graphic Module
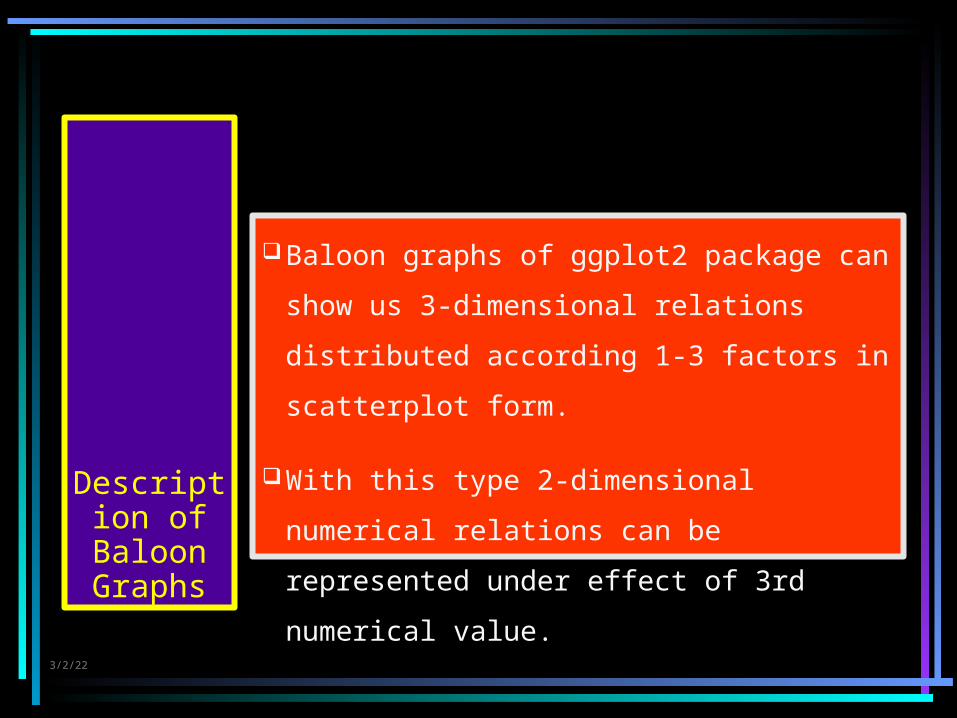
Description of Baloon
Graphs
Baloon graphs of ggplot2 package can show us
3-dimensional relations distributed according 1-3
factors in scatterplot form.
With this type 2-dimensional numerical relations
can be represented under effect of 3rd numerical
value.
Monday, May 1, 2023

Log10 MotorHacmi Vs Log10 MotorGücü, Baloon Ağırlık Explained by Gövdetipi, Segment, Çekertipi and Şanzıman Factors Baloon Graphics

3.Density Graphic Module
Monday, May 1, 2023
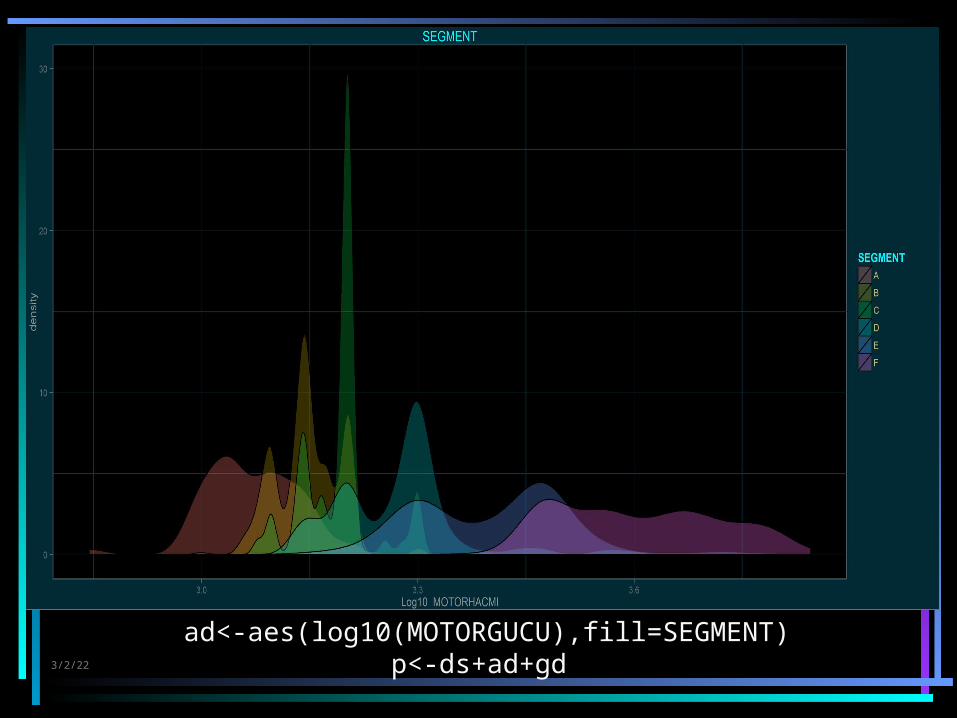
#ad<-aes(NUMERIC, color=FACTOR)ad<-aes(MOTORHACMI, color=GOVDETIPI)
#as<-aes(log10(NUMERIC), fill=FACTORad<-aes(log10(MOTORHACMI), fill=SEGMENT)
gd<-geom_density()gd<-geom_density(alpha=0.5)ds<-ggplot(dataset)p<-ds+ad+gdp enter
P.S It will be one Numeric Variable
Description of Density
Graphs
Monday, May 1, 2023
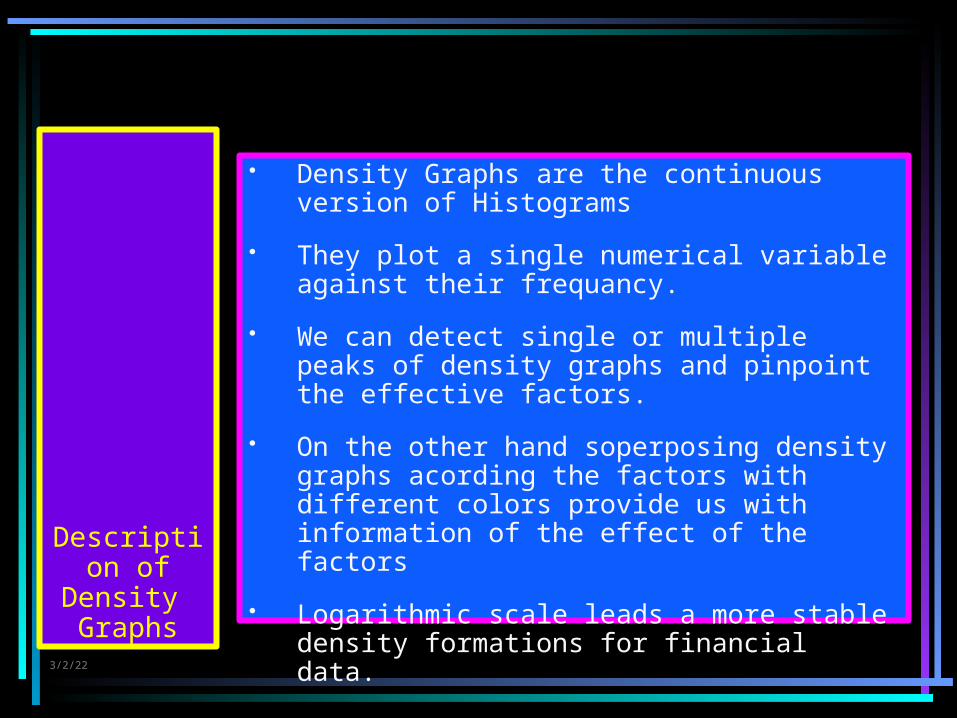
• Density Graphs are the continuous version of Histograms
• They plot a single numerical variable against their frequancy.
• We can detect single or multiple peaks of density graphs and pinpoint the effective factors.
• On the other hand soperposing density graphs acording the factors with different colors provide us with information of the effect of the factors
• Logarithmic scale leads a more stable density formations for financial data.Description of
Density Graphs

Monday, May 1, 2023
ad<-aes(log10(MOTORGUCU),fill=GOVDETIPI)p<-ds+ad+gd
Monday, May 1, 2023
ad<-aes(log10(MOTORGUCU),fill=SEGMENT)p<-ds+ad+gd

Log10 MotorHacmi Vs Log10 MotorGücü, Baloon Ağırlık Explained by Gövdetipi and Segment Factors Density/Violin Graphics
4.Facet Graphic Module
Monday, May 1, 2023
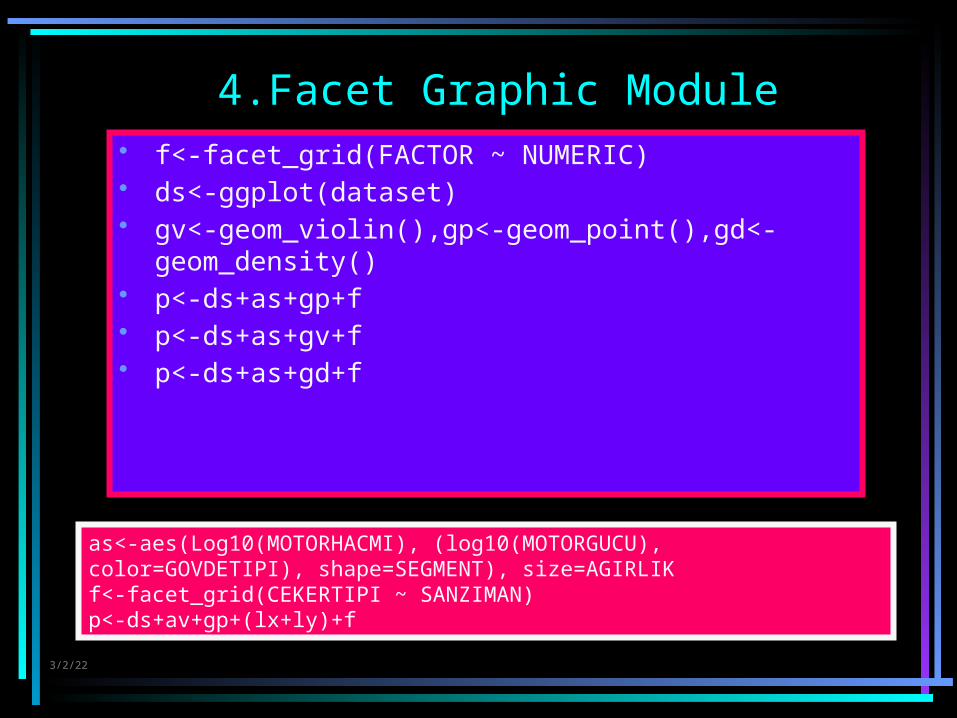
• f<-facet_grid(FACTOR ~ NUMERIC)• ds<-ggplot(dataset)• gv<-geom_violin(),gp<-geom_point(),gd<-geom_density()• p<-ds+as+gp+f• p<-ds+as+gv+f• p<-ds+as+gd+f
as<-aes(Log10(MOTORHACMI), (log10(MOTORGUCU), color=GOVDETIPI), shape=SEGMENT), size=AGIRLIKf<-facet_grid(CEKERTIPI ~ SANZIMAN)p<-ds+av+gp+(lx+ly)+f

Log10 MotorHacmi Vs Log10 MotorGücü, Baloon Ağırlık Explained by Gövdetipi, Segment,Çekertipi and Şanzıman Factors Facet Graphics

Monday, May 1, 2023
• Facet graphs of ggplot2 package can show us 3-dimensional graphs distributed according 3 factors in matrix form.
• In which we can see the anomalies occurs on which year and which region and which period.
• Here we investigate default energy versus default loans bloonad by total loans according to region, year and period factors.
Description of Facet Graphs

5.Violin Graphic Module
Monday, May 1, 2023
• subset• ds<-ggplot(dataset)• dataset=subset(dataset,NUMERIC!=0)
• Subset Justify• m<-length(dataset[,1])• m enter• [m] 1234….
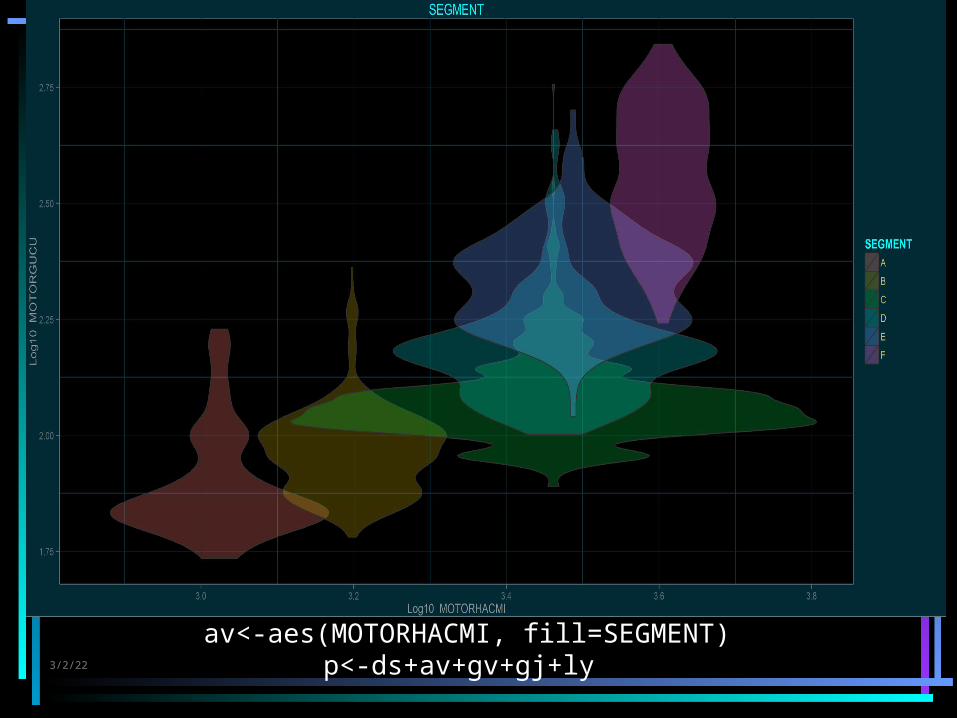
• ds<-ggplot(dataset)• av<aes(NUMERIC,NUMERIC,fill=FACTOR)• gv<-geom_violin()• gj<-geom_jitter()• p<-ds+av+gv+gj+lx+ly• p enter

Monday, May 1, 2023
Description of Violin Graphs
• Violin Graphs can be seen as two-dimensional density graphs
• Usually Violin Graphs comes with Mushroom, Potter and Bottle formations
• Violin Graphs are very important for Risk Analysis of financial Data
• Through the mean of X-axis Y-density graph ocuurs with nirror copy
• Mushroom formation represents a risk concentration on hig order values of financial data
• Potter means risk on the medium order and the bottle menas risk on the lower orders

Monday, May 1, 2023Log10 MotorHacmi Vs Log10 MotorGücü, Baloon Ağırlık Explained by Gövdetipi
Factors Violin Graphics
Monday, May 1, 2023
av<-aes(MOTORHACMI, fill=SEGMENT)p<-ds+av+gv+gj+ly
I would like to express my deep gratitude to;
Dr. Kutlu MERİH,Dr. C. Coşkun KÜÇÜKÖZMENfor their valuable contibutions,
Fatma ÇINAR
Monday, May 1, 2023
Contact
@TRUserGroup@CORTEXIEN@Riskonometri@Riskonomi@datanalitik@Riskanalitigi@RiskLabTurkey@fatma_cinar_ftmtr.linkedin.com/in/fatmacinartr.linkedin.com/pub/kutlu-merihtr.linkedin.com/in/coskunkucukozmen
[email protected]@ieu.edu.trhttp://www.ieu.edu.tr/tr [email protected]://[email protected]
http://www.spk.gov.tr/
http://www.riskonomi.com
Monday, May 1, 2023
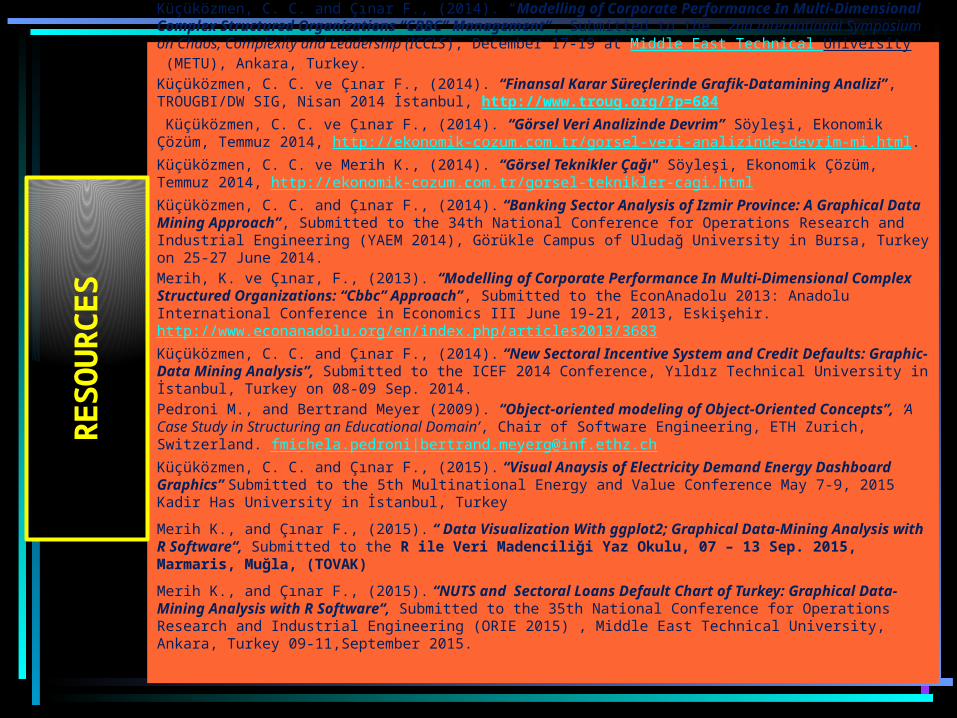
Küçüközmen, C. C. and Çınar F., (2014). “Modelling of Corporate Performance In Multi-Dimensional Complex Structured Organizations “CBBC” Management”, Submitted to the “2nd International Symposium on Chaos, Complexity and Leadership (ICCLS), December 17-19 at Middle East Technical University (METU), Ankara, Turkey.Küçüközmen, C. C. ve Çınar F., (2014). “Finansal Karar Süreçlerinde Grafik-Datamining Analizi”, TROUGBI/DW SIG, Nisan 2014 İstanbul, http://www.troug.org/?p=684 Küçüközmen, C. C. ve Çınar F., (2014). “Görsel Veri Analizinde Devrim” Söyleşi, Ekonomik Çözüm, Temmuz 2014, http://ekonomik-cozum.com.tr/gorsel-veri-analizinde-devrim-mi.html.Küçüközmen, C. C. ve Merih K., (2014). “Görsel Teknikler Çağı" Söyleşi, Ekonomik Çözüm, Temmuz 2014, http://ekonomik-cozum.com.tr/gorsel-teknikler-cagi.htmlKüçüközmen, C. C. and Çınar F., (2014). “Banking Sector Analysis of Izmir Province: A Graphical Data Mining Approach”, Submitted to the 34th National Conference for Operations Research and Industrial Engineering (YAEM 2014), Görükle Campus of Uludağ University in Bursa, Turkey on 25-27 June 2014. Merih, K. ve Çınar, F., (2013). “Modelling of Corporate Performance In Multi-Dimensional Complex Structured Organizations: “Cbbc” Approach”, Submitted to the EconAnadolu 2013: Anadolu International Conference in Economics III June 19-21, 2013, Eskişehir. http://www.econanadolu.org/en/index.php/articles2013/3683Küçüközmen, C. C. and Çınar F., (2014). “New Sectoral Incentive System and Credit Defaults: Graphic-Data Mining Analysis”, Submitted to the ICEF 2014 Conference, Yıldız Technical University in İstanbul, Turkey on 08-09 Sep. 2014.Pedroni M., and Bertrand Meyer (2009). “Object-oriented modeling of Object-Oriented Concepts”, ‘A Case Study in Structuring an Educational Domain’, Chair of Software Engineering, ETH Zurich, Switzerland. fmichela.pedroni|[email protected]üçüközmen, C. C. and Çınar F., (2015). “Visual Anaysis of Electricity Demand Energy Dashboard Graphics” Submitted to the 5th Multinational Energy and Value Conference May 7-9, 2015 Kadir Has University in İstanbul, TurkeyMerih K., and Çınar F., (2015). “ Data Visualization With ggplot2; Graphical Data-Mining Analysis with R Software“, Submitted to the R ile Veri Madenciliği Yaz Okulu, 07 – 13 Sep. 2015, Marmaris, Muğla, (TOVAK)
Merih K., and Çınar F., (2015). “NUTS and Sectoral Loans Default Chart of Turkey: Graphical Data-Mining Analysis with R Software“, Submitted to the 35th National Conference for Operations Research and Industrial Engineering (ORIE 2015) , Middle East Technical University, Ankara, Turkey 09-11,September 2015.
RESO
URCE
S