Embed Size (px)
Citation preview

Analysis of Motorcyclist Safety Data in Texas
Eva M Shipp, PhDCrash Analytics Team
Center for Transportation Safety

Today’s objectives
Project overview Selected preliminary
findings

Project goal
Understand crash complexity
Prioritize points for intervention
Prevent death & injury

Project Components
Crash database Detailed analyses

Part I: Crash database
• 2010 – forward • All crashes (all severities)• CRIS data
– Narratives
• Other sources

Part II: Statistical analysis
Detailed plan– 26 questions– Hurt Report– Beyond CRIS
• GIS (home/alcohol outlets)• Training / endorsement• Estimating VMT• At fault• Road geometry• Engine size

Selected preliminary findings
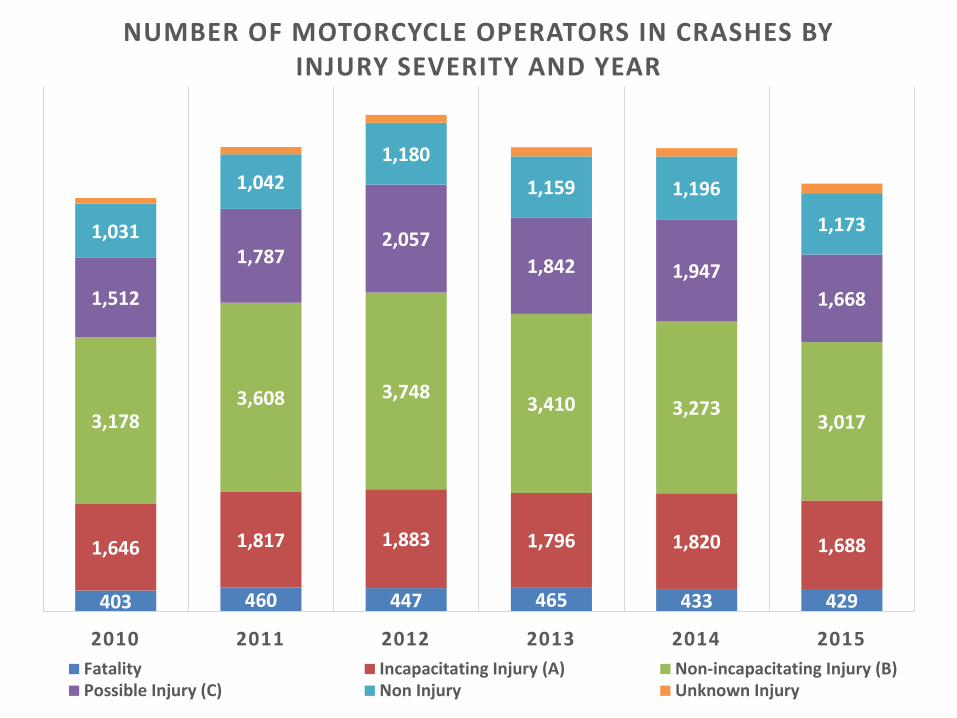
403 460 447 465 433 429
1,646 1,817 1,883 1,796 1,820 1,688
3,1783,608 3,748 3,410 3,273
3,017
1,512
1,7872,057
1,842 1,9471,668
1,031
1,0421,180
1,159 1,196
1,173
2010 2011 2012 2013 2014 2015
NUMBER OF MOTORCYCLE OPERATORS IN CRASHES BY INJURY SEVERITY AND YEAR
Fatality Incapacitating Injury (A) Non-incapacitating Injury (B)Possible Injury (C) Non Injury Unknown Injury

Motorcycle registrations
5.11
5.25
5.05 5.10
4.92
4.70 4.80 4.90 5.00 5.10 5.20 5.30
2011 2012 2013 2014 2015RATE
PER
100
0 RE
GIST
RATI
ON
S
YEAR
Rate of Fatal & Incapacitating Injuries
445,395 443,856 448,399
442,483
431,505
400,000 410,000 420,000 430,000 440,000 450,000 460,000
2011 2012 2013 2014 2015
NU
MBE
R
YEAR
Registered Motorcycles by Year
2015431,505 registrations 4.92/1000 registrations
Next: rates per VMT
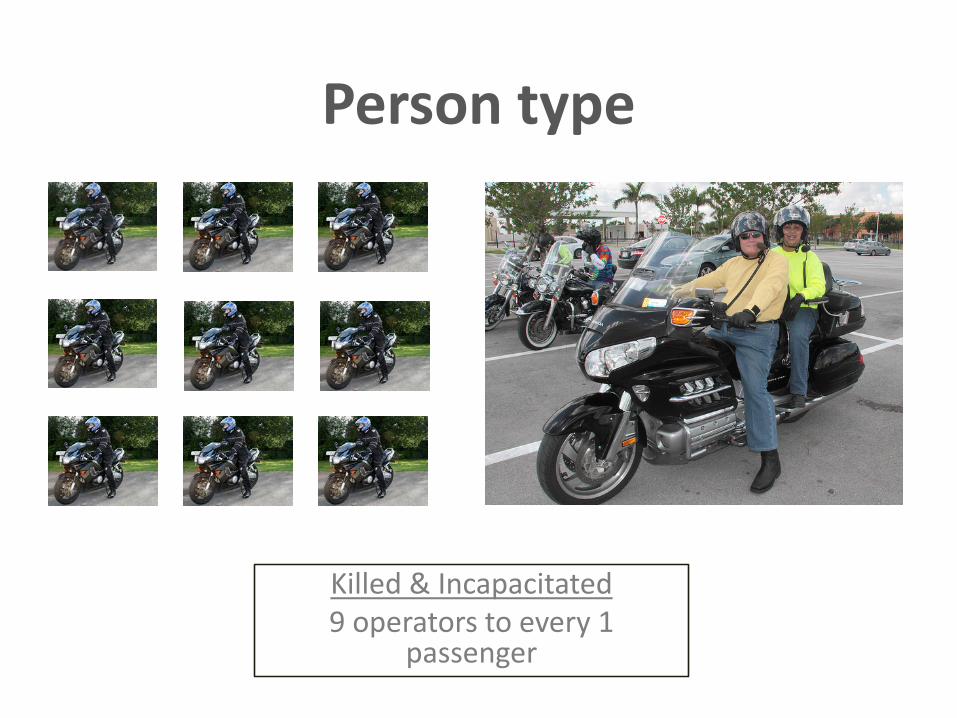
Person type
Killed & Incapacitated9 operators to every 1
passenger
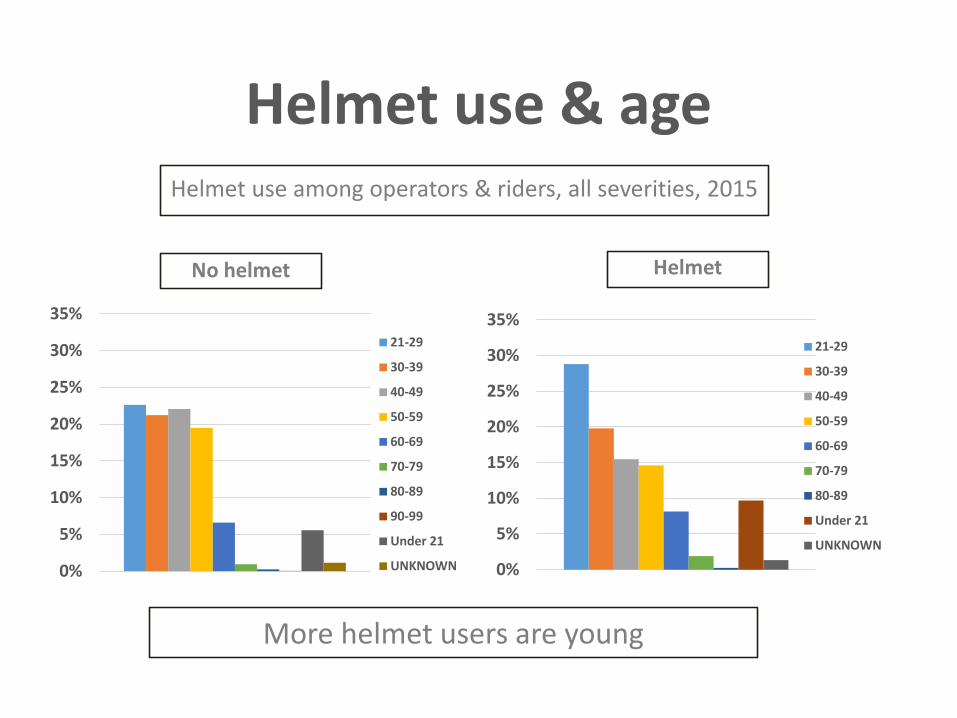
Helmet use & age
0%
5%
10%
15%
20%
25%
30%
35%21-29
30-39
40-49
50-59
60-69
70-79
80-89
90-99
Under 21
UNKNOWN 0%
5%
10%
15%
20%
25%
30%
35%21-29
30-39
40-49
50-59
60-69
70-79
80-89
Under 21
UNKNOWN
No helmet Helmet
Helmet use among operators & riders, all severities, 2015
More helmet users are young

Helmet use
Next: After accounting for other factors, is helmet useassociated with more severe injury?
51%46%
38%34% 33%
FATAL INCAP NON-INCAP POSSIBLE NO INJURY
Percentage of Operators & Riders Not Using a Helmet by Severity, 2015

Alcohol & helmet use
55%
27%
NEGATIVE ALCOHOL POSITIVE ALCOHOL
Percent of operators using helmets by alcohol result, 2015
Helmet use higher in non-drinkers
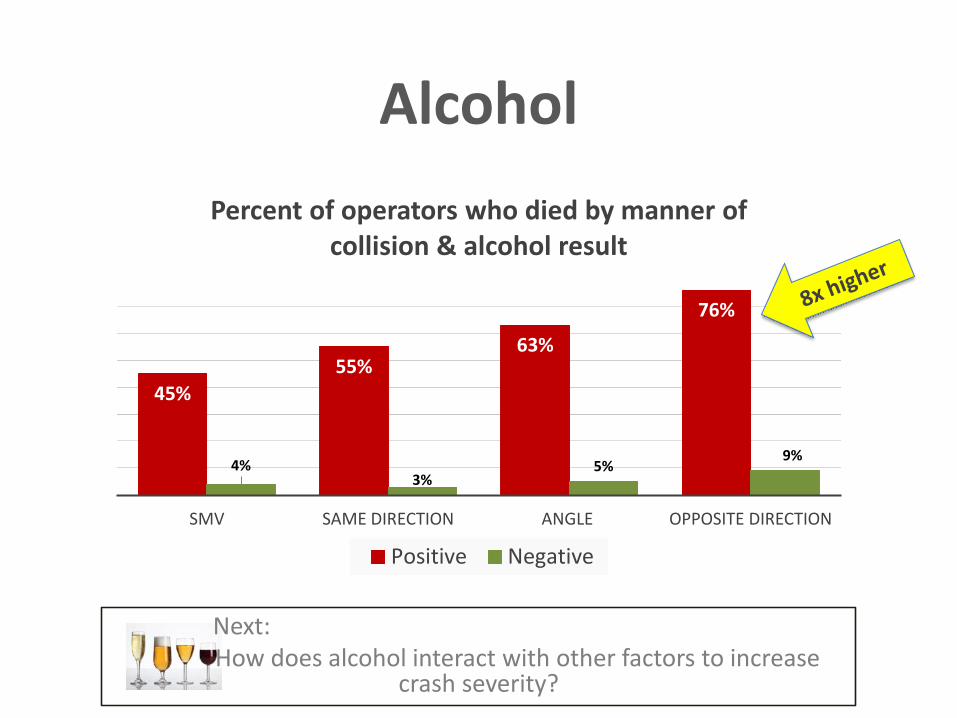
Alcohol
Next: How does alcohol interact with other factors to increase
crash severity?
45%55%
63%
76%
4%3%
5%9%
SMV SAME DIRECTION ANGLE OPPOSITE DIRECTION
Percent of operators who died by manner of collision & alcohol result
Positive Negative

At fault

22%
78%
Vehicle At FaultMotorcycle Fatalities, 2014
Car
Motorcycle
Next:Is this the same for nonfatal crashes?
28% Cars at fault FTY ROW to motorcycle
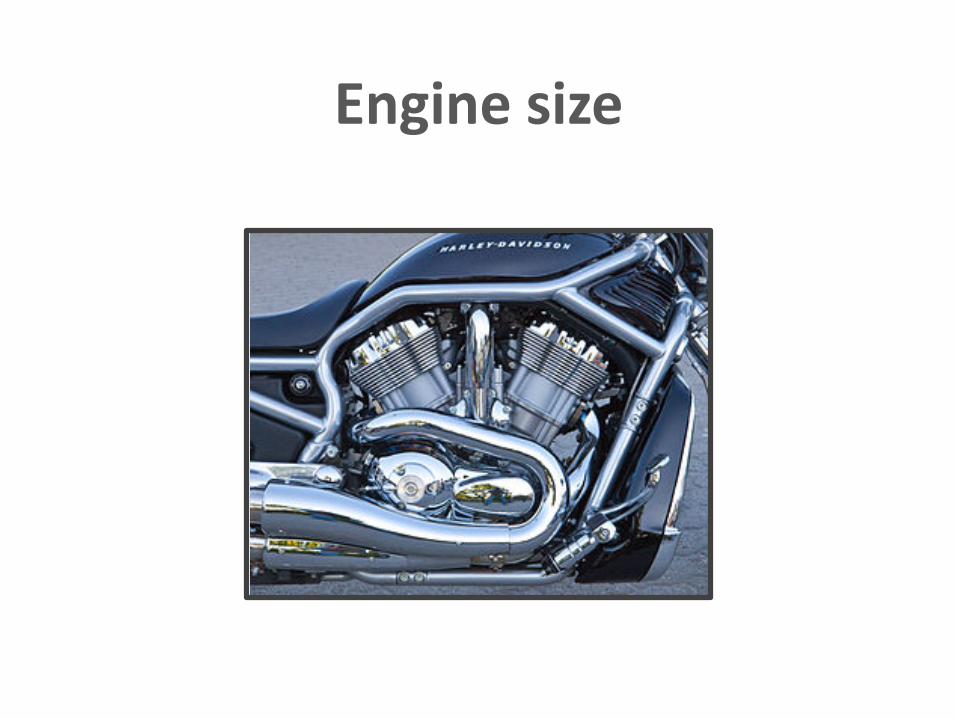
Engine size
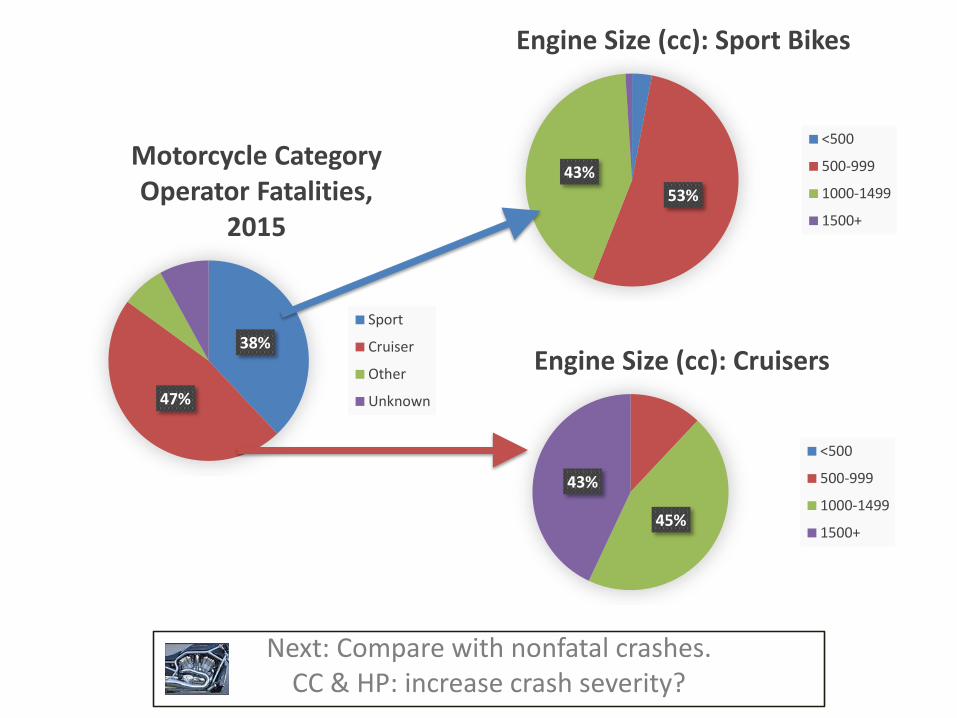
38%
47%
Motorcycle Category Operator Fatalities,
2015
Sport
Cruiser
Other
Unknown
Next: Compare with nonfatal crashes.CC & HP: increase crash severity?
45%
43%
Engine Size (cc): Cruisers
<500
500-999
1000-1499
1500+
53%43%
Engine Size (cc): Sport Bikes
<500
500-999
1000-1499
1500+

Curve involvement

0%
5%
10%
15%
20%
25%
30%
35%
40%
FATAL A B C PDO
38%
27%25% 24%
29%
24% 23% 22% 22% 21%
Normal Curve Involvement By Crash Severity, Single Vehicle, On System, 2015
Motorcycle Car
What are the characteristics of curves where crashes & deaths are occurring?

Closing
September2016

References & Resources
GHSA. 2015. Motorcyclist Traffic Fatalities by State: 2015 Preliminary Data. Available at: http://www.ghsa.org/files/pubs/spotlights/motorcycles_2015.pdf
III. 2016. Motorcycle Crashes. Available at: http://www.iii.org/issue-update/motorcycle-crashes
Motorcycle Accident Cause Factors and Identification of Countermeasures, Volume 1: Technical Report, Hurt, H.H., Ouellet, J.V. and Thom, D.R., Traffic Safety Center, University of Southern California, Los Angeles, California 90007, Contract No. DOT HS-5-01160, January 1981 (Final Report).