Embed Size (px)
Citation preview

I T O P T I M I Z A T I O N I N S I G H T S
A GUIDE TO I.T. SERVICE OPTIMIZATION MATURITYW H I T E P A P E RBY PER BAUER
TeamQuest specializes in IT Service Optimization
WHITEPAPER

A GUIDE TO I.T. SERVICE OPTIMIZATION MATURITY
Businesses are constantly putting pressure on price, performance and reliability of IT services and infrastructure. Recent adoption of technologies such as virtualization, dynamic computing and various forms of cloud computing coupled with changing management paradigms has raised the stakes even more. This ruthless drive for efficiency calls for the use of more sophisticated optimization methods. It is safe to say that if you don’t, chances are you will be “done” by others who do.
Use automated analytics that are closely aligned with overall business objectives and supported by mature processes to stay ahead of the game.

A GUIDE TO I.T. SERVICE OPTIMIZATION MATURITY
3
ANALYTICS
Analytics is the transformation of raw data into contextualized and actionable “intelligence” to guide better decision making. As such, it clearly has a big play in any optimization initiative. Since the scope of what you can achieve with analytics is rather wide, the following definition of sub-disciplines is often used:
This forms a hierarchy that yields incremental improvements where each sub discipline builds upon the capabilities provided by the level preceding it. The more effort you put in, the more valuable intelligence you will gain.
What does it mean? Type of question answered
Descriptive Analytics Process incoming datato drive actions and alerts
“What do we have andwhat is it doing?”
Diagnostic Analytics Data mining to discover patterns and identify root causes “Why is it doing this?”
Predictive Analytics Calculating optimal configurations for current and future needs
“When will it breakand why?”
Prescriptive Analytics Propose optimal actionsbased on predictions
“What should we doto prevent it?”
A GUIDE TO I.T. SERVICE OPTIMIZATION MATURITY
4
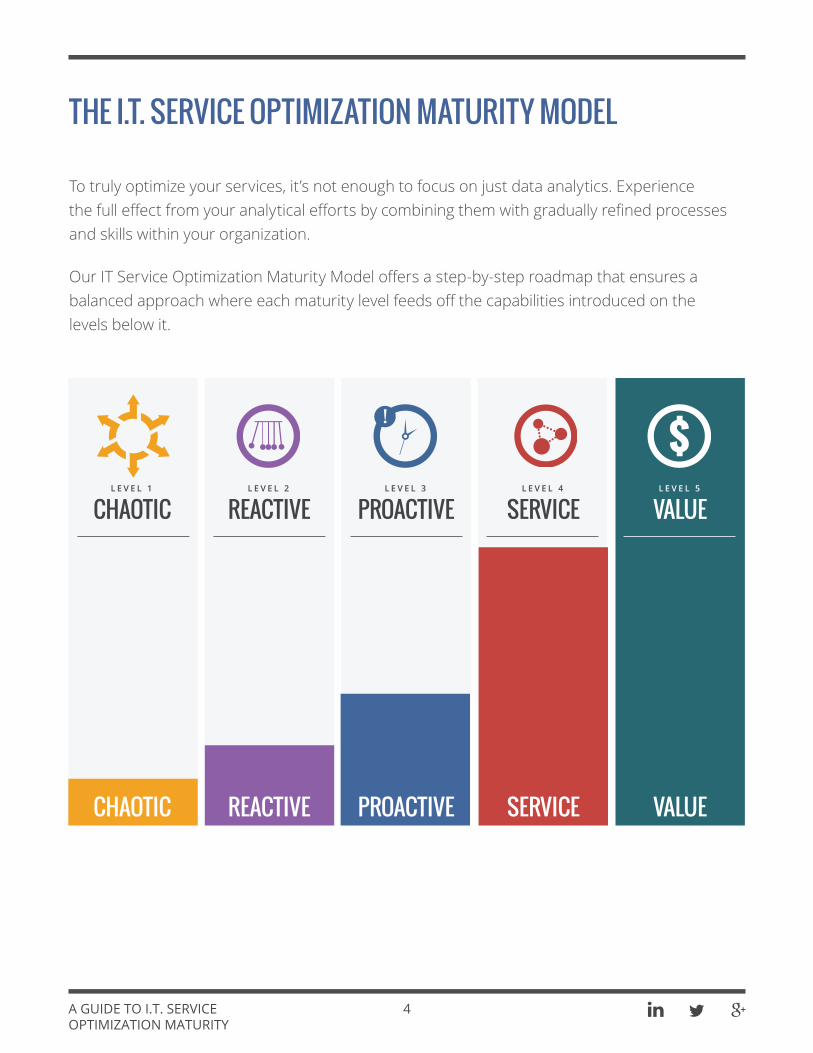
THE I.T. SERVICE OPTIMIZATION MATURITY MODEL
To truly optimize your services, it’s not enough to focus on just data analytics. Experience the full effect from your analytical efforts by combining them with gradually refined processes and skills within your organization.
Our IT Service Optimization Maturity Model offers a step-by-step roadmap that ensures a balanced approach where each maturity level feeds off the capabilities introduced on the levels below it.
L E V E L 1
CHAOTICL E V E L 2
REACTIVEL E V E L 3
PROACTIVEL E V E L 4
SERVICEL E V E L 5
VALUE
CHAOTIC REACTIVE PROACTIVE SERVICE VALUE
!
A GUIDE TO I.T. SERVICE OPTIMIZATION MATURITY
5
LEVEL 1 — CHAOTIC
Why are you at this level?
Any effort to improve service quality is usually triggered by incidents, brought to your attention by users or customers complaining. Resolving the issue often becomes a personal task assigned to individuals with the proper skills. However, relying on heroic contributions from individuals does not lead to the consistent, sustainable improvements desired by the business.
Access to empirical data about how the different components and layers of the infrastructure are being used, now and in the past, is a requirement for improved service quality. With technology trends like virtualization and software defined data centers, the number of components and their interdependencies has increased dramatically—and is constantly changing. If you only have access to data for a subset of those components and limited understanding of how they fit together, any optimization effort becomes a complete hit and miss exercise.
Since IT service optimization takes a conscious effort, operating at this level will not lead to any significant or repeatable improvement in your ability to deliver services efficiently. You will remain a victim to “unknown” circumstances and unexpected events until you make an effort to increase your maturity.
At this level of maturity it’s the lack of purpose that stands out the most. You are missing a consistent strategy for managing and improving the quality of your services.

A GUIDE TO I.T. SERVICE OPTIMIZATION MATURITY
6
LEVEL 2 — REACTIVE
How do you get to this level?
The first step is to make sure you have access to detailed information about the behavior of the components underpinning your services. Ideally that data should be available from a single source, but in reality you will probably have to use multiple different data sources (due to differing tools or technology silos).
The use of descriptive analytics, designed to monitor components and send alerts based on predefined thresholds, improves your ability to make timely identification and quick mitigation of incidents.
This systematic analysis of incoming data, expanded to include an increased number of components and data sources, will also put focus on the need to automate most of the activities. Automation of the analytical capabilities will help you improve efficiency in terms of staffing and will lead to more consistent and repeatable procedures. Automation simply becomes a requirement for keeping up with the pace at which data is being produced.
What does this mean to your business?
Ongoing systematic analysis of incoming data will allow you to react faster to incidents in your operating environment. This increased focus on faster problem detection and resolution will have a positive impact on the quality of your services and will contribute to increased availability.
Moving up to the Reactive level is primarily about improving your ability to react to events in your environment in a consistent and timely fashion, but also about ensuring that you have enough information to allow for proper handling of those events.
A GUIDE TO I.T. SERVICE OPTIMIZATION MATURITY
7
You will also get a better understanding of how the existing infrastructure is being utilized at a component level, allowing you to correctly address cases of under- or over-provisioning.
What can still be improved?
Having access to real time component-level data will only take you so far, because you will not be able to predict recurring incidents. As a result, you are still spending most of your time reacting to things, rather than trying to identify and eliminate the root cause. You will continue to deal with the same amount of incidents, only at a higher speed.
Another area of improvement is around the strict focus on technical components. Without understanding the context surrounding services that are currently making use of a component, it’s hard to properly prioritize incidents in order of importance to the business. Overall service quality is really what you should focus on - limiting yourself to a narrow component view will lead to misdirected efforts.
LEVEL 3 – PROACTIVE
You have already developed an ability to efficiently react to events. Taking the next step involves discovering patterns among those events and “learning” from the empirical data you have available. Once you master that, you will be able to proactively mitigate risks before they have a negative impact on your services. This also has the potential of raising overall efficiency, but more about that later..
!
A GUIDE TO I.T. SERVICE OPTIMIZATION MATURITY
8
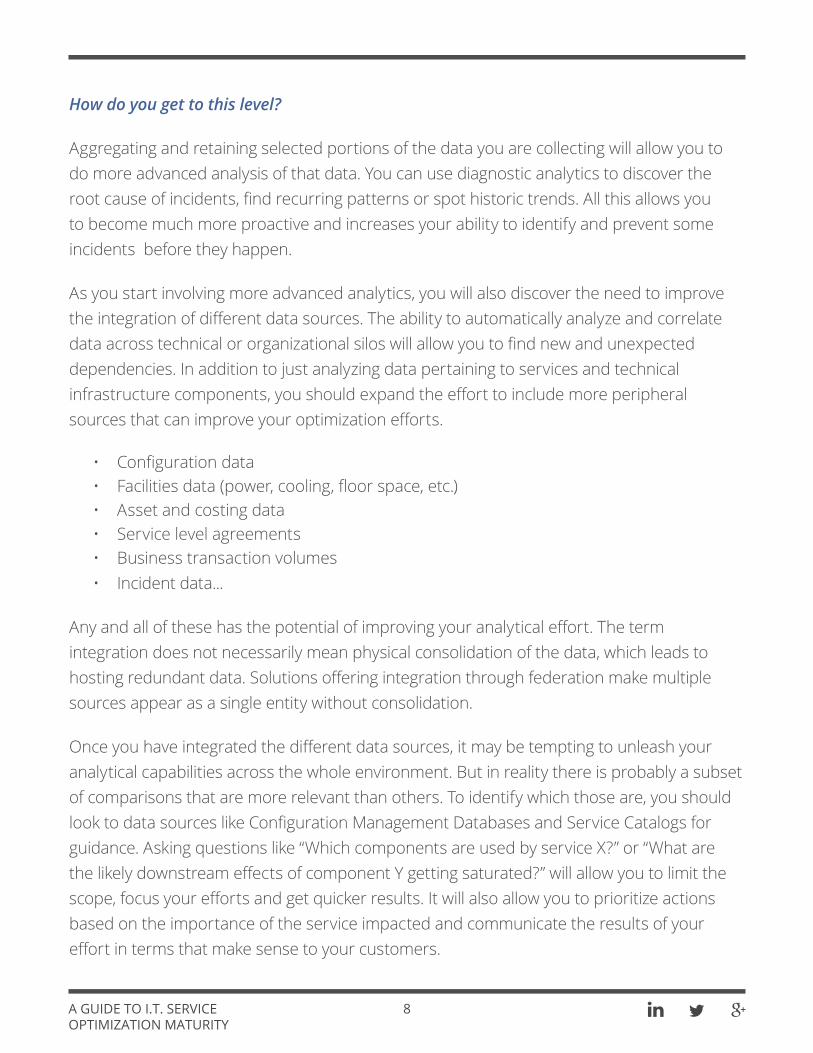
How do you get to this level?
Aggregating and retaining selected portions of the data you are collecting will allow you to do more advanced analysis of that data. You can use diagnostic analytics to discover the root cause of incidents, find recurring patterns or spot historic trends. All this allows you to become much more proactive and increases your ability to identify and prevent some incidents before they happen.
As you start involving more advanced analytics, you will also discover the need to improve the integration of different data sources. The ability to automatically analyze and correlate data across technical or organizational silos will allow you to find new and unexpected dependencies. In addition to just analyzing data pertaining to services and technical infrastructure components, you should expand the effort to include more peripheral sources that can improve your optimization efforts.
• Configuration data • Facilities data (power, cooling, floor space, etc.)• Asset and costing data• Service level agreements• Business transaction volumes• Incident data...
Any and all of these has the potential of improving your analytical effort. The term integration does not necessarily mean physical consolidation of the data, which leads to hosting redundant data. Solutions offering integration through federation make multiple sources appear as a single entity without consolidation.
Once you have integrated the different data sources, it may be tempting to unleash your analytical capabilities across the whole environment. But in reality there is probably a subset of comparisons that are more relevant than others. To identify which those are, you should look to data sources like Configuration Management Databases and Service Catalogs for guidance. Asking questions like “Which components are used by service X?” or “What are the likely downstream effects of component Y getting saturated?” will allow you to limit the scope, focus your efforts and get quicker results. It will also allow you to prioritize actions based on the importance of the service impacted and communicate the results of your effort in terms that make sense to your customers.
A GUIDE TO I.T. SERVICE OPTIMIZATION MATURITY
9
What does this mean to your business?
Adopting a more proactive optimization strategy will lead to improved efficiency. A better understanding of priorities, component dependencies and forecasted future behavior based on historical trends will build your confidence and allow you to increase the utilization of individual components. By systematically “sweating” your assets harder, you can defer or altogether avoid investments in new capacity resulting in overall improved efficiency.
More advanced analytics intelligently applied to your collective data will also increase your ability to proactively avoid incidents and further improve the quality of your services further.
What can still be improved?
Operating at the Proactive level means that you will have gained some ability to forecast and react to events that will happen in the near future. But these predictions are based on extrapolation of past behavior and may therefore lack in general applicability. Scenarios with a longer planning horizon or scenarios involving non-linear growth caused by outside factors not represented in past behavior are still a major challenge to predict accurately.
Another weakness is that most of the analysis is based on comparisons against predefined thresholds. Unless you use thresholds that are specifically tailored for each individual component or service (which is virtually impossible in an environment of any reasonable size), the conclusions may not be relevant. Creating indicators of service health based on response times and latency will address this.

A GUIDE TO I.T. SERVICE OPTIMIZATION MATURITY
10
LEVEL 4 — SERVICE
How do you get to this level?
By thorough analysis of empirical data, combined with the use of sophisticated mathematical algorithms, you can make accurate predictions to further increase your efficiency and better manage the quality of your services. The use of predictive analytics will allow you to assess different “what if ” scenarios and base your decisions on those predictions. Modeling techniques can answer questions like, “What will happen to the response time of this service if we increase the number of transaction by 10%?”
The traditional approach has been to perform this type of analysis only for selected services, generally the ones most important to the business. Before you start crunching the data, engage with stakeholders in various parts of the business to define scenarios that are relevant and realistic. Building those relationships outside of IT is crucial and while this will be a process with a lot of manual steps involved, it has the potential to greatly improve the efficiency and quality of the identified services if done correctly.
But sometimes the above strategy is simply not attainable. You may not have access to people that can define the relevant scenarios. Or your services may be underpinned by a highly dynamic infrastructure, leading to constantly shifting configurations (making assessments based on a snapshot irrelevant). Or maybe the sheer size of your operation in relation to your staffing resources makes it impossible to accomplish.
So far, any planning and proactive measures have been based on extrapolation of trends in historic data. But there are more powerful and accurate ways of making predictions, especially if the scenarios involve nonlinear growth or simultaneous changes to multiple components. By employing the next level of analytics, you can accurately predict the outcome of such scenarios and offer powerful service quality indicators.
A GUIDE TO I.T. SERVICE OPTIMIZATION MATURITY
11
Do not despair; you can still make good use of predictive analytics. Using the available data about your services, you can identify average historical growth rates. Extrapolating that growth profile into the future will give you a realistic scenario to evaluate per service. Since most of your analytics can be automated at this stage (we started to build that capability already at the Reactive level), you can afford to run this across all your services. This will provide a thorough assessment of service health and the possibility to predict which services will be in a state of “noncompliance” based on the evaluated scenario. This kind of macro-level predictive analytics approach, where you can focus on the exceptions, will allow you to extend the reach of your optimization efforts and cover a fairly large scope with a reasonable effort. Starting out with a wide and automated standard assessment, you can then drill down into services that stand out only when needed.
What does this mean to your business?
A focus on making more accurate predictions, either based on manually crafted scenarios covering individual services or in the shape of a wide assessment aimed at identifying outliers, will greatly improve your ability to plan ahead. A good understanding of when a service will need additional resources will allow you to make just-in-time investments and stay closer to the true capacity need.
These insights will also allow you to start impacting the demand for a service. Rather than strictly focusing on the supply of capacity, you can look for ways to optimize and influence how resources are being consumed.
What can still be improved?
By using predictive analytics you can answer a question like, “How will this scenario impact my ability to continue to support the business?” If the conclusion is that your ability is impacted, the analysis will likely give some hints as to what actions are needed to maintain the desired service level. The next level of maturity is about developing a capability to automatically rank and prescribe actions in response to predicted events.

A GUIDE TO I.T. SERVICE OPTIMIZATION MATURITY
12
LEVEL 5 — VALUE
How do you get to this level?
The Value level is characterized by an increased focus on business alignment. Along with the increased maturity, you will gradually move away from the role of being just the expert that solves intricate technical problems and will now be ready to take the final steps towards offering comprehensive decision support that is aligned with the business objectives of your organization.
In more direct terms, this means adding an ability to continuously optimize your operation through proactive automated actions. In addition to predicting the timing and consequences of a forecasted scenario, prescriptive analytics will help you find the optimal action for dealing with those consequences. If the result is a number of different options, they need to be ranked in order of feasibility and alignment with business objectives. The definition of business objectives and a set of rules for how to relate them to concrete actions becomes a key ability.
The increased understanding of business objectives and how they relate to your services will also allow you to do better service valuation. Service cost can be weighed against the business benefits. Using that relationship as input to your optimization efforts (together with the ever so important business objectives) will allow you to prioritize and focus your actions even further.
To reach this maturity level, you should leverage the decision support produced at the lower levels into an ability to suggest decision options on how to take advantage of a future opportunity or mitigate future risk. The suggested actions should of course be aligned with your overall business objectives.

A GUIDE TO I.T. SERVICE OPTIMIZATION MATURITY
13
What does this mean to your business?
By analyzing a set of scenarios, you can then propose actions that will lead to further optimization, providing answers to questions like “How can we do this better?” How the actions get carried out is normally a matter of scale. High impact actions requiring thorough planning may remain manual. But smaller corrective actions aimed at continuous service improvement should be automated. Throughout, all services will be optimized to offer maximum value to the business.
What can still be improved?
Even though the highest level of IT service optimization maturity has been reached, there is a continuous need to analyze and realign your processes to changes in the business needs.
SUMMARY
The concept of IT service optimization is often associated with increased efficiency and reduced risk, two forces that will drive valuable improvements. But without a full understanding of the business objectives and how IT needs to be aligned with those, full optimization is not possible. The IT Service Optimization Maturity Model will allow you to gradually improve without losing track of any important aspect.
ABOUT THE AUTHOR
Per Bauer leads the TeamQuest Global Services team, supporting customers worldwide with training, implementation, analysis, management and strategic services that address their planning and delivery needs. Bauer also leads the presales technical support team in the EMEA division, ensuring that sales account managers and customers have technical product advice and support during sales discussions.
A GUIDE TO I.T. SERVICE OPTIMIZATION MATURITY
© 2015 TeamQuest Corporation. All Rights Reserved. |
WORLDWIDE HE ADQUAR TERS
UNITED STATESTeamQuest CorporationOne TeamQuest WayClear Lake, IowaUSA50428+1 641-357-2700US Toll Free: +1 800-551-8326
[email protected]@[email protected]
E UR OP E , MIDDL E E A S T, A F R ICA :
S W E DE NBox 1125405 23 GothenburgVisiting Address:Stora Badhusgatan 18-20411 21 Gothenburg+46 (0)31 80 95 00
GE R M A N YFrankfurtHerriotstraße 160528 Frankfurt+49 (0)69 6 77 33 466Support: +49 (0)69 1 20 09 550
F R A NCEParisLa Grande Arche,Paroi NordLa Défense92044 Paris+33 (1)40 90 30 93Support: +33 (1)83 79 00 47
UNI T E D K INGD OMOxford7200 The QuorumOxford Business Park NorthGarsington RoadOxford OX4 2JZ+44 (0) 1865 481 424Support: +44 (0) 2036 300 211
L OND ONLakeside House1 Furzeground WayStockley ParkUxbridgeUB11 1BD+44 (0) 1865 481 424
L AT IN A ME R ICA :
ME X IC O Paseo de la Reforma 350Col. JuárezMexico City 06600+52 55 2881 6812
A S I A PACIF IC :
HONG KONG35/F Central Plaza18 Harbour RoadWanchai+852 2824 8510
TeamQuest and the TeamQuest logo are registered trademarks in the US, EU, and elsewhere. All other trademarks and service marks are the property of
their respective owners. No use of a third-party mark is to be construed to mean such mark’s owner endorses TeamQuest products or services. The names,
places and/or events used in this publication are purely fictitious and are not intended to correspond to any real individual, group, company or event. Any
similarity or likeness to any real individual, company or event is purely coincidental and unintentional.
NO WARRANTIES OF ANY NATURE ARE EXTENDED BY THE DOCUMENT. Any product and related material disclosed herein are only furnished pursuant and
subject to the terms and conditions of a license agreement. The only warranties made, remedies given, and liability accepted by TeamQuest, if any, with
respect to the products described in this document are set forth in such license agreement. TeamQuest cannot accept any financial or other responsibility
that may be the result of your use of the information in this document or software material, including direct, indirect, special, or consequential damages. You
should be very careful to ensure that the use of this information and/or software material complies with the laws, rules, and regulations of the jurisdictions
with respect to which it is used.
The information contained herein is subject to change without notice. Revisions may be issued to advise of such changes and/or additions. U.S. Government
Rights. All documents, product and related material provided to the U.S. Government are provided and delivered subject to the commercial license rights and
restrictions described in the governing license agreement. All rights not expressly granted therein are reserved.
connect with TeamQuest: