Embed Size (px)
Citation preview

5 Ways
DATA VISUALIZATION Enhances Client Projects

“Data doesn’t provide executives and other decision makers
with VALUABLE INSIGHTS on its own. The data must
be gathered, organized, made interpretable, and then
analyzed and acted on to provide any meaningful value.
Brian Gentile
PharmaAcumen

1 Understand Text Faster
PharmaAcumen
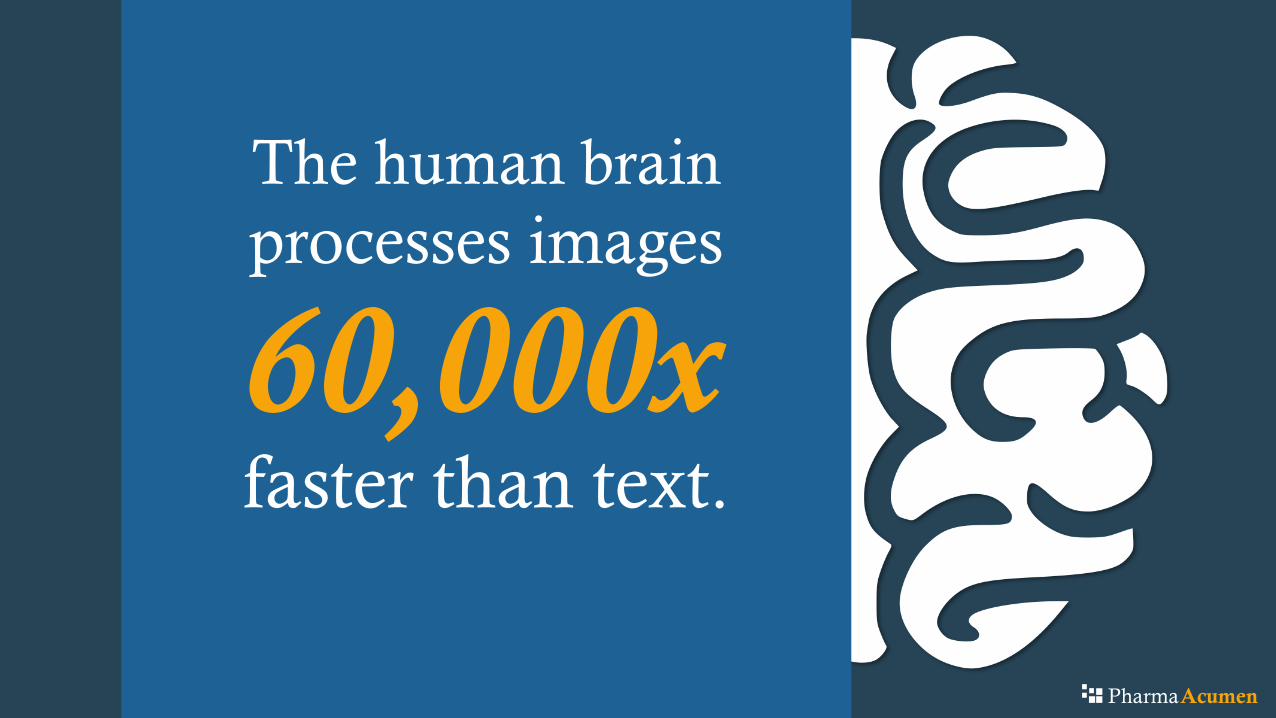
The human brain
processes images
60,000xfaster than text.
PharmaAcumen
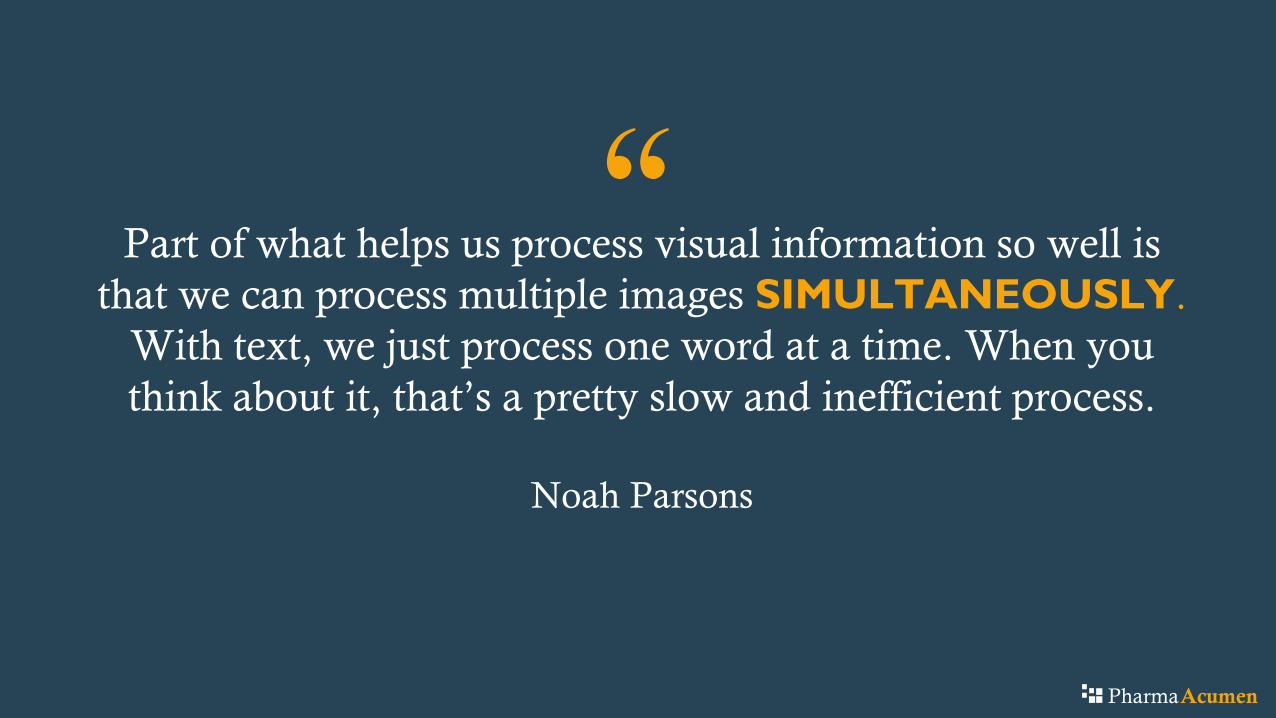
“Part of what helps us process visual information so well is
that we can process multiple images SIMULTANEOUSLY.
With text, we just process one word at a time. When you
think about it, that’s a pretty slow and inefficient process.
Noah Parsons
PharmaAcumen

An Example
PharmaAcumen

An Example
The road up ahead is seriously
curvy! Make sure you are
traveling at a safe speed to avoid
possible injury to your vehicle,
yourself, and your passengers.
PharmaAcumen

The road up ahead is seriously
curvy! Make sure you are
traveling at a safe speed to avoid
possible injury to your vehicle,
yourself, and your passengers.
The visual
communicates its
message much more
efficiently than the text.
An Example
PharmaAcumen

2 Detect Hidden Features
PharmaAcumen
“Important stories live in our data and data visualization
is a powerful means to DISCOVER and understand
these stories, and then to present them to others.
Stephen Few
PharmaAcumen
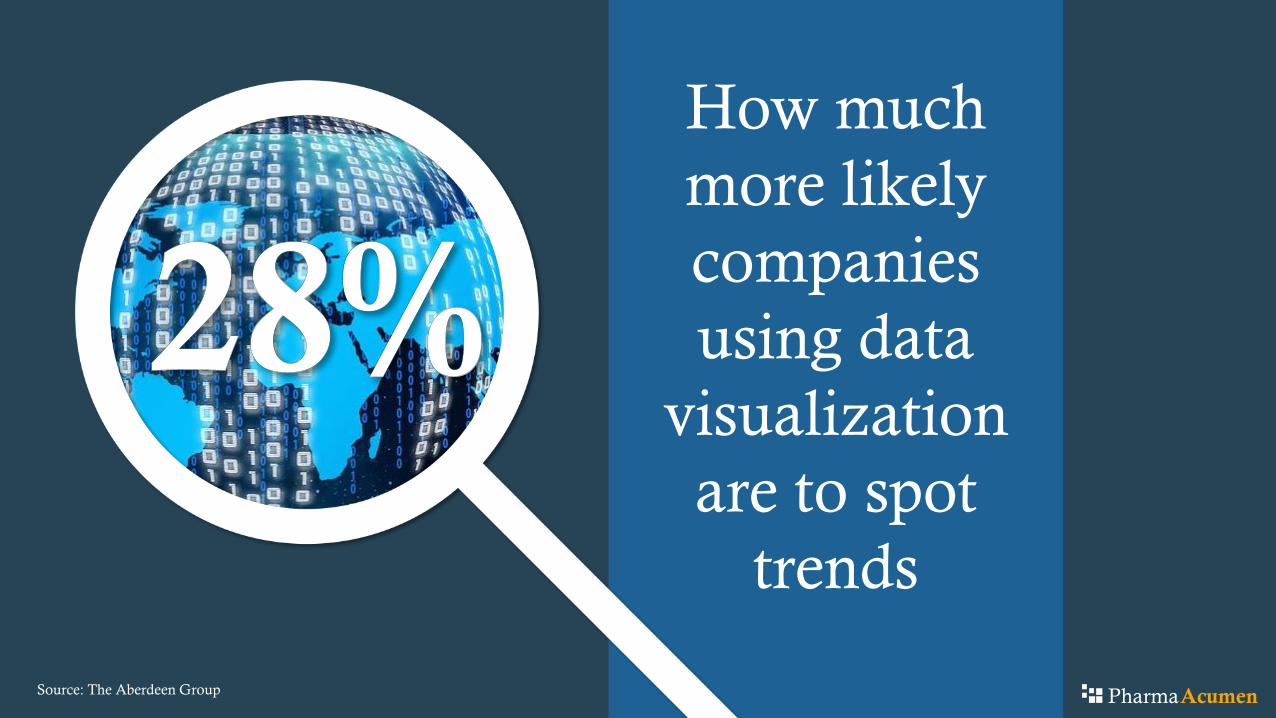
How much
more likely
companies
using data
visualization
are to spot
trends
PharmaAcumenSource: The Aberdeen Group
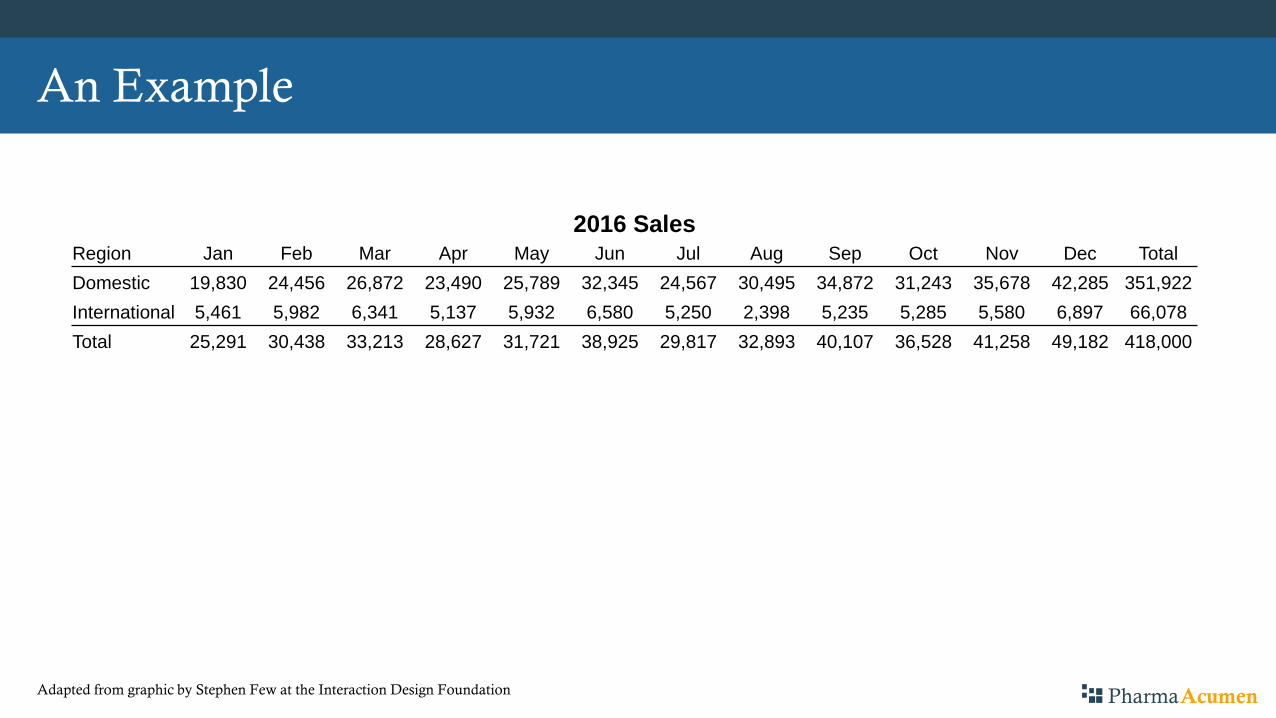
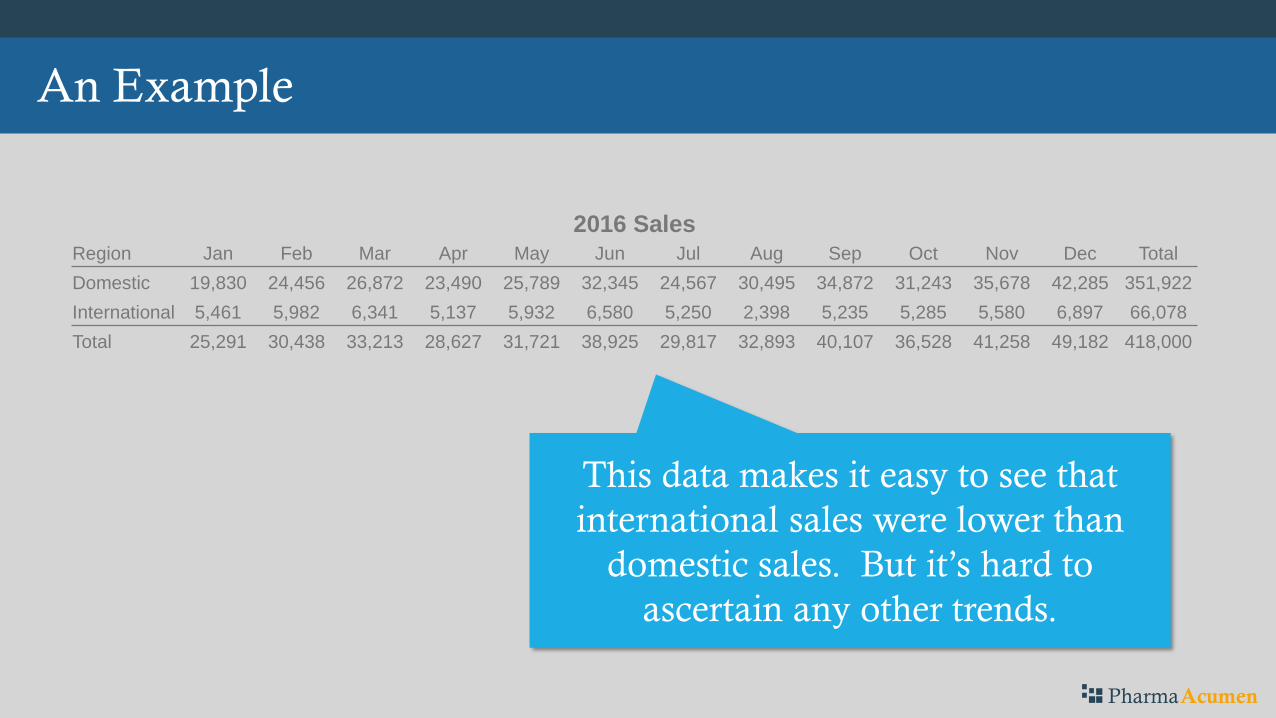
An Example
2016 SalesRegion Jan Feb Mar Apr May Jun Jul Aug Sep Oct Nov Dec Total
Domestic 19,830 24,456 26,872 23,490 25,789 32,345 24,567 30,495 34,872 31,243 35,678 42,285 351,922
International 5,461 5,982 6,341 5,137 5,932 6,580 5,250 2,398 5,235 5,285 5,580 6,897 66,078
Total 25,291 30,438 33,213 28,627 31,721 38,925 29,817 32,893 40,107 36,528 41,258 49,182 418,000
PharmaAcumenAdapted from graphic by Stephen Few at the Interaction Design Foundation
2016 SalesRegion Jan Feb Mar Apr May Jun Jul Aug Sep Oct Nov Dec Total
Domestic 19,830 24,456 26,872 23,490 25,789 32,345 24,567 30,495 34,872 31,243 35,678 42,285 351,922
International 5,461 5,982 6,341 5,137 5,932 6,580 5,250 2,398 5,235 5,285 5,580 6,897 66,078
Total 25,291 30,438 33,213 28,627 31,721 38,925 29,817 32,893 40,107 36,528 41,258 49,182 418,000
An Example
This data makes it easy to see that
international sales were lower than
domestic sales. But it’s hard to
ascertain any other trends.
PharmaAcumen

An Example
0
5,000
10,000
15,000
20,000
25,000
30,000
35,000
Jan Feb Mar Apr May Jun Jul Aug Sep Oct Nov Dec
2016 Sales
Domestic
International
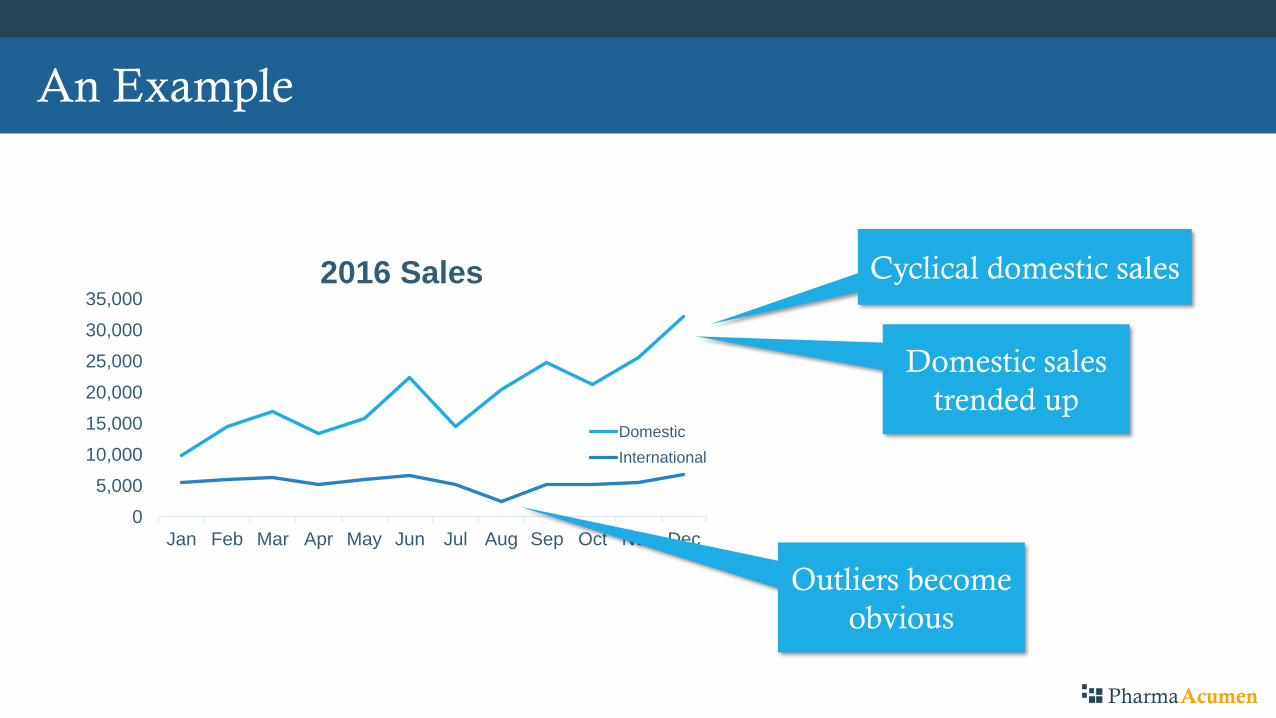
A simple chart makes trends
easy to identify.
PharmaAcumenAdapted from graphic by Stephen Few at the Interaction Design Foundation
0
5,000
10,000
15,000
20,000
25,000
30,000
35,000
Jan Feb Mar Apr May Jun Jul Aug Sep Oct Nov Dec
2016 Sales
Domestic
International
An Example
Cyclical domestic sales
Domestic sales
trended up
Outliers become
obvious
PharmaAcumen

3 Create Value
PharmaAcumen
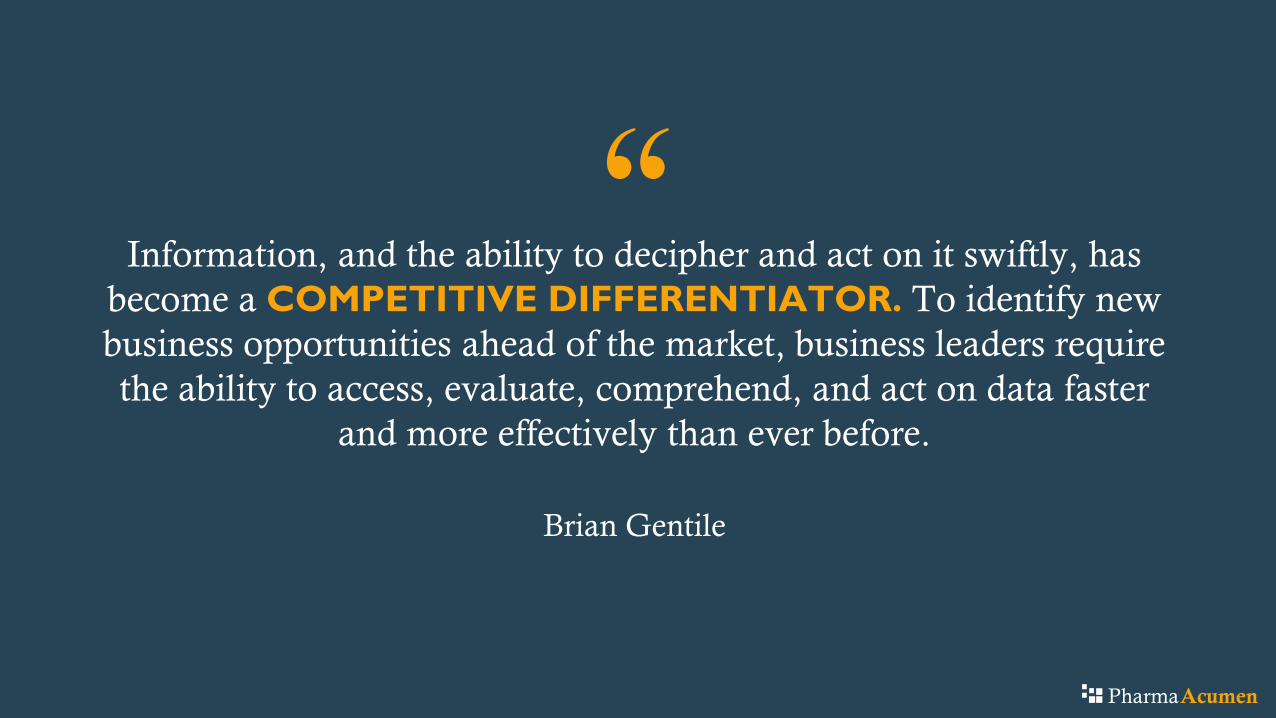
“Information, and the ability to decipher and act on it swiftly, has
become a COMPETITIVE DIFFERENTIATOR. To identify new
business opportunities ahead of the market, business leaders require
the ability to access, evaluate, comprehend, and act on data faster
and more effectively than ever before.
Brian Gentile
PharmaAcumen
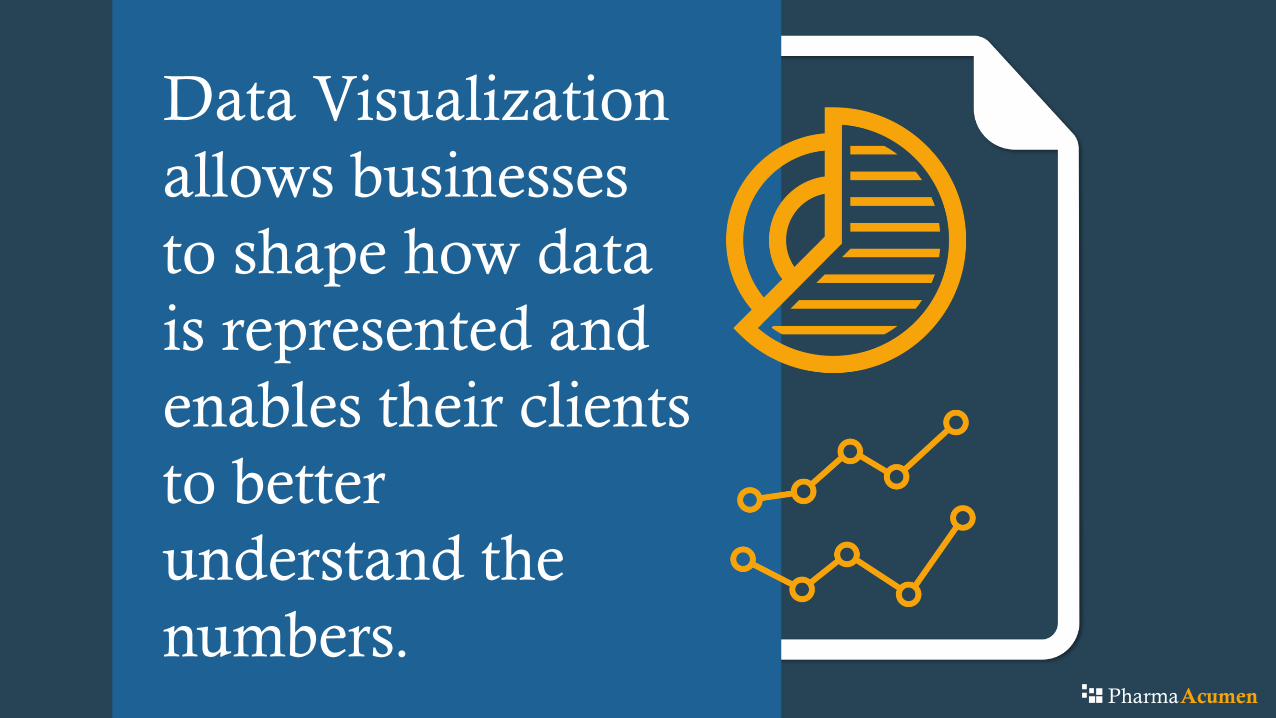
Data Visualization
allows businesses
to shape how data
is represented and
enables their clients
to better
understand the
numbers. PharmaAcumen
An Example
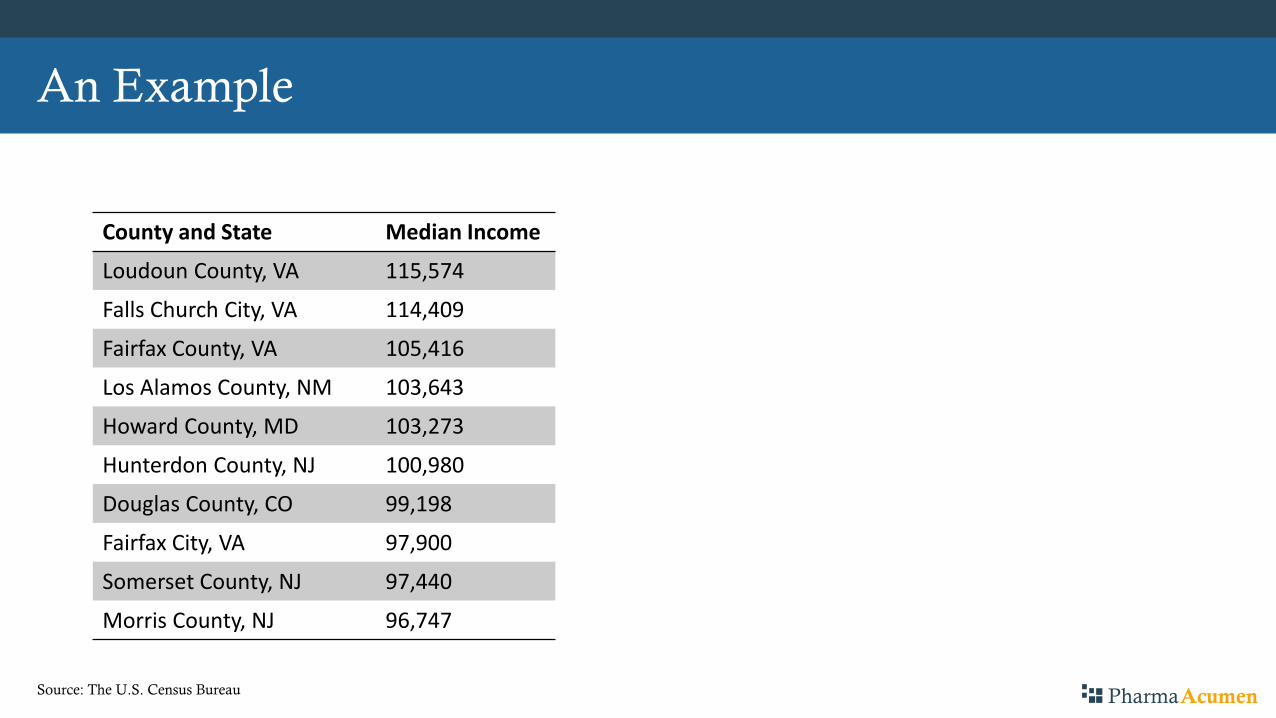
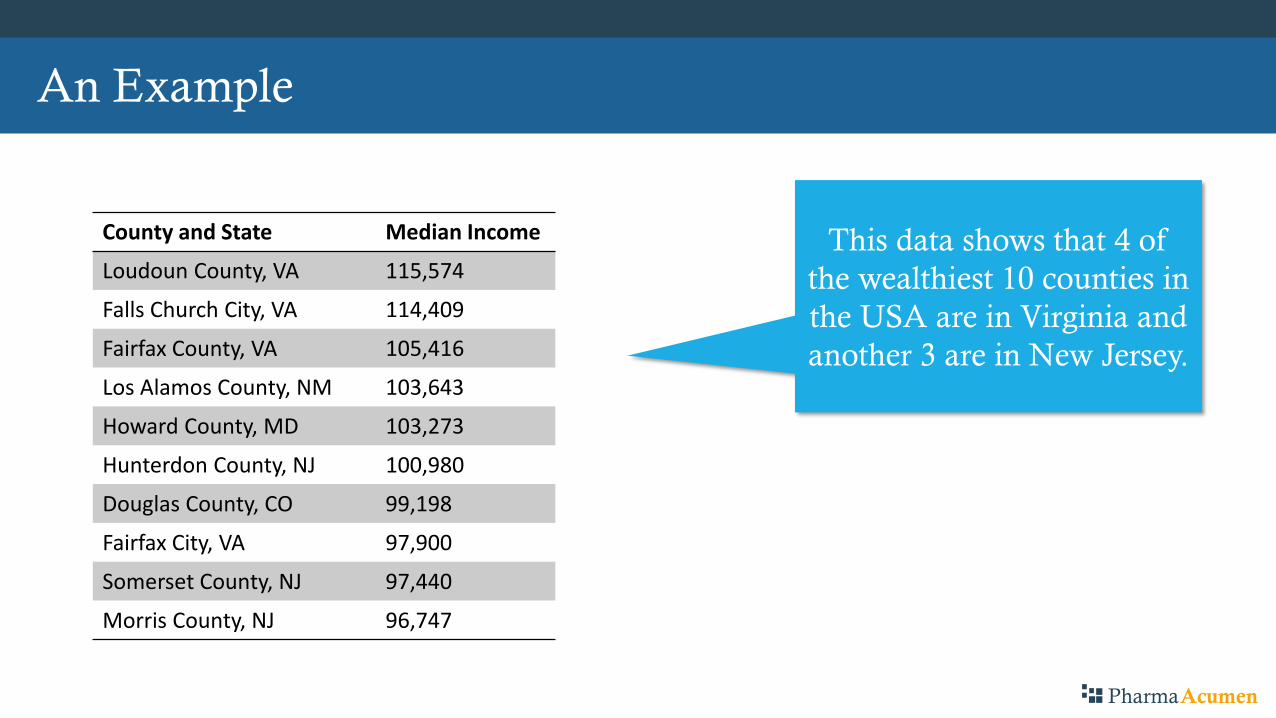
County and State Median Income
Loudoun County, VA 115,574
Falls Church City, VA 114,409
Fairfax County, VA 105,416
Los Alamos County, NM 103,643
Howard County, MD 103,273
Hunterdon County, NJ 100,980
Douglas County, CO 99,198
Fairfax City, VA 97,900
Somerset County, NJ 97,440
Morris County, NJ 96,747
PharmaAcumenSource: The U.S. Census Bureau
An Example
County and State Median Income
Loudoun County, VA 115,574
Falls Church City, VA 114,409
Fairfax County, VA 105,416
Los Alamos County, NM 103,643
Howard County, MD 103,273
Hunterdon County, NJ 100,980
Douglas County, CO 99,198
Fairfax City, VA 97,900
Somerset County, NJ 97,440
Morris County, NJ 96,747
This data shows that 4 of
the wealthiest 10 counties in
the USA are in Virginia and
another 3 are in New Jersey.
PharmaAcumen
An Example
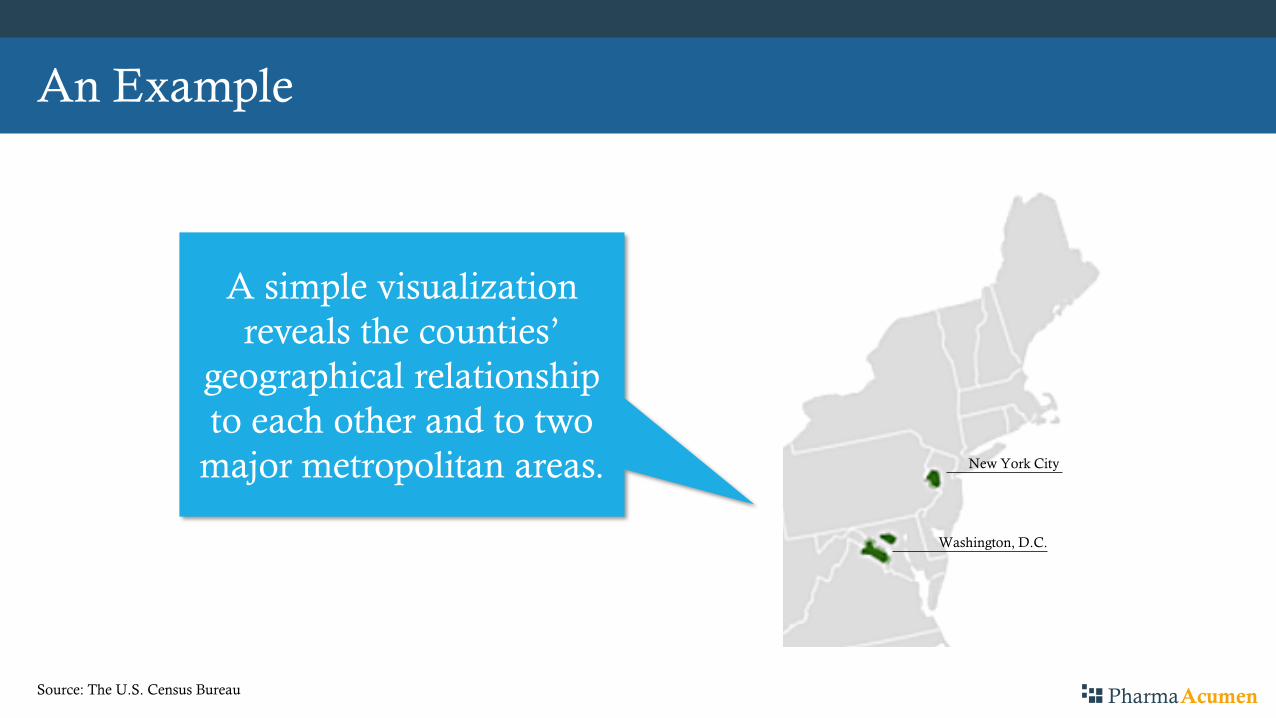
A simple visualization
reveals the counties’
geographical relationship
to each other and to two
major metropolitan areas.
Washington, D.C.
New York City
PharmaAcumenSource: The U.S. Census Bureau
County and State Median Income
Loudoun County, VA 115,574
Falls Church City, VA 114,409
Fairfax County, VA 105,416
Los Alamos County, NM 103,643
Howard County, MD 103,273
Hunterdon County, NJ 100,980
Douglas County, CO 99,198
Fairfax City, VA 97,900
Somerset County, NJ 97,440
Morris County, NJ 96,747
An Example
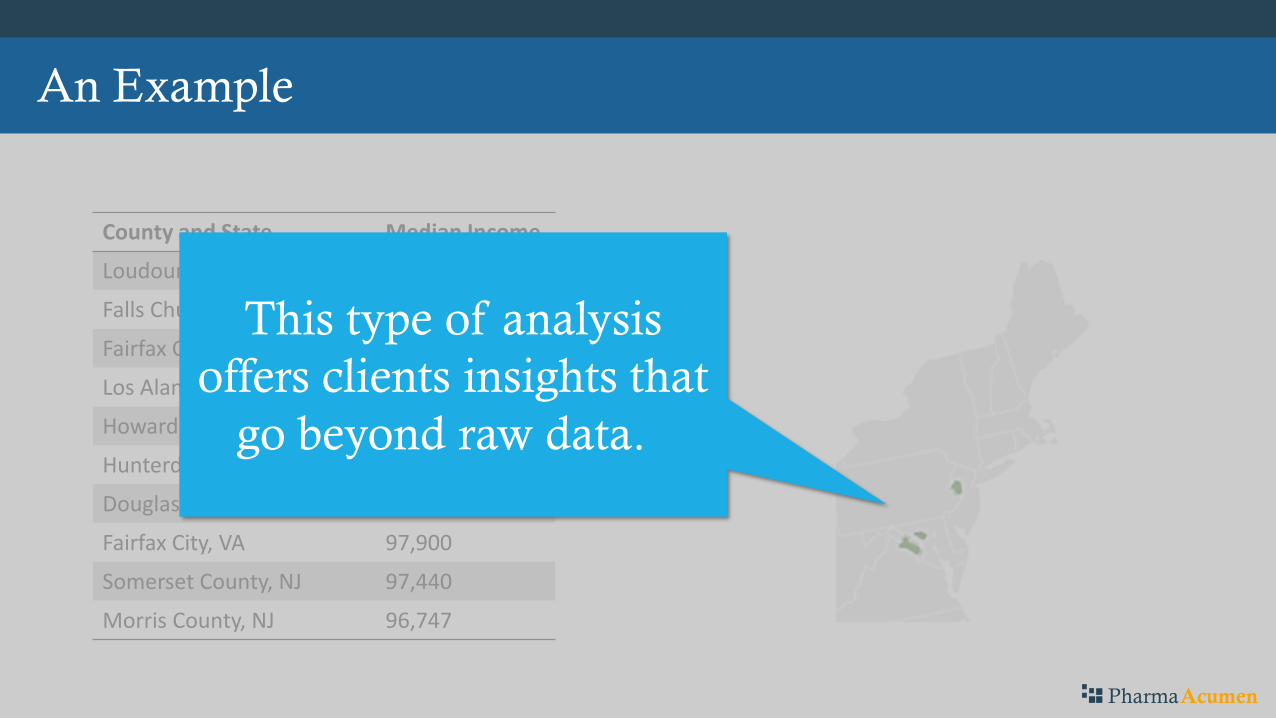
This type of analysis
offers clients insights that
go beyond raw data.
PharmaAcumen

4Tell an
Impactful Story
PharmaAcumen

“Stories BRING LIFE to data and facts. They can help you make
sense and order out of a disparate collection of facts. They make it
easier to remember key points and can paint a vivid picture of what
the future can look like. Stories also create interactivity—people put
themselves into stories and can relate to the situation.
Tableau Software
PharmaAcumen
Measles vaccine was licensed in the United States in 1963.
During 1958-1962, an average of 503,282 measles cases and
432 measles-associated deaths were reported each year.
Measles incidence and deaths began to decline in 1965 and
continued a 33-year downward trend. This trend was
interrupted by epidemics in 1970-1972, 1976-1978, and 1989-
1991. In 1998, measles reached a provisional record low
number of 89 cases with no measles-associated deaths.
— CDC website
An Example
PharmaAcumen

Measles vaccine was licensed in the United States in 1963.
During 1958-1962, an average of 503,282 measles cases and
432 measles-associated deaths were reported each year.
Measles incidence and deaths began to decline in 1965 and
continued a 33-year downward trend. This trend was
interrupted by epidemics in 1970-1972, 1976-1978, and 1989-
1991. In 1998, measles reached a provisional record low
number of 89 cases with no measles-associated deaths.
— CDC website
An Example
This wall of text describes
the impact of the measles
vaccination on outbreaks.
PharmaAcumen

0k
1k
2k
3k
4k
Mea
sles
An Example
PharmaAcumenSource: The Wall Street Journal
0k
1k
2k
3k
4k
Mea
sles
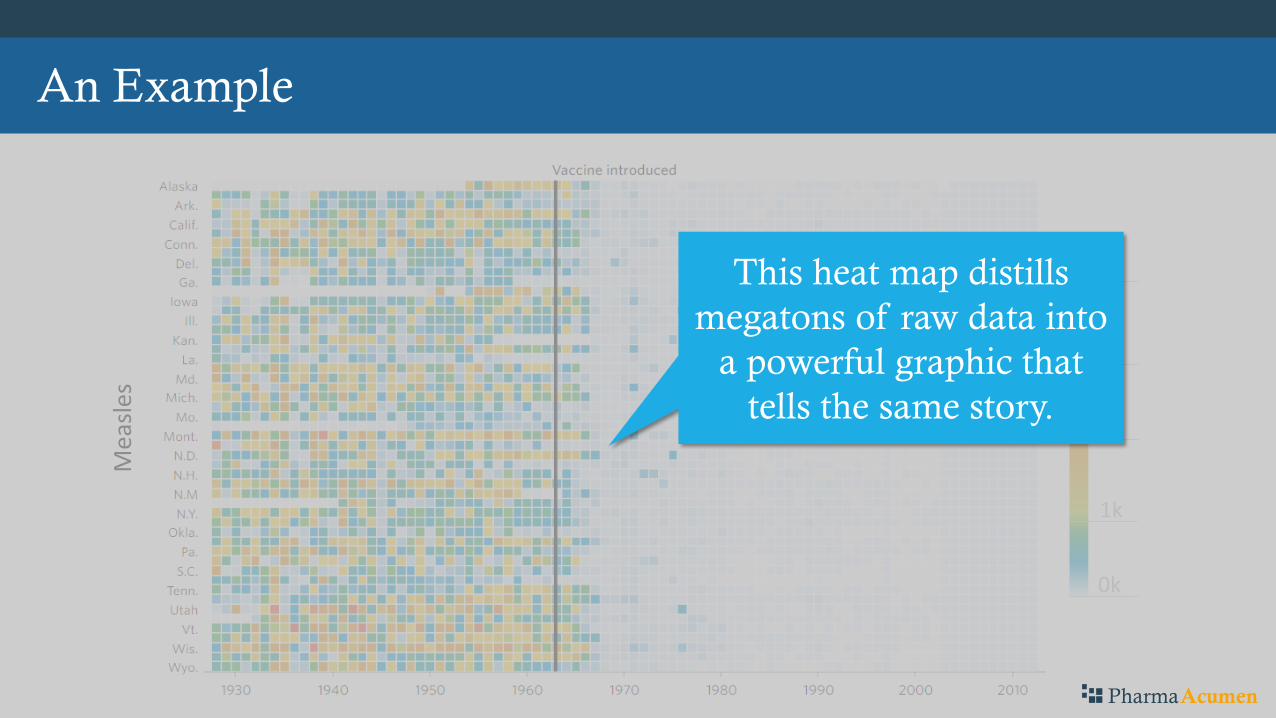
An Example
This heat map distills
megatons of raw data into
a powerful graphic that
tells the same story.
PharmaAcumen

Which do you think is
more effective?
An ExampleM
easl
es
Which do you think is
more effective?
PharmaAcumen

5Persuade Your
Audience
PharmaAcumen
An Example
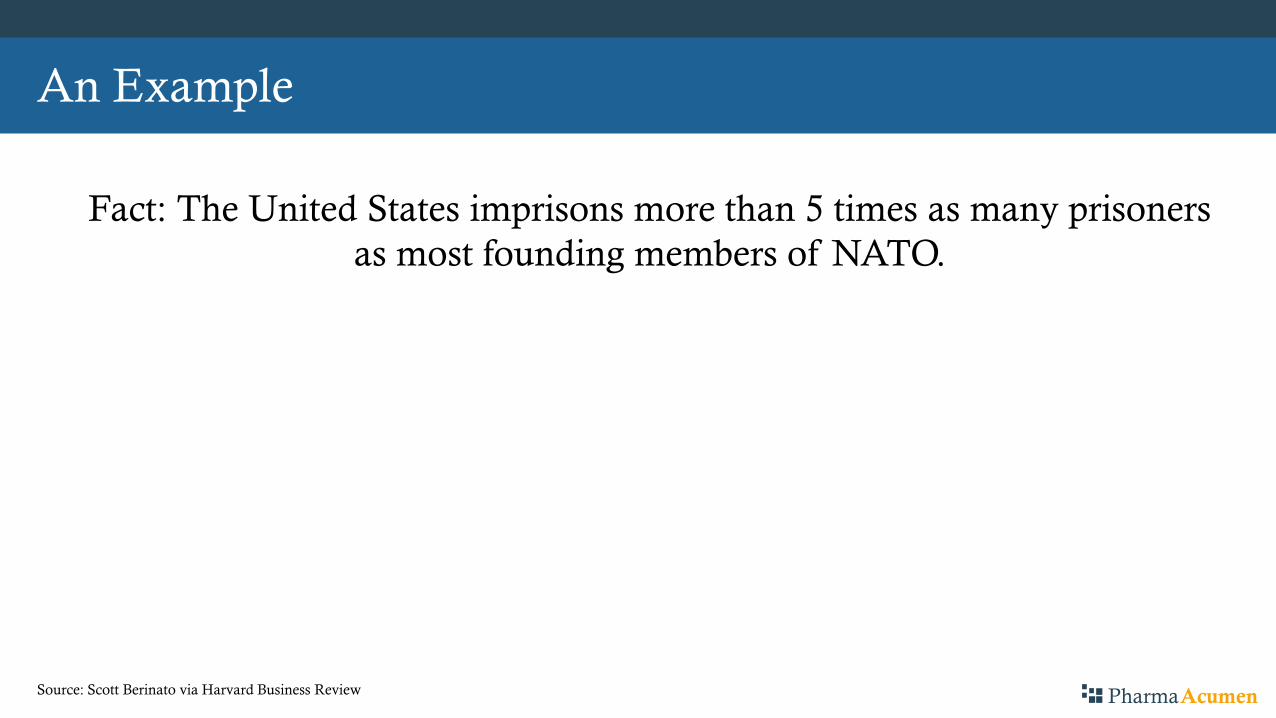
Fact: The United States imprisons more than 5 times as many prisoners
as most founding members of NATO.
PharmaAcumenSource: Scott Berinato via Harvard Business Review
Fact: The United States imprisons more than 5 times as many prisoners
as most founding members of NATO.
This fact is short and easy
to understand.
An Example
PharmaAcumen
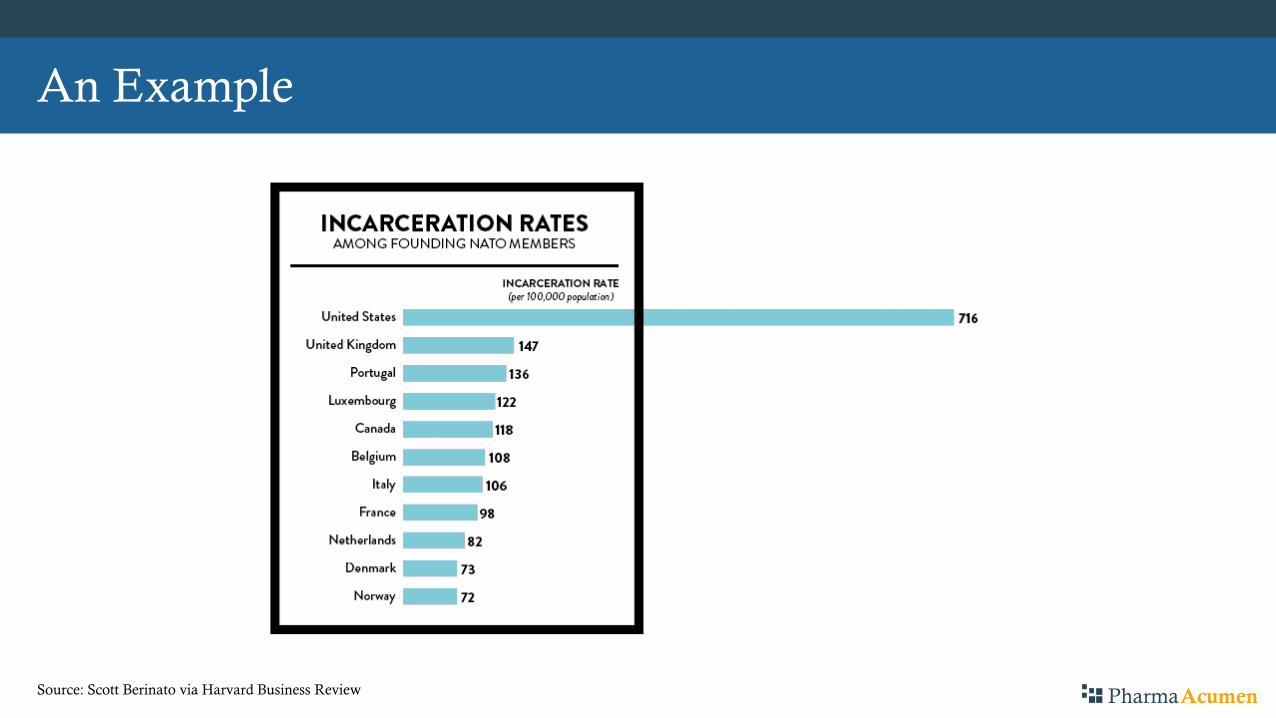
An Example
PharmaAcumenSource: Scott Berinato via Harvard Business Review
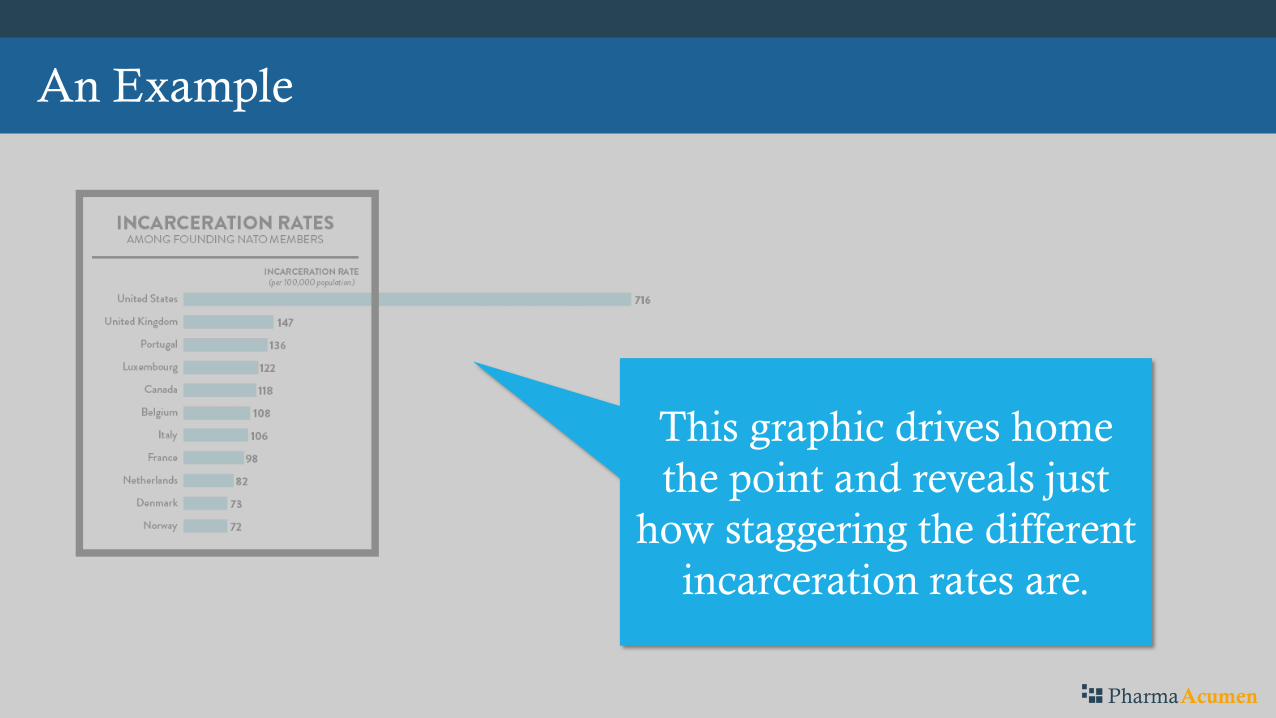
This graphic drives home
the point and reveals just
how staggering the different
incarceration rates are.
An Example
PharmaAcumen

“The immediate, visceral reaction we have to charts like
this one...is no accident. Visual perception research has
established the fact that visual information is powerfully
and inescapably PERSUASIVE in a way that text and
speech aren’t.
Scott Berinato
PharmaAcumen

The Takeaway
PharmaAcumen

PharmaAcumen
Data
visualization
facilitates the
communication
process and
empowers
businesses to
tell compelling
stories.

Want MORE?
We develop products and educate customers
in the pharmaceutical industry.
PharmaAcumen