Embed Size (px)
Citation preview

PNG 420 Final Project Presentation
Team 6
Team Members
Qassim Alhashim
David Verm
Prateeksha Mazumder
Andre Ibuaka

Reservoir Properties Initial Reservoir Pressure, pi 6000 psia
Area of the reservoir, acres 206.6 acres
Height of the formation, h 150 ft
Volume formation factor, Bo 1.1 RB/STB
Rock compressibility, cf 5*10-6 psi-1
Fluid compressibility, c0 5*10-6 psi-1
Maximum Injection pressure 7000 psia
Reservoir Temperature, T 1500F
Average water saturation, Sw 0.22
API gravity of the fluid 10 API
Irreducible water saturation, Swirr 0.18

Task 1 – Maximizing NPV• Position of injector
• Injector was positioned down-dip
• Maximized the production of oil since the water pushed the oil from underneath
• Trial and error was used to obtain optimum position of injector and maximize NPV
• Final position of injector – Well block 7, 28
• Maximum water injection rate is 5000 STB/D
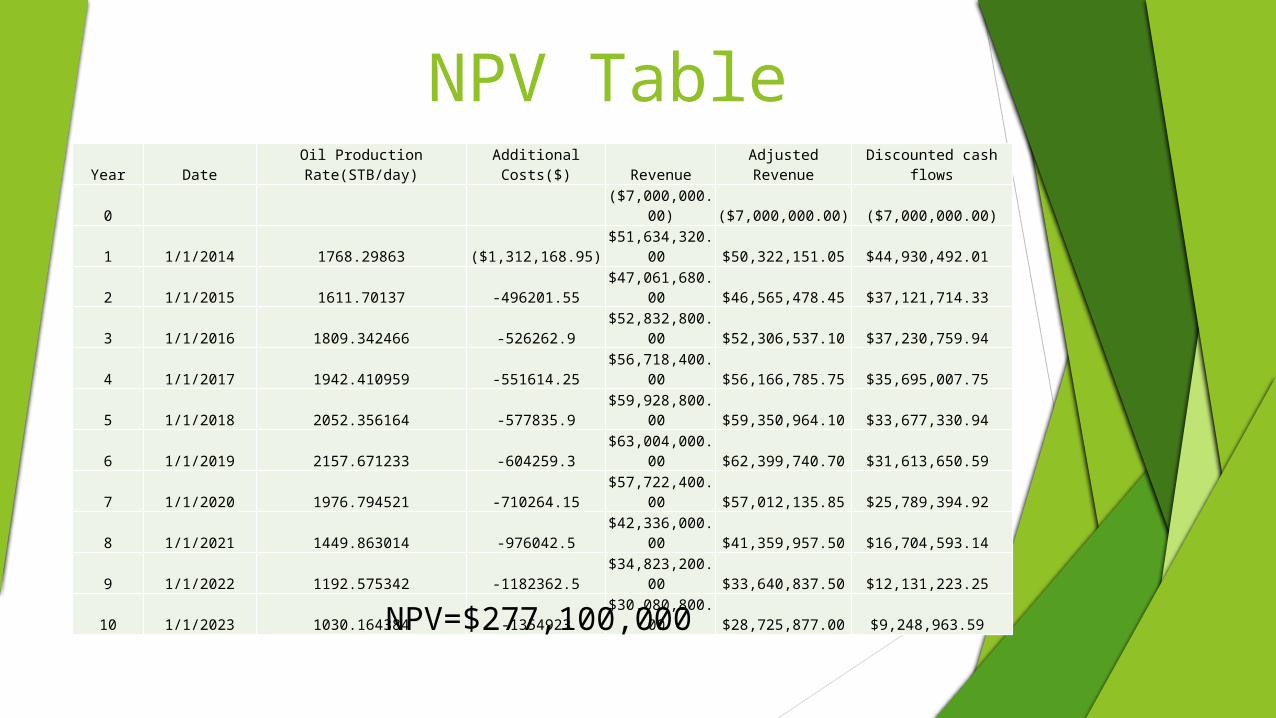
NPV TableYear Date
Oil Production Rate(STB/day)
Additional Costs($) Revenue Adjusted Revenue
Discounted cash flows
0 ($7,000,000.0
0) ($7,000,000.00) ($7,000,000.00)
1 1/1/2014 1768.29863 ($1,312,168.95)$51,634,320.
00 $50,322,151.05 $44,930,492.01
2 1/1/2015 1611.70137 -496201.55$47,061,680.
00 $46,565,478.45 $37,121,714.33
3 1/1/2016 1809.342466 -526262.9$52,832,800.
00 $52,306,537.10 $37,230,759.94
4 1/1/2017 1942.410959 -551614.25$56,718,400.
00 $56,166,785.75 $35,695,007.75
5 1/1/2018 2052.356164 -577835.9$59,928,800.
00 $59,350,964.10 $33,677,330.94
6 1/1/2019 2157.671233 -604259.3$63,004,000.
00 $62,399,740.70 $31,613,650.59
7 1/1/2020 1976.794521 -710264.15$57,722,400.
00 $57,012,135.85 $25,789,394.92
8 1/1/2021 1449.863014 -976042.5$42,336,000.
00 $41,359,957.50 $16,704,593.14
9 1/1/2022 1192.575342 -1182362.5$34,823,200.
00 $33,640,837.50 $12,131,223.25
10 1/1/2023 1030.164384 -1354923$30,080,800.
00 $28,725,877.00 $9,248,963.59
NPV=$277,100,000

Pressure surface maps
01/01/2014 01/01/2019
01/01/2024
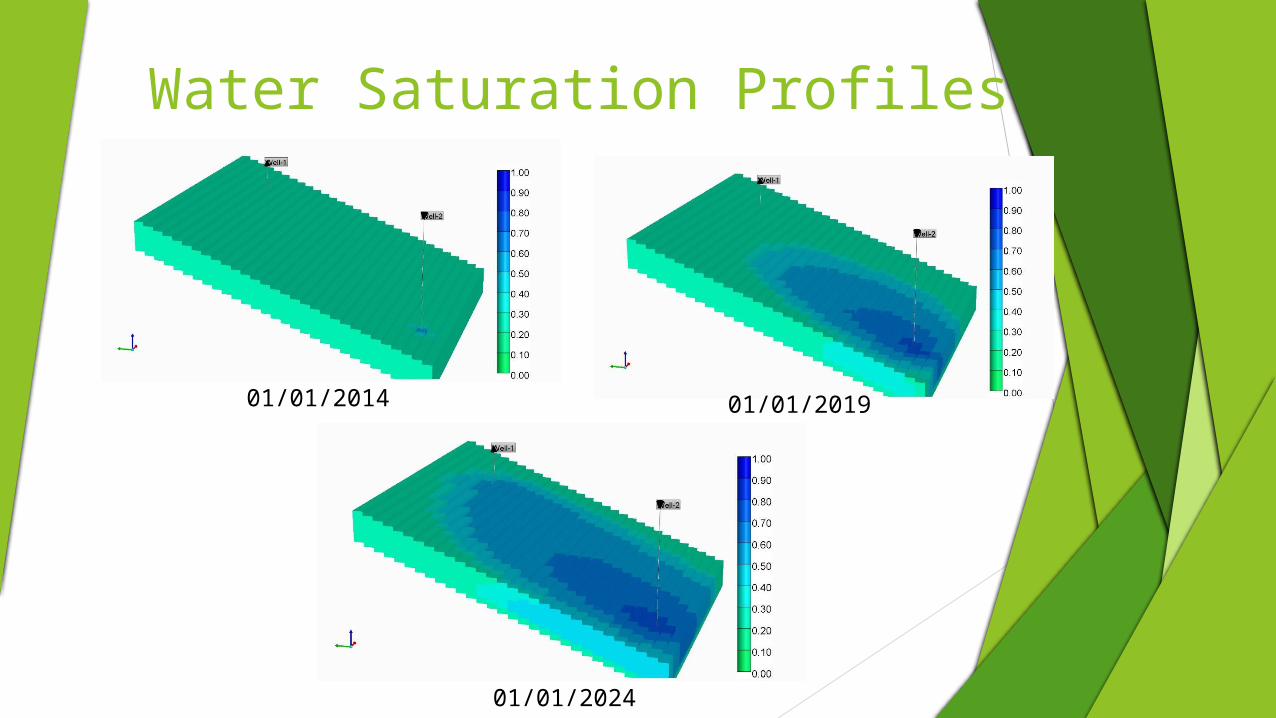
Water Saturation Profiles
01/01/2014 01/01/2019
01/01/2024

Oil and water flow rates
Breakthrough point (3/1/2020)

Injection/ Production
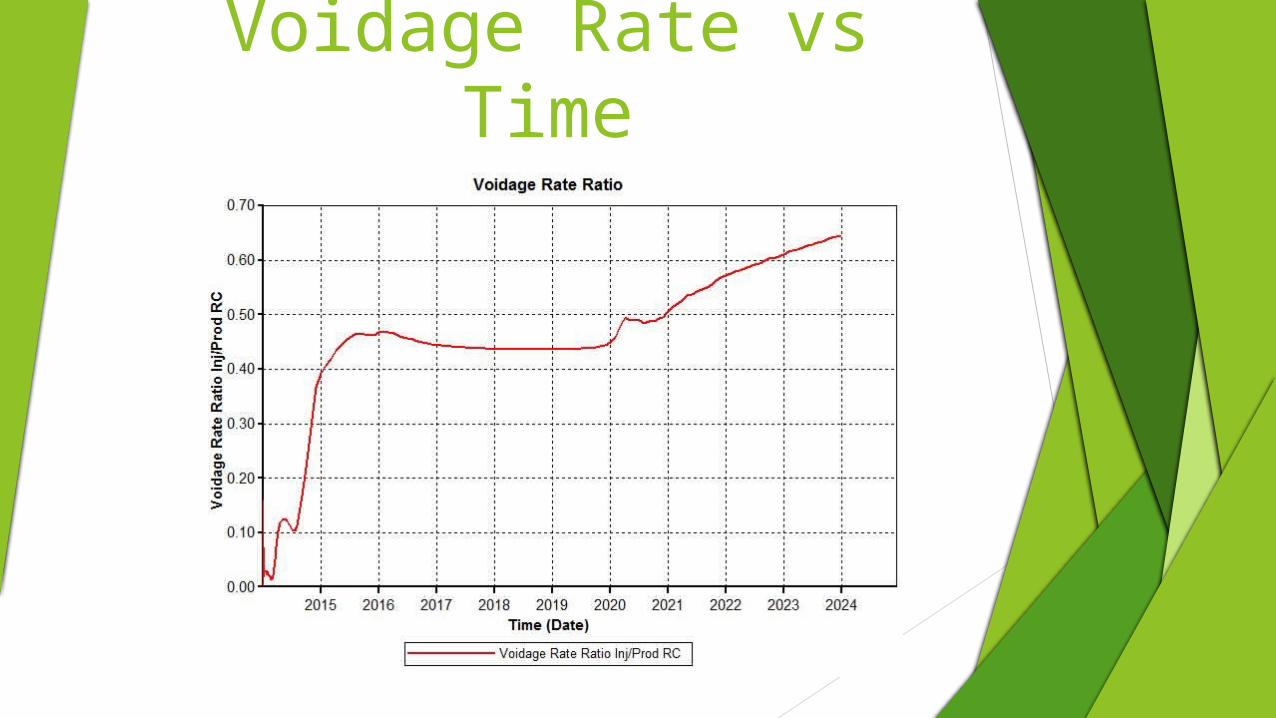
Voidage Rate vs Time

Recovery factor
0 500 1000 1500 2000 2500 3000 3500 40000
0.05
0.1
0.15
0.2
0.25
0.3
0.35
0.4
0.45
0.5
RF vs time
Time (days)
RF

NPV vs skin factor
-4 -3.5 -3 -2.5 -2 -1.5 -1 -0.5 00
50000000
100000000
150000000
200000000
250000000
221800000
45860000
44360000 42990000 41720000
NPV vs Skin Factor
Skin Factor
NP
V (
$)

Pressure surface maps (with aquifer)
01/01/2014 01/01/2019
01/01/2024
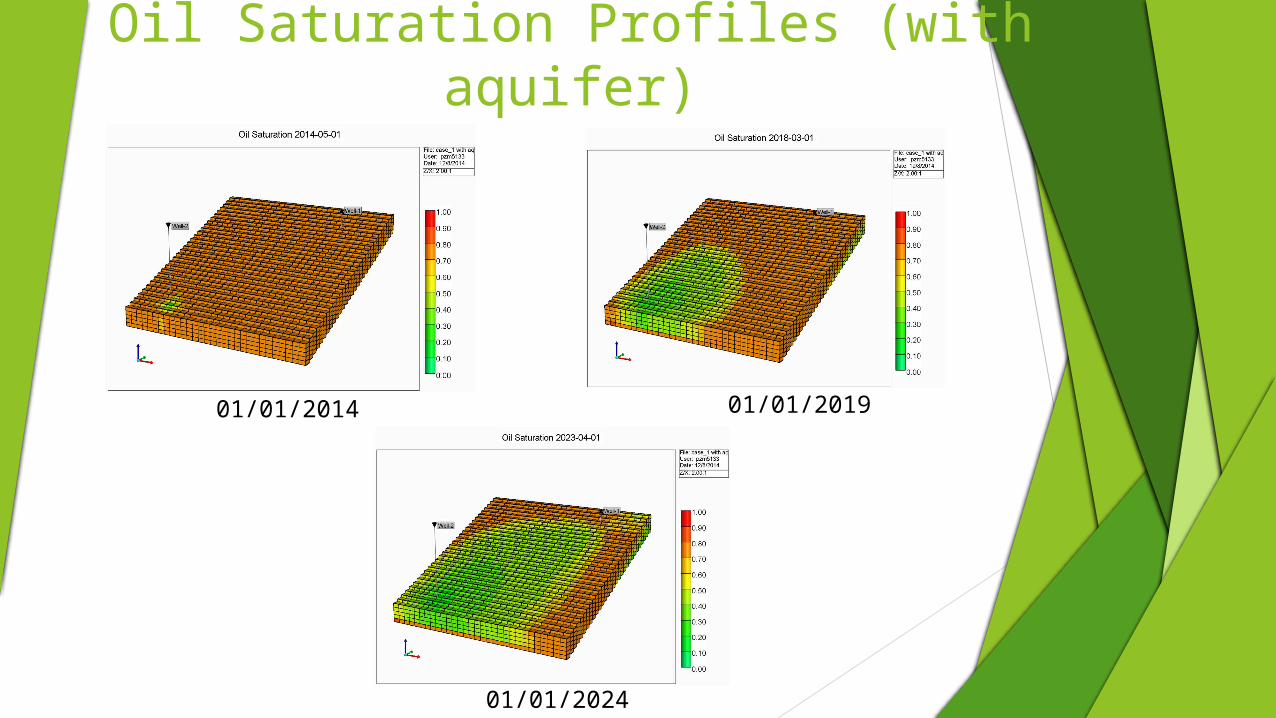
Oil Saturation Profiles (with aquifer)
01/01/2014 01/01/2019
01/01/2024

Oil and Water Production Rates (with aquifer)
Well-1 modified case 2.irf
Oil Rate SC Water Rate SC
Time (Date)
Oil R
ate
SC
(bb
l/day)
2015 2016 2017 2018 2019 2020 2021 2022 2023 20240
400
800
1,200
1,600
2,000
2,400
2,800
3,200
3,600
4,000
4,400
4,800
Breakthrough point

Injection/Production Rates (with aquifer)

NPV vs max injection rate
0 1000 2000 3000 4000 5000 60000
50000000
100000000
150000000
200000000
250000000
300000000
277100000
47650000
4642000041530000
49940003197000
NPV vs Max Injection Rate
Max Injection rate (STB/D)
NPV
($)

NPV vs injection temperature
100 150 200 250 300 350 400 450 50053000000
53500000
54000000
54500000
55000000
55500000
56000000
56500000
57000000
54230611
54860000
54780000
56520000
NPV Vs Injection Temperature
T (F)
NP
V (
$)

NPV tables for 150°FDate Oil Production Rate(STB/day) Additional Costs($) Revenue Adjusted Revenue Discounted cash flows
$-7,000,000.00 $-7,000,000.00 $-7,000,000.00
1/1/2014 219.9155 ($1,016,201.72) $6,421,532.60 $5,405,330.89 $5,405,330.89
1/1/2015 211.4213333 -30159.68025 $6,173,502.93 $6,143,343.25 $6,143,343.25
1/1/2016 218.3870833 -45254.07296 $6,376,902.83 $6,331,648.76 $6,331,648.76
1/1/2017 223.4795833 -60356.98656 $6,525,603.83 $6,465,246.85 $6,465,246.85
1/1/2018 227.5619167 -75885.68577 $6,644,807.97 $6,568,922.28 $6,568,922.28
1/1/2019 230.09475 -91677.27276 $6,718,766.70 $6,627,089.43 $6,627,089.43
1/1/2020 226.982 -108375.6738 $6,627,874.40 $6,519,498.73 $6,519,498.73
1/1/2021 215.2826667 -127424.1566 $6,286,253.87 $6,158,829.71 $6,158,829.71
1/1/2022 200.8245833 -149709.7652 $5,864,077.83 $5,714,368.07 $5,714,368.07
1/1/2023 187.3816667 -175211.5259 $5,471,544.67 $5,296,333.14 $5,296,333.14
NPV= $54,230,611
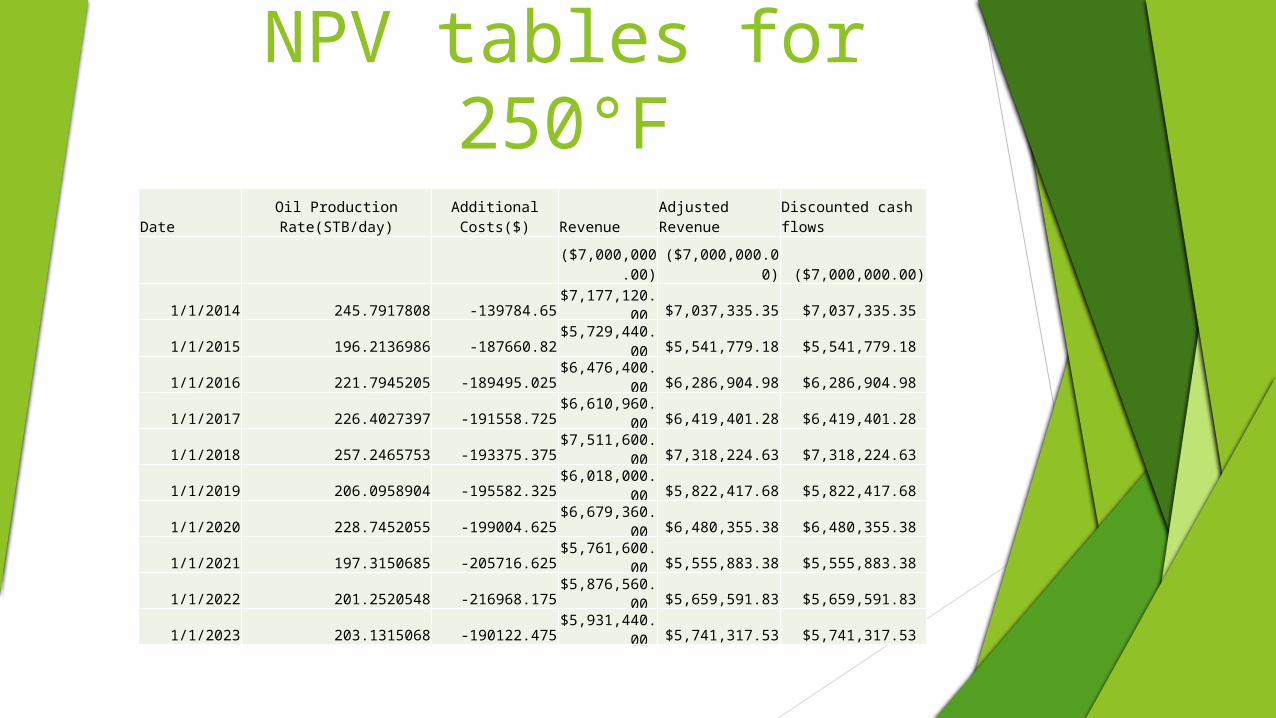
NPV tables for 250°F
NPV=$ 54,860,000
DateOil Production Rate(STB/day)
Additional Costs($) Revenue
Adjusted Revenue
Discounted cash flows
($7,000,000.
00) ($7,000,000.00) ($7,000,000.00)
1/1/2014 245.7917808 -139784.65$7,177,120.
00 $7,037,335.35 $7,037,335.35
1/1/2015 196.2136986 -187660.82$5,729,440.
00 $5,541,779.18 $5,541,779.18
1/1/2016 221.7945205 -189495.025$6,476,400.
00 $6,286,904.98 $6,286,904.98
1/1/2017 226.4027397 -191558.725$6,610,960.
00 $6,419,401.28 $6,419,401.28
1/1/2018 257.2465753 -193375.375$7,511,600.
00 $7,318,224.63 $7,318,224.63
1/1/2019 206.0958904 -195582.325$6,018,000.
00 $5,822,417.68 $5,822,417.68
1/1/2020 228.7452055 -199004.625$6,679,360.
00 $6,480,355.38 $6,480,355.38
1/1/2021 197.3150685 -205716.625$5,761,600.
00 $5,555,883.38 $5,555,883.38
1/1/2022 201.2520548 -216968.175$5,876,560.
00 $5,659,591.83 $5,659,591.83
1/1/2023 203.1315068 -190122.475$5,931,440.
00 $5,741,317.53 $5,741,317.53

NPV tables for 325°FDate
Oil Production Rate(STB/day)
Additional Costs($) Revenue Adjusted Revenue
Discounted cash flows
($7,000,000.0
) ($7,000,000.00) ($7,000,000.00)
1/1/2014 229.4882466 -1184344.5$6,701,056.8
0 $5,516,712.30 $5,516,712.30
1/1/2015 218.4084932 -185967.7559$6,377,528.0
0 $6,191,560.24 $6,191,560.24
1/1/2016 226.2515616 -187890.2958$6,606,545.6
0 $6,418,655.30 $6,418,655.30
1/1/2017 231.0295342 -189824.3742$6,746,062.4
0 $6,556,238.03 $6,556,238.03
1/1/2018 235.4088219 -191966.9852$6,873,937.6
0 $6,681,970.61 $6,681,970.61
1/1/2019 237.6450959 -194124.7956$6,939,236.8
0 $6,745,112.00 $6,745,112.00
1/1/2020 232.5441096 -197844.1775$6,790,288.0
0 $6,592,443.82 $6,592,443.82
1/1/2021 217.3744932 -205308.7279$6,347,335.2
0 $6,142,026.47 $6,142,026.47
1/1/2022 201.6905753 -217644.8128$5,889,364.8
0 $5,671,719.99 $5,671,719.99
1/1/2023 188.4179726 -234818.6547$5,501,804.8
0 $5,266,986.15 $5,266,986.15 NPV=$ 54,780,000

NPV tables for 450°FDate
Oil Production Rate(STB/day)
Additional Costs($) Revenue
Adjusted Revenue
Discounted cash flows
($7,000,000.0
0) ($7,000,000.00) ($7,000,000.00)
1/1/2014 223.1567123 -256823.55$6,516,176.0
0 $6,259,352.45 $6,259,352.45
1/1/2015 222.4953425 -187735.875$6,496,864.0
0 $6,309,128.13 $6,309,128.13
1/1/2016 230.7808219 -189640.275$6,738,800.0
0 $6,549,159.73 $6,549,159.73
1/1/2017 241.3890411 -191565.375$7,048,560.0
0 $6,856,994.63 $6,856,994.63
1/1/2018 260.6054795 -193686.275$7,609,680.0
0 $7,415,993.73 $7,415,993.73
1/1/2019 214.9972603 -195845.625$6,277,920.0
0 $6,082,074.38 $6,082,074.38
1/1/2020 254.6849315 -200278.825$7,436,800.0
0 $7,236,521.18 $7,236,521.18
1/1/2021 218 -208670.675$6,365,600.0
0 $6,156,929.33 $6,156,929.33
1/1/2022 185.4739726 -221751.275$5,415,840.0
0 $5,194,088.73 $5,194,088.73
1/1/2023 195.0657534 -240686.875$5,695,920.0
0 $5,455,233.13 $5,455,233.13 NPV=$ 56,652,000
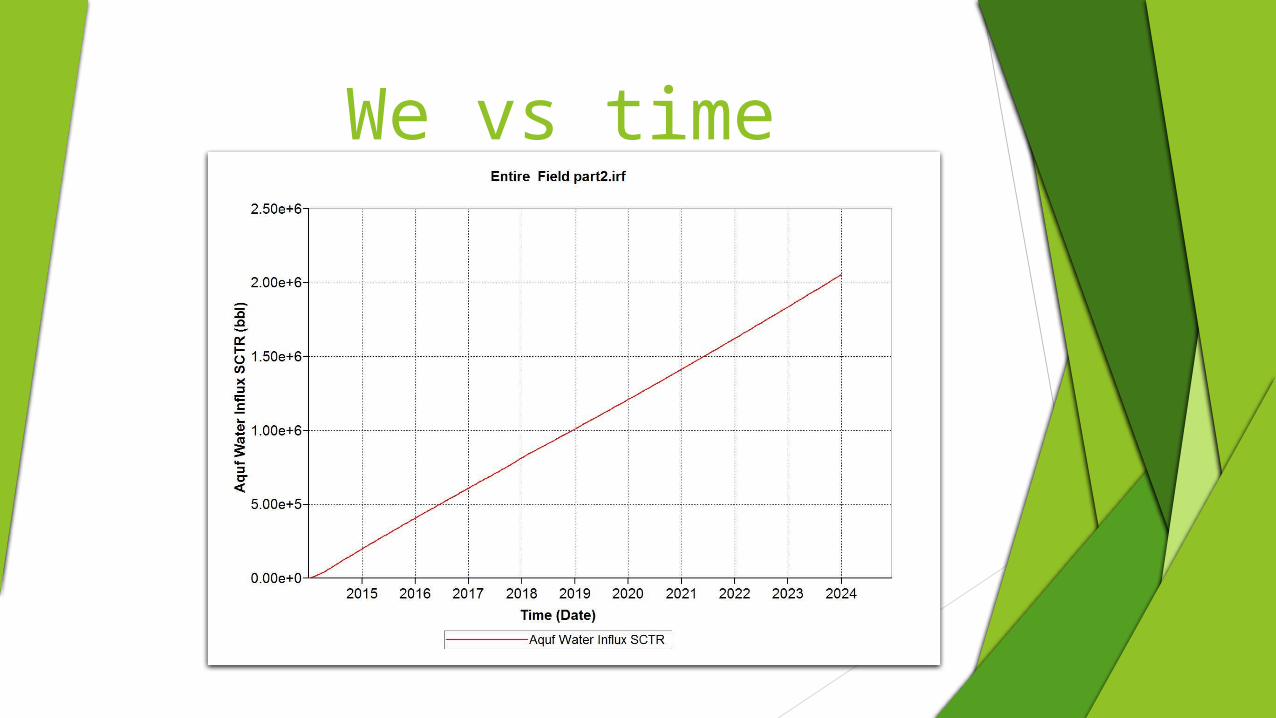
We vs time

NPV vs Temperature (with aquifer)
140 160 180 200 220 240 26096000000
97000000
98000000
99000000
100000000
101000000
102000000
103000000
98460838.756
102027744.45
NPV Vs T
Temperature (°F)
NP
V (
$)

RF vs Time (with and without an aquifer)
0 2 4 6 8 10 120
0.05
0.1
0.15
0.2
0.25
0.3
RF Vs Time
RF with an aquiferRF without an aquifer
time (years)
RF

Conclusion • NPV=$277,100,000 (without aquifer)• NPV=$3,038,124,019 (with aquifer)• After a certain point, skin factor has little effect
• NPV & Production increases as injection temperature increases
• Increasing injection rate increases NPV


![Modeling Myc Inhibition In Vitro [Presentation]](https://img.pdfslide.us/doc/110x75/588708c21a28abf2228b49c1/modeling-myc-inhibition-in-vitro-presentation.jpg)