Embed Size (px)
Citation preview
TRUMPONOMICS, TURBULENCE & THE MARKETSJames Holt, Senior Investment Specialist
November 2017

2
HOW MANY THOUGHT YOU’D SEE THIS IMAGE?

3 NFIBSmall Business Trends Survey, Sep 2017
US SMALL BUSINESS CONFIDENCE: LARGEST EVER BOUNCE
WHICH IS FEEDING INTO “NOWCAST” GROWTH ESTIMATES
4 Source: Fulcrum, Gavyn Davies

5
TRUMP: WHERE DO WE BEGIN?......

BUT WE’VE ACTUALLY SEEN ALL THIS BEFORE
6
7
DEFUNCT ECONOMISTS…..
LAFFER CURVE
SUPPLY SIDE ECONOMICS
MERCANTILISM
GAME THEORY
MONETARISM
KEYNESIANISM
WEALTH EFFECT: TOBINS Q
FREE MARKETS
BORDER ADJUSTMENT TAX

8
TRUMP BUMPS & THUMPS FOR EQUITIES & BONDS
1.1
1.3
1.5
1.7
1.9
2.1
2.3
2.5
2.7
2.9
3.1
Aug 14 Aug 15 Aug 16 Aug 17
US 10 yr Treasury Yield
1850
1900
1950
2000
2050
2100
2150
2200
2250
2300
2350
2400
2450
2500
Aug 14 Aug 15 Aug 16 Aug 17
US S&P500
Source: FactSet

9
TRUMPONOMICS: SEPARATING RHETORIC AND REALITY
• Individuals: Reduce 7 tax rates to 4 with and lower top rate
• Corporates: cut tax rate from 35% to 15% (one off tax amnesty of 10%)
• CGT and div tax rate of 20% and eliminate estate tax
• ~ $ 1 trillion infrastructure and defence stimulus
• Abandon or renegotiate FTAs and firm action against China
• Republican Congress: tax reform or tax cuts or chaos?
The market
loves the
green bits
The market
hates this bit
Keep an eye on this space
Congress options on the last point:
• Border Adjustment tax would be a radical reform. Very “America First”
• Cutting spending (e.g. Medicare) could also fund tax reforms
• They might just “do a Reagan” and cut taxes without cutting spending: Fed may react

HOW DID WE GET HERE?INTEREST RATES IN 2007 AND 2016 BY COUNTRY: CASH RATE AND 10-YR BOND RATE
10
0%
1%
2%
3%
4%
5%
6%
7%
2007
2016
-1%
Cash
rate
10-yr
yield
Cash
rate
Cash
rate
Cash
rate
Cash
rate
Cash
rate
Cash
rate
Australia UK United States Canada Germany France Japan
10-yr
yield
10-yr
yield10-yr
yield10-yr
yield
10-yr
yield10-yr
yield
Source: Perpetual Investments May 2017.
AND RELYING HEAVILY ON THE “WEALTH EFFECT”
11 Gurufocus

HOW DOES THE AVERAGE AMERICAN JOE FEEL?
12

EUROPE: POLITICAL FLASHPOINTS TRUMPING EU
13
• European growth has rebounded, but too little too late for voters?
• Still pressure on the UK until there is certainty
• But more pressure on Europe with 2017/18 events:
• Netherlands March 2017
• French election in April / May 2017
• UK election June 2017
• German elections September 2017
• Italian elections not due until 2018 but may be earlier

CHINA: TURNING POINT
Source: Gerard Minack14

AND CHINA IS EVOLVING
15
• Shift to consumer driven economy under way
• But debt is surging and needs to be brought under control

BUT THERE IS TOO MUCH DEBTGOVERNMENT DEBT AS A SHARE OF GDP (%)
0%
50%
100%
150%
200%
250%
300%
350%
400%
Japan Belgium Holland Spain Italy UK US Canada China Aust. Germany Brazil India Mexico Russia
15 07 15 0715 0715 0715 0715 0715 0715 0715 0715 0715 0715 0715 0715 0715 07
Household debt
Corporate debt
Government debt
Source: UBS Australia Limited and Factset as at 11th January 2016. 16
AUSTRALIA: ECONOMIC BACKDROP
Source: FactSet / Rider Levett Bucknall, September 2016
• Commodity prices heading back up (and mining investment getting close to a bottom)
• We are getting the benefit of the rising Chinese consumer (gaming, tourism and education)
• Construction has (over?) responded to rising dwelling prices: 528 cranes on east coast Aus vs 419 North Am.
17
30
50
70
90
110
130
150
170
190
10/29/2010 10/29/2012 10/29/2014 10/29/2016
Iron ore price (in USD)
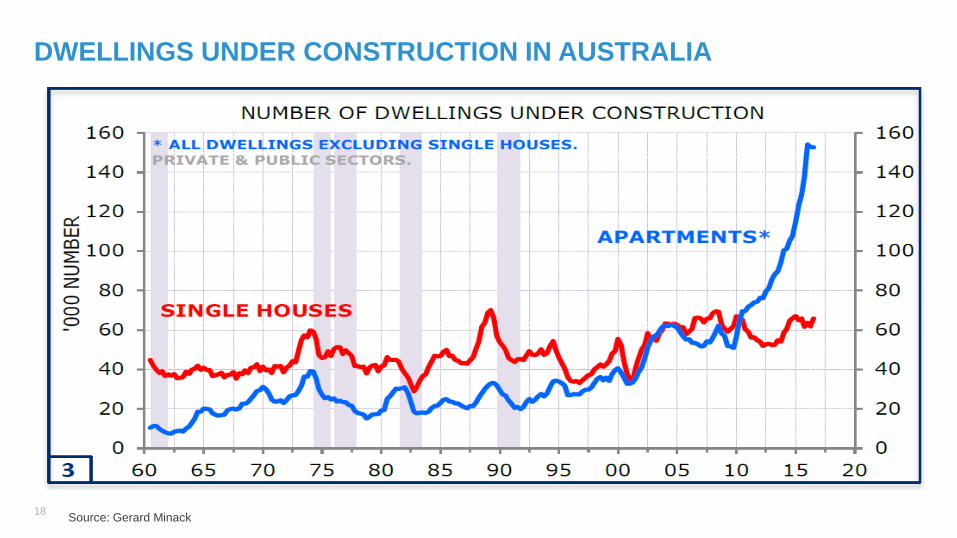
18
DWELLINGS UNDER CONSTRUCTION IN AUSTRALIA
Source: Gerard Minack

19
VALUE VS GROWTH
Source: FactSet

20
SOME GROWTH BUBBLE EXAMPLES
66,000
10,000,000
0
2,000,000
4,000,000
6,000,000
8,000,000
10,000,000
12,000,000
14,000,000
Cars sold
Car sales in 2016
Cars sold by Tesla in 2016 Cars sold by GM in 2016
0
10
20
30
40
50
60
Price to sales
Price to sales ratios
Snapchat Google
Snapchat yet to make a
profit
Yet trades at 5x Google
P/S
Market Cap:
$54 billion
Market Cap:
$54 billion
Factor Netflix YY Inc.
Subscribers/users 100 million 140 million
NPAT $524m $305m
Market Cap $83 billion $3.76 billion
P/E (based on 2018E) 158x 12x
FactSet as at 21 July 2017

POSITIONED TO PERFORM GOING FORWARDKEY FUND POSITIONS
21
Source: Perpetual.
COMPANY TYPE COMPANY RATIONALE
Consumer BrandsGrowing defensive businesses with longevity in
earrings
Strong free cashflow , balance sheets and
dividendsDiverse customer bases, strong cashflow
Fast growing Asian companies Structural tailwinds in the services sector
Banks with low cost deposits Market leaders with leverage to rising US interest rates
Monopolies/oligopolies High barriers, low capex, stable growing earnings
Online digital advertising companies Dominant search, shift to mobile, rapid E growth
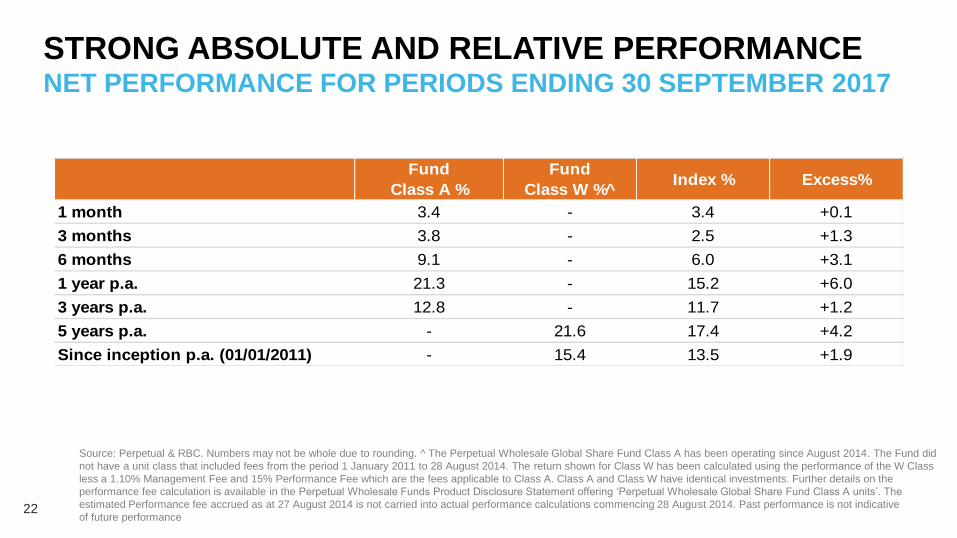
STRONG ABSOLUTE AND RELATIVE PERFORMANCENET PERFORMANCE FOR PERIODS ENDING 30 SEPTEMBER 2017
22
Source: Perpetual & RBC. Numbers may not be whole due to rounding. ^ The Perpetual Wholesale Global Share Fund Class A has been operating since August 2014. The Fund did
not have a unit class that included fees from the period 1 January 2011 to 28 August 2014. The return shown for Class W has been calculated using the performance of the W Class
less a 1.10% Management Fee and 15% Performance Fee which are the fees applicable to Class A. Class A and Class W have identical investments. Further details on the
performance fee calculation is available in the Perpetual Wholesale Funds Product Disclosure Statement offering ‘Perpetual Wholesale Global Share Fund Class A units’. The
estimated Performance fee accrued as at 27 August 2014 is not carried into actual performance calculations commencing 28 August 2014. Past performance is not indicative
of future performance
Fund
Class A %
Fund
Class W %̂Index % Excess%
1 month 3.4 - 3.4 +0.1
3 months 3.8 - 2.5 +1.3
6 months 9.1 - 6.0 +3.1
1 year p.a. 21.3 - 15.2 +6.0
3 years p.a. 12.8 - 11.7 +1.2
5 years p.a. - 21.6 17.4 +4.2
Since inception p.a. (01/01/2011) - 15.4 13.5 +1.9

ETHICAL SRI FUNDPORTFOLIO POSITIONING AS AT 30 SEPTEMBER 2017
23
Source: RBC
TOP 10 OVERWEIGHTS TOP 10 UNDERWEIGHTS
Bega Cheese +5.0 BHP Billiton -5.4 Not in ethical universe
Qube Holdings +4.1 Commonwealth Bank of Australia -4.0
Reece +2.9 Ex-index CSL -3.9 Not held
Graincorp Class A +2.7 Wesfarmers -3.0 Not in ethical universe
Freedom Foods Group +2.7 Woolworths -2.1 Not in ethical universe
Janus Henderson Group +2.6 Rio Tinto -1.8 Not in ethical universe
Fletcher Building +2.6 Transurban Group -1.6 Not in quality universe
Bluescope Steel +2.4 Woodside Petroleum -1.4 Not in ethical universe
Nick Scali +2.4 Scentre Group -1.4 Not held
Boral +1.9 Telstra Corporation -1.3
OVERWEIGHT % UNDERWEIGHT %

ETHICAL SRI FUNDNET PERFORMANCE FOR PERIODS ENDING 30 SEPTEMBER 2017
24 Source: Perpetual & FactSet. Numbers may not be whole due to rounding. Performance figures shown are net fees / pre tax for the Wholesale Ethical SRI Fund. Index used is the
S&P/ASX 300 Accumulation Index
FUND % INDEX % EXCESS %
Financial year to date -0.5 0.8 -1.3
3 months -0.5 0.8 -1.3
1 year 4.5 9.0 -4.5
2 years p.a. 11.5 11.2 +0.3
3 years p.a. 9.5 7.1 +2.4
4 years p.a. 8.6 6.8 +1.8
5 years p.a. 13.7 9.9 +3.8
7 years p.a. 12.9 7.7 +5.3
10 years p.a. 7.8 2.9 +4.9
Since inception p.a. (24/04/2002) 11.9 8.0 +3.9
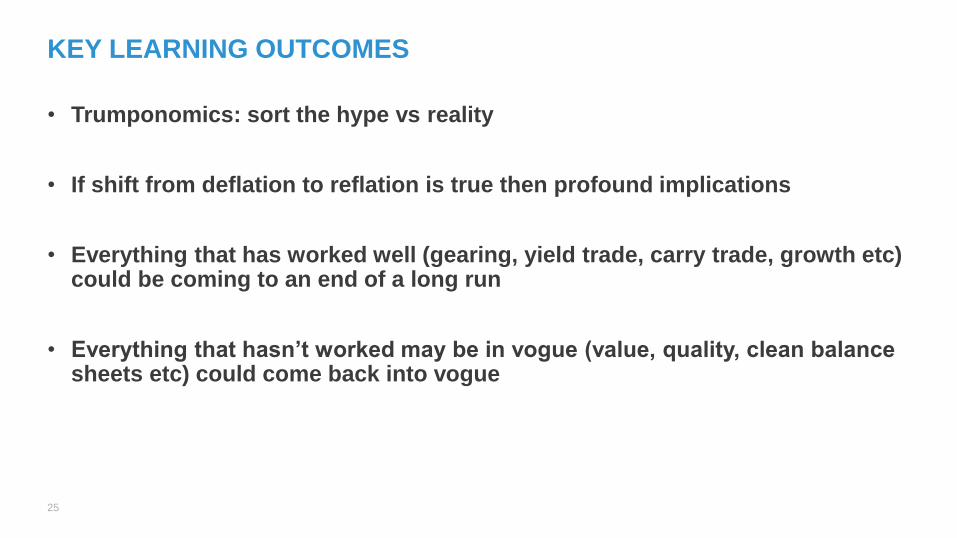
KEY LEARNING OUTCOMES
25
• Trumponomics: sort the hype vs reality
• If shift from deflation to reflation is true then profound implications
• Everything that has worked well (gearing, yield trade, carry trade, growth etc) could be coming to an end of a long run
• Everything that hasn’t worked may be in vogue (value, quality, clean balance sheets etc) could come back into vogue
This presentation has been prepared by Perpetual Investment Management Limited (PIML) ABN 18 000 866 535, AFSL 234426 for financial advisers only. It is general information only and is not intended to provide you with financial advice. To the extent permitted by law, no liability is accepted for any loss or damage as a result of any reliance on this information. The PDS for the relevant funds, issued by PIML, should be considered before deciding whether to acquire or hold units in the fund. The PDS can be obtained by calling 1800 022 033 or visiting our website www.perpetual.com.au. No company in the Perpetual Group (Perpetual Group means Perpetual Limited ABN 86 000 431 827 and its subsidiaries) guarantees the performance of any fund or the return of an investor’s capital. Total return shown for the Perpetual's Funds have been calculated using exit prices after taking into account all of Perpetual’s ongoing fees and assuming reinvestment of distributions. No allowance has been made for taxation. Past performance is not indicative of future performance.
26