Embed Size (px)
Citation preview

The Top 6 Canadian Banks: Selected Indicators of FY 2015 Results
December 2015

Contents
Overview 3.
Key Performance Indicators 4.
Total Revenue 5.
Net Income 6.
Return on Equity 7.
Earnings Per Share 8.
Summation 9.
2

Canada's Top 6 Banks – Meeting the challenge of slowing growth through cost-cutting and restructuring in FY2015
• Canada’s top 6 banks began a challenging FY 2015 in a business environment that was impacted by low interest rates, oil prices, and a high level of consumer debt
• New challenges in 2015 included slower economic growth, shifts in consumer banking behaviour away from branches, and lower mortgage and loan activity
• The banks’ fairly predictable response in attempting to meet growth targets included cost-cutting and restructuring measures, and layoffs:
– Scotia shed 1,140 jobs, while BMO shed 890 FTEs*
– RBC cut around 900 jobs in Canada and the U.S.*
– TD cut “several hundred” jobs as part of an organizational review*
– National Bank cut 284 jobs*
– CIBC laid off over 500 employees (a spokesperson did state that the bank was hiring over 5,000 employees in 2016)*
• However, in the context of the very large workforces that these banks employ, these are not substantial layoffs
• Overall, the combined reported net income of the top 6 Canadian banks increased 4.8%, with RBC and CIBC leading with the highest % increases vs. the previous year
• RBC became the first Canadian company to cross the $10 billion threshold in annual net income (source: Globe & Mail ROB)
3* Sources: Financial Post; Globe & Mail Report on Business; CTV News; Reuters

Key Performance Indicators
Among the key performance indicators for the top 6 banks are:
• Total Revenue
• Net Income
• ROE (Return on Equity)
• EPS (Earnings per Share)
The following charts show how each bank performed in a universe of top 6 bank results.(Sources: Reported Top 6 Banks’ FY 2015 results*)
4
* The banks’ fiscal year is Nov 1- Oct 31
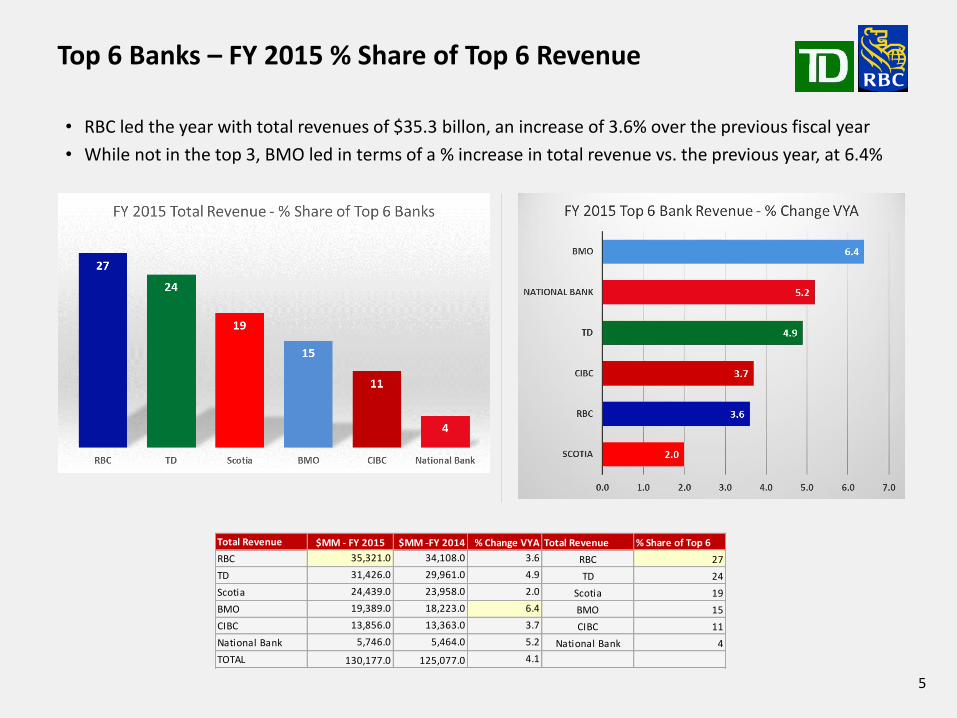
Top 6 Banks – FY 2015 % Share of Top 6 Revenue
• RBC led the year with total revenues of $35.3 billon, an increase of 3.6% over the previous fiscal year
• While not in the top 3, BMO led in terms of a % increase in total revenue vs. the previous year, at 6.4%
5
Total Revenue $MM - FY 2015 $MM -FY 2014 % Change VYA Total Revenue % Share of Top 6
RBC 35,321.0 34,108.0 3.6 RBC 27
TD 31,426.0 29,961.0 4.9 TD 24
Scotia 24,439.0 23,958.0 2.0 Scotia 19
BMO 19,389.0 18,223.0 6.4 BMO 15
CIBC 13,856.0 13,363.0 3.7 CIBC 11
National Bank 5,746.0 5,464.0 5.2 National Bank 4
TOTAL 130,177.0 125,077.0 4.1

Top 6 Banks – FY 2015 % Share of Top 6 Net Income
6
• RBC became the first Canadian company to cross the $10 billion income threshold in FY 2015, and accounted for almost a third of the top 6 banks’ combined net income
• CIBC and RBC showed the greatest % increase in net income vs. the previous fiscal year
Reported Net
Income $MM - FY 2015 $MM -FY 2014 % Change VYA
Reported Net
Income % Share of Top 6
RBC 10,026.0 9,004.0 11.4 RBC 29
TD 8,024.0 7,883.0 1.8 TD 23
Scotia 7,213.0 7,298.0 -1.2 Scotia 21
BMO 4,405.0 4,333.0 1.7 BMO 13
CIBC 3,590.0 3,215.0 11.7 CIBC 10
National Bank 1,619.0 1,538.0 5.3 National Bank 5
34,877.0 33,271.0 4.8

Top 6 Banks – FY 2015 Return on Equity (ROE)
7
• RBC and CIBC tied in terms of ROE, with CIBC being the only top 6 bank showing a modest increase vs. the previous fiscal year
• TD and BMO showed the greatest % declines in ROE vs. the previous year
Reported ROE - % % - FY 2015 % - FY 2014 % Change VYA ROE - % Index-RBC = 100
RBC 18.6 19.0 -2.1 RBC 100
TD 13.4 15.4 -13.0 TD 72
Scotia 14.6 16.1 -9.3 Scotia 78
BMO 12.5 14.0 -10.7 BMO 67
CIBC 18.7 18.3 2.2 CIBC 101
National Bank 16.9 17.9 -5.6 National Bank 91

Top 6 Banks FY 2015 Earnings Per Share (EPS)
• Preventing a clean sweep by RBC, National Bank led in Earnings per Share (EPS)
• Both CIBC and RBC however posted significant improvements vs. Q3 2011
8
• As it did last year, CIBC continued to lead by far in EPS, followed by RBC and BMO
Reported EPS
(diluted) $ - FY 2015 $ - FY 2014 % Change VYA EPS Index-RBC = 100
RBC 6.73 6.00 12.2 RBC 100
TD 4.21 4.14 1.7 TD 63
Scotia 5.67 5.66 0.2 Scotia 84
BMO 6.57 6.41 2.5 BMO 98
CIBC 8.87 7.86 12.8 CIBC 132
National Bank 4.51 4.32 4.4 National Bank 67


Deepak Pershad, Principal
www.insightsbydesign.ca
416.925.6536
• Marketing analysis, research and planning
• Brand strategy and management
• Marketing communications