Embed Size (px)
Citation preview

Presentation: The revival and transformation of Europe’s largest onshore oilfield; the Patos-
Marinza field
Leonidha Çobo, General Manager, Bankers Petroleum Albania Ltd

TSX | AIM: BNK Leonidha Çobo PhD, VP & General Director
March 2015
The revival and transformation of Europe’s
largest onshore oilfield
The Patos Marinza

Disclaimer
Certain information contained herein respecting the Company, the Company's properties or
anticipated financial results or performance of the Company or its properties constitutes
forward-looking information. Such forward-looking information, including but not limited to,
statements with respect to anticipated rates of production, the estimated costs and timing of
the Company's planned work program and reserves determination involve many known and
unknown risks, uncertainties and other factors which may cause the actual costs and results
of the Company and its operations to be materially different from estimated costs or results
expressed or implied by such forward-looking statements. Such factors include, but are not
limited to, risks related to international operations including political risks, general risks
associated with petroleum operations (such as commodity prices, production delays,
production costs, exchange rate fluctuations and environmental costs and risks) and risks
associated with equipment procurement and equipment failure. Although the Company has
attempted to take into account important factors that could cause actual costs or results to
differ materially, there may be other factors that cause costs of the Company's program or
results not to be as anticipated, estimated or intended. There can be no assurance that such
statements will prove to be accurate as actual results and future events could differ materially
from those anticipated in such statements. The forward-looking statements contained herein
are made as of the date hereof and the Company undertakes no obligations to update or
revise any forward-looking statements or information, whether as a result of new information,
future events or otherwise. Accordingly, readers should not place undue reliance on forward-
looking information.
3
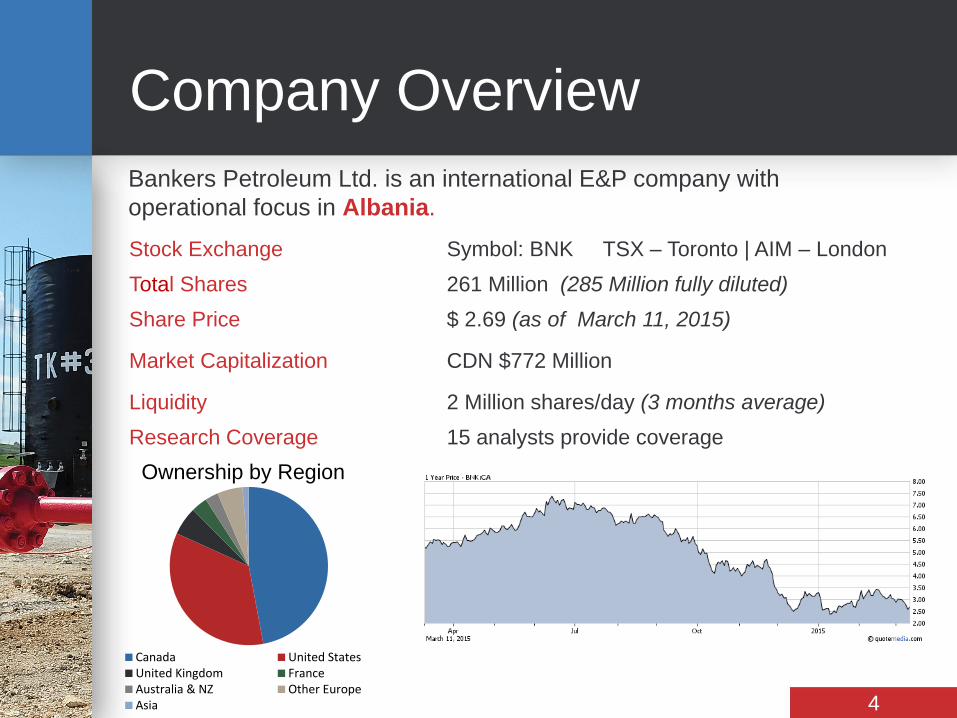
Company Overview
Stock Exchange Symbol: BNK TSX – Toronto | AIM – London
Total Shares 261 Million (285 Million fully diluted)
Share Price $ 2.69 (as of March 11, 2015)
Market Capitalization CDN $772 Million
Liquidity 2 Million shares/day (3 months average)
Research Coverage 15 analysts provide coverage
Bankers Petroleum Ltd. is an international E&P company with
operational focus in Albania.
4
Canada United StatesUnited Kingdom FranceAustralia & NZ Other EuropeAsia
Ownership by Region

Assets Overview
Patos-Marinza Oilfield
• Largest onshore oilfield in Europe
• 100% W.I. and operatorship
• 191 Million Barrels – 2P Reserves
Kuçova Oilfield
• 100% W.I. and operatorship
• 12 Million Barrels 2P Reserves
• Drilled first horizontal well in 2014
Block F Exploration Acreage
• Prospective for natural gas
CORE FOCUS AREA ACCESSIBLE TO REGIONAL AND INTERNATIONAL MARKETS
5

Investment Highlights
Capital Investment (CAPEX) ~ 1.3 billion USD ~500 million last 2 years
Large Primary Reserves 203 Million barrels 2P 5.4 Billion barrels OIIP
Strong Record of Production
Growth 1.2 million tons production in 2014 ~ 6 million tons produced since 2004
Contribution to Albanian State
Finances and its Agencies
~500 million USD since 2004 ~230 million USD as Royalty Tax
~190 million USD to Albpetrol as PEP&ASP
~80 million USD as C&C, excise, local taxes, personal etc.
Largest FDI in Albania 35% of FDI for the first three quarters of 2014
701 million USD total FDI for Q1-Q3 2014
Strong Balance Sheet 2014 year end cash position of $73 million 2015 capital program fully-funded
6
Albania’s largest producer, foreign investor and contributor to Albanian Economy

-
4,000
8,000
12,000
16,000
20,000
1939 1944 1949 1954 1959 1964 1969 1974 1979 1984 1989 1994 1999 2004 2009 2014
(bo
pd
)
Albpetrol Bankers AAP
History of Patos-Marinza
1928 – 1990 Patos-Marinza was first discovered by APOC (Anglo Persian Oil Co.) and developed in stages.
1990 Fall of Communism in Albania
1995 – 2004 AAP (Anglo Albanian Petroleum, a JV between Premier Oil , IFC, OMV, and Albpetrol) signed a
concession agreement, but due to contract terms, weak oil price environment and technical
challenges, the foreign partners relinquished the field in early 2004.
2004 - 2007 Bankers Petroleum negotiated and signed a new PA & LA in July 2004 and grew production from
400 to 6,000 bopd through reactivation of legacy vertical wells.
2008 – 2012 Growth of production from 6,000 to 15,000 bopd through development and delineation drilling of
new horizontal wells across 11 different reservoir zones and multiple areas of the field.
2013 - 2014 Two year average production growth of 17.5% through a strategy of primary development with
horizontal wells, validating secondary recovery techniques, and reducing costs through operational
efficiencies in the field
Average Historical Patos-Marinza Production
7

0
2,500
5,000
7,500
10,000
12,500
15,000
17,500
20,000
22,500
Q1 Q2 Q3 Q4 Q1 Q2 Q3 Q4 Q1 Q2 Q3 Q4 Q1 Q2 Q3 Q4 Q1 Q2 Q3 Q4 Q1 Q2 Q3 Q4 Q1 Q2 Q3 Q4 Q1 Q2 Q3 Q4 Q1 Q2 Q3 Q4
2006 2007 2008 2009 2010 2011 2012 2013 2014
Pro
duction (
bopd)
Ho
rizo
nta
l We
lls: 4
29
Ve
rtica
l We
lls: 1
07
8
KNOWLEDGE TEAM AND INFRASTRUCTURE TO DELIVER STEADY GROWTH
Bankers Quarterly Production

• Operational flexibility to adjust pace of drilling with oil prices
Execute Horizontal Drilling Program
• 19 polymer and 4 water flood patterns to end of 2014
• Initial production results are performing in line or exceeding expectations
• Up to 20 - 30 polymer conversions anticipated in 2015
Accelerate Polymer Flood Program
• Optimize treating process and sourcing to reduce diluent costs
• Install flow lines to reduce infield trucking
• Reduce energy costs through alternate fuel use
Operational Improvements to
Reduce Costs
Three-Part Operational Strategy
9

Reserves Value / Metrics
December 31, 2014
Reserves 125 Mbbls 203 Mbbls
Patos-Marinza 122 Mbbls 191 Mbbls
Kuçova 3 Mbbls 12 Mbbls
Reserve Life Index 17 years 27 years
Net Present Value
at 10% After Tax (US$ Millions) $734 $1,802
Per Share ($CDN) Exchange rate as of Feb. 20, 2014
$3.49 $8.57
Finding and development costs $22.57/bbl $12.69/bbl
Future capital (Millions) $2,001 $2,115
Number of Hz wells (at Patos-Marinza)
870 882
10
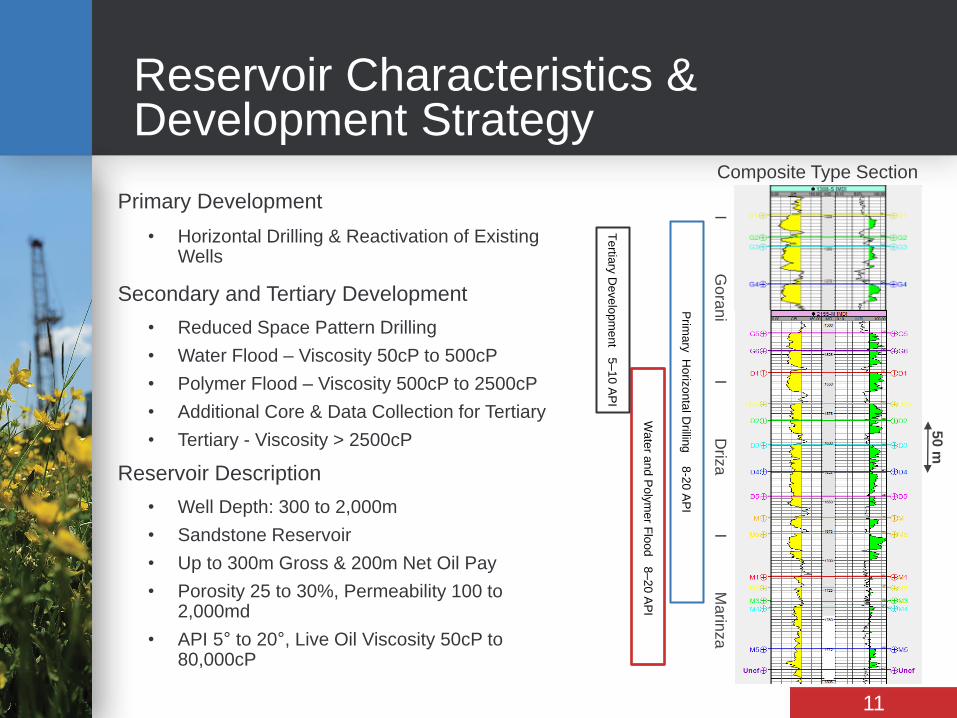
Reservoir Characteristics & Development Strategy
Primary Development
• Horizontal Drilling & Reactivation of Existing Wells
Secondary and Tertiary Development
• Reduced Space Pattern Drilling
• Water Flood – Viscosity 50cP to 500cP
• Polymer Flood – Viscosity 500cP to 2500cP
• Additional Core & Data Collection for Tertiary
• Tertiary - Viscosity > 2500cP
Reservoir Description
• Well Depth: 300 to 2,000m
• Sandstone Reservoir
• Up to 300m Gross & 200m Net Oil Pay
• Porosity 25 to 30%, Permeability 100 to 2,000md
• API 5° to 20°, Live Oil Viscosity 50cP to 80,000cP
Wa
ter a
nd P
oly
me
r Flo
od 8
–20 A
PI
I Gora
ni I D
riza I M
arin
za
50 m
Prim
ary
Horiz
onta
l Drillin
g 8
-20 A
PI
Tertia
ry D
evelo
pm
ent 5
–10 A
PI
Composite Type Section
11

Primary Development and Margin Expansion $125 Million
• 2 drilling rigs, 60 horizontal wells to be drilled
• Gathering and flow line systems
• 1 water disposal well
• Large programs for electrification, pump upsizing,
and other OPEX reductions
EOR Development $28 Million
• Capital allocated for 20 wells to be converted for
water and polymer injection
• Associated facilities
• Shifting from pilot to development phase of the EOR
project
2015 Capital Program of $153 M
12
Drilling Workovers Facilities Disposal Others
Facilities Well Conversions
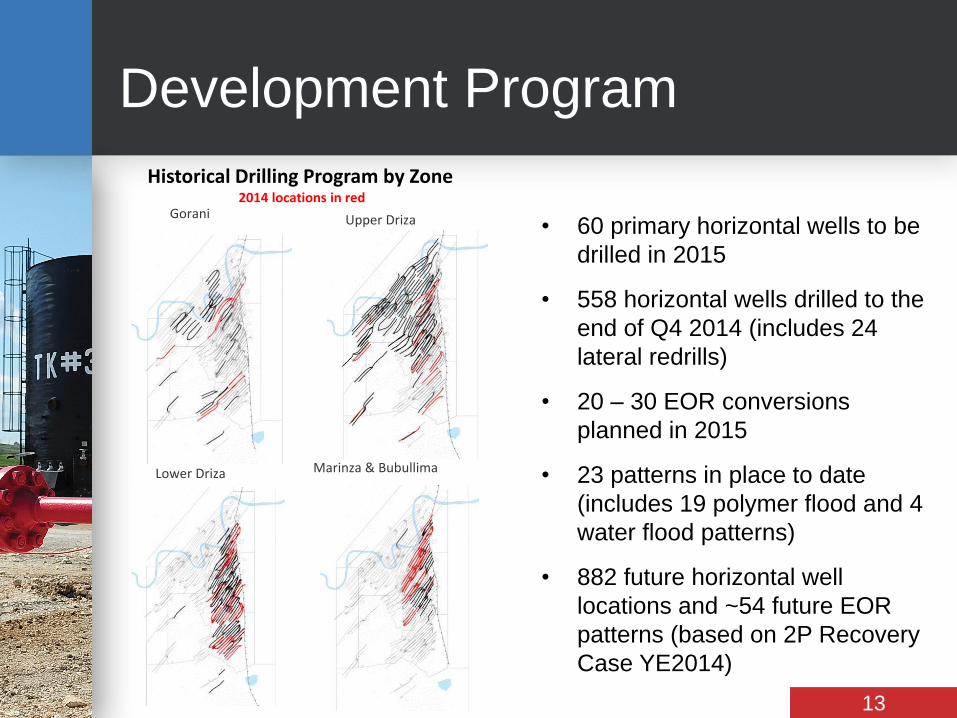
Development Program
• 60 primary horizontal wells to be
drilled in 2015
• 558 horizontal wells drilled to the
end of Q4 2014 (includes 24
lateral redrills)
• 20 – 30 EOR conversions
planned in 2015
• 23 patterns in place to date
(includes 19 polymer flood and 4
water flood patterns)
• 882 future horizontal well
locations and ~54 future EOR
patterns (based on 2P Recovery
Case YE2014)
Historical Drilling Program by Zone 2014 locations in red
Marinza & Bubullima
Gorani Upper Driza
Lower Driza
13

Netbacks
Netback ($/bbl) 2013 2014 Q4 2014
Brent $108.66 $98.95 $76.58
Sales Price
(% of Brent)
$85.39
(79%)
$77.26
(78%)
$57.29
(75%)
Royalties $14.22 $11.39 $8.36
Transportation $2.44 $2.38 $2.46
Energy $2.88 $2.25 $2.21
Well Servicing $2.77 $2.25 $2.18
Other $5.25 $5.75 $6.17
OPEX $13.34 $12.63 $13.02
Net Diluent $7.29 $5.67 $7.19
Transportation &
Terminal Fees $2.81 $2.21 $1.71
Sales &
Transport $10.10 $7.88 $8.90
Netbacks $47.73 $45.36 $27.01
14
$0
$10
$20
$30
$40
$50
$60
2009 2010 2011 2012 2013 2014

2015 Sales Contracts
Export Market
• 55% of 2015 volumes will be sold to the export market
• All export volumes committed to contracts at 79-80% of Dated Brent
• Counterparties in the Mediterranean, the United States
Domestic Market
• 45% of 2015 volumes will be sold to domestic refiners
• Agreement for 74% of Dated Brent FOB Vlora
15
Export Partners REPSOL
Spain
OMV
Austria
ENI
Italy
API
Italy
MOCOH
Trader

16
Surface Infrastructure Optimization
Lease Construction Well Pad Tie ins, Treating, Testing, Sour
Handling, Control & Automation
Satellite Treating
Facility
(Pad D/H, Sat 3)
Central Treating Facility (CTF)
Fier Hub Storage Sales Oil Transfer
Storage at PIA
(increasing storage &
loading capacity)
Tanker
(increasing load size
from 20,000 to
40,000MT)
Production
Gathering System
Disposal Pipeline
Water Disposal System
Disposal sites WTP

EOR Program
• 23 EOR patterns in operation at end of 2014, positive results to date
• 11.3 million barrels 2P Reserves booked in 2014
• 20 – 30 projected conversions in 2015 • half of planned conversions are expansion to existing patterns, half will be testing new areas
with high viscosity and thicker reservoir zones
• Polymer Flood
• 1st Polymer pattern initiated late Q1 2013
• 19 injection wells in 3 different zones at the end of 2014, distributed evenly in the D5, D4 and D3
• Viscosity range tested: 700 – 1,600 cP
• Water flood
• 1st pattern initiated in late Q2 2013
• 4 injection wells in the Upper Marinza (M0 and M) formation at the end of 2014;
• Viscosity range tested: 10 – 700 cP (best results in lower viscosity (<150 cP)
17

EOR Well Performance
18
0
1
2
3
4
5
6
7
8
9
10
0
50
100
150
200
250
0 10 20 30 40 50 60
Patt
ern
Co
un
t
Oil R
ate
(b
bl/
d)
Months On Injection
Average Polymer Flood Profile
1P Recovery Case (7%) 2P Recovery Case (8%) 3P Recovery Case (10%)
Oil Rate Primary Recovery Case Pattern Count
(6%)

0
50
100
150
200
250
300
350
2009 2010 2011 2012 2013 2014
0
50
100
150
200
250
300
350
2009 2010 2011 2012 2013 2014
Strong Balance Sheet
CAPEX (Millions of US$)
LIQUIDITY at December 31, 2014
Adjusted Cash Flow* (Millions of US$)
Working capital of 201 Million; CASH of $73 Million
Credit Facilities Facility Utilized Approved
Raiffeisen Bank $20 Million $0 Million $20 Million
IFC / EBRD $204 Million $104 Million $100 Million
Total $224 Million $104 Million $120 Million
Financial hedge (Put Option) in place 2015 - 6,000 bopd at $80/bbl Dated Brent 19
* Before contract settlement expense

Previous Albpetrol well
Re-activated well
LIABILITY MANAGEMENT BY CONTINUOUS CLEAN-UP
Health, Safety, Environment &
Community Relations
Environmental
•Clean-up and remediation
•Meeting International
standards
Economic Development
•Agricultural Programs
•Supporting Sustainable
business
Stakeholder Engagement
•Building Capacity
•Reducing Impacts
•Occupational Training
Health & Safety
•Creating safe work environments
•Trained and competent workforce
20
Corporate & Social Responsibility

21
Corporate & Social Responsibility
Program
Community Investments by Year
TOTAL
2012 2013 2014
Economic Development $ 190,628 $ 532,116 $ 740,327 $ 1,463,071
Quality of Life Improvement $ 288,851 $ 497,894 $ 375,022 $ 1,161,767
General Local Plans/ Compliance/ Other
$ 33,774 $ 690,213 $ 231,240 $ 955,227
TOTAL $ 513,253 $ 1,720,223 $ 1,346,589 $ 3,580,065
Examples of Investments: • Economic Development: 690 students have graduated from Bankers
Vocational and English Training Programs to date • Quality of Life Improvements: Bankers collaborates with local Communes
and Municipalities to invest in local roads, schools, parks and health clinics • General Local Plans: In 2013, Bankers supported seven Communes and
Municipalities in our area to develop General Local Plans

David French
President & CEO
Rob Carss
VP, HSSE
Doug Urch
Executive VP Finance
& CFO
Leonidha Çobo
VP & General Director
Albania
Suneel Gupta
Executive VP & COO
Mark Hodgson
VP, Business
Development
Bayne Assmus VP, Production & Operations
Craig Nardone
VP, Exploration &
Development
Management Team
22

Board of Directors
Robert Cross, Chairman Private investor; over 20 years experience financing companies in the resource sector and is on the board of several Canadian energy and mining companies
Abdel (Abby) Badwi, Vice Chairman
Retired from President and CEO of Bankers Petroleum in April 2013; more than 40 years experience in the exploration, development and production of international oil and gas fields. Previously President and CEO of Rally Energy Corp.
Eric Brown President, E.M.Brown Consulting Corporation. Previously held the position of Regional Managing Partner for Meyers Norris Penny, LLP
General Wesley Clark (ret.) CEO, Wesley Clark & Associates since 2004; Chairman of Rodman & Renshaw from February 2006. Senior Fellow, UCLA’s Burkle Centre for International Relations
David French President and CEO, Bankers Petroleum since April 2013; 23 years experience in the development and production of oil and gas fields in North America and overseas. Previously held the position of VP, Business Development, of Apache Corporation
Jonathan Harris Business Consultant, Genet Consulting Ltd since February 2005; Chief Operating Officer and Director of Anglo-African Minerals Plc from May 2009 to February 2012; Previously COO of Tribeka Ltd and director of Eastern Platinum Ltd. London, UK based
Phil Knoll President, Corridor Resources from October 2010 to September 2014; Executive Vice President, Duke Energy from March 2002 to July 2005; Director of Corridor Resources, AltaGas Utility Group; former Director of Rally Energy
Ian McMurtrie Previously Executive VP, Exploration & Development, Bankers Petroleum Ltd. and Vice President, Exploration of Rally Energy Corp. Former Chairman, Porto Energy Corp.
John Zaozirny Vice-Chairman, Canaccord Financial Inc.; Previously Counsel, McCarthy Tetrault LLP. Currently on the Board of Directors for numerous Canadian oil and gas companies
23

Analyst Coverage
Canaccord Genuity Christopher
Brown
Industrial Alliance
Securities Amin Haque
CIBC Dave Popowich Mackie Research Mark Heim
Cormark Securities Garett Ursu Pareto Securities Aaditya Chintalapati & Thomas Aarrestad
Credit Suisse David Phung RBC Capital Markets Al Stanton
Dundee Capital
Markets David Dudlyke Scotiabank Gavin Wylie
FirstEnergy Darren Engels TD Securities Jamie
Somerville
GMP David Beddis Wood & Company Robert Rethy
Haywood Securities Darrell Bishop
24

Thank You