Embed Size (px)
Citation preview
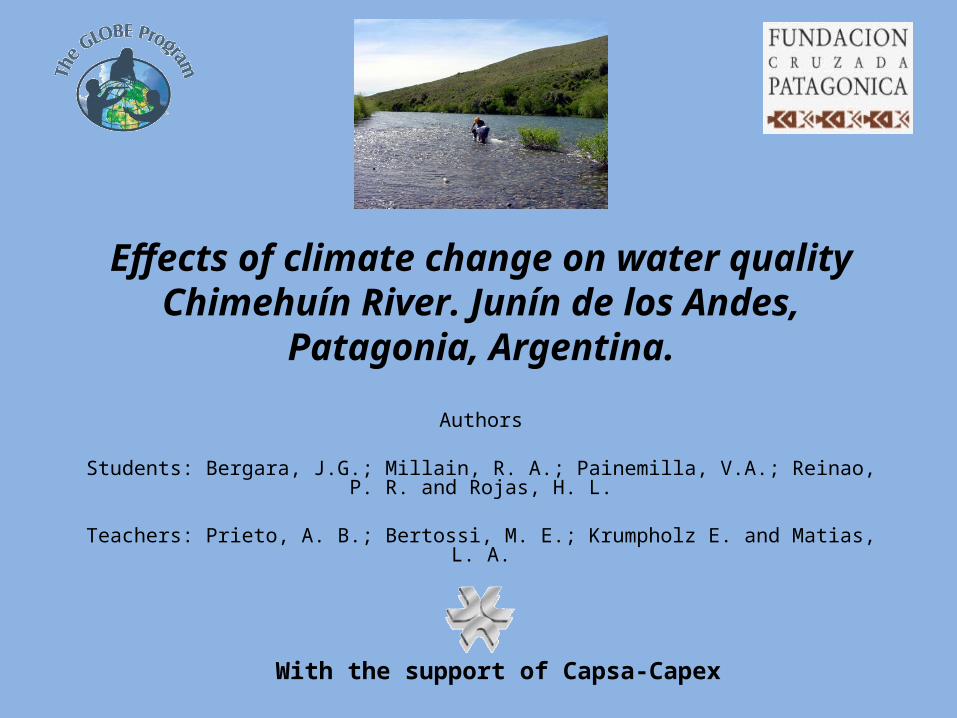
Effects of climate change on water quality Chimehuín River. Junín de los Andes, Patagonia,
Argentina.
Authors
Students: Bergara, J.G.; Millain, R. A.; Painemilla, V.A.; Reinao, P. R. and Rojas, H. L.
Teachers: Prieto, A. B.; Bertossi, M. E.; Krumpholz E. and Matias, L. A.
With the support of Capsa-Capex

Model of the greenhouse effect. (IPCC, 2007)

Increase of the registered global temperatures and the estimations for the future according to the different
models. IPCC, 2007.

Changes in the annual averages of temperatures, observed and estimated by models. The temperatures
show tendency to heating. IPCC, 2007.
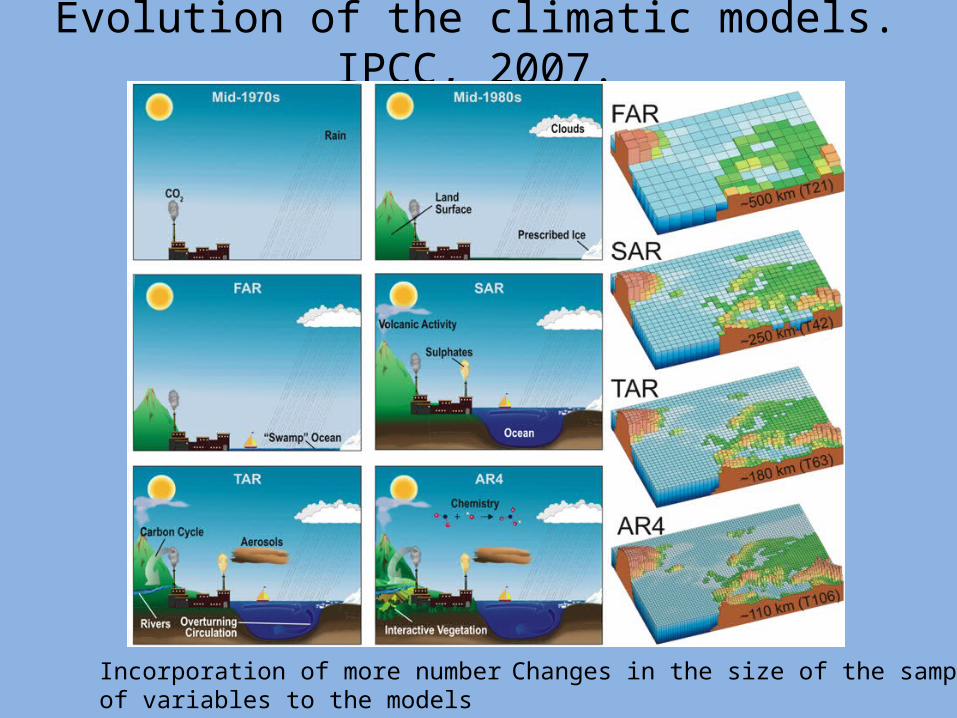
Evolution of the climatic models. IPCC, 2007.
Incorporation of more number of variables to the models
Changes in the size of the sample

Episodes of heat (red) and cold (blue) of the Oceanic Index of “El Niño.” Averages of anomalies of three months of “El Niño” (5ºN-5ºS, 120º-170ºW). (CPC.
http://www.cpc.noaa.gov/products/analysis_monitoring/ensostuff/ensoyears.shtml)
Year DJF JFM FMA MAM AMJ MJJ JJA JAS ASO SON OND NDJ
1996 -0.8 -0.7 -0.5 -0.3 -0.2 -0.2 -0.1 -0.2 -0.1 -0.2 -0.3 -0.4
1997 -0.4 -0.3 -0.1 0.3 0.8 1.3 1.7 2.0 2.2 2.4 2.5 2.5
1998 2.3 2.0 1.4 1.1 0.4 -0.1 -0.7 -1.0 -1.1 -1.2 -1.4 -1.5
1999 -1.5 -1.2 -0.9 -0.8 -0.8 -0.8 -0.9 -1.0 -1.0 -1.2 -1.4 -1.7
2000 -1.7 -1.4 -1.0 -0.8 -0.6 -0.6 -0.4 -0.4 -0.4 -0.5 -0.7 -0.7
2001 -0.7 -0.5 -0.4 -0.3 -0.1 0.1 0.1 0.0 0.0 -0.1 -0.1 -0.2
2002 -0.1 0.1 0.2 0.4 0.6 0.8 0.9 0.9 1.1 1.3 1.5 1.4
2003 1.2 0.9 0.5 0.1 -0.1 0.0 0.3 0.4 0.5 0.5 0.6 0.4
2004 0.4 0.2 0.2 0.2 0.3 0.4 0.7 0.8 0.9 0.8 0.8 0.8
2005 0.6 0.5 0.4 0.5 0.5 0.5 0.5 0.3 0.2 -0.1 -0.4 -0.8
2006 -0.8 -0.6 -0.3 -0.1 0.2 0.3 0.4 0.5 0.7 0.9 1.2 1.1
2007 0.8 0.4 0.1 -0.1 0.0 -0.1 -0.2 -0.5 -0.8 -1.1 -1.2 -1.4

Increase of the annual mean temperature
(1884 at 2006)
Credits: NASA/GISS and NASA/GSFC/SVS.
The more warm years from 1890
Orderly according to their average of temperature
1) 20062) 20053) 19984) 20025) 20036) 2004
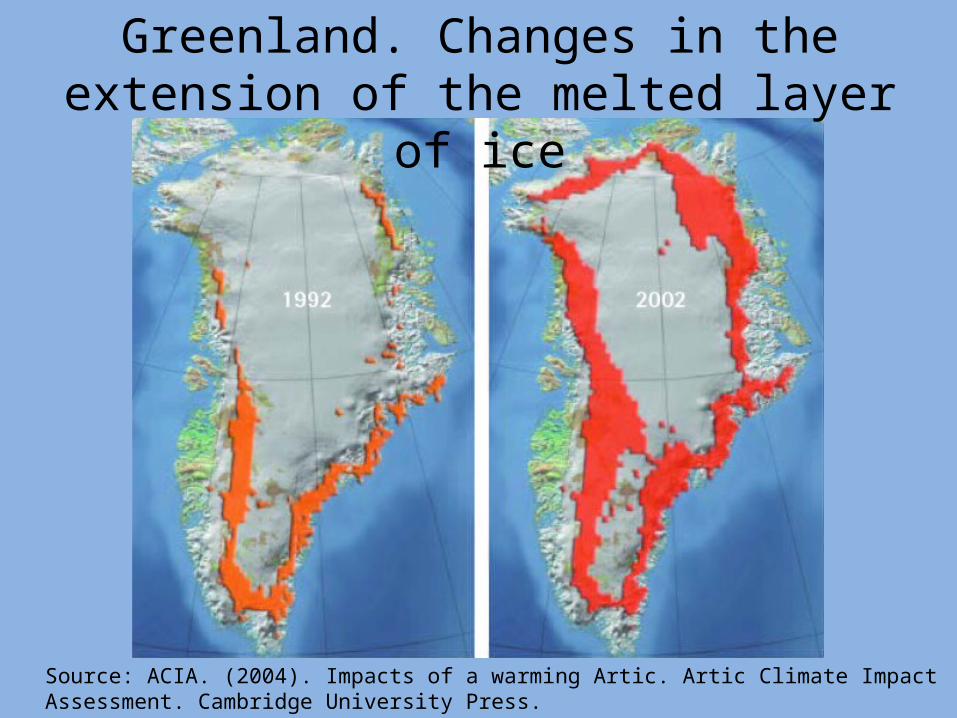
Greenland. Changes in the extension of the melted layer of ice
Source: ACIA. (2004). Impacts of a warming Artic. Artic Climate Impact Assessment. Cambridge University Press.

Antartida: Ice Barrier Larsen
Source: “The inconvenient truth".
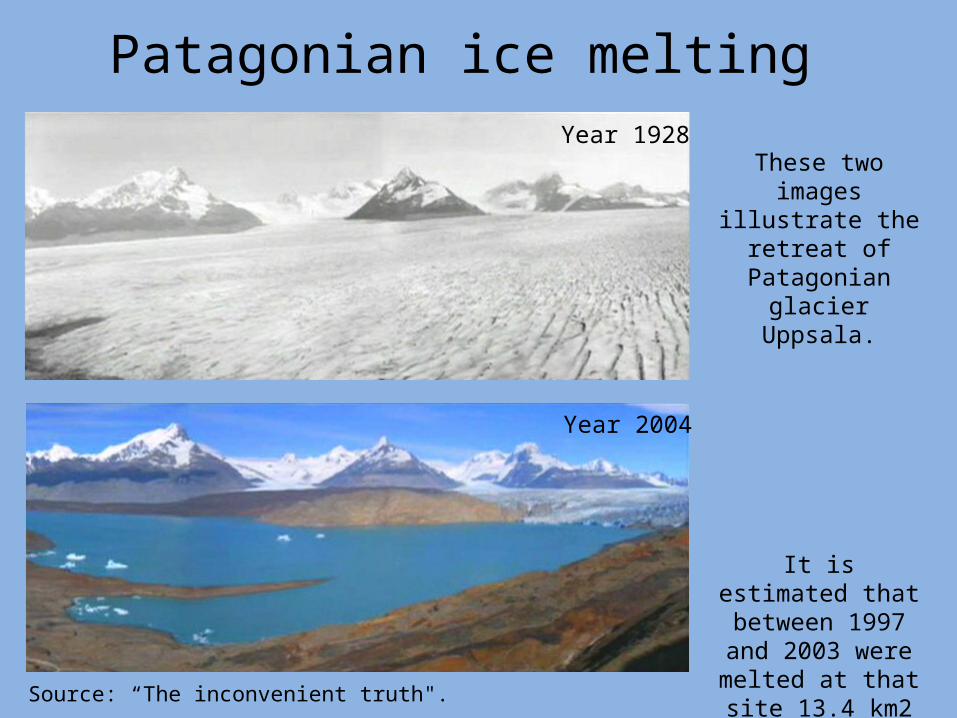
These two images illustrate the retreat
of Patagonian glacier Uppsala.
It is estimated that between 1997 and 2003 were melted at that site 13.4
km2 of ice.
Patagonian ice melting
Source: “The inconvenient truth".
Year 1928
Year 2004
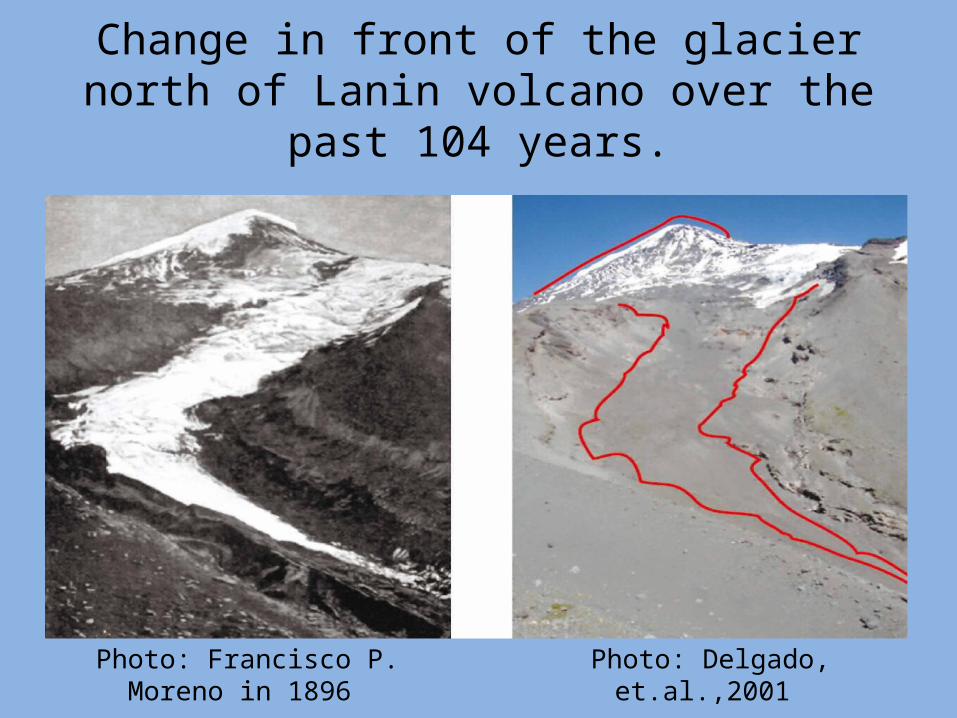
Change in front of the glacier north of Lanin volcano over the past 104 years.
Photo: Delgado, et.al.,2001 Photo: Francisco P. Moreno in 1896
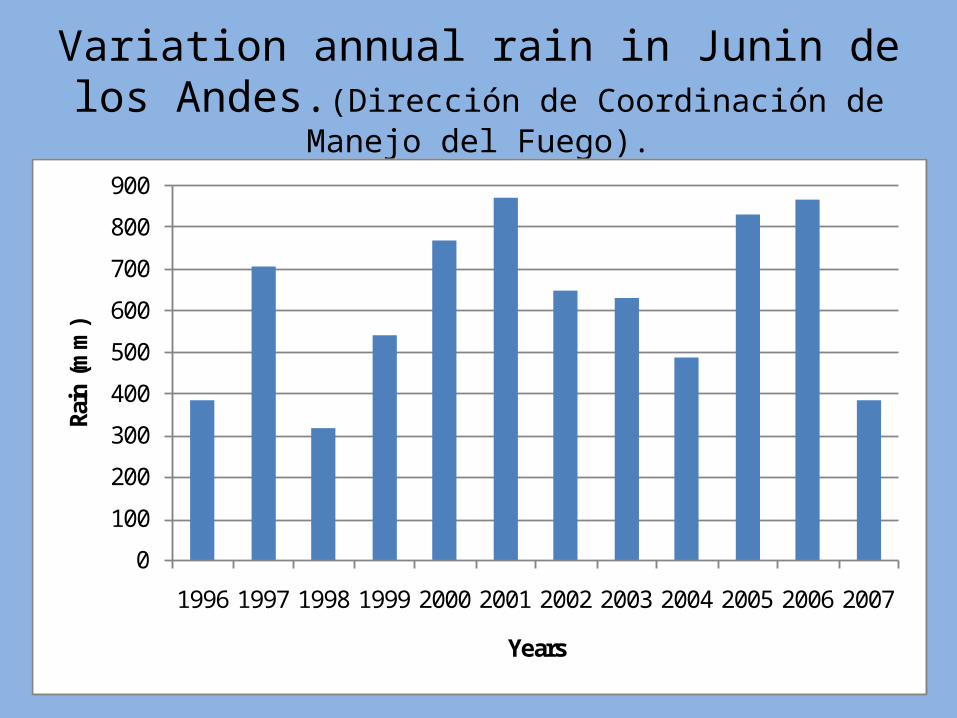
Variation annual rain in Junin de los Andes.(Dirección de Coordinación de Manejo del Fuego).
0
100
200
300
400
500
600
700
800
900
1996 1997 1998 1999 2000 2001 2002 2003 2004 2005 2006 2007
Rain
(m
m)
Years
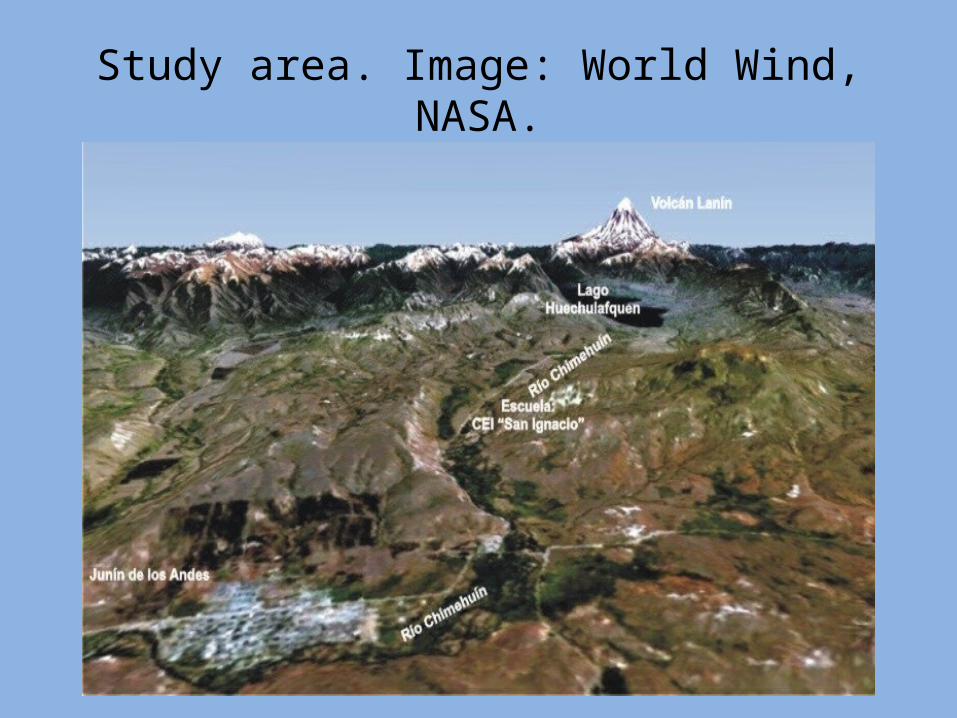
Study area. Image: World Wind, NASA.
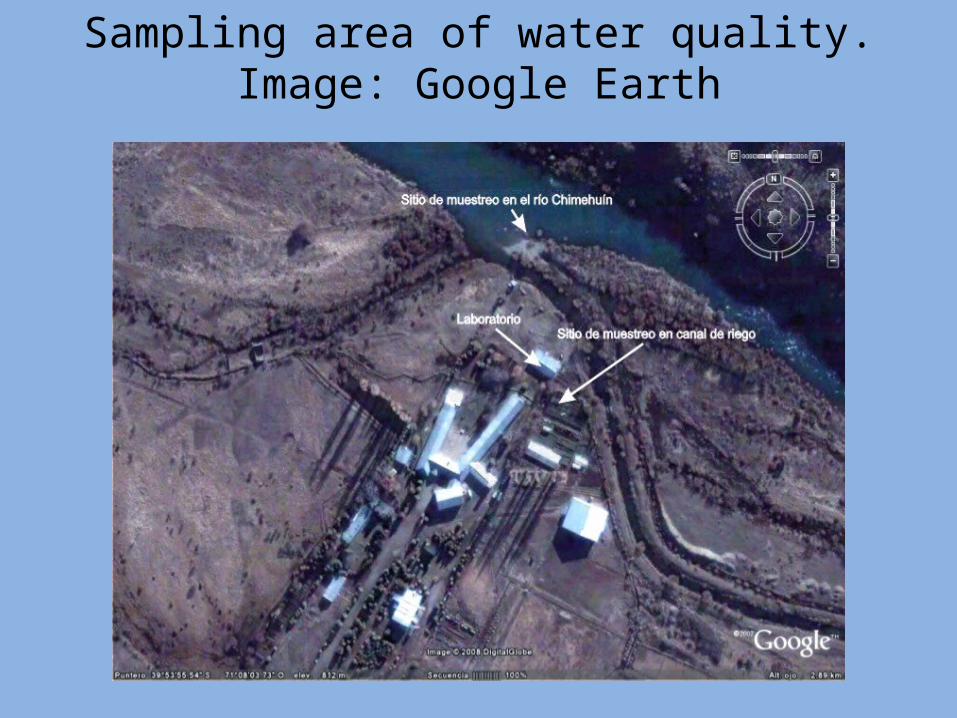
Sampling area of water quality.Image: Google Earth
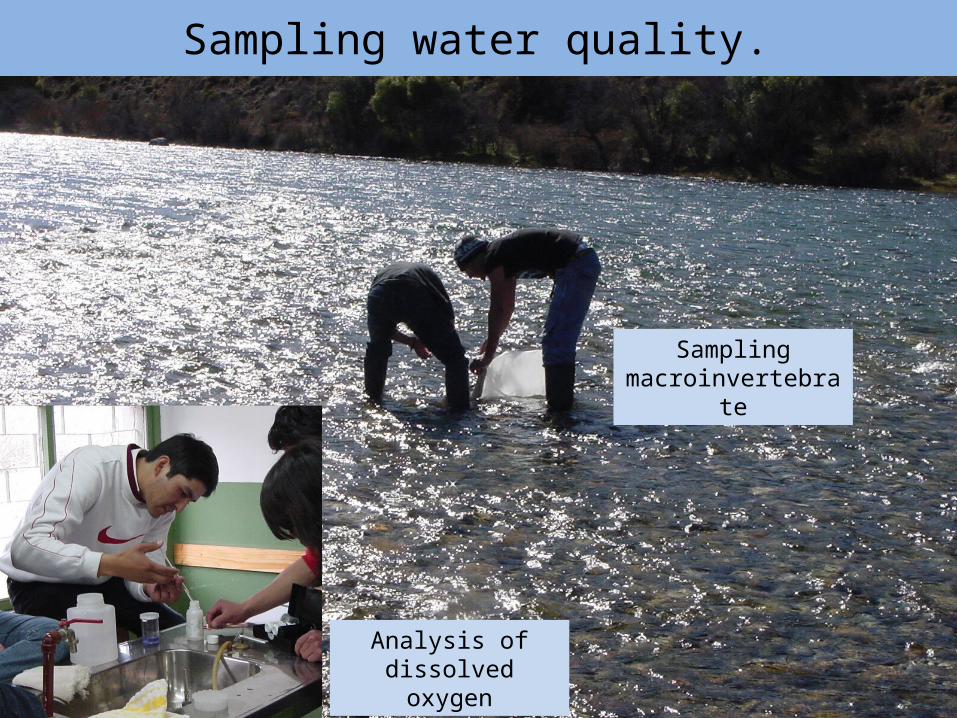
Sampling water quality.
Sampling macroinvertebrate
Analysis of dissolved oxygen

Hypothesis• Hypothesis1: The temperatures, thermal amplitude, humidity,
rains and followed days without rains in the last years in Junín of the Andes don't coincide with the hottest years to global scale.
• Hypothesis2: The flows of the river Chimehuín are the same in the last years and they are not affected by the hottest years to global scale.
• Hypothesis3: The quality of the water doesn't change with the fluctuations of the flow of the river Chimehuín and in the watering channel.
• Hypothesis4: The quality of the water of the river Chimehuín has not changed in the last years.
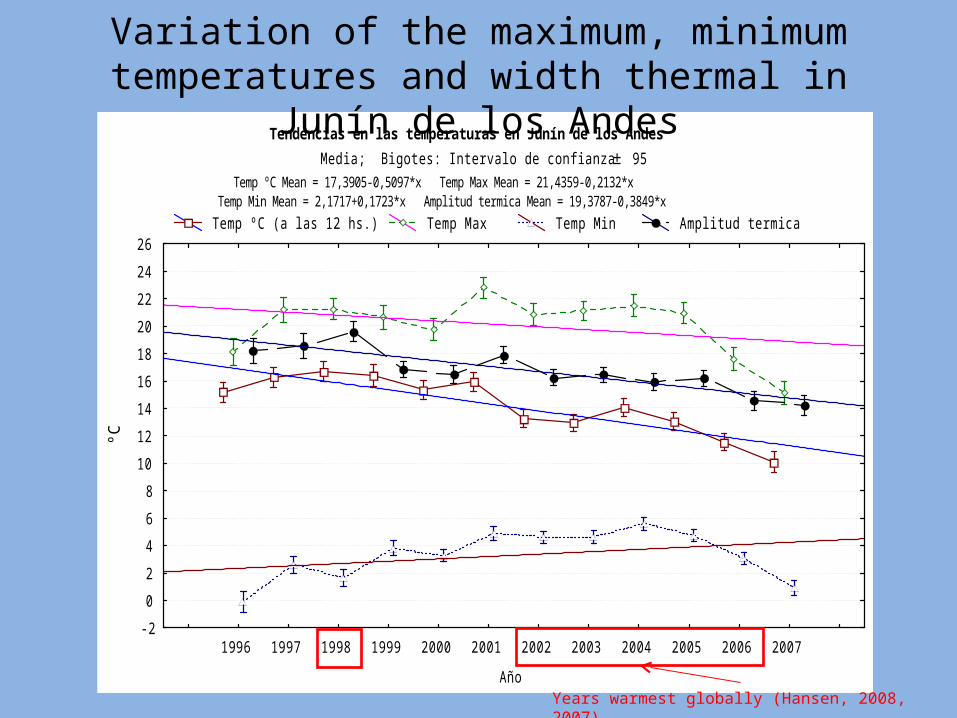
Tendencias en las temperaturas en Junín de los Andes
Media; Bigotes: Intervalo de confianza ± 95
Temp ºC Mean = 17,3905-0,5097*x Temp Max Mean = 21,4359-0,2132*x Temp Min Mean = 2,1717+0,1723*x Amplitud termica Mean = 19,3787-0,3849*x
Temp ºC (a las 12 hs.) Temp Max Temp Min Amplitud termica
1996 1997 1998 1999 2000 2001 2002 2003 2004 2005 2006 2007
Año
-2
0
2
4
6
8
10
12
14
16
18
20
22
24
26
ºC
Years warmest globally (Hansen, 2008, 2007)
Variation of the maximum, minimum temperatures and width thermal in Junín de los Andes
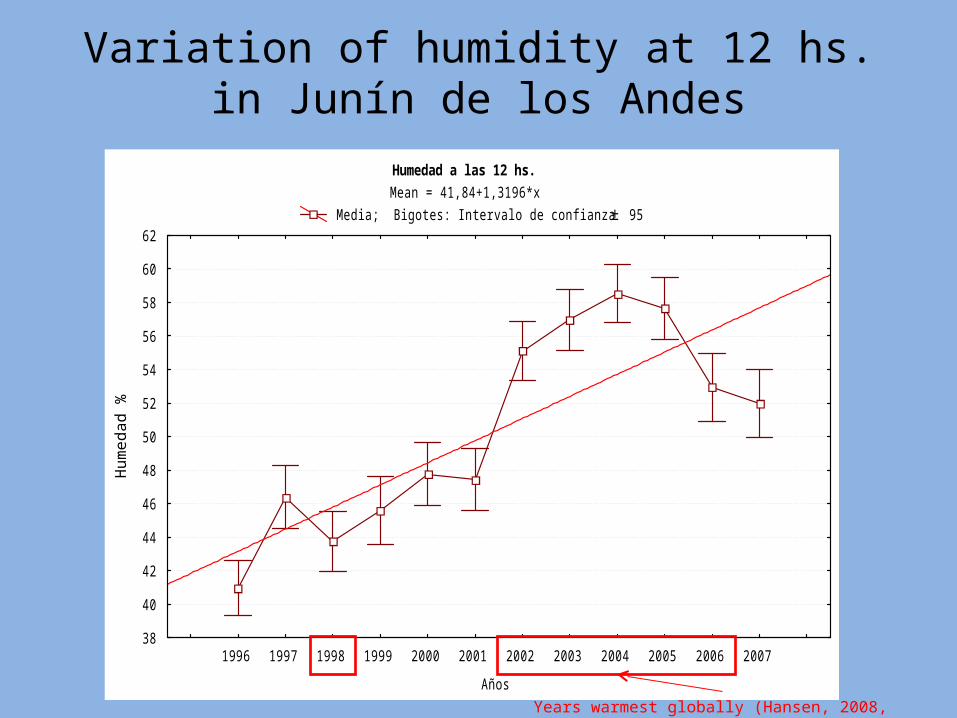
Variation of humidity at 12 hs. in Junín de los Andes
Humedad a las 12 hs.
Mean = 41,84+1,3196*x
Media; Bigotes: Intervalo de confianza ± 95
1996 1997 1998 1999 2000 2001 2002 2003 2004 2005 2006 2007
Años
38
40
42
44
46
48
50
52
54
56
58
60
62
Hu
me
da
d %
Years warmest globally (Hansen, 2008, 2007)

Variation of the rains and the followed days without rains in Junín de los Andes.
Lluvia vs. Días seguidos sin lluvias
Media; Bigotes: Intervalo de confianza ± 95
Días seguidos sin lluvia Mean = 15,511-0,948*x Lluvia mm Mean = 1,4548+0,0404*x Días seguidos sin lluvia Lluvia mm
1996 1997 1998 1999 2000 2001 2002 2003 2004 2005 2006 2007
Años
-2
0
2
4
6
8
10
12
14
16
18
20
22
24
26
Nº
de
día
s
Years warmest globally (Hansen, 2008, 2007)

Caudal del río Chimehuín
Media; Bigotes: Intervalo de confianza ± 95
Caudal del Río Chimehuín
Caudal m 3/seg Chimehuin: F(34,11216) = 39,0268324, p = 00,0000
19
72
19
73
19
74
19
75
19
76
19
77
19
78
19
79
19
80
19
81
19
82
19
83
19
84
19
85
19
86
19
87
19
88
19
89
19
90
19
91
19
92
19
93
19
94
19
95
19
96
19
97
19
98
19
99
20
00
20
01
20
02
20
03
20
04
20
05
20
06
Año
20
30
40
50
60
70
80
90
100
110
Ca
ud
al (
m3/s
eg
)Variation of the flow of the river Chimehuín
Years warmest globally (Hansen, 2008, 2007)
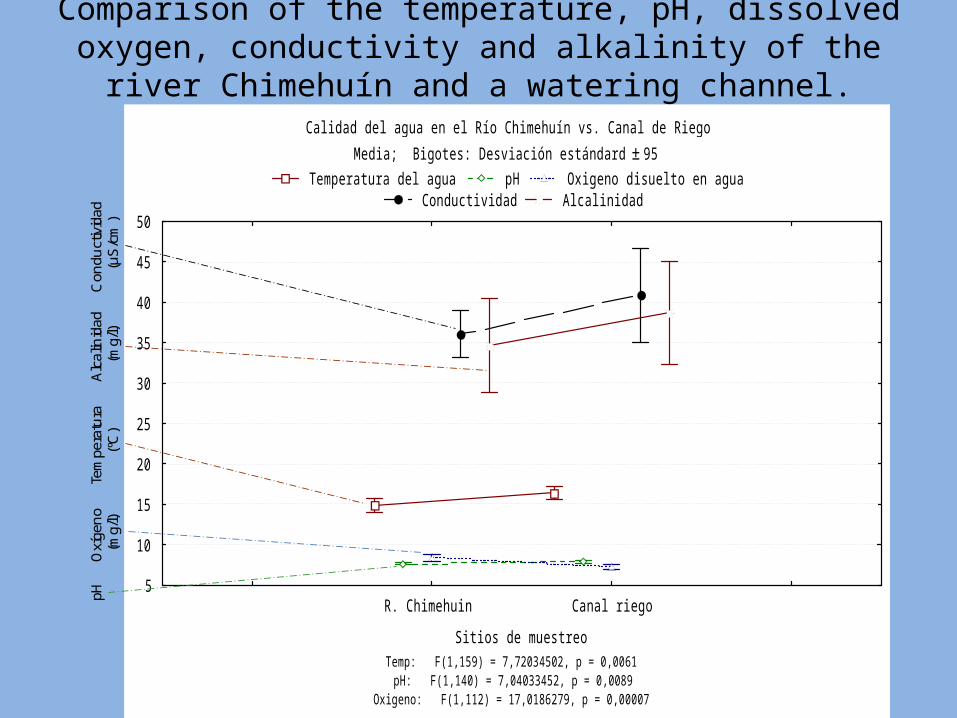
Calidad del agua en el Río Chimehuín vs. Canal de Riego
Media; Bigotes: Desviación estándard ± 95
Temperatura del agua pH Oxigeno disuelto en agua Conductividad Alcalinidad
Temp: F(1,159) = 7,72034502, p = 0,0061 pH: F(1,140) = 7,04033452, p = 0,0089
Oxigeno: F(1,112) = 17,0186279, p = 0,00007
R. Chimehuin Canal riego
Sitios de muestreo
5
10
15
20
25
30
35
40
45
50
Con
duct
ivid
ad(µ
S/c
m)
Alc
alin
idad
(mg/
l)Te
mpe
ratu
ra(º
C)
Oxí
gen
o(m
g/l)
pH
Comparison of the temperature, pH, dissolved oxygen, conductivity and alkalinity of the river Chimehuín and a watering channel.
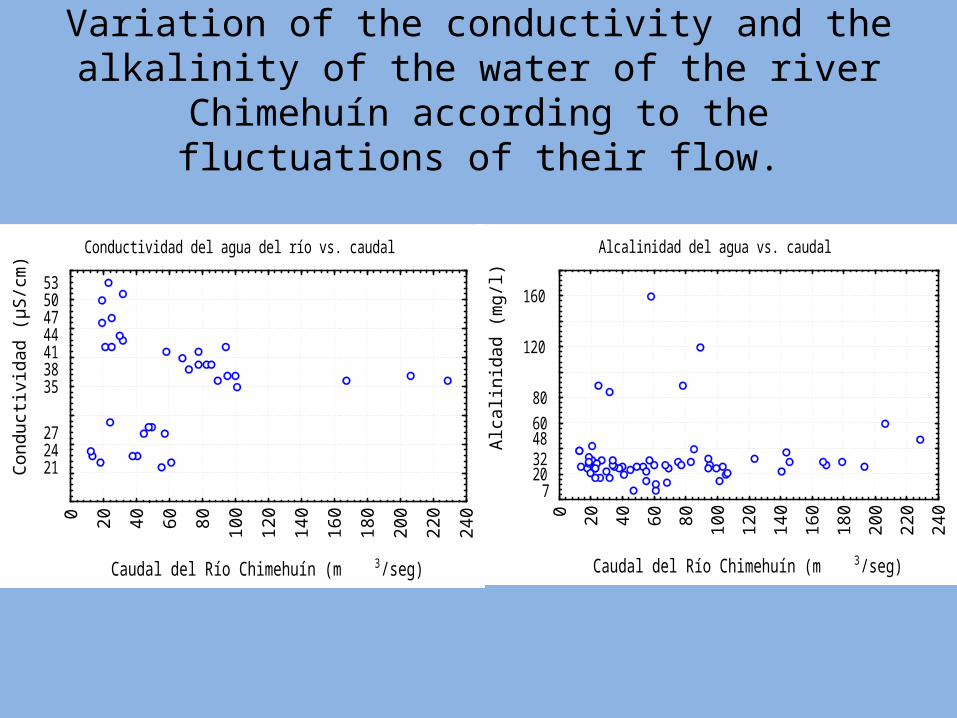
Variation of the conductivity and the alkalinity of the water of the river Chimehuín according to the
fluctuations of their flow.
Conductividad del agua del río vs. caudal
0 20
40
60
80
10
0
12
0
14
0
16
0
18
0
20
0
22
0
24
0
Caudal del Río Chimehuín (m 3/seg)
212427
35384144475053
Co
nd
uct
ivid
ad
(µ
S/c
m)
Alcalinidad del agua vs. caudal
0 20
40
60
80
10
0
12
0
14
0
16
0
18
0
20
0
22
0
24
0
Caudal del Río Chimehuín (m 3/seg)
720324860
80
120
160
Alc
alin
ida
d (
mg
/l)

ConclusionsMeteorological data of Junin de los Andes (Years
1992 to 2007):
• The maximum temperatures have diminished and the minimum ones have increased, reducing the thermal amplitude in the last years.
• The rains stay low but they are distributed into more regular intervals, impacting possibly in the increase of the humidity.

Conclusions
• In spite of the inter-annual variability of the flows, the data show a tendency to decreasing.
• The quality of the water of the river compared with the water of the channel shows a slight deterioration in this last one for effect of the low flow.
• This tendency is also observed in the river Chimehuín in the years of low flow.
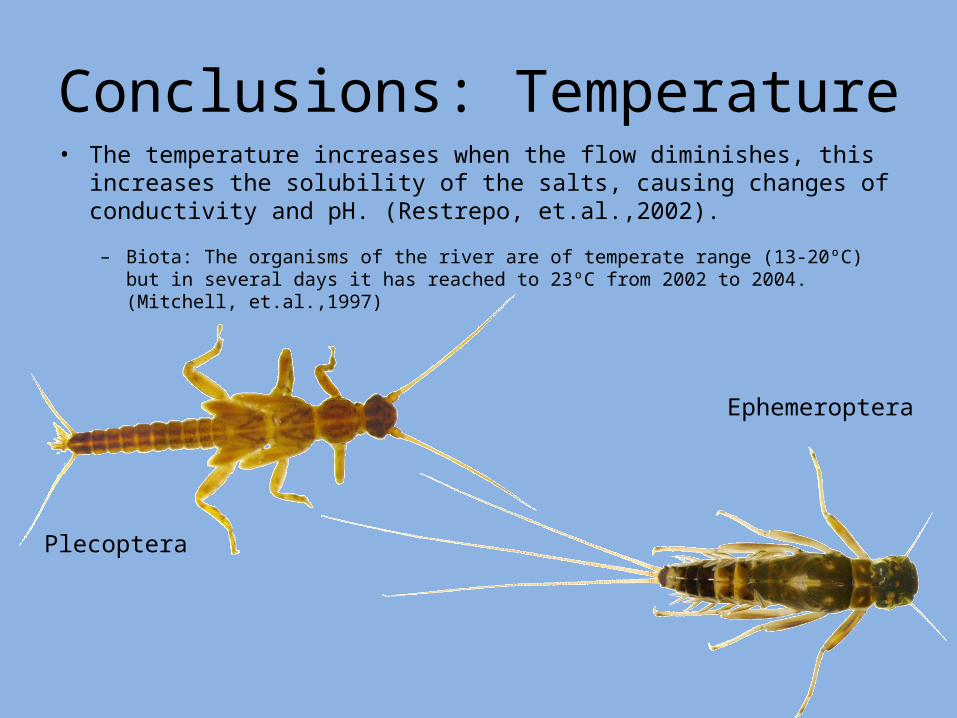
Conclusions: Temperature• The temperature increases when the flow diminishes, this increases the
solubility of the salts, causing changes of conductivity and pH. (Restrepo, et.al.,2002).
– Biota: The organisms of the river are of temperate range (13-20ºC) but in several days it has reached to 23ºC from 2002 to 2004. (Mitchell, et.al.,1997)
Plecoptera
Ephemeroptera

Conclusions: pH• The pH increases significantly in the channel to the river,
getting alkaline. This is more notorious in summer where some day’s pH 9 was registered.
– Biota: pH 6.5 – 8.2 is the best range for most of the biota. (Murdoch, et.al., 1997) as much the salmónidos as the macroinvertebrados that serve them as food (Trichoptera, Ephemeropthera, Plecopthera) (Roa, et.al.,1993 and Ávila, et.al.,2004) are sensitive to the pH changes.
– Watering: The FAO settles down (pH 6,5-8,4). The registered values in the watering channels are into this range, although in summer it is sometimes overcome. This water is also used it to him for watering in greenhouses where the best range is more narrow and therefore it is alkaline. (Ayers,et.al.,1994).
Conclusiones: pH• Consumo humano: La OMS establece un rango óptimo de pH 6,5 a 9,5.
(CEPIS, 2008) Los valores están dentro de éstos rangos. Un pH alto puede generar una sensación jabonosa en el sabor del agua.
• Riego: La FAO establece (pH 6,5-8,4). – Los valores registrados en los canales de riego integran éste rango, aunque en verano a veces
se supera. – Para riego en invernaderos el rango óptimo (pH 5,5-6,5) es más estrecho y por lo tanto
resulta alcalina. (Ayers,et.al.,1994, Bodnar,et.al.,1996; Criswell,et.al.,2001). – Si el pH alto se combina con valores altos de alcalinidad pueden presentar problemas de
incrustaciones en canillas y cañerías. (Criswell,et.al., 2001) Pero la alcalinidad es baja.
• Recreación: La OMS establece como rango óptimo (pH 6,5-9). En el río, donde se utiliza el agua con éste objetivo los valores registrados están dentro de éste rango. (CEPIS, 2008)

Conclusions: Dissolved oxygen
• The oxygen dissolved in the water is a restrictive factor for the aquatic life. – Biota: The EPA settles down for the life aquatic bigger
values than 5 mg/l, however for eggs and salmónidos alevinos, smaller values to 8 mg/l produce a moderate deterioration of the production. (Jackson, et.al.,2000).
– The values of dissolved oxygen in the water of the river are higher than in the channel. The registered values in the river are inside the required range for the species that inhabit it, while in the channel some day’s low values are registered 5mg/l.

Conclusions: Conductivity and Alkalinity
• A low flow values of conductivity and alkalinity have high variability, in contrast with high flow values are stabilized.
• A lesser flow impact from the terrestrial ecosystem is greater.
Conclusions• The scenarios of climatic change predicted for the region
(temperature increasing, decrease of the precipitations and of the flows), added to the anthropic impacts of the future urbanizations, they will impact in the quality of the water, as it is visualized in the watering channel.
• The changes observed in the humidity, flow and temperatures tend to affect the conductivity and the alkalinity, but a bigger number of measurements are needed to verify this tendency because the available period cover in the most to the hottest years that also coincide with events of “El Niño.”

Discussion• Although few years of continuous sampling of quality
of the water, can help:– The planning of a sustainable community – The taking of environmental conscience by part of the
population in general, especially considering the future urban developments planned
• They also represent an important antecedent for the future, because it is still low population's density.
• Our school is an agrotechnic one and these results are applied to the agricultural and industrial production (food production).

Discussion• As for the recommendations to mitigate the
effects previously pointed out we propose to settle down:
– Measures of conservation of the soil and fundamentally of the costs of the river and the watering channel.
– The costs are buffer area between two ecosystems.

The effects of climatic change in the flows of the rivers Chimehuín, Malleo and Quilquihue and their
relationship with the humidity of the steppe and “mallín” (wetland) land.
Authors:
Students: Ancalao, J. G.; Barria, R.C.; Fuentes, A. B.; Lagos, B. C.; Racedo, L. N. and Torres N. S.
Teachers: Prieto, A. B.; Bertossi, M. A.; Krumpholz, E. and Bubenick, L.
With the support of Capsa-Capex
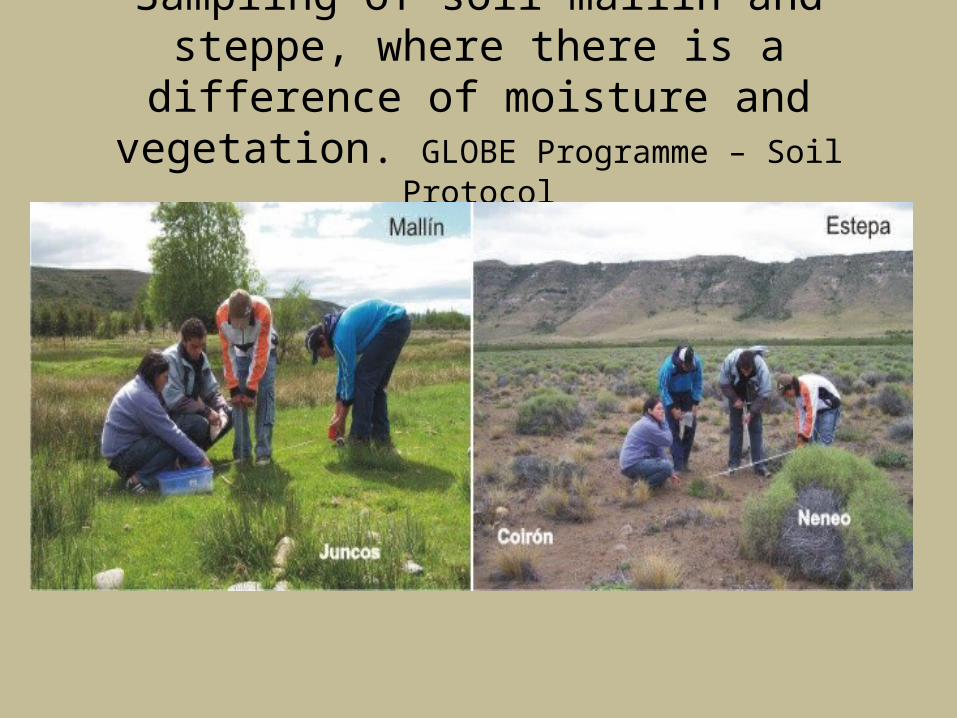
Sampling of soil mallin and steppe, where there is a difference of moisture and vegetation. GLOBE
Programme – Soil Protocol
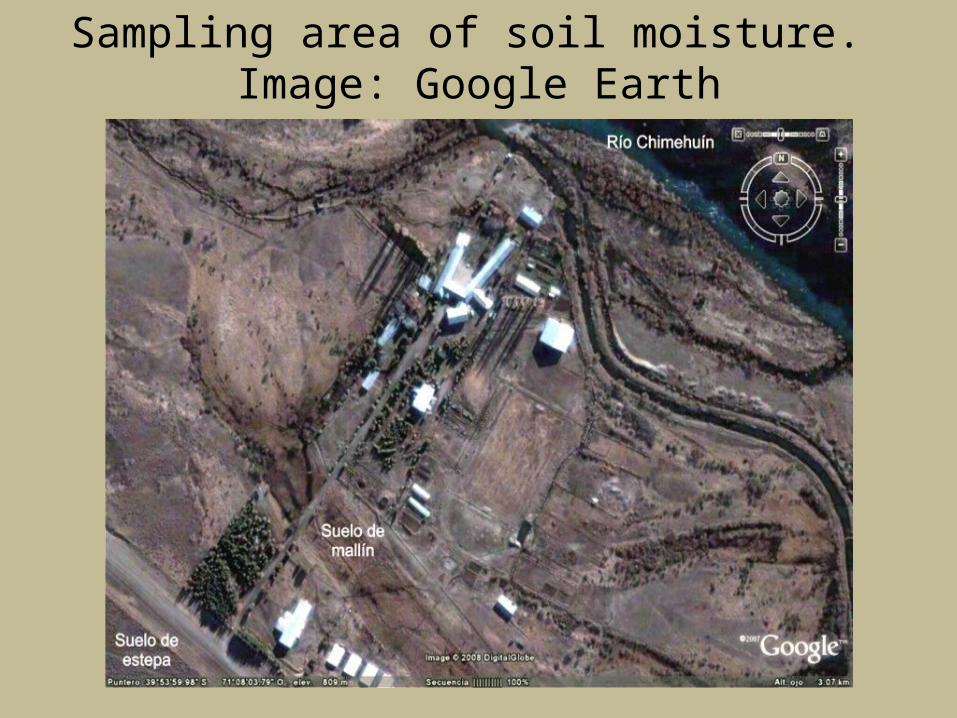
Sampling area of soil moisture. Image: Google Earth

Study area flow. Image: World Wind, NASA.
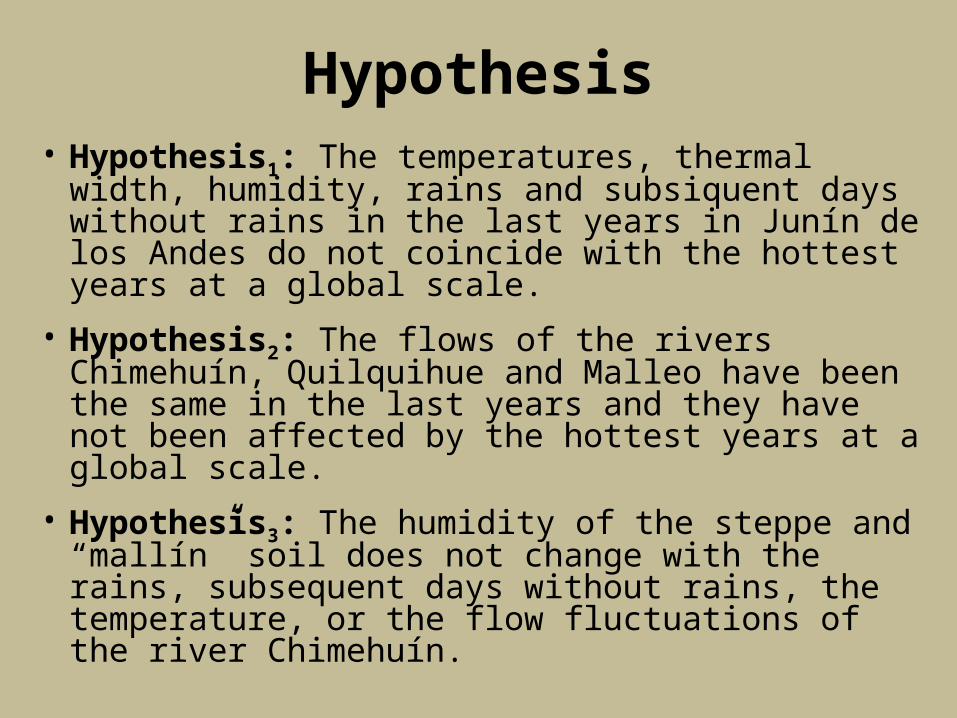
Hypothesis• Hypothesis1: The temperatures, thermal width,
humidity, rains and subsiquent days without rains in the last years in Junín de los Andes do not coincide with the hottest years at a global scale.
• Hypothesis2: The flows of the rivers Chimehuín, Quilquihue and Malleo have been the same in the last years and they have not been affected by the hottest years at a global scale.
• Hypothesis3: The humidity of the steppe and “mallín” soil does not change with the rains, subsequent days without rains, the temperature, or the flow fluctuations of the river Chimehuín.
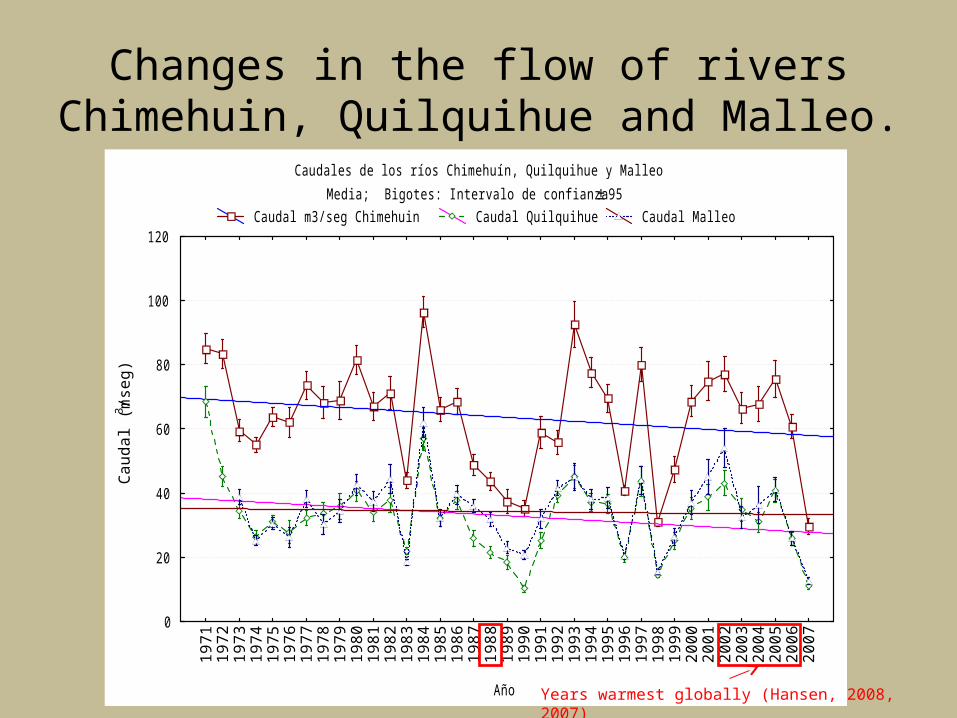
Changes in the flow of rivers Chimehuin, Quilquihue and Malleo.
Caudales de los ríos Chimehuín, Quilquihue y Malleo
Media; Bigotes: Intervalo de confianza ± 95
Caudal m3/seg Chimehuin Caudal Quilquihue Caudal Malleo1
97
11
97
21
97
31
97
41
97
51
97
61
97
71
97
81
97
91
98
01
98
11
98
21
98
31
98
41
98
51
98
61
98
71
98
81
98
91
99
01
99
11
99
21
99
31
99
41
99
51
99
61
99
71
99
81
99
92
00
02
00
12
00
22
00
32
00
42
00
52
00
62
00
7
Año
0
20
40
60
80
100
120
Ca
ud
al (
m3 /s
eg
)
Years warmest globally (Hansen, 2008, 2007)

Differences between soil moisture steppe and mallin
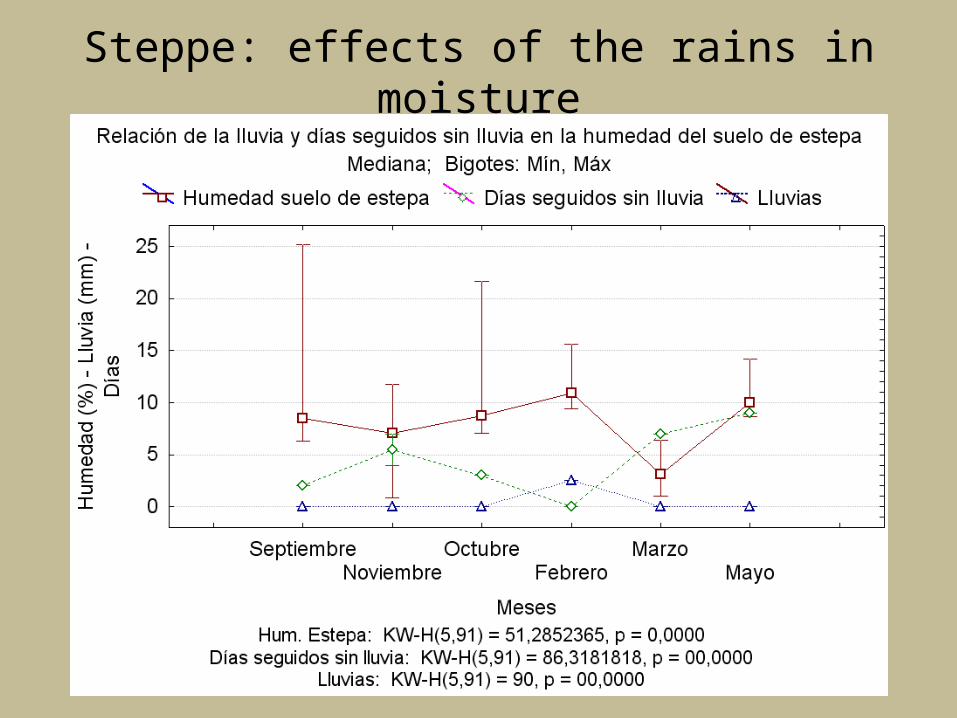
Steppe: effects of the rains in moisture
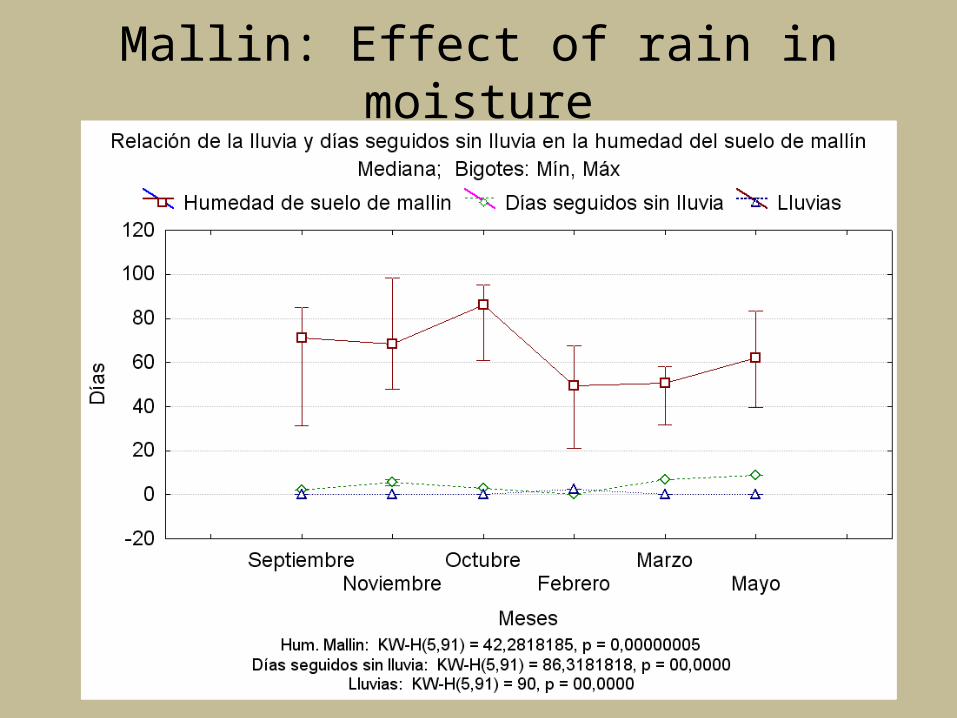
Mallin: Effect of rain in moisture

Steppe: Effect of temperature

Mallin: Effect of temperature

Humidity soil steppe and mallin vs. Chimehuin River flow
Humedad de los suelos de estepa y mallín vs. caudal del río Chimehuín
Mediana; Bigotes: Mín, Máx Hum. Estepa Hum. Mallin Caudal del río Chimehuín
Hum. Estepa: KW-H(5,91) = 51,2852365, p = 0,0000 Hum. Mallin: KW-H(5,91) = 42,2818185, p = 0,00000005
Caudal Chime: KW-H(5,91) = 83,5714286, p = 0,0000
SeptiembreNoviembre
OctubreFebrero
MarzoMayo
Meses
0
20
40
60
80
100
Hu
me
da
d (
%)
- C
au
da
l (m
3 /se
g)

Conclusions• In spite of interanual variability of the flows of the
rivers Chimehuín and Quilquihue, e data show a decreassing tendency, (AIC, 1996 a 2007; Araneo, et.al.,2005; Compagnucci, et.al.,2005)
• The flow of the river Malleo which has a tendency to increase during the same considered period. This last can be due to local effects that are not considered in the present work.
Conclusions
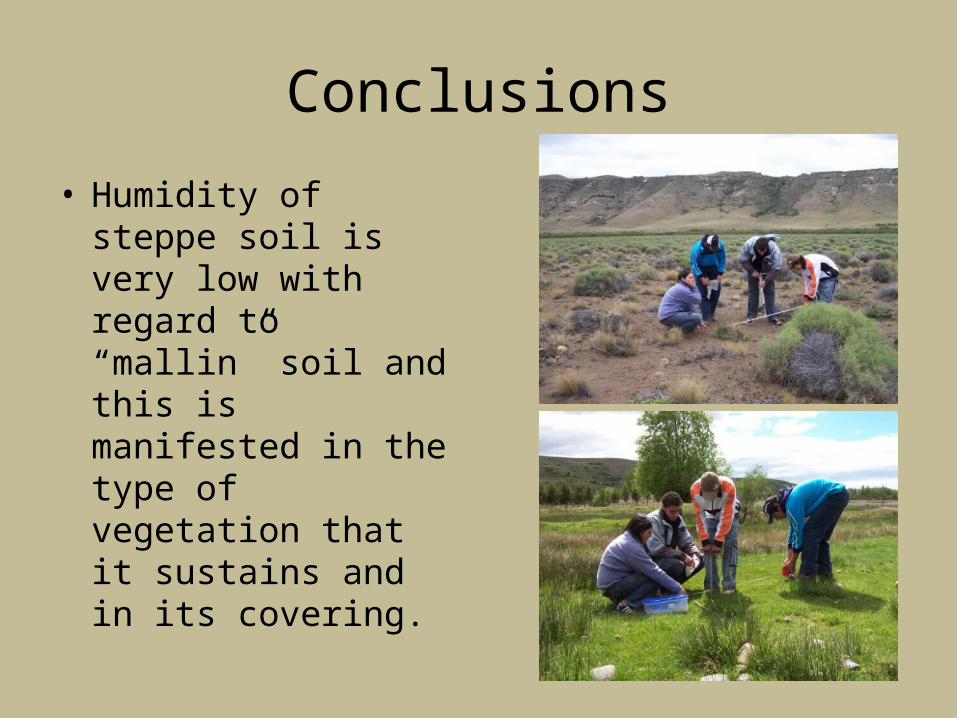
• Humidity of steppe soil is very low with regard to “mallin” soil and this is manifested in the type of vegetation that it sustains and in its covering.

Conclusions• Humidity of steppe soil:
– Increases with rains – Diminishes with the increment of dry days and
high temperatures that cause more water evaporation.
– The flow did not seem to have incidence in humidity changes in the steppe soil.

Conclusions• In “mallín” soil the opposite takes place:
– humidity did not seem to be affected by rains– dry days– temperature changes.
• The curve of humidity of “mallín” soil has the same form as that of the river flow, that is to say, it increases in spring when thaw takes place and it diminishes in summer and it increases at the beginning of autumn again. (Ávila, et.al.,2005).
• This change is possibly related to an ascent of aquifers, although a larger number of measurements are required to corroborate this hypothesis.

Conclusions
• If the predicted climatic changes take place:– water content in the soil will decrease and
soil erosion will accelerate. (Barros, et.al.,2006).
– In the case of the steppe its percentage will be low.
– In “mallin” soil the ascent of aquifers in spring will have a greater influence in the content of water of this soil.

Discussion• In spite of this the obtained results are
important:– For the school, where they are used for
agricultural production– For the people that live in the rural area and can
take advantage of “mallines” and their borders for agricultural production
– For the agencies which control water for human consumption and to municipal scale.

Discussion• High “mallines” as well as riverside “mallines”work
as filters that help to maintain the water quality in the rivers.
• Therefore their conservation is vital for a sustainable populational growth, taking into account the new urbanizations:– The Chimehuin river (source of water supply to Junín de
los Andes) – The Quilquihue river (main source of water supply to San
Martin de los Andes).

Discussion• If due to the effect of climatic change the steppe soil
contains less amount of water it is possible that this affects the cultivation of some plants and the growth of wild plants increasing even more the current erosion. (Coronato, et.al.,1997; Barros, et.al., 2006; Paruelo, et.al.,1988, 1995 y 1998).
• Together with climatic change, tendencies are observed in meteorological data and it is recommended to diffuse at school and among the population of Junín de los Andes the mitigation measures proposed by IPCC related with water and energy consumption.

Effects of the climatic change in the frequency and duration of the fires in the North of the Patagonia.
Authors:
Students : Castillo, E.; Huichaqueo, E. C.; Izaza, J. P.; Lefín, G. L.; Painemilla, L. M. and Reinao, S. D.
Teachers: Prieto, A. B.; Bertossi, M. E., Krumpholz E. and Davies, C.
With the support of Capsa-Capex
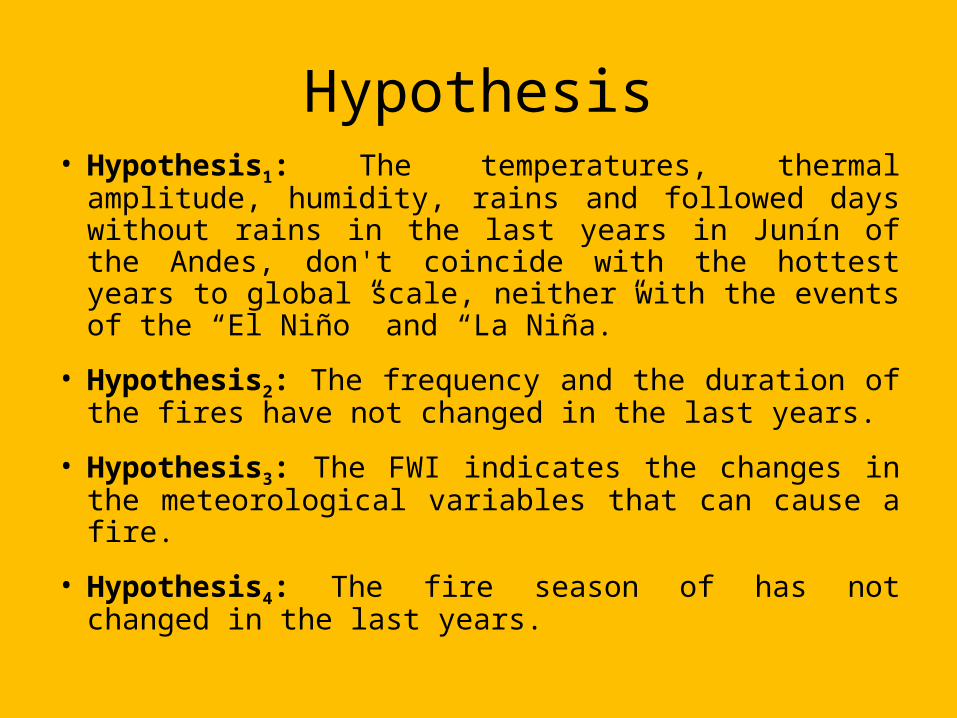
Hypothesis• Hypothesis1: The temperatures, thermal amplitude,
humidity, rains and followed days without rains in the last years in Junín of the Andes, don't coincide with the hottest years to global scale, neither with the events of the “El Niño” and “La Niña.”
• Hypothesis2: The frequency and the duration of the fires have not changed in the last years.
• Hypothesis3: The FWI indicates the changes in the meteorological variables that can cause a fire.
• Hypothesis4: The fire season of has not changed in the last years.

Frecuencia de incendios en la Provincia de Neuquén Median Min-Max
Total: KW-H(15,224) = 51,7229443, p = 0,000006
19
92
19
93
19
94
19
95
19
96
19
97
19
98
19
99
20
00
20
01
20
02
20
03
20
04
20
05
20
06
20
07
Años
-20
0
20
40
60
80
100
120
Nº
de
In
cen
dio
s
Years warmest globally (Hansen, 2008, 2007)
Frequency of fires in the Neuquen Province

Causas de Incendios
Neg
ligen
cia
Clim
átic
as
Inte
ncio
nal
Des
cono
cida
s
Acc
iden
te
0
300
600
900
1200
1500
Nº
de I
ncen
dios
Causes of fires

Frequency of causes of firesFrecuencia de causas de incendios
Col
illa
Ray
oQ
uem
aF
urtiv
osF
ogón
Des
cono
cido
Jueg
o de
niñ
osV
ela
de s
antu
ario
Chi
spa
de m
áqui
naA
ccid
ente
de
trán
sito
Per
sona
per
dida
Piro
técn
iaIn
cend
io e
stru
ctur
alLi
mpi
eza
cald
era
Líne
a M
TD
emen
cia
Des
carg
a el
éctr
ica
Man
iobr
as m
ilita
res
Man
iobr
a m
ilita
rE
scap
eLí
nea
MT
Que
ma
past
uras
Que
ma
resi
duos
veg
etal
esF
ogón
aba
ndon
ado
Que
ma
basu
ral
Vel
a sa
ntua
rioC
hisp
a m
aqui
naC
eniz
a es
tufa
Acc
iden
te d
e tr
ansi
toQ
uem
a ho
rmig
uero
0100200300400500600700800900
Nº
de In
cend
ios
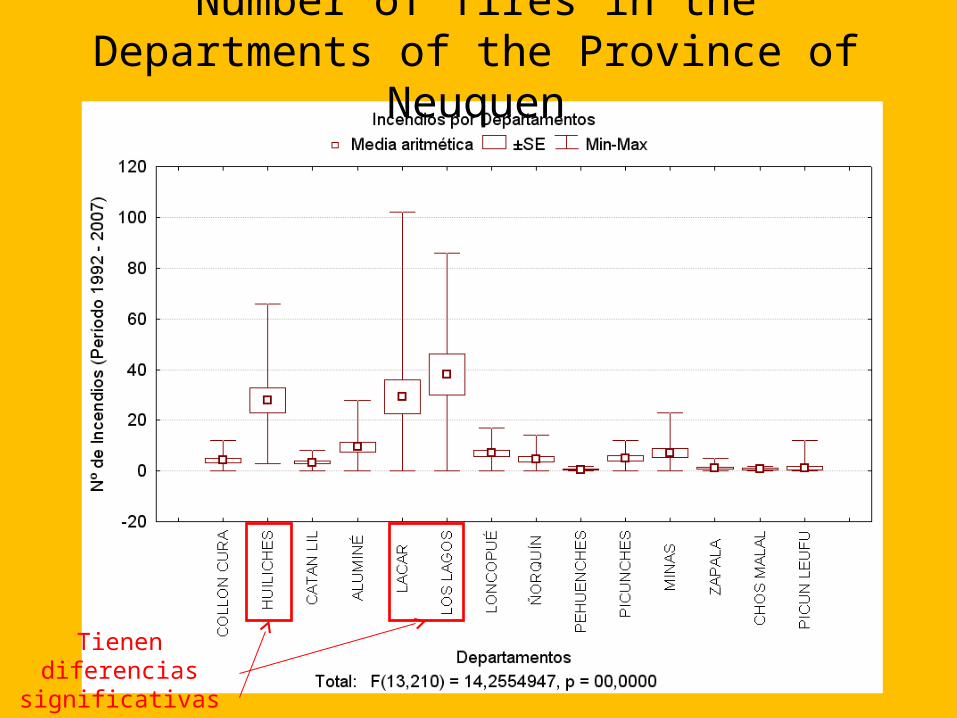
Tienen diferencias significativas con los
demás departamentos
Number of fires in the Departments of the Province of Neuquen

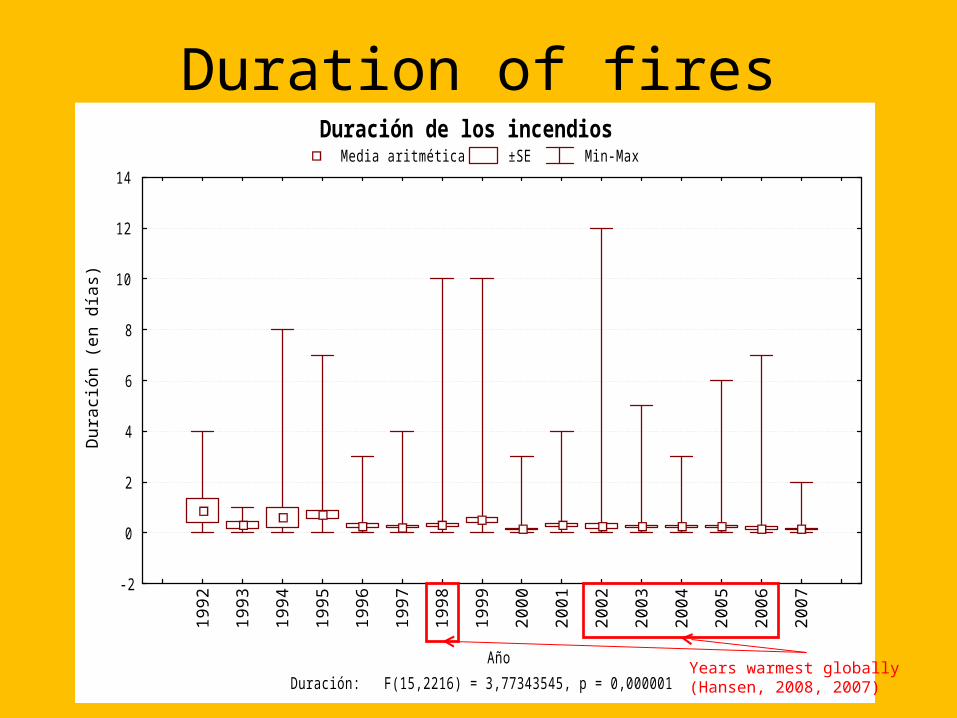
Duración de los incendios Media aritmética ±SE Min-Max
Duración: F(15,2216) = 3,77343545, p = 0,000001
19
92
19
93
19
94
19
95
19
96
19
97
19
98
19
99
20
00
20
01
20
02
20
03
20
04
20
05
20
06
20
07
Año
-2
0
2
4
6
8
10
12
14
Du
raci
ón
(e
n d
ías)
Years warmest globally (Hansen, 2008, 2007)
Duration of fires
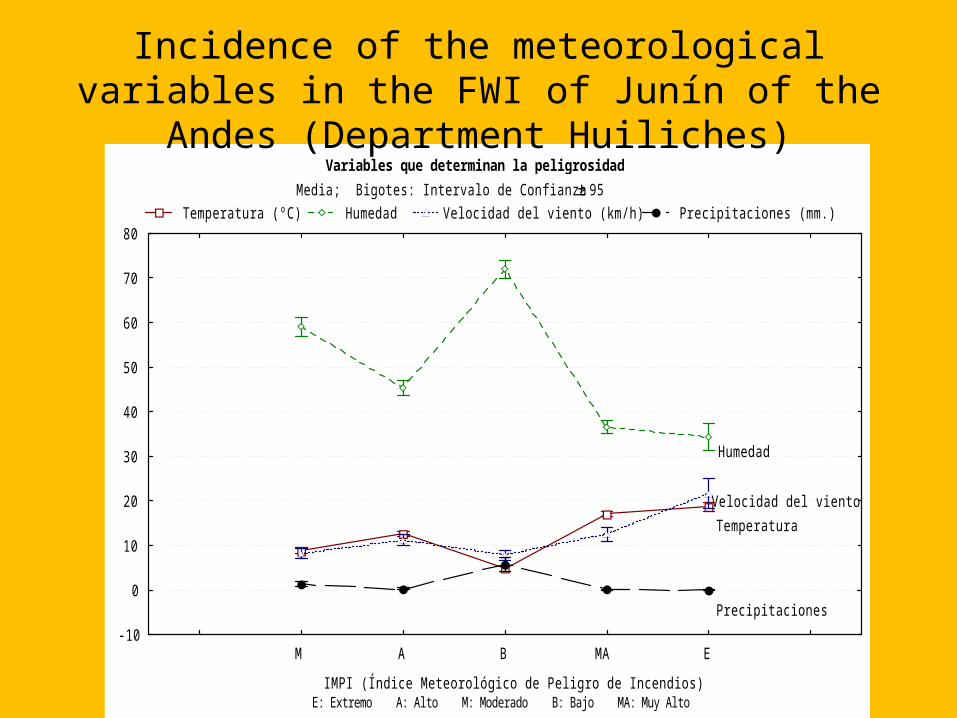
Variables que determinan la peligrosidad
Media; Bigotes: Intervalo de Confianza ± 95
Temperatura (ºC) Humedad Velocidad del viento (km/h) Precipitaciones (mm.)
M A B MA E
IMPI (Índice Meteorológico de Peligro de Incendios)E: Extremo A: Alto M: Moderado B: Bajo MA: Muy Alto
-10
0
10
20
30
40
50
60
70
80
Precipitaciones
Temperatura
Velocidad del viento
Humedad
Incidence of the meteorological variables in the FWI of Junín of the Andes (Department Huiliches)

Relación entre el IMPI y los IncendiosMedia; Bigotes: Desviación estándard ± 95
Pastizal Matorral B. Nativo B. Imp. Otros
E A M B MA
IMPI (Índice Meteorológico de Peligro de Incendios)E: Extremo A: Alto M: Moderado B: Bajo MA: Muy Alto
-100
0
100
200
300
400
500
Su
pe
rfic
ie q
ue
ma
da
(h
ect
áre
as)
Type of vegetation and surface burned by the fires in the region. (Period 1992-2007)

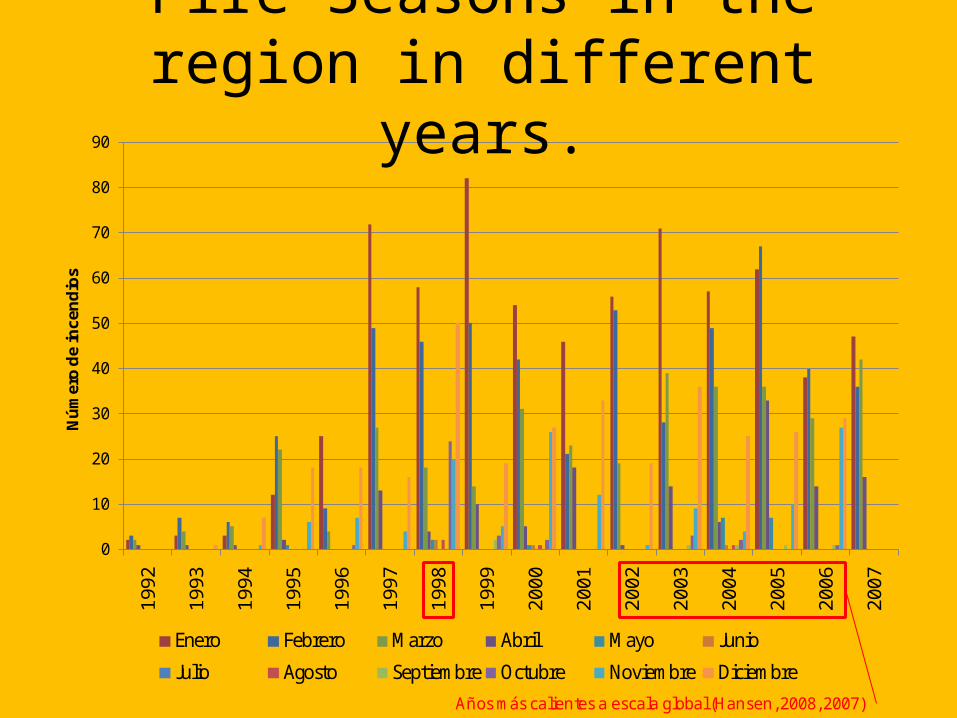
Temporada de incendios
0
10
20
30
40
50
60
70
80
9019
92
1993
1994
1995
1996
1997
1998
1999
2000
2001
2002
2003
2004
2005
2006
2007
Nú
mer
o d
e in
cen
dio
s
Cambios en las temporadas de incendios
Enero Febrero Marzo Abril Mayo Junio
Julio Agosto Septiembre Octubre Noviembre DiciembreAños más calientes a escala global (Hansen, 2008, 2007)
Fire Seasons in the region in different years.
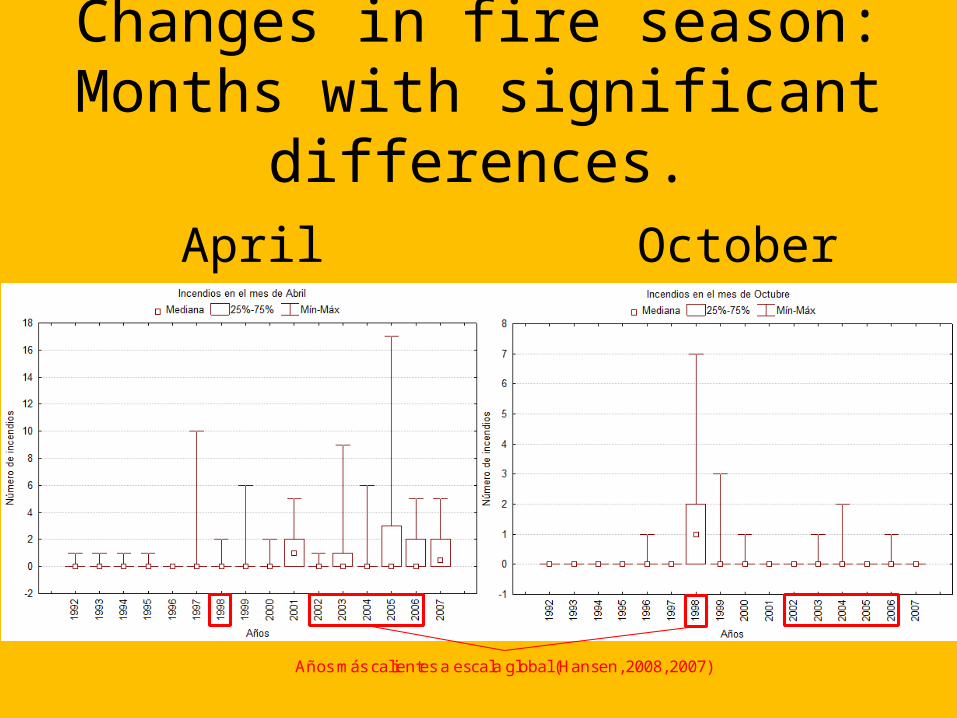
Changes in fire season: Months with significant differences.
Años más calientes a escala global (Hansen, 2008, 2007)
April October
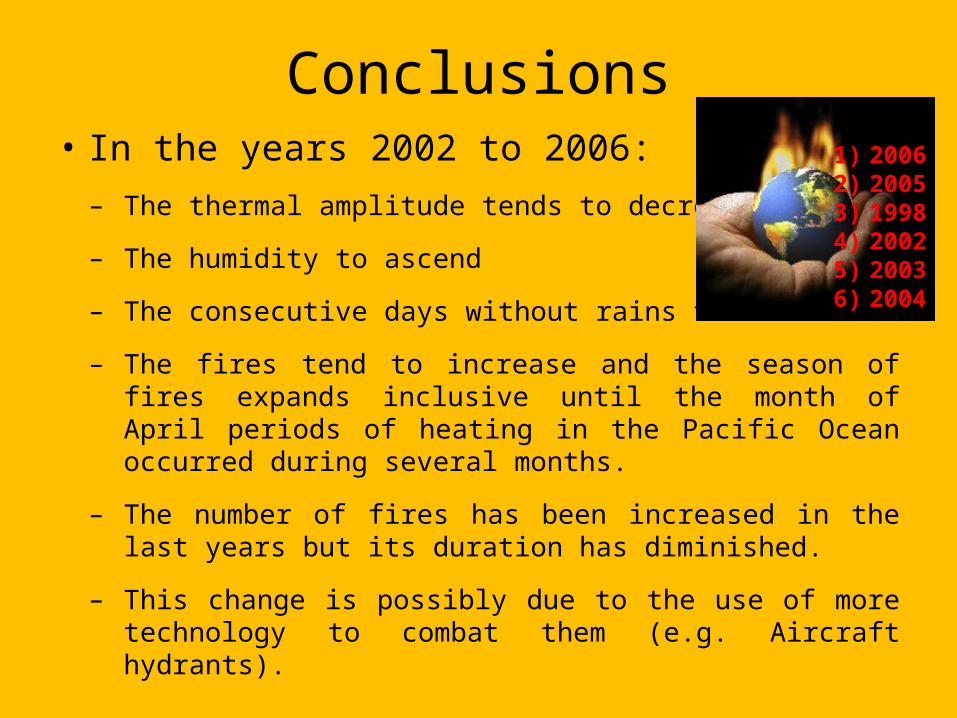
Conclusions• In the years 2002 to 2006:
– The thermal amplitude tends to decrease
– The humidity to ascend
– The consecutive days without rains to decrease
– The fires tend to increase and the season of fires expands inclusive until the month of April periods of heating in the Pacific Ocean occurred during several months.
– The number of fires has been increased in the last years but its duration has diminished.
– This change is possibly due to the use of more technology to combat them (e.g. Aircraft hydrants).
1) 20062) 20053) 19984) 20025) 20036) 2004
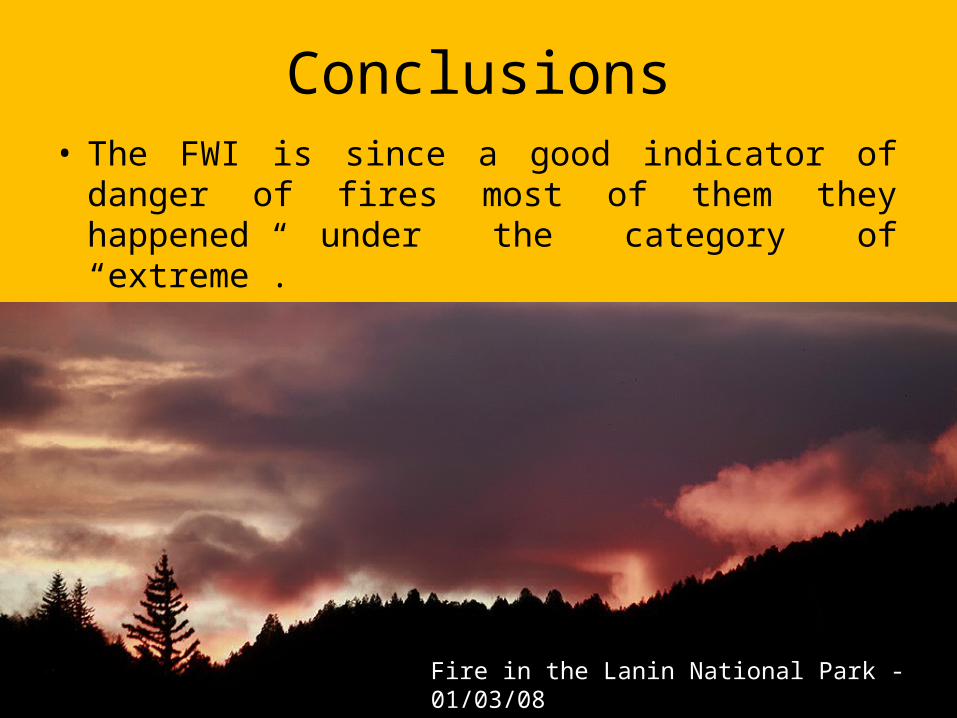
Conclusions• The FWI is since a good indicator of danger of fires
most of them they happened under the category of “extreme”.
Fire in the Lanin National Park - 01/03/08

Discussion• The fires represent one of the important causes of
degradation of the soils and of biodiversity loss; thus they endanger the sustainable use of the ecosystems and they enhance erosion. (Altieri, 1999; Barros, et.al.,2006; Carretero, 1995; Kitzberger, et.al.2005; IPCC, 2007; Paruelo, 1998; Veblen, et.al.,1992, 1999 y 2002).
• The factors that influence are:– The dry season (summer)– The type of vegetation– The occurrence of electric storms– Human action. Most of the fires happen in proximities of
cities or areas visited by tourists. . (Barros, et.al.,2002, 2006; Kitzberger, et.al.,1997, 2005; IPCC, 2007; Rössler, et.al.,2004; Veblen, et.al.,1999; Villalba, et.al.,2003 y 2006).

Discussion• The climatic models show a scenario of
important reduction of the precipitations in almost the whole mountain range to the North of the parallel one 46ºS.
• Most of the water that we consume in the area comes from this mountain range and an increment of the danger of fires is expected activating even more the erosion processes. (AIC, 1996 a 2007; Camilloni, 2005; CIMA-CONICET, 2005; Da Silva, et.al.,2007; Labraga, 1998; Minetti, 2003; IPCC, 2007; Scarpatti, et.al.,2001; Snaider, 2001).
Discussion• The native forests and the implanted forests will
reduce their growth (especially because of the reduction of precipitations) and they will be more exposed to fires. (Barros, et.al.2006; Rodríguez, 2003; Urrutia, 2005; Veblen, et.al.,1988, 1992 y 1999; Villalba, 1998, 2002 y 2003; Villalba, et.al.,2003 y 2006)
• The obtained results are important for the school but also for the government and non governmental organizations that work in the area.
• They are especially important for increasing the conscience of the danger by the population in general, because although the conditions are given, the anthropic action is the largest originator of fires.
Discussion• Regarding the fires that cause the danger and the
frequency of fires due to anthropic action the following is recommended: 1. Create alleys of easy access for the fire brigades in the
implanted forests.2. Carry out seasonal gathering of the remaining organic matter
between the pines. 3. Avoid burning the residue, promoting treating and recycling
them. 4. Promote fire control at educational level. 5. Publish procedures of fire prevention for residents (with
emphasis in not burning organic residuals) and visitors (with emphasis in the treatment of cigarette butts, the campfires, etc).

We want to thank: For supply data…
Subsecretaría de Recursos Hídricos de la NaciónTéc. Simón Llewellin Lewis (Dirección de Coordinación de Manejo del Fuego)
By sending information… Drs. María Luz Duarte, Rosa Compagnucci , Inés Camilloni,
Jorge Rabasa, Darío Trombato, Juan Minetti, Ricardo Villalba, Thomas Kitzberger and Thomas Veblen
By taking GLOBE measurementsAll students of the CEI “San Ignacio”
By giving us information on agriculture:
Ing. Agr. Guillermo Barrau, Christian Hick
For provide some equipment to conduct environmental measurements:The company Capsa-Capex
![Digging the topology of rock art in Northwestern Patagonia · anthropology [1–3] and archaeology [4–8]. Within this context, the application of analytical methods derived from](https://img.pdfslide.us/doc/110x75/5fc01dfadb61740beb4fdf16/digging-the-topology-of-rock-art-in-northwestern-patagonia-anthropology-1a3.jpg)