Embed Size (px)
DESCRIPTION
The human value of the enterprise by Andrew Mayo
Citation preview
Praise forThe Human Valueof the Enterprise
“The Human Value of the Enterprise masterfully synthesizes theory,research, and practices on measuring human capital. It shows how to
measure, track, and invest in human capital in ways that ensurebusiness value. It turns abstract beliefs in the value of people into
concrete measures which will enable business leaders to make informedhuman capital choices and insure that HR professionals act with data
not just intuition.The ‘Human Capital Monitor’ architecture encompasses research to date
and offers a pragmatic way to assess people performance in a firm. Ilearned a lot from reading the book and will refer to it frequently as a
disciplined roadmap for deriving human capital value.”Professor Dave Ulrich, co-author of The HR Scorecard
“A most impressive overview of human value metrics, with verypractical references and models, such as the ‘Human Capital Monitor’and the ‘Human Asset Register’, which focus on clarifying people as
sustainable value creators, not costs.”Leif Edvinsson, former Director of Intellectual Capital at SkandiaAssurance in Sweden and Professor of Intellectual Capital at the
University of Lund
“Few people are better qualified to write on this topical and importantsubject than Andrew Mayo. His contribution to our understanding of the
relationship between human capital and sustainable business successwill be invaluable to all those who are looking for rigorous argumentand evidence to back their efforts to get Human Resource issues to the
top of the Board agenda.”Philip Sadler CBE, former CEO and vice president Ashridge
Management College
“People are usually considered an organization’s most valuable asset, yetfew knowledge management programmes address people issues seriously.
Andrew Mayo skilfully combines two difficult aspects of knowledgemanagement—people and measurement. He reviews previous work inboth domains and comes up with his own ‘Human Capital Monitor’, ahighly practical tool that should be part of every knowledge manager’stoolkit. Not only is this book thoughtful and challenging, it also gives
practitioners the tools they need to address this tricky problem.”David Skyrme, author of Capitalizing on Knowledge
“There is growing evidence that at the heart of successful companies is thebuilding and leveraging of human capital. Yet the way in which we view
corporate success remains resolutely bound with notions of financial capital.The debate about the measurement and reporting of human capital is one ofthe most important challenges facing managers. With this thoughtful book
Andrew Mayo brings both insight and analysis to aid this debate.”Lynda Gratton, Professor of Organizational Behaviour,
London Business School
“Never has it been more necessary to understand the CEO’s perennial battlecry, ‘people are our greatest assets.’ Andrew Mayo explains it to us in a freshand exciting way—drawing on the literature of general management, human
resources, and accounting. A book to challenge all your assumptions.”Professor Tony Hope, co-author of Transforming the Bottom Line
The Human Valueof the Enterprise
Valuing PEOPLE as Assets
Monitoring, Measuring, Managing
Andrew Mayo
N I C H O L A S B R E A L E Y
P U B L I S H I N G
L O N D O N
First published by
Nicholas Brealey Publishing in 2001
36 John Street 1163 E. Ogden Avenue, Suite 705-229
London Naperville
WC1N 2AT, UK IL 60563-8535, USA
Tel: +44 (0)20 7430 0224 Tel: (888) BREALEY
Fax: +44 (0)20 7404 8311 Fax: (630) 898 3595
http://www.nbrealey-books.com
© Andrew Mayo 2001
The right of Andrew Mayo to be identified as the author of this work has been asserted in
accordance with the Copyright, Designs and Patents Act 1988.
Library of Congress Cataloging-in-Publication Data
Mayo, Andrew
The human value of the enterprise : valuing people as assets : monitoring, measuring,
managing / Andrew Mayo.
p. cm.
Includes bibliographical references and index.
ISBN 1-85788-281-4
1. Intellectual capital. 2. Human capital. 3. Management. I. Title
HD53 .M377 2001
658.3--dc21
2001037663
ISBN 1-85788-281-4
British Library Cataloguing in Publication Data
A catalogue record for this book is available from the British Library.
All rights reserved. No part of this publication may be reproduced, stored in a retrieval
system, or transmitted, in any form or by any means, electronic, mechanical, photocopying,
recording and/or otherwise without the prior written permission of the publishers. This book
may not be lent, resold, hired out or otherwise disposed of by way of trade in any form,
binding or cover other than that in which it is published, without the prior consent of the
publishers.
Printed in Finland by WS Bookwell.
Contents
Acknowledgments ixPreface xi
1 A Great Gap to be Filled 1“Our people are our most important asset” 2Shareholders vs. stakeholders 3The challenges to be grasped 4The slippery slopes of measurement 9The Human Capital Monitor 11Choosing the number and level of measures 14The structure of this book 17
2 People Drive Value 18People as assets 18The meaning of value 19Adding value to employees 20The poverty of accountancy in the modern world 21Value for shareholders 26The powerhouse of value: Intangible assets 28The components of intellectual capital 31People: The maintainers and creators of value 32Combining the human capital of individuals 33Summary 37Challenges for action 38
3 Measuring Human Capital 40Why this is not an easy area 40A checklist for good measures 44Evaluating measures 44Existing approaches to people measurement 47
Indices of good human resource practices 47Statistics, efficiency, and return on investment 53Integrating people-related measures in a performance
management framework 58Choosing measures for the Human Capital Monitor 64Presenting the data 67Summary 69Challenges for action 70
4 The Worth of People as Assets 71Calculating the asset worth of people 72Human Asset Worth: A practical formula 78Collective Human Asset Worth 84Is all our human capital inside? 85Summary 86Challenges for action 86
5 Capability and Potential 88Capability as personal capital 88Personal behaviors 90Technical, professional, and business know-how 95Educational level and professional qualifications 98Experience 99Personal network—“know-who” 102Personal values and attitudes 104Processes for evaluating capability 105The Personal Capability Profile 108Capabilities and their value to the organization 110Potential 111The language of potential 112Making judgments about potential 115Summary 116Challenges for action 117
6 Maximizing Human Capital 118Categorizing human capital 118
vi The Human Value of the Enterprise
The Human Asset Register 121Acquiring new human assets 122Retaining human assets 126Growing human assets 133A balance sheet and profit and loss report for
human capital? 136Monitoring movements in human capital 138Describing roles in the organization 140Restructuring 140Managing continuity 142Human capital budgeting and planning 146Summary 147Challenges for action 148
7 Motivation and Commitment 150Individual motivation and commitment 151Conditions to maximize motivation 157Culture and climate 158The effectiveness of leadership 160The practical environment 164The working group 165Learning and development 167Rewards and recognition 174How do we measure culture? 184Summary 187Challenges for action 188
8 Innovation and Learning 189Innovation 189A learning environment 195Organizational learning and knowledge management 198Corporate universities 206Human resources management for innovation and learning 207 A directorate of intellectual capital? 208Summary 213Challenges for action 214
Contents vii
9 The Value that People Create 215Creating wealth for distribution 215Productivity 220Value-added work—and its opposite 221Nonfinancial value added to stakeholders 225Innovation as an output 231The contribution of the individual 233Summary 236Challenges for action 237
10 Mergers, Acquisitions and Alliances 238Failure to add value 238The real meaning of synergy 240The six phases of mergers and acquisitions 245Summary 264Challenges for action 265
11 Telling the World 266The gap that needs to be filled 266Companies that go beyond the minimum 268Leaders in public information about human capital 270Future reporting for intellectual capital 277What should we do? 280Summary 280Challenges for action 281
Appendix: The development and measurement of intellectual capital 282
References 297Index 303
viii The Human Value of the Enterprise
Acknowledgments
IHAVE LONG HAD AN INTEREST IN THE RELATIONSHIP BETWEEN PEOPLE AND
business results. In 1994 I was asked to contribute to a chapter in abook published by the Institute of Personnel and Development inthe UK called Strategic Prospects for HRM. It was in researching this
chapter, “The economic factors of HRM,” that I came across the books ofJac Fitz-Enz and Eric Flamholz, tireless thought leaders in this field. Iowe a great deal to the comprehensiveness of their work.
More recently I have followed and found great empathy with thepioneers of the intellectual capital movement, through both reading andlistening to them: Karl Erik Sveiby, Leif Edvinsson, Thomas Stewart, theRoos brothers, and others. They have significantly influenced my view ofthe business model for the twenty-first century.
A number of friends have given great encouragement and ideas:Philip Sadler, CK Prahalad, Mick Cope, David Clutterbuck, Marc Baker,Tony Buley, and many others along the way. I am grateful to Geoff Atkinsonfor his reading of the manuscript and many valuable amendments; to PeterHoney, Michael Pearn (fellow participants in the Learning SymposiumGroup), and Janice Chalmers for suggestions on structuring the originaltext. I want to thank Jan Morgan, who helpfully challenged the logic of thearguments and offered many textual improvements.
I would like to thank my colleagues in the Centre for ManagementDevelopment at London Business School for their practical support anduse of facilities, and the continual learning derived from the executiveswho come on the programs there.
My publisher Nick Brealey and his colleague Sue Coll gave unstint-ing support and were at the same time my most helpful critic. I am greatlyindebted to my professional editors Bronwen Perry and Sally Lansdell forthe final presentation. Finally, many thanks to my patient assistant FionaMcDonnell for technical help and to my wife Elisabeth, who has sufferedonce again the privations that come from “this new book I have to write.”

This Page Intentionally Left Blank
Preface: The Vision
Fortune magazine has just published its 2009 comparison of the leading 500 com-
panies in value generation. No longer do we see columns for Return on Capital
Employed and profit per employee. This year’s comparison is fully focused on the
use of intellectual capital. The first figure is the ratio of intangible to tangible assets.
Companies with less than 60 per cent look very bad prospects for investors. Output
is measured as the added value that is generated. But the really interesting figures
that sort out the exciting companies from the mundane are the investments in R&D,
investments in people development, customer loyalty index, and the percentage
attrition of professional staff.
The Times Business Supplement, 22 April 2010
The highest paid employee was the chief scientist, who added to her basicsalary of $800,000 bonuses totalling $3 million based on the sales from newproducts introduced in the last two years and on the innovation-culture indexof the department for which she is responsible.
Extract from Annual Report, Drugs-R-Us, 2005
With effect from the trading year 2005, all companies registered inDenmark will be required to include in their annual reports informationabout customer, process and human capital. A minimum of five mea-sures for each is required, and comparison with the previous two yearsmust be shown. Figures for investment in intellectual capital must beshown and compared with the previous two years. A narrative shouldaccompany each set of figures. Information for investors about intellec-tual capital both current and future should occupy at least one third ofthe report. Where relevant, information must also be provided regardingcare for the environment.
Directive from the Danish Ministry of Business and Industry, April 2002
In the last five years, the HR profession has transformed itself. If we go back
ten years, it was a function that agonized about how it could be a real busi-
ness partner, and yet at the same time peddled soft answers to problems and
could not talk in the language of numbers that mattered. Training was fun-
oriented, and people were usually valued according to the job they were
currently doing. Performance evaluation depended more on demonstrating
cloned “competences” than on adding real value to stakeholders. What a
difference today!
Back in 2003 HR directors seized the opportunity to spearhead the
intellectual capital movement, developing credible measures for valuing
people and their contribution. They systematically convinced top manage-
ment teams that people had a measurable value and that people alone
drove value creation. Many human resource directors are now directors of
intellectual capital, looking after strategy, knowledge management, R&D,
people development, IT systems, and process engineering.
Thanks to their efforts, people are not only recognized as the most
important asset in an organization, but private and public sectors alike
regard their Human Asset Registers with the same importance as any finan-
cial performance summary. The long debates of the 1990s about budgeting
and variances have been replaced by intellectual capital planning and mon-
itoring. These have become a way of life.
In the companies that have led this new business model, shareholders
have never enjoyed such healthy returns, and other stakeholders have
never been better satisfied. Customer and employee loyalty ratios are in the
top quartile and new graduates fight to join them.
Thanks to the lead given in Denmark and Sweden, soon after
adopted by major global companies, investors can now see the valuable
information they need about their investment in intellectual capital and how
they use it. The position of power has shifted from the finance director to the
director of intellectual capital, and this is reflected in the remuneration pack-
ages of each.
Financial Times Review of the Decade, 22 December 2010
DEDICATIONThis book is dedicated to the achievement of the vision.
xii The Human Value of the Enterprise
1A Great Gap to be Filled
Though your balance-sheet’s a model of what a balance-sheet should be,Typed and ruled with great precision in a type that all can see;Though the grouping of the assets is commendable and clear,And the details which are given more than usually appear;Though investments have been valued at the sale price of the day,And the auditor’s certificate shows everything O.K.;One asset is omitted—and its worth I want to know,The asset is the value of the men who run the show.
Archibald Bowman, 1938
IN 1960 DOUGLAS MCGREGOR PUBLISHED HIS BOOK THE HUMAN SIDE OF
Enterprise. He suggested that there were two basic approaches tomanagement. “Theory X” assumed that people are instruments oflabor—human resources—and that management is about efficient
task fulfillment, with a carrot-and-stick approach to performance. Or, hesuggested, you could take the view that what people are actually lookingfor is challenge and interest, and that the task of management is to max-imize commitment and liberate their ideas and abilities. This he called“Theory Y.” Most organizations today would say that their thinkingembraces more of Y than of X. However, some 40 years later, in anumbers-driven business culture, while we are good at measuring peopleas costs and resources, we still have no accepted way to value people asassets.
So the gap that Archibald Bowman identified in his piece of dog-gerel remains. Developing new business models for today’s world is oneof the greatest challenges we face—and one that this book takes up.
“OUR PEOPLE ARE OUR MOST IMPORTANT ASSET”
Most chief executives would readily nod assent to the frequently heardstatement that staff are a company’s greatest asset. Yet, the people withinan organization do not always experience decisions and policies reflect-ing this in everyday life. They are much more likely to see the companybeing driven by efficiency and by minimizing costs. Asking audienceshow they perceive reality in the UK, I have found fewer than 20 percentwho feel that the decisions made by top management match the espousedbelief in the real value of people. The accountant who once describedpeople to me (admittedly with a smile) as “costs walking about on legs”is often closer to reality.
The problem is that people do not fit the strict financial definitionof an “asset.” They cannot be transacted at will; their contribution is indi-vidual and variable (and subject to motivation and environment), andthey cannot be valued according to traditional financial principles. Andyet, organizations today are as much concerned about the “war for talent”as any other business issue. Why is this so? It is very simple. The valua-tion of companies has changed progressively since about 1990, putting amuch higher value on “intangible assets” such as knowledge, compe-tence, brands, and systems. These assets are also known as the “intellec-tual capital” of the organization. And it is people, and people alone—the“human capital”—who build the value.
Jack Welch, one of the best-known American CEOs, is famous forsaying that “there are three key measures in business—customer satisfac-tion, employee satisfaction, and cashflow, in that order.” More recently, hesaid that he had the first two round the wrong way—employees shouldcome first. What he recognized was that, at the end of the day, everythingdepended on people: their capability, motivation, creativity, organiza-tional skills, and leadership. People manage the tangible assets, and theyalso maintain and grow the intangible ones.
We cannot track intangible assets in the same way as financial andphysical assets. We have to learn new ways, but these must have the samelevel of credibility as well-established systems of accounting. We must dothis; in an era where knowledge and talent are at a premium, there is nodoubt at all about which are our most important assets. Organizations
2 The Human Value of the Enterprise
that continue to think of their people as mere resources and costs havenot crossed the millennium divide.
There is a growing volume of research aimed at recognizing and prov-ing the relationship between “good people management practices” and “thebottom line.” Today, that bottom line is seen as consisting of both prof-itability and long-term shareholder value. The major consultancies aredevising their own systems for assessing the “metrics” of people manage-ment. William Mercer, for example, has developed a “human capital wheel,”Watson Wyatt has a “human capital index,” and PricewaterhouseCoopershas a department called “HR Analytics,” which in 2000 won a prize withinthe consultancy for innovation. Researchers such as Mark Huselid andJeffrey Pfeffer in the US, and David Guest, John Purcell, and Lynda Grattonin the UK, have done long-term studies todemonstrate the benefits of a positive approachto human resource management.
It is not surprising that there are positivecorrelations between people and performance.Companies such as Johnson & Johnson andCadbury knew many years ago that the betterpeople are treated, the more successful theorganization is likely to be. However, it is notenough to simply preach the latest researchresults. These days managers are bombardedwith ideas on how to do everything better.What really governs their lives are numbers—so the challenge is to findsome quantifiable methods that enable us to understand people’s worthand their contribution to “value” in the organization.
SHAREHOLDERS VS. STAKEHOLDERS
Organizations exist to create value for people, either individually or col-lectively. Charities convert money, expertise, and caring attitudes intobenefits for people in many different ways. Public-sector organizationsbring value in services and information to different sections of the com-munity. Commercial businesses create monetary value for their owners,
A Great Gap to Be Filled 3
THE CRITICAL CONTRIBUTION OF
PEOPLE—ESPECIALLY HIGH-VALUE,
TALENTED PEOPLE—TO ORGANIZA-
TIONAL SUCCESS HAS PROBABLY
NEVER HAD A HIGHER PROFILE. IT IS
ESSENTIAL FOR ORGANIZATIONS TO
HAVE SOUND MEASURES FOR MAN-
AGING PEOPLE AS ASSETS, RATHER
THAN MERELY AS COSTS.
and in so doing bring value to many other individuals and organizations.Are shareholders, owners, and investors more important than others withan interest in the success of the organization—the people and groups ofpeople that we call stakeholders? Most CEOs of commercial companieswill say that their ultimate goal is to build value for the shareholders.Major decisions, especially about ownership, are taken with this in mind.But, if in so doing they destroy value for other stakeholders, the evidenceis that they do not achieve their goal in the long term. If customers nolonger want to deal with that company, employees no longer want towork for it, suppliers find it too difficult to trade with, and the commu-nity loses confidence in it, then these stakeholders—who are essential toits continuing success—will be lost. Without the support of other stake-holders, no shareholder can achieve sustained returns.
As the song from the film Cabaret has it, “Money makes the worldgo round.” But only a myopic mercenary believes that the human condi-tion is all about money, even though it can make life easier. Society needsbusinesses to provide employment and build financial stability for indi-viduals, to create, make and distribute products and services, and to takea responsible role in supporting communities. Businesses create wealththat can be shared—this is the ultimate “added value.”
Therefore in order to create value, we need to know how value isadded to all stakeholders, both financial and nonfinancial, both now andin the future. We need a clear idea about what matters to them and howto meet their needs, so that they will want to go on working with us.
THE CHALLENGES TO BE GRASPED
Every day we can see the outcomes of a lack of balance between thinkingof people as costs and viewing them as assets. Of course, in a sense theyare both simultaneously. But let us have a look at some of the challengeswe need to grasp, and at how our inability to do so has a serious impacton the effectiveness of our organizations.
4 The Human Value of the Enterprise
Challenge #1
When we make a decision to cut costs from an organization, we haveclear numbers to work with. Everyone understands the systems and mea-sures for costs. However, when we talk about their corresponding value(if indeed we do), we may only have words—and numbers always speaklouder than words. We lack a commonly accepted framework for assess-ing the value and contribution of people. It is only when people leave thatwe miss the value they contributed, often so much so that we hire themagain as consultants (who go on a different cost line than salaries andheadcount).
Making business decisions purely on cost grounds is yesterday’sbusiness model. There are now hundreds of books offering advice on howto create economic value, how to build empowered and innovative orga-nizations, develop visionary leaders, secure evangelistic customers, andwin the war for talent. These imperatives are a million miles away fromthe kind of management accounting that has had a stranglehold on orga-nizations for the last 50 years or more. They require a new language, oneabout building futures, not documenting the past.
The challenge: Balance cost numbers with value numbers, sothat both have equal status in decision making.
Challenge #2
Every person brings a different combination of capabilities and con-tributes to the organization in a unique way. When one joins or anotherleaves, there is an impact on human capital “stock” that is more than amere adjustment in headcount. Each individual employee lends the orga-nization their “personal human capital” in exchange for value in variousforms: salaries, challenge, development, and so on.
The challenge: How do we recognize the intrinsic diversity in theworth of people and find a way to value it through understanding theirpersonal human capital?
A Great Gap to Be Filled 5
Challenge #3
The phrase “adding value” is often used loosely to mean “making aworthwhile contribution.” However, adding real value to stakeholders isa serious business—it is the only reason that organizations exist. Thephrase is incomplete if we do not specify at least “to whom,” and prefer-ably “by doing x.” This should be the basis of performance management.Such measures might be either financial or nonfinancial, but it is onlysome form of quantification that enables us to know whether our capac-ity to add value is increasing or decreasing. Every asset (including indi-vidual people) should be linked to the value that is created for one ormore stakeholders.
The challenge: We need to measure the value—financial and non-financial—that is added to each stakeholder by each individual in ourorganization.
Challenge #4
It would be unfair to accuse all organizations of paying much more atten-tion to the short term than the long term, but the reality is that it is easyfor short-term pressures to dominate resourcing decisions. People whoserole is to focus on the future may be given a lower priority when it comesto restructuring resources. “Shareholder value” is still linked in manyminds with current profitability. It is true that it provides dividends forshareholders and owners, but the value of a share reflects the collectivejudgement of investors about the future of a company. What they arelooking for is the prospect of the revenue streams to come, and historicalprofits may or may not be a guide to that.
Stories regularly appear in the financial press about CEOs whohave tried to set a long-term strategy and yet been brought to heelbecause quarterly profits have suffered. One headline in 2000 concernedProcter and Gamble, well known for its visionary thinking and excellencein management. CEO Durk Jager, a veteran of P&G, set out his vision forthe group in “Organization 2005,” but then earnings fell and the shareprice along with them. Former chairman John Pepper was brought out ofretirement and a new CEO was appointed. “I want to express my grati-
6 The Human Value of the Enterprise
tude to Durk Jager for his visionary leadership and many contributionsto P&G over 30 years,” Pepper said. “We have an accelerated pace ofproduct innovation that never would have been possible without hisleadership. This is his legacy. His emphasis on innovation and a culturethat reaches out for breakthrough provides a strong foundation for futureprogress.”
“It was a personal decision to step aside,” said Jager with due cor-porate loyalty. “I am proud of the vision we set out to achieve withOrganization 2005, and we’ve made important progress. It’s unfortunateour progress in stepping up topline sales growth resulted in earnings dis-appointments. I’m confident that with the leadership of AG Lafley andJohn Pepper and the strength of P&G people, the company will achieveits full potential.” He was expressing the difficulty of building for thefuture and at the same time guaranteeing present financial performance,so readily seized on by financial analysts. One year later under the newleadership, profits were still struggling.
The challenge: We must be able to value future returns fromintangible and people-related investments with as much credibility asthe well-tried methodologies for physical asset investment.
Challenge #5
Organizations set goals, both short and long term, to measure progress.Each of these goals has drivers, “input” factors that determine the desiredoutcome, and they in turn have their own influencing factors. A soundperformance management system should monitor all the drivers andinfluences that affect the goal, just as much as the desired outcome itself.As you follow down the logic of the performance chain, it is not longbefore you come to people-related issues as a critical dependency. Themeasures for these are as important as any others in driving success.
A credible set of measures and indicators enables practical, and bet-ter, decisions to be taken about important business issues such as:
❏ acquiring new people❏ rebalancing the workforce❏ maximizing performance and productivity
A Great Gap to Be Filled 7
❏ developing individuals and groups❏ resource allocation and options for outsourcing❏ investing in people and organizational development ❏ benchmarking❏ setting up partnerships and alliances❏ managing mergers.
The challenge: It is as important to measure the drivers of performanceas it is to measure the outcomes themselves.
Challenge #6
The pace of restructuring in organizations always seems to be on theincrease, through acquisitions, mergers and disposals, or simply reorga-nization. However, the rate of failure in restructuring is well documented:for example, research by KPMG in 1999 showed that 53 percent of themergers studied failed to bring added shareholder value. Although a com-mercial firm may pay a significant premium for the intangible assets ofanother company, much of this value is often lost through the pursuit ofcost-driven “synergies.” Lawyers and accountants focus on liabilities andnumbers; meanwhile, the really valuable assets like expertise, experience,customer relationships, and knowledge may be lost in the process.
The challenge: How do we ensure that value is increased, and notlost, when organizations merge and restructure?
Challenge #7
Investors find it very difficult to find out the information they need tojudge the capability of an organization to deliver value in the future. Ina move toward facilitating this, it is almost certain that statutory bodieswill soon require more detail to be declared on intangible assets. To pre-pare for such a move, organizations need to get their internal systemsright. A system for regularly reporting what is happening with selectedand strategic intangible assets needs to be set up and to have the sameimportance and credibility as that for the familiar financial inputs andoutcomes.
8 The Human Value of the Enterprise
The challenge: We need to know how to obtain relevant and reli-able data on intangible assets within the organization before we arerequired to publish it externally.
THE SLIPPERY SLOPES OF MEASUREMENT
This book starts from the principle that everything can be quantified in away that enables us to manage it, and cause changes in it. Whether we aretalking about the capability or potential of peo-ple, the culture in which they work, or theirmotivation—just to give just some examples—measures for these can be found and tracked.Managers are conditioned to working withnumbers and nothing has a greater impact.Nevertheless, numbers that relate to peopleneed to be treated with care and caution, ensur-ing that the processes used to obtain them aresound and that we are clear what we want from them. A comparison overtime, or against a particular benchmark or target, is often more useful thanthe absolute measure itself. It is the context that gives meaning to the fig-ures. For example, if an employee opinion survey indicates that 65 percentof people are satisfied, this has little significance in itself. Its real meaningonly becomes apparent if we compare it with the same measure in a previ-ous survey or with similar questions in other organizations.
Why are most organizations still so unsophisticated and haphazardin measurement of human assets? There are several reasons.
❏ It is not easy! Unlike buildings or machines, people do not fit con-sistent patterns. There are many dimensions to be considered, notjust dollars or pounds. Attempts to apply well-accepted financialprinciples to the valuation of people have failed because of thenumber of assumptions that have to be made. People are not staticeither, they move around organizations and between them.
❏ Because of the complexity, we need several kinds of measure andprocesses of measurement. Each measure has to establish its own
A Great Gap to Be Filled 9
“IF YOU CAN VISUALIZE IT YOU CAN
MEASURE IT, AND IF YOU CAN
MEASURE IT YOU CAN MANAGE IT.”
GORDON PETRASH, FORMER
DIRECTOR OF INTELLECTUAL CAPITAL
AT DOW CHEMICALS
credibility as a logical driver of, and link to, the ultimate financialnumbers.
❏ There are dangers in forming conclusions about measures withoutfully understanding the range of factors that can determine a par-ticular outcome. We need to understand its causality. For example,we might measure attrition rates in the knowledge that our payrates are below the market, and assume that this is a significant fac-tor. In reality, the dominant cause might be less to do with pay andmore to do with the quality of management.
❏ Human resource professionals have often been cautious aboutchampioning the need for measurement. Many feel that it is theirrole to balance the prevalence of numbers with “humanity,” andnot to try to compete with accountants on their own ground. Thisis not to say many do not measure the efficiency of their ownprocesses, or create sets of helpful statistics, or attempt to establishreturn on investment for some programs and initiatives. However,systematically quantifying the worth of individuals and their con-tribution to stakeholders has generally been neither a priority noran aspiration.
Since the mid-1990s some progress has been made in this area. Supporthas steadily grown for the “balanced scorecard,” a system designed byRobert Kaplan and David Norton and first published in 1992. Thisapproach does look for measures of the drivers of financial outputs. Itbalances financial indicators with those for customers, process efficiency,and learning and innovation. Some users of the scorecard have replacedthe latter with a more general “people” element—and most find this areathe most difficult to find good indicators for. David Norton himself saysin his foreword to Becker, Huselid, and Ulrich’s HR Scorecard (2001):
But the worst grades are reserved for the typical executive team fortheir understanding of strategies for developing human capital. Thereis little consensus, little creativity and no real framework for thinkingabout the subject. Worse yet, we have seen little improvement in thisover the past eight years … human capital is the foundation of valuecreation. The asset that is the most important is the least understood,
10 The Human Value of the Enterprise
least prone to measurement, and hence the least susceptible tomanagement.
In parallel with the development and application of the balanced score-card, some pioneering Scandinavian companies have taken a differentstarting point. They have developed a range of indicators to cover each ofthe components of intellectual capital, including people. Examples ofthese will be found in Chapter 3.
THE HUMAN CAPITAL MONITOR
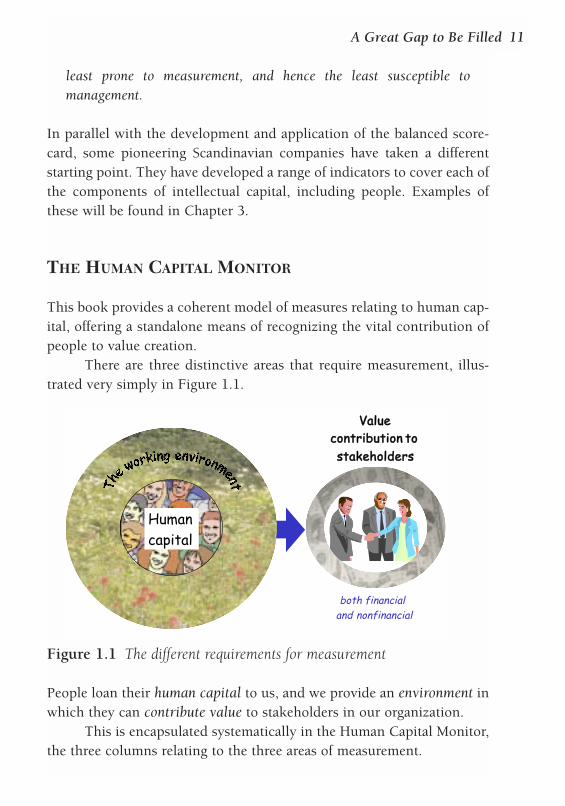
This book provides a coherent model of measures relating to human cap-ital, offering a standalone means of recognizing the vital contribution ofpeople to value creation.
There are three distinctive areas that require measurement, illus-trated very simply in Figure 1.1.
People loan their human capital to us, and we provide an environment inwhich they can contribute value to stakeholders in our organization.
This is encapsulated systematically in the Human Capital Monitor,the three columns relating to the three areas of measurement.
A Great Gap to Be Filled 11
both financialand nonfinancial
VVaalluueeccoonnttrriibbuuttiioonn ttoo ssttaakkeehhoollddeerrss
Humancapital
Figure 1.1 The different requirements for measurement
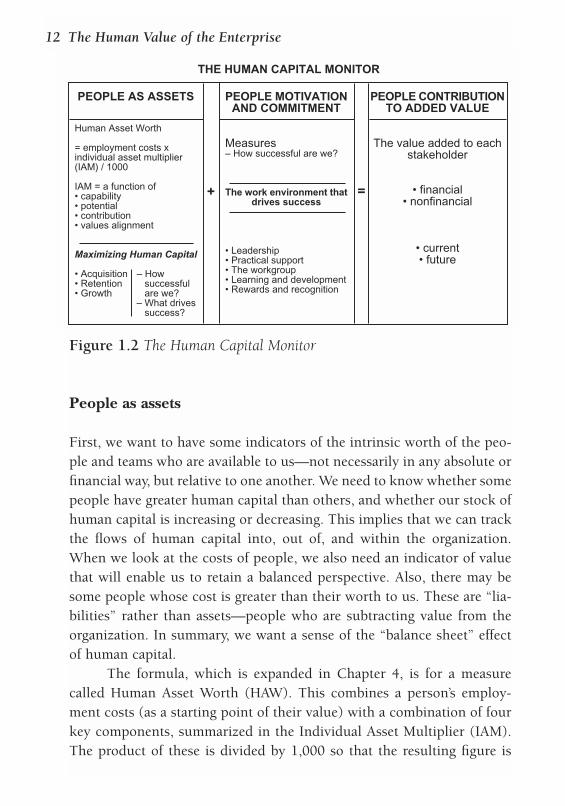
People as assets
First, we want to have some indicators of the intrinsic worth of the peo-ple and teams who are available to us—not necessarily in any absolute orfinancial way, but relative to one another. We need to know whether somepeople have greater human capital than others, and whether our stock ofhuman capital is increasing or decreasing. This implies that we can trackthe flows of human capital into, out of, and within the organization.When we look at the costs of people, we also need an indicator of valuethat will enable us to retain a balanced perspective. Also, there may besome people whose cost is greater than their worth to us. These are “lia-bilities” rather than assets—people who are subtracting value from theorganization. In summary, we want a sense of the “balance sheet” effectof human capital.
The formula, which is expanded in Chapter 4, is for a measurecalled Human Asset Worth (HAW). This combines a person’s employ-ment costs (as a starting point of their value) with a combination of fourkey components, summarized in the Individual Asset Multiplier (IAM).The product of these is divided by 1,000 so that the resulting figure is
12 The Human Value of the Enterprise
PEOPLE AS ASSETS
Human Asset Worth
= employment costs xindividual asset multiplier(IAM) / 1000
IAM = a function of• capability• potential• contribution• values alignment
Maximizing Human Capital
• Acquisition – How• Retention successful• Growth are we?
– What drivessuccess?
PEOPLE MOTIVATIONAND COMMITMENT
Measures– How successful are we?
The work environment thatdrives success
• Leadership• Practical support• The workgroup• Learning and development• Rewards and recognition
PEOPLE CONTRIBUTIONTO ADDED VALUE
The value added to eachstakeholder
• financial• nonfinancial
• current• future
THE HUMAN CAPITAL MONITOR
+ =
Figure 1.2 The Human Capital Monitor
clearly not in a monetary currency. The four components that make up aperson’s worth to us are their capability, their potential, their contribu-tion, and their alignment with our values.
Our human capital is maximized through three key activities: per-suading people to join us, keeping them, and developing them. There arefactors we can identify for each of these processes that influence our suc-cess at them and these also require measures.
People motivation and commitment
However good the people we recruit may be, their contribution isstrongly influenced by their working environment. This affects the levelof their motivation, commitment, and loyalty, and encourages or restrainsthe full use of their ability.
It is therefore vital to identify the factors that make a difference inthe environment and to measure their level of strength or weakness. TheHuman Capital Monitor chooses five such factors: leadership effective-ness, practical support in the workplace, the nature of the workgroup, theculture of learning and development, and the systems for rewards andrecognition. We need continually to take measurements in these areas, tofind out whether we are optimizing the value people bring and/orwhether these factors are becoming stronger or weaker.
People contribution to added value
Thirdly, we want to be able to measure the contribution of our humancapital in terms of how people are adding current and future value tostakeholders.
All the people in a commercial organization collectively producefinancial wealth that can be distributed. But they also work in teams andas individuals to provide specific financial and nonfinancial value to oneor more stakeholders. We need some organization-wide indicators oftheir contribution, but also should link every individual with a measureof the specific areas of value their role is designed to add. We also wantto distinguish between the current contribution to maintaining value,and those people and activities dedicated to creating increased value in
A Great Gap to Be Filled 13
the future. This is about the “profit and loss effect” of human capital.For noncommercial organizations the same need exists, except that
the financial indicators have a value-for-money rather than a wealth-creating perspective.
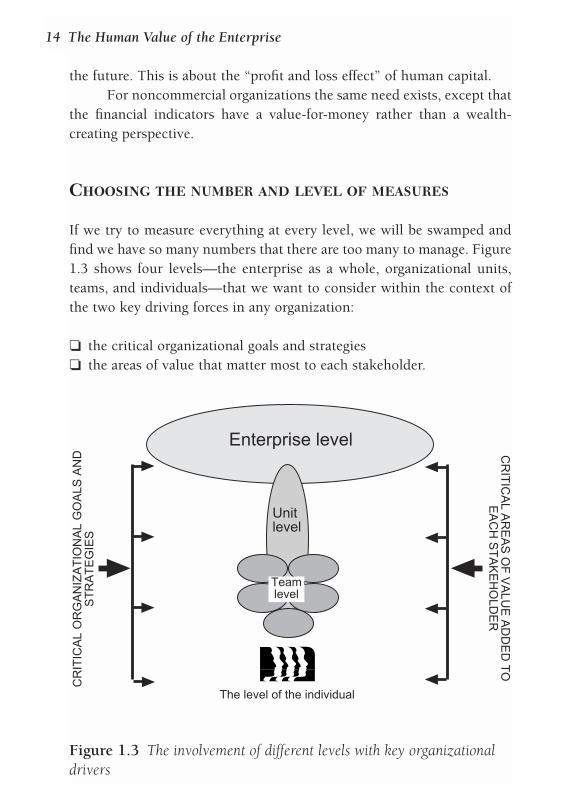
CHOOSING THE NUMBER AND LEVEL OF MEASURES
If we try to measure everything at every level, we will be swamped andfind we have so many numbers that there are too many to manage. Figure1.3 shows four levels—the enterprise as a whole, organizational units,teams, and individuals—that we want to consider within the context ofthe two key driving forces in any organization:
❏ the critical organizational goals and strategies❏ the areas of value that matter most to each stakeholder.
14 The Human Value of the Enterprise
Unitlevel
Enterprise level
Teamlevel
The level of the individual
CR
ITIC
AL
OR
GA
NIZ
AT
ION
AL
GO
ALS
AN
DS
TR
AT
EG
IES
CR
ITIC
AL A
RE
AS
OF
VA
LUE
AD
DE
D T
OE
AC
H S
TA
KE
HO
LDE
R
Figure 1.3 The involvement of different levels with key organizationaldrivers
Measures at the enterprise level can be somewhat crude levers for man-agement, since they hide a multitude of sins and virtues in the detail. Forexample, total attrition figures that include many different categories ofemployees have little meaning. Aggregated opinion surveys may showcommon threads that are organization wide, but the many local workingclimates are the real clues to people’s commitment and satisfaction, so wemust have data broken down to units and teams. Nevertheless, there aretwo rationales for measures at the enterprise level:
❏ Indicators we might want to publish year on year as informationfor investors or stakeholders—for example, financial value added,investments in employee development, community involvement,innovation measures
❏ Those we want to benchmark with other similar organizations—for example, attrition, overall satisfaction, suggestions per person,reward levels.
How do we decide which measures to choose at the lower levels? We startwith our goals and strategies, and the final outcome measures that pro-vide their quantitative targets. They may, for example, be growth levels,profitability, market share, service leadership, best value in providingpublic services, and so on. Each is driven by a number of factors that willinfluence success, and it is often the case that one or two factors havemuch more effect than the others. Thus, if we aim at service leadershipover our competitors, this may be affected most by the completeness ofthe customer database (say, 20 percent), call center staff capability (55percent), and the extent to which a service engineer solves problems inone visit (25 percent). Our prime (but not necessarily exclusive) focuswould be on the second, looking then for the factors that influence staffcapability, and so on in a “staircase” of cause-and-effect dependencies.Each step leads to the next set of factors, and every factor should have itsown measure.
Each staircase may have four or five steps between the ultimategoal and the most basic driver of success. The advantage of this approachis that it leads to very specific areas of the organization’s operations, andquite quickly to individuals or groups of people in those areas. We are
A Great Gap to Be Filled 15
brought directly to aspects of their capability and the environment thatsupports them. We can do the same for the key areas of added value foreach stakeholder.
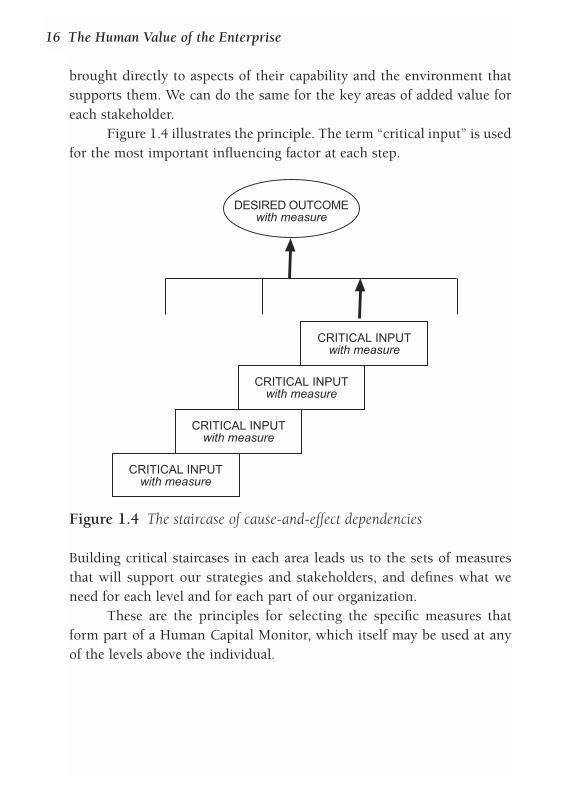
Figure 1.4 illustrates the principle. The term “critical input” is usedfor the most important influencing factor at each step.
Building critical staircases in each area leads us to the sets of measuresthat will support our strategies and stakeholders, and defines what weneed for each level and for each part of our organization.
These are the principles for selecting the specific measures thatform part of a Human Capital Monitor, which itself may be used at anyof the levels above the individual.
16 The Human Value of the Enterprise
CRITICAL INPUTwith measure
CRITICAL INPUTwith measure
CRITICAL INPUTwith measure
CRITICAL INPUTwith measure
DESIRED OUTCOMEwith measure
Figure 1.4 The staircase of cause-and-effect dependencies
THE STRUCTURE OF THIS BOOK
This book sets out to answer three questions:
❏ Why is it essential to have a system of measurement for human assets?❏ How should we go about measurement?❏ How can this make us manage more effectively and create more
ultimate value?
An organization that wants to think and act seriously in the belief thatpeople are its most important assets can be described as a “value-creatingorganization.”
Chapter 2 discusses the meaning of value and the role of people inthe processes of creating value.
Chapter 3 looks at the process of measurement in the context ofpeople. This leads us into looking at the components of the HumanCapital Monitor in more detail.
Chapters 4 and 5 focus on the intrinsic worth of people as assets—the first column of the Human Capital Monitor. We examine what con-stitutes their worth, and particularly the challenge in defining levels ofcapability and potential.
Chapter 6 is about how we can maximize human capital throughacquisition, retention, and growth, and related measures.
In Chapter 7 we move to the second column of the Human CapitalMonitor, looking at motivation and commitment and what influencesthese. Chapter 8 discusses how we can build a supportive environment tomake the best of people’s talent.
Chapter 9 describes the last column of the Human Capital Monitor,showing how we define and track the critical indicators of value to eachstakeholder.
Chapter 10 focuses on managing the human side of mergers andacquisitions, and how we can ensure that value is not lost in the process.
Chapter 11 reviews what is happening in relation to the publicreporting of human capital measures.
Finally, the Appendix reviews the literature on the measurement ofintellectual capital.
A Great Gap to Be Filled 17
2People Drive Value
WHAT DO WE MEAN WHEN WE SAY THAT PEOPLE ARE “ASSETS”?In this chapter we will explore this concept in the lan-guage of accounting and look at the meaning of “value”as it applies in organizations. Traditional accountancy
does not serve us well in an era when knowledge is more important thanphysical assets, and the chapter considers some of the ways in which itneeds to be changed.
We cannot talk about value and ignore the prevailing preoccupa-tion with “value for shareholders,” so we look at how this is achieved andsee why it is the intangible assets—the intellectual capital—of an organi-zation that are its real drivers. This is not just the people; it includesmany other generators of future revenues, and we shall see how these canbe analyzed and categorized systematically, as well as examining the roleof people in contributing to them. This leads us to discussing people as“human capital,” reviewing first how others have looked at this, and thenforming conclusions about why we need the measures in the HumanCapital Monitor to be truly effective.
PEOPLE AS ASSETS
We are borrowing from accountants’ language when we talk of people as“assets.” Assets have an intrinsic value to the organization, and at thesame time they generate value for others. In other words, we add value toour stakeholders through the deployment of our assets. So, when we talkabout people in an organization, there are two separate ways in which we
can use the concept of value: what they are worth to us and the valuethey add to others. Both need to be quantified, a dual need that is recog-nized by the Human Capital Monitor.
Capital appears on the opposite side of a balance sheet to assets. Westill debit capital in order to credit assets in line with the tried-and-testeddouble-entry system invented by the Italian monk Pacioli. Capital islabeled liabilities, because it has to be repaid at some point, but we don’thave to “pay back” human capital. We can see it as actually owned by thepeople themselves, who are “on loan” to us for as long as they choose tostay, or we choose to retain them. Just as we look after and invest ourfinancial capital, so it is logical that we shoulddo the same with our people.
Money is used to fund purchases ofphysical (tangible) assets and in their day-to-day use. It is also employed by people, both inmanaging the tangible assets and in buildingintangible assets, such as brand value, cus-tomer loyalty, efficient processes, and newknowledge. An intangible asset, like any otherasset, should generate value. We can also haveintangible liabilities that subtract value: peo-ple or processes or reputations can cost money, sometimes adding novalue at all and sometimes even inhibiting value creation. Assets can turninto liabilities—we might say that they have a negative asset value.
THE MEANING OF VALUE
The “value” of an entity is in the eye of the beholder. Unlike costs, whichare usually expressed in absolute numbers, value goes up and downdepending on particular perceptions, so its worth can increase ordecrease. Money is the commonest currency of value, but it is clearly notthe only one. We do not shed too many tears if the burglar only takesreplaceable commodity goods. What hurts is when something goes thathas unique personal value, an item treasured perhaps because of associa-tion with special people or events. Economists (and many finance
People Drive Value 19
THE CONCEPTS OF “HUMAN ASSETS”
AND “HUMAN CAPITAL” ARE
COMPLEMENTARY. IT IS THE INTRINSIC
WORTH OF OUR PEOPLE THAT
COMPRISES THE HUMAN CAPITAL
AVAILABLE TO US, AND AT THE SAME
TIME THAT WORTH IS A VALUE-
CREATING ASSET.
directors) see value generation in terms of cash transfers, so their mea-surements are usually expressed in hard financial figures. But when wethink of value to stakeholders, we should not think only in this rathernarrow way. There is value to customers in receiving excellent service andin the continuity of relationships with our staff; there is value to employ-ees in having exciting challenges at work and opportunities for personaldevelopment. Suppliers might well take pride in being associated with usand our good reputation. We add value to the stakeholders en route to aneventual financial outcome. If their needs for value are eroded, the inter-ested parties may begin to lose commitment to working with our organi-zation, which would be bad news for shareholders.
We know how to calculate costs well enough, but linking them tovalue creation is much more difficult. We cannot often compare them in
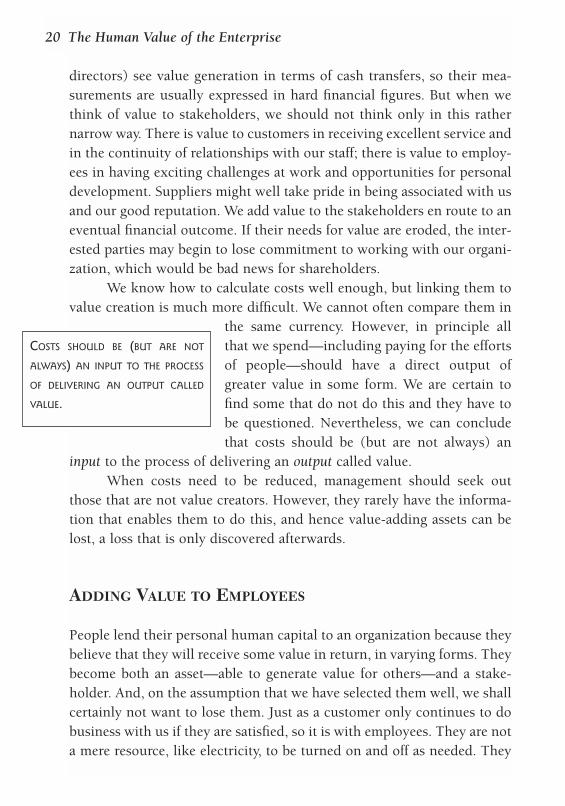
the same currency. However, in principle allthat we spend—including paying for the effortsof people—should have a direct output ofgreater value in some form. We are certain tofind some that do not do this and they have tobe questioned. Nevertheless, we can concludethat costs should be (but are not always) an
input to the process of delivering an output called value. When costs need to be reduced, management should seek out
those that are not value creators. However, they rarely have the informa-tion that enables them to do this, and hence value-adding assets can belost, a loss that is only discovered afterwards.
ADDING VALUE TO EMPLOYEES
People lend their personal human capital to an organization because theybelieve that they will receive some value in return, in varying forms. Theybecome both an asset—able to generate value for others—and a stake-holder. And, on the assumption that we have selected them well, we shallcertainly not want to lose them. Just as a customer only continues to dobusiness with us if they are satisfied, so it is with employees. They are nota mere resource, like electricity, to be turned on and off as needed. They
20 The Human Value of the Enterprise
COSTS SHOULD BE (BUT ARE NOT
ALWAYS) AN INPUT TO THE PROCESS
OF DELIVERING AN OUTPUT CALLED
VALUE.
are the most critical generators of value we have, whatever the nature ofour organization; if it is purely knowledge based—as many are—they arein fact the only ones of significance.
We add value to people financially. We provide salaries, benefits,bonuses, and maybe equity in the firm if it is available. However, mostpeople look for more than merely financial rewards. They may be alsointerested in a selection of the following:
❏ Challenging and interesting work❏ Equipment and resources that would not otherwise be accessible❏ Being associated with an organization of high repute❏ Status and self-esteem❏ Recognition: by the person’s managers, or by peers, or even publicly ❏ Opportunities for personal growth and career development ❏ Interesting colleagues to work with❏ A satisfying and stimulating environment ❏ Social events❏ Opportunities for travel and perhaps high standards of accommodation.
The way in which we provide this value to people conditions their moti-vation, commitment, and loyalty—and hence their contribution toadding value to other stakeholders.
Seeing value in merely financial terms seriously inhibits our under-standing of the balance that we need. It is worth pausing at this point tonote the shortcomings of the accountancy systems that dominate the pre-sent business model, which may even work against the maximization ofvalue creation.
THE POVERTY OF ACCOUNTANCY IN THE MODERN WORLD
I have borrowed this subheading from a wonderful article by Alan Dunn,a vice-president of what is now Cap Gemini Ernst and Young, in the firm’shouse magazine Transformation. He imagined he had died in an air crash,but was not allowed to enter heaven because of his dubious associationswith management accountancy. He was given a chance to redeem himself
People Drive Value 21
in the eyes of the Almighty by taking the (also recently deceased) body ofthe executive director of the Financial Accounting Standards Board. Heproposed three ideas to transform accounting, the first of which was tochange the nature of people accounting. His first directive was:
The sum of all costs associated with the hiring and continuing devel-opment of employees will be capitalised as a year end ledger entry.Accounts normally expensed by period, such as training, employeedevelopment and hiring costs will be credited and a new account called“Capitalised Human Assets” will be debited.
He then contemplated the uncertainties and anomalies in depreciationaccounting. His second directive was:
Each year, all employees will be evaluated for competency and com-pared with scores from the previous year’s evaluation. The book valueof the Capitalised Human Assets will be adjusted accordingly…
This would be an encouragement, he thought, for all employees to“appreciate” rather than “depreciate” through personal development. Histhird directive applied the same thinking to building “brand equity.”
In Transforming the Bottom Line (1995), Tony and Jeremy Hopediscuss how traditional systems of management accounting and perfor-mance measurement do not provide what an organization and its stake-holders really need to know. The power that many finance functionsenjoyed in the 1990s is out of proportion to their relevance. Systems ofperformance management limited to short-term financial performanceagainst pre-set budgets are inappropriate for the knowledge world. Thenonaccountant manager or specialist is a helpless victim of the processesand priorities of accounting practices. They can see clearly the anomaliesand stupidities, but they have become resigned to their inevitability.
In business, financial outcomes will always remain the ultimatemeasures of success; business exists primarily to create wealth. Its suc-cess, however, depends on its ability to understand the causes of resultsas well as the results themselves. This leads inevitably into “softer” con-tributors that can be critical in the staircases of dependency described in
22 The Human Value of the Enterprise
Chapter 1. Here, accounting lets us down. Accountants deal in trans-actions and this is one reason for costs dominating value.
It is not as if accountancy is a precise science in itself. Despite theirappearance of accuracy, many familiar and well-accepted measures—such as profit and capital employed—are the result of judgments andassumptions. Depreciation rates, provisions, classifications of overheads:Judgments on all of these may lead to pragmatic decisions aimed at bring-ing about a desired financial result.
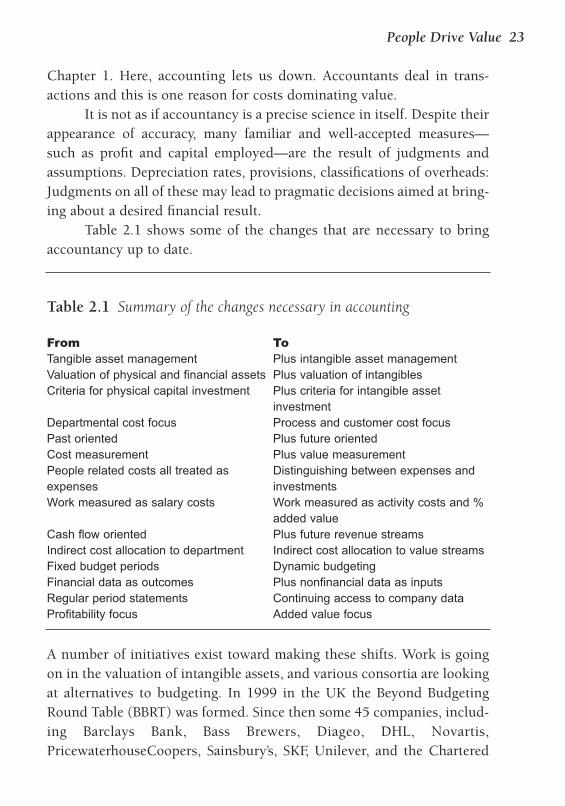
Table 2.1 shows some of the changes that are necessary to bringaccountancy up to date.
Table 2.1 Summary of the changes necessary in accounting
From ToTangible asset management Plus intangible asset managementValuation of physical and financial assets Plus valuation of intangiblesCriteria for physical capital investment Plus criteria for intangible asset
investmentDepartmental cost focus Process and customer cost focusPast oriented Plus future orientedCost measurement Plus value measurement People related costs all treated as Distinguishing between expenses and expenses investmentsWork measured as salary costs Work measured as activity costs and %
added valueCash flow oriented Plus future revenue streamsIndirect cost allocation to department Indirect cost allocation to value streamsFixed budget periods Dynamic budgetingFinancial data as outcomes Plus nonfinancial data as inputsRegular period statements Continuing access to company dataProfitability focus Added value focus
A number of initiatives exist toward making these shifts. Work is goingon in the valuation of intangible assets, and various consortia are lookingat alternatives to budgeting. In 1999 in the UK the Beyond BudgetingRound Table (BBRT) was formed. Since then some 45 companies, includ-ing Barclays Bank, Bass Brewers, Diageo, DHL, Novartis,PricewaterhouseCoopers, Sainsbury’s, SKF, Unilever, and the Chartered
People Drive Value 23
Institute of Management Accountants have sponsored its research. Thefollowing quotation gives an indication of their thinking:
Traditional budgeting is a serious handicap, particularly when firmsneed to operate at high speed, continuously innovate, and compete withe-business strategies. Budgets are barriers to devolution and moreeffective management, yet it is entirely feasible to manage withoutthem.
Jack Welch of GE has called budgets “The bane of CorporateAmerica”; Bob Lutz of Chrysler “A tool of repression”; and JanWallander of Svenska Handelsbanken “An unnecessary evil”. Thereare two fundamental problems. Budgets are barriers to (1) the devolu-tion of power and authority to the front line, and (2) the implementa-tion of more effective performance management processes. While mostcompanies are dissatisfied with their budgeting systems, only a fewpioneers have really addressed the issue. The most mature case is theSwedish bank, Svenska Handelsbanken, which adopted a devolvedmanagement model and abandoned budgeting 30 years ago. It is nowone of Europe’s most successful banks. In recent years many other com-panies including Volvo, IKEA, SKF, Borealis, Schlumberger, AirLiquide, Bull, Carnaud Metalbox and Boots have (to varying degrees)followed its lead.
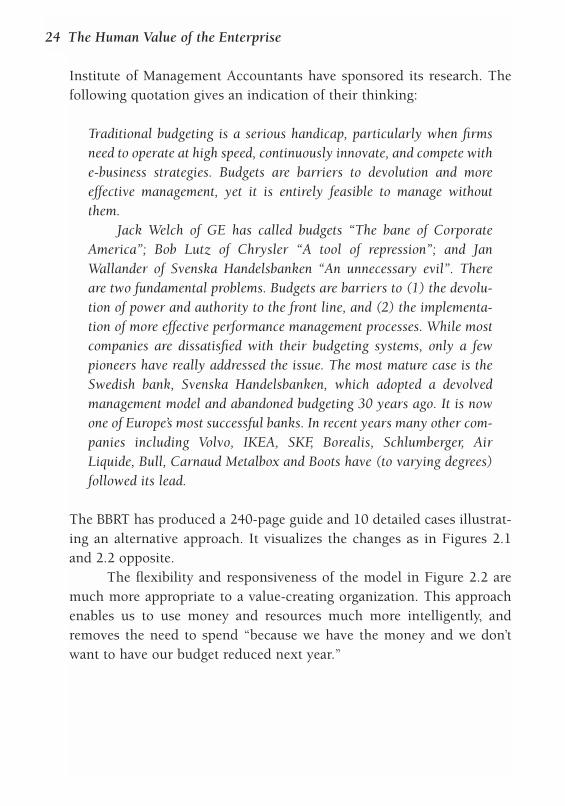
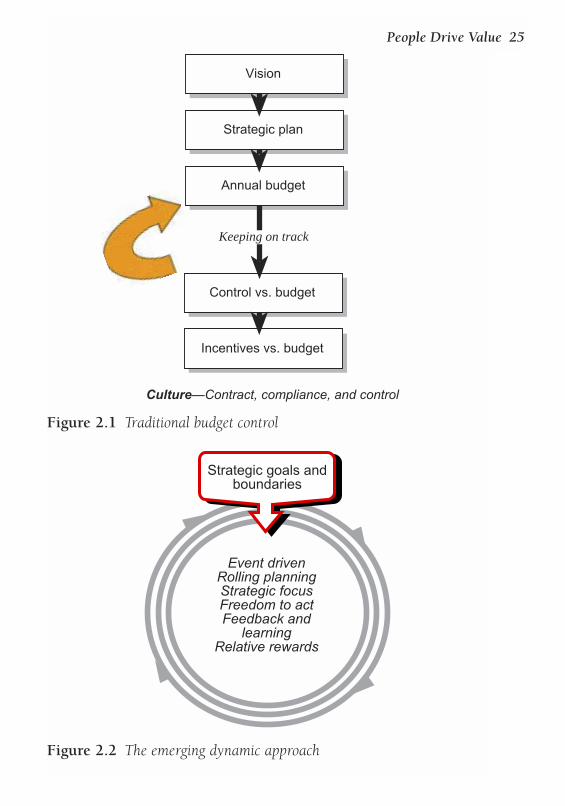
The BBRT has produced a 240-page guide and 10 detailed cases illustrat-ing an alternative approach. It visualizes the changes as in Figures 2.1and 2.2 opposite.
The flexibility and responsiveness of the model in Figure 2.2 aremuch more appropriate to a value-creating organization. This approachenables us to use money and resources much more intelligently, andremoves the need to spend “because we have the money and we don’twant to have our budget reduced next year.”
24 The Human Value of the Enterprise
People Drive Value 25
Vision
Strategic plan
Annual budget
Control vs. budget
Incentives vs. budget
Culture—Contract, compliance, and control
Keeping on track
Figure 2.1 Traditional budget control
Event drivenRolling planningStrategic focusFreedom to actFeedback and
learningRelative rewards
Strategic goals andboundaries
Figure 2.2 The emerging dynamic approach
VALUE FOR SHAREHOLDERS
The delivery of shareholder value is the dominant goal of the Anglo-UScapitalist philosophy, which is progressively modifying the morestakeholder-conscious capitalist models of continental Europe and Japan.In any discussion of value, however, our starting point must be thereturn, in the form of dividends and capital growth, that shareholders cananticipate. Dividends come from current (or past) profits, but forinvestors to buy or hang on to shares, what matters is their confidencethat the particular company will provide continuing profit growth. Theinvestors with influence in today’s world are mainly large institutions likepension funds, and an organization’s managers often have a vested inter-est in the same outcome through their share options.
If you ask how shareholder value is increased, people usually say“by focusing on profitability”—which is hardly surprising. So muchemphasis is put on profits and their forecasts by senior management, andby the analysts who comment on company performance. We see imme-diate, albeit often temporary, changes in share price whenever anannouncement is made that might affect profits.
The response of senior management to “bottom-line” performanceproblems is usually to cut: cut projects, cut staff, amalgamate, centralize,streamline, outsource, and so on. They often give insufficient thought tothe parallel loss of current and future value-creating sources. Studiesrepeatedly show how heavy cost cutting batters morale and has many“hidden costs,” causing good people to leave, and reducing levels of cus-tomer service. Voluntary redundancy programs, although perhaps a markof a caring company and undoubtedly benefiting many individuals, canlead to a devastating loss of valuable skills and experience—unless theorganization retains the right to say “No, we cannot lose you.”
It is nearly always easier to reduce than to grow and the effects aremore speedily seen and celebrated. Yet, even the architects of reduction-ism in business process engineering had to admit that it can lead to whatthey called “corporate anorexia.” James Champy and Michael Hammerhad to add a human element in the sequels to their original 1993 bookReengineering the Corporation. Geoff Armstrong, Director General of theUK’s Chartered Institute of Personnel and Development, said in his 1996
26 The Human Value of the Enterprise
keynote speech to the Institute: “Does anyone stop to think of how thebillions spent in firing people might have been otherwise invested forgrowth, and the effect that would have had on our companies?”
The legacy of the short-term and narrow approach to shareholdervalue is well described in Alan Kennedy’s The End of Shareholder Value(2000). He describes it as leading to a “me-first” mentality, which spreadsthrough the attitudes of all stakeholders as they reciprocate. Employeesrespond to their unpredictable level of security by losing loyalty to theorganization, and job mobility becomes the norm. Many suppliers aremore interested in their own organization and internal cost managementthan in what matters to customers, and the latter can also vote with theirfeet. Loyal suppliers are squeezed out by the vicious cycle of demands forever lower prices. All of this one might regard as the inevitable progressof the capitalist ethos, but Kennedy argues that these are the direct fruitsof the short-term desire to enhance the stock price at any cost.
Good companies have always paid attention to the long term andto their stakeholders’ interests. Porras and Collins of Stanford Universitytook 18 examples of what they called visionary companies, with an aver-age lifespan of nearly 100 years. They compared them to similar compa-nies that had experienced roughly the same opportunities but had notachieved the same reputation or performed so well. The authors said theywere looking for timeless management principles. What did they find?The visionary companies demonstrated a continuing focus on “intellec-tual capital” in the following ways:
❏ A consistent and strong core ideology, with clear values thatformed the foundation of their infrastructure
❏ A clear vision for the future and “Big, Hairy Audacious Goals” thatwent beyond the current financial year
❏ A high premium on innovation: “Try a lot of stuff and see whatworks”
❏ A focus on employee development, and growing their own seniormanagers.
Not many organizations have managed to maintain the optimum balancebetween short- and long-term gain through their systems of management
People Drive Value 27
and performance measurement. The forces for the short term are strongand easily dominate. Many managers are very conscious of this dilemmabut feel powerless to solve it.
THE POWERHOUSE OF VALUE: INTANGIBLE ASSETS
The starting point for assessing value—and its message is powerfulenough on its own—is this equation:
MARKET VALUATION = VALUE OF NET TANGIBLE ASSETS + VALUE OF INTANGIBLE ASSETS
The market valuation of a company—its share price times the number ofshares—is what a stock market says it is worth at a point in time. It neverhas been exactly what internal accountants calculate it as, although itused to be pretty close, since it was their duty to provide shareholderswith their best estimate. Unfortunately, their system of calculating the netassets (“book value”) no longer serves shareholders well. A yawning gaphas arisen in the last ten years between this and the value placed on thecompany by the market.
This gap represents the increasing value allocated to intangibleassets. According to Microsoft chairman Bill Gates, “Our primary assets,which are our software and software developing skills, do not show up onthe balance sheet at all.” In fact, less than 3 percent of Microsoft’s valueis accounted for by tangible physical and financial assets.
The term “intellectual capital” is often used for an organization’sintangible assets. The first thinkers to realize the significance of this intel-lectual capital came from Scandinavia: Leif Edvinsson of Skandia andKarl Erik Sveiby of one of Sweden’s most successful publishing compa-nies, Affärsvärlden. In the USA it was Thomas Stewart, a journalist withFortune magazine, who highlighted this valuation dilemma in a 1994article. In this era, Stewart says, wealth is the product of knowledge andhe defined intellectual capital as:
Intellectual material—knowledge, information, intellectual property,experience—that can be put to use to create wealth.
28 The Human Value of the Enterprise
The confidence that causes a share price to be sustained, and to rise overthe medium to long term, is built through a belief in future earningsstreams. It is true that there are variable market factors that affect a shareprice at any point in time—we saw that particularly in the “dotcom bub-ble” of late 1999 and early 2000. But over time, that confidence comesfrom a sound strategy, from continuing innovation in products and ser-vices, excellent people, loyal and satisfied customers, a reputation andimage in connection with the community that create a positive company“brand,” synergistic partnerships, and so on. All of these come under thecategory of intellectual capital.
Each time a balance sheet is prepared, the figure for intangibles canbe calculated as an absolute amount by comparison with the prevailingmarket valuation. There are valid criticisms of the simplicity of such aformula, the most obvious being the volatility of the market value, as wellas the fixation of a balance sheet “snapshot” on a particular day that canbe out of date immediately. Better, one can take a three- or six-monthmoving average of both of these and calculate each month the ratio ofintangible assets to market value. This is our best indicator for compari-son with other organizations, and over time.
Valuation and depreciation of tangible assets follow different rulesin different countries, so global comparisons have to be treated with cau-tion. Nevertheless, however sophisticated we become in devising a for-mula, the fact remains—and this is what matters—that a very large partof value is unaccounted for in most enterprises.
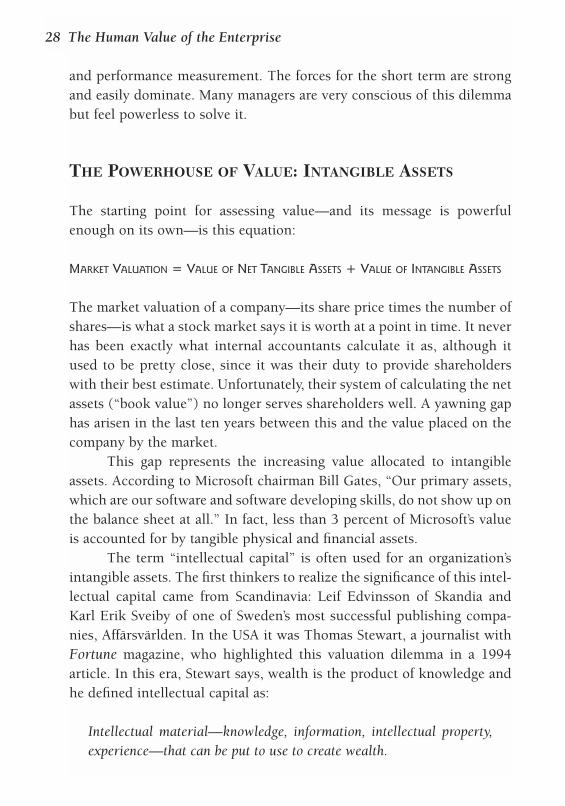
Figure 2.3 overleaf shows the gap that has arisen over the yearsbetween the book value of an enterprise—as measured through tradi-tional accounting practices—and the market valuation. A ratio on theleft-hand side of 1.0 indicates a book value equivalent to market value.As the importance of intangibles has grown so this ratio has come down.The proportion of value attributable to tangible assets has continued tofall, and in 2000 was about 0.2 for the S&P 500 in the US. A radicalchange happened in the early 1990s with the growth of information tech-nology, together with a newly focused emphasis on quality and cus-tomers. Today, high-technology and healthcare companies will probablyhave over 90 percent of their value in intangible assets. Even in manu-facturing and engineering companies we will find figures of between 50
People Drive Value 29
and 80 percent. In late 2000, for example, BP showed a figure of 74 per-cent, 3M 82 percent, and ABB 85 percent.
Why has this happened? Although it is fashionable to distinguishbetween “old” and “new” economies, the fact is that practically everyorganization in the developed world has seen a growth in the importanceof services, and in the competitive advantage of knowledge in all itsforms. Managing “talent” and managing “knowledge” have become theimperatives of the new millennium for all organizations.
The inescapable conclusion is that valuing and quantifying intel-lectual capital form perhaps the greatest challenge facing businessestoday. Investors need methods of understanding how value is beingcreated in the organization and assessing what confidence they can havein the future. Management needs measures in order to manage theseassets more coherently and effectively. And accountants need ways ofachieving a more complete asset valuation. We should expect more activ-ity and attention to be given to managing intellectual capital than to man-aging the tangible assets.
Accounting bodies and academics have recognized this need forsome time. The Appendix reviews some of the available proposals formeasurement and valuation of intangible assets/intellectual capital.
30 The Human Value of the Enterprise
Figure 2.3 The change in equity valuations over time
THE COMPONENTS OF INTELLECTUAL CAPITAL
So far we have treated intellectual capital as a whole, but it is of coursecomposed of many parts. In order to understand the part that people playin the overall picture, we need a means oflooking at the various components. In the fewyears that authors have been thinking andwriting about intellectual capital, a broad cat-egorization has emerged, as follows.
Structural capital
Structural capital falls into two parts:
❏ Customer (external structural) capital. This includes assets thatenable and/or stimulate people outside our organization to workwith us, and—in a commercial organization—to buy from us. Itincludes customer contracts, relationships, loyalty, satisfaction,market share, image, reputation, brands, distribution networks andchannels. In the public sector we would talk, for example, aboutservice levels, accessibility, reputation, or the popularity ofrevenue-generating activities.
❏ Organizational (internal structural) capital. This includes all thatrelates to our internal operations and efficiency. It embraces strate-gies, systems, methodologies, and operational processes. All therecorded knowledge we have is here: patents, know-how, data-bases, and technology. We would also place here the culture of theorganization.
Human capital
This is the people themselves, loaning their personal “human capital” tothe organization, their individual capability and commitment, their per-sonal knowledge and experience. But it is more than the individualsalone: It includes the way in which they work together, and the relation-ships they have both inside and outside the organization.
People Drive Value 31
HUMAN CAPITAL IS WHAT PEOPLE TAKE
HOME WITH THEM, AND STRUCTURAL
CAPITAL IS WHAT THEY LEAVE BEHIND.
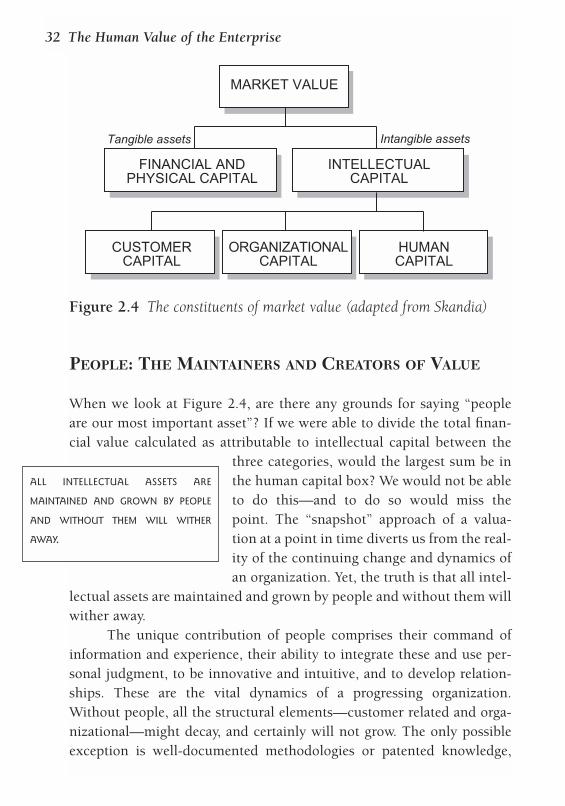
PEOPLE: THE MAINTAINERS AND CREATORS OF VALUE
When we look at Figure 2.4, are there any grounds for saying “peopleare our most important asset”? If we were able to divide the total finan-cial value calculated as attributable to intellectual capital between the
three categories, would the largest sum be inthe human capital box? We would not be ableto do this—and to do so would miss thepoint. The “snapshot” approach of a valua-tion at a point in time diverts us from the real-ity of the continuing change and dynamics ofan organization. Yet, the truth is that all intel-
lectual assets are maintained and grown by people and without them willwither away.
The unique contribution of people comprises their command ofinformation and experience, their ability to integrate these and use per-sonal judgment, to be innovative and intuitive, and to develop relation-ships. These are the vital dynamics of a progressing organization.Without people, all the structural elements—customer related and orga-nizational—might decay, and certainly will not grow. The only possibleexception is well-documented methodologies or patented knowledge,
32 The Human Value of the Enterprise
MARKET VALUE
FINANCIAL ANDPHYSICAL CAPITAL
INTELLECTUALCAPITAL
CUSTOMERCAPITAL
ORGANIZATIONALCAPITAL
HUMANCAPITAL
Tangible assets Intangible assets
Figure 2.4 The constituents of market value (adapted from Skandia)
ALL INTELLECTUAL ASSETS ARE
MAINTAINED AND GROWN BY PEOPLE
AND WITHOUT THEM WILL WITHER
AWAY.
which Annie Brooking, in Intellectual Capital, put—with some justifica-tion—in a separate category of intellectual property. Even then, peopleare needed to exploit it. Gordon Petrash convinced Dow Chemical that itwas sitting on a mass of potential revenues with its accumulated intellec-tual property and this led to his setting up a department to manage andmarket it more effectively.
COMBINING THE HUMAN CAPITAL OF INDIVIDUALS
Individuals bring their own human capital to us, and through workingtogether they are able to create more value for the organization than asisolated contributors. They thus build structural capital, and variousterms have appeared to describe this.
Social capital
People are mobilized into teams to create new intellectual capital. If theytrust each other and are enthused by the work itself, they will want towork together and to share and exchange knowledge and ideas. Theywill find reasons to come together, to seek and give help, and exchangeideas. Building such trust may become an investment in itself, throughproviding opportunities for people to meet. Project teams, workinggroups, seminars for exchange—all of these are activities that promotesocial capital.
Emotional capital
Kevin Thomson writes in Emotional Capital that “assets like passion,obsession, motivation, desire, innovation and knowledge will be criticalin creating the products, services and relationships which produce life-time loyalty from customers and colleagues alike.” He rightly emphasizesthe need to harness intellectual capital assets through belief, enthusiasm,and passion. When revising its “business competencies” in the mid-1990s, IBM placed “a passion for the business” at the center. It recognizedthat the most potent driver of success was a love for the IT world and
People Drive Value 33
what it could do. This kind of passion has driven many entrepreneurs andleaders to great success, and their enthusiasm is transmitted to others.
Relationship capital
This term has been used to describe the network of relationships that existwithin, and beyond, an organization that make it function effectively.
The most obvious and important example is the relationships withcustomers. Customers can interact with a firm quite impersonally, andmany transactions take place without any intervention of a human beingother than in a mechanical way. But in many businesses it is the personaltouch that makes such a difference to customer loyalty. It is not surpris-ing that when some salespeople or consultants leave they are made tosign an agreement that they will not take any clients with them for aperiod of time. It is also well known how difficult this is to enforce, espe-cially where the client has the choice of whom to deal with.
The same principle applies to suppliers. Firms like Marks &Spencer (in its heyday) and Procter and Gamble were always known forseeing suppliers as real partners, for creating relationships with them witha view to maximizing their common interests. Frequent visits would takeplace, joint projects and experiments were entered into, and data on qual-ity and product effectiveness shared. By contrast, the cold, adversarial,clause-enforcing relationship that characterizes the construction industryproduces no loyalty, only a continual and expensive struggle for contracts.
Today’s businesses invariably involve a range of partnerships andalliances. These may cover research, marketing, manufacturing, or sharedtechnology. Each has its own network of key relationships of trust thatmake it work.
The importance of both external and internal relationships is suchthat a firm should be aware of them and be very careful before breakingthem. Restructuring in the interests of cost saving often takes no accountof such capital, and as a result precious customer loyalty may be lost.Copious written explanations of why the change will be “better” for theother party are unlikely to make up for the loss of a relationship of trust.
It is one thing to look for the positive side; equally important is theremoval of discord and destructive relationships. Enmity between depart-
34 The Human Value of the Enterprise
ments that need to cooperate is found all too often and is clearly a liabil-ity. Job rotation, interdepartmental “team-building” sessions, second-ments—these are some of the ways of creating trust and working moreeffectively together.
Knowledge capital
Firms have begun to wake up to the fact that knowledge is a preciousasset that is frequently underutilized and poorly managed. Knowledge isan important component of our overall intellectual capital and it is intri-cately linked with human capital. However, considerable confusionexists as to terms and what constitutes knowledge; academics pour outpapers seeking to clarify this critical area. More and more case studiesappear demonstrating both constructive and value-producing ways ofmanaging knowledge, and also illustrating the mistakes that have beenmade.
Hubert St Onge, a major Canadian contributor to thinking aboutknowledge management, sees the generation of knowledge capital as themajor contributor to corporate value. His model is of human, customer,and structural components all working together, in a positive environ-ment of organizational learning, to produce this knowledge capital.
A distinction needs to be made between knowledge and informa-tion. The initial answer of many organizations to the challenge of knowl-edge management was to make more and more information available, onfor example an intranet. Much of this was merely digitized informationsuch as telephone directories and procedure manuals. It has extended toshared databases, such as customer and product information, and toexternal links with the internet for news and market data. Of course thisdoes have value, particularly in saving time when accessing facts andbeing able to keep information up to date much more readily.
However, knowledge is the result of processing information, whatis learnt from it. It is what the various pieces of information, perhapsculled from multiple sources, are telling us. For example, people pay sub-scriptions for investors’ broadsheets, buying the conclusions and recom-mendations the writers have reached from studying as many facts as theycan acquire.
People Drive Value 35
Knowledge also comes from experience. New experiences are themost potent form of acquiring new knowledge. They arise every day, fromproblem solving, experimentation, mistakes, market and environmentalchange, projects, new ideas, and so on. Each person involved is enrichedthrough the extension of their existing knowledge. This can be expressedvisibly and explicitly, for example in new products and services, revisedprocesses, or manuals of best practice. These may be retained within thegroup that generated them (for whom this is certainly enhanced know-ledge “capital”) or made available to the whole organization. One of thekey challenges of knowledge management is creating this availability toothers. Through sharing:
❏ We avoid duplication of mistakes.❏ We avoid duplication of projects.❏ We can update to best known practices.❏ We stimulate more new ideas.
This all makes such good sense that one wonders why organizations havetaken so long to wake up to this priority. The large consultancies wereamong the first to realize how vital this activity was for their businesssuccess. Tom Peters uses some 50 pages in Liberation Management(1992) to describe the system set up by McKinsey. Karl-Erik Sveiby wrotemany pioneering texts focusing on how knowledge should be managedin the knowledge-based organization. Arthur Andersen produced its firstCD-Rom of “Global Best Practices” in 1992, describing ten core estab-lished consultancy processes.
Technology has been a great stimulus, but it is not enough.Whereas people will readily supply information and facts, giving theirknowledge to others runs into several barriers. Time, availability, motiva-tion, and fear of losing personal power are some of them.
So far we have looked at making knowledge explicit. This is dis-tinguished from knowledge that is tacit, which cannot be expressed in away that others can use. Experience produces knowledge, which leads tosound judgment and wisdom—the “knowledge” that is used in makingfuture decisions. This is a complex area, intricately tied in with personalattributes such as analytical thinking and intuition. It forms the core of
36 The Human Value of the Enterprise

an individual’s personal human capital. The way in which the collectivetacit knowledge of individuals is harnessed is a critical success factor ina value-creating organization.
Gordon Lackie, a consultant based in the Netherlands, has cap-tured the importance of people sharing their knowledge in his concept of“Mobilizing Collective Intelligence” (MCI). He argues that mobilizingpeople to use their collective tacit knowledge is far more important (andlikely to succeed) than attempting to “manage” it. Although storingknowledge and making it available are clearly helpful activities, he arguesthat more effort should be put into adapting, improving, and applyingwhat is known together. This makes much sense and integrates the con-cepts of knowledge and social capital.
SUMMARY
People are a unique form of asset. They possess their own personal capi-tal that they can withdraw from an organisation at any time. Nevertheless,we can make it attractive for them to join and stay, to use their capital forour advantage, and at the same time add value to themselves.
Delivering “value” is why organizations exist. This is clearly aboutproviding “sustainable returns to shareholders” for those companies thathave owners and investors, but not-for-profit organizations also createvalue for their stakeholders even though it may not be measured finan-cially. Value is in the eyes of the beholder, and a stakeholder will onlywant to continue their association with an organization if their expecta-tions of value are being met.
The obsession with value to shareholders is seen at its extreme inthe US and countries that have embraced that style of capitalism. It hasbeen associated with many short-term decisions, especially in reducingcosts—whether they are value-producing costs or not. Traditional man-agement accounting, designed for the industrial era, often causes deci-sions to be made that are inconsistent with a value-creating organization,which needs to build the strength of its intangible assets. Even the sacredcow of budgeting is under attack, as the pace of change demands controlwith flexibility.
People Drive Value 37
Today’s markets look for value beyond the traditional net book worth,which reflects only the physical and financial assets. Even heavily capital-intensive companies are valued at two to four times this book value, andknowledge-intensive organizations up to 20 times. The gap represents the“intangible assets,” those that have no coherent system of measurement,such as customer relations, unique knowledge and systems, talented people,and clear visions and strategies. It is these that will generate future profits.As yet, there are few agreed ways to assess the value of these intangibles.
However, these are what drive continuing value for all the stake-holders of an organization. The time and attention given to the planningand monitoring of these assets are generally much less than their impor-tance justifies. Unlike the finance director who coordinates through com-mon systems and standards, intangibles are generally distributed acrossmany functions and monitored in varied ways—sometimes not at all.
The intangible assets of an organization are more generally knownunder the heading of intellectual capital, although this is often confusedwith intellectual property (in a legal sense) or with the people and theirknowledge. However, the emerging categorization distinguishes, first,assets that relate to the external world, to do with customers and thecommunity; secondly, those that are part of the internal infrastructure ofthe organization; and finally, the human capital. Although referred tocommonly as assets, there are aspects of all these areas that can be nega-tive, “liabilities” that subtract value rather than add it.
The term “capital” is being applied to many concepts. Emotional,social, and relationship capital are all in use and represent differentaspects of the softer side of an organization’s infrastructure. Knowledgecapital is more substantial, and represents the cumulative codified know-ledge, wisdom, and experience on which the organization can draw.
CHALLENGES FOR ACTION
❏ In which contexts is the word “value” used in your organization? What
meaning would people give to it?
❏ Assuming you have a quoted market valuation, do you know and track the
percentage of value that is intellectual capital in your organization?
38 The Human Value of the Enterprise
❏ Do you have any way of evaluating how well the market is seeing your intel-
lectual capital compared to that of your competitors?
❏ How well is it understood in your organization that it is the continual addi-
tion of value to all stakeholders that is the fundamental source of maximiz-
ing shareholder returns?
❏ What messages are given to managers and other employees in your organi-
zation about what really leads to long-term success?
❏ Do you have a language in your organization for describing intellectual capi-
tal that people naturally understand and that fits with your normal work
terms and expressions?
❏ How would you categorize intellectual capital in your organization?
❏ In what ways does your organization have measures relating to human capital?
❏ Have you mapped key relationships held in the organization?
People Drive Value 39
3Measuring Human Capital
IN THE LAST CHAPTER WE DISCUSSED THE IMPORTANCE OF INTELLECTUAL
capital and how it could be categorized and visualized. People,human capital, are the foundation of value creation. We defined theHuman Capital Monitor in Chapter 1, and three areas of necessary
measures. In this chapter we look at the measurement process itself, andat the ways in which measurement has been attempted to date. There aremany difficulties, of course, which is one reason we are still struggling.The different types of measure available are discussed, as is how we canbalance the positive value adding (an asset) and the negative value sub-tracting (a liability). We survey the different approaches to measurementin current use, including the balanced scorecard, and expand the idea ofcause-and-effect dependencies as a means of choosing which measures totrack.
WHY THIS IS NOT AN EASY AREA
It is no accident that people-related measures have less presence andimpact in everyday performance measurement than do financial or evencustomer-related ones. We know that people are important; perhaps thisis so self-evident that measurement seems almost superfluous. And yet,most will agree that this area is significantly underdeveloped. Why has itbeen so difficult to get people measures taken seriously?
❏ Since as we know it is difficult to quantify most intangible assets ina monetary way, whatever measures we have will compete with
financial measures’ apparent credibility and appearance of accu-racy. People are mobile, subjective, changeable, variable—and asfar from an accountant’s concept of an asset as one could be. Thenew International Accounting Standard IASC 38, which deals withthe valuation of intangible assets, excludes the whole area ofhuman capital (and others too, such as brands) as not conformingto the definition of an asset.
Jeffrey Pfeffer, writing in the journal Human ResourceManagement, provides an excellent summary of the pitfalls inhuman capital measurement. He argues that most human resourcemeasures focus on costs or link in with existing accounting sys-tems. He notes that when people are the denominator in a ratiosuch as productivity, the way to raise it is to shrink the number ofpeople—a “pernicious way to make people appear more produc-tive.” He warns that HR people should not “become more skilled atsomeone else’s game.” We need to find a different measurementframework. It cannot be the same playing field as that of theaccountants.
❏ A number of HR professionals are uncomfortable with the need formeasurement where people are concerned. They regard it as bothunnecessary and essentially inadequate to describe people in termsof numbers: “It should be self-evident that people are the mostimportant asset we have; we don’t need numbers to prove it.” Thisthinking has restrained professional HR bodies from making mea-surement a priority. Despite the concern of many HR departments tobe seen as more and more business linked, this area has not receivedthe attention it deserves. One persuasive and tireless advocate, how-ever, is Dave Ulrich, professor at the University of Michigan.
❏ Senior management has acquiesced in the lack of insistence onmeasures by being relatively undemanding of any informationother than headcount or cost-based data, rarely asking, for exam-ple, for return-on-investment calculations on HR initiatives. Faithin what seems the right thing to do has triumphed over evidence ofbenefits achieved. They would not dream, of course, of investing incapital equipment without detailed consideration of the return ontheir money.
Measuring Human Capital 41
❏ This lack of demand means that something that is difficult anywaywill inevitably be squeezed out of the priorities of most HR func-tions. The effort required may seem to go relatively unrewarded, orperhaps attempts to do it in the past may have lacked credibility—or the results may even have been uncomfortable.
❏ Much as managers love numbers, they can become very fed up ifmore and more measures are foisted on them. Because they repre-sent more paperwork and bureaucracy, the question is always:“What’s in it for me?” This is a fundamental question that must beaddressed. Unless top management is visibly committed to newmeasures and makes clear that they are important, we cannotexpect interest and attention, particularly from managers furtherdown the organization. Measures must be carefully chosen toreflect what is strategically important, and also what is helpful inachieving organizational goals.
Some practical difficulties
There are problems with many measuring processes and those used inaccounting have their own difficulties. It is worth reminding ourselves ofsome of the traps in our way.
Measures designed to reflect the contribution of people will rarelyhave total “causality,” that is, they will not be exclusively linked to thepeople themselves. The efforts of people combine with other factors suchas market conditions and the effectiveness of internal systems andprocesses. Intelligent interpretation of the measures is therefore moreimportant than the numbers themselves.
The “consolidated measure” that is often seen at the top level ofmanagement is certainly useful for benchmarking. However, it hides arange of data that has more meaning as it describes what is actually hap-pening in different functions or units. When several results are consoli-dated, the danger is that a sweeping solution is applied across the board,which may be quite wrong for some.
A classic case here is a profitability crisis that results in a universalheadcount cut or recruitment ban, which may be counter-productive togrowing units. Likewise, a corporate attrition rate may on its own look
42 The Human Value of the Enterprise
quite acceptable, but hide undesirable losses in critical areas of theenterprise.
“Headcount” is the simplest measure of people and is commonlyused as a denominator in ratios such as revenue per head. There are atleast three dangers arising from the use of the word “head.” First, it is raretoday for the human contribution to the enterprise to be confined to theso-called “permanent” payroll, whether full or part time. Temporary staff,for example, or contractors and consultants might be contributing to theadded-value output. Secondly, a focus on heads leads to a tendency tomanage headcount down in order to improve ratios. Hard-pressed man-agers soon find ways round it by hiring people who do not show up inthe figures. The outcome is that actual costs are not reduced, and humancapital that should be “committed” to the organization may not be hiredor even retained. And thirdly, one “head” is certainly not the same asanother, in both cost and capability. For example, the cost of a softwarespecialist in India might be one twentieth of that in Silicon Valley, butaccountants would count each in the same way—one head.
HR people are often required to spend an extraordinary amount ofeffort reporting on the state of the headcount. People budgets are fre-quently set as the number of heads. I once argued strongly the imperfec-tions of this approach to a particularly wise and sanguine CEO, and hisanswer was: “I know. But it is simple and everyone understands it, and itworks.” In the twenty-first century and the era of understanding value,we need to progress beyond that.
Measures are frequently presented as static, absolute numbers. Infact, they often have little meaning expressed in this way, and at a givenpoint in time. Business is dynamic, so trends, comparisons, and direc-tions provide more meaningful data.
Measuring Human Capital 43
A CHECKLIST FOR GOOD MEASURES
Many of these will be familiar, but it is worth having a reminder. Effectiveand useful measures have the following characteristics:
✔ They are simple to understand.✔ They are clearly defined so that people interpret them in the same
way.✔ Data can be collected in a way that ensures that the effort required
is proportional to the resulting usefulness of the measure.✔ The process of measurement has integrity: Measures are made in a
consistent way and are seen to be reliable.✔ The measures are not the result of one person’s judgment.✔ They do not have built-in biases, such as “leading” or “loaded”
questions in a survey.✔ They make sense in the context of other measures—for example, if
we measure a person’s skills through an off-job assessment center,how does this match with the perceptions of colleagues in theworkplace?
✔ They are credible as “roughly right, not precisely wrong.”✔ They focus on what is important and comprise key outputs or are
linked to them.✔ They are at the right level of detail to enable appropriate action to
be taken.✔ They can be used for tracking change.✔ There is clear ownership of them by an individual or team.✔ They are taken at the right frequency, chosen to provide useful
trends and comparisons.
EVALUATING MEASURES
How do we know whether to be pleased with the results of our measure-ment or not? When is a measure a “good result” and when is it a “badresult”? Often it will be obvious, but there are three means of evaluationto help us answer the question:
44 The Human Value of the Enterprise
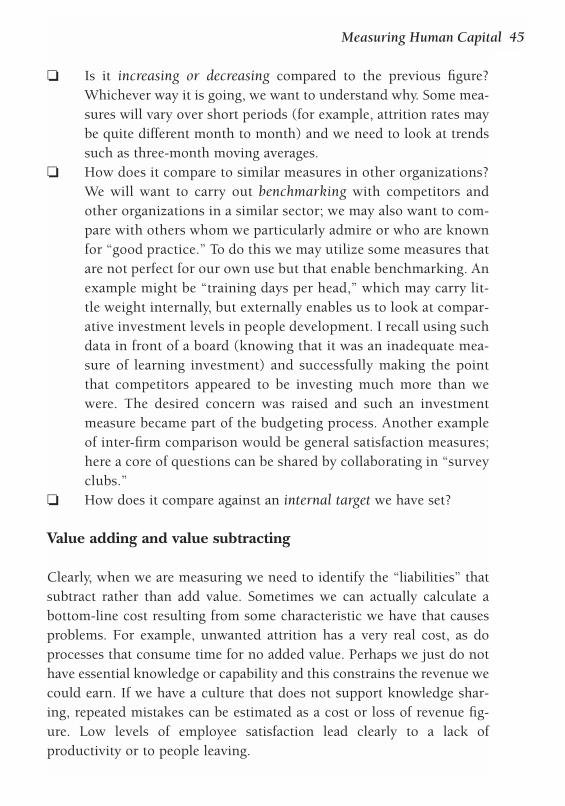
❏ Is it increasing or decreasing compared to the previous figure?Whichever way it is going, we want to understand why. Some mea-sures will vary over short periods (for example, attrition rates maybe quite different month to month) and we need to look at trendssuch as three-month moving averages.
❏ How does it compare to similar measures in other organizations?We will want to carry out benchmarking with competitors andother organizations in a similar sector; we may also want to com-pare with others whom we particularly admire or who are knownfor “good practice.” To do this we may utilize some measures thatare not perfect for our own use but that enable benchmarking. Anexample might be “training days per head,” which may carry lit-tle weight internally, but externally enables us to look at compar-ative investment levels in people development. I recall using suchdata in front of a board (knowing that it was an inadequate mea-sure of learning investment) and successfully making the pointthat competitors appeared to be investing much more than wewere. The desired concern was raised and such an investmentmeasure became part of the budgeting process. Another exampleof inter-firm comparison would be general satisfaction measures;here a core of questions can be shared by collaborating in “surveyclubs.”
❏ How does it compare against an internal target we have set?
Value adding and value subtracting
Clearly, when we are measuring we need to identify the “liabilities” thatsubtract rather than add value. Sometimes we can actually calculate abottom-line cost resulting from some characteristic we have that causesproblems. For example, unwanted attrition has a very real cost, as doprocesses that consume time for no added value. Perhaps we just do nothave essential knowledge or capability and this constrains the revenue wecould earn. If we have a culture that does not support knowledge shar-ing, repeated mistakes can be estimated as a cost or loss of revenue fig-ure. Low levels of employee satisfaction lead clearly to a lack ofproductivity or to people leaving.
Measuring Human Capital 45
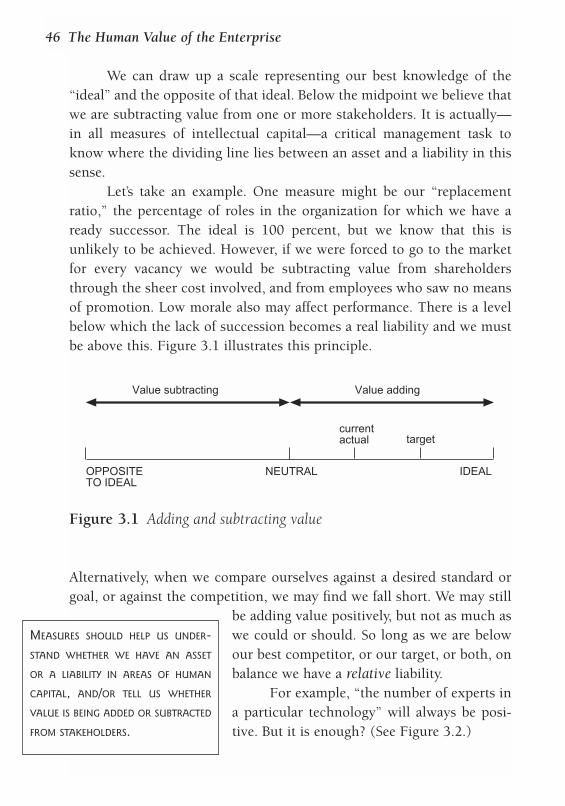
We can draw up a scale representing our best knowledge of the“ideal” and the opposite of that ideal. Below the midpoint we believe thatwe are subtracting value from one or more stakeholders. It is actually—in all measures of intellectual capital—a critical management task toknow where the dividing line lies between an asset and a liability in thissense.
Let’s take an example. One measure might be our “replacementratio,” the percentage of roles in the organization for which we have aready successor. The ideal is 100 percent, but we know that this isunlikely to be achieved. However, if we were forced to go to the marketfor every vacancy we would be subtracting value from shareholdersthrough the sheer cost involved, and from employees who saw no meansof promotion. Low morale also may affect performance. There is a levelbelow which the lack of succession becomes a real liability and we mustbe above this. Figure 3.1 illustrates this principle.
Alternatively, when we compare ourselves against a desired standard orgoal, or against the competition, we may find we fall short. We may still
be adding value positively, but not as much aswe could or should. So long as we are belowour best competitor, or our target, or both, onbalance we have a relative liability.
For example, “the number of experts ina particular technology” will always be posi-tive. But it is enough? (See Figure 3.2.)
46 The Human Value of the Enterprise
NEUTRAL IDEAL
currentactual target
OPPOSITETO IDEAL
Value subtracting Value adding
Figure 3.1 Adding and subtracting value
MEASURES SHOULD HELP US UNDER-
STAND WHETHER WE HAVE AN ASSET
OR A LIABILITY IN AREAS OF HUMAN
CAPITAL, AND/OR TELL US WHETHER
VALUE IS BEING ADDED OR SUBTRACTED
FROM STAKEHOLDERS.
These kinds of scales could be used with most of our measures.With them we can manage performance, compare with others and withtime, know where our “liabilities” are, and set targets for improvement.
EXISTING APPROACHES TO PEOPLE MEASUREMENT
Before going into detail on the measures that support the Human CapitalMonitor, it is worth looking at the various approaches that others have takenin the area of human capital measurement. These fall into five categories:
❏ Attempts to value people as assets. This applies accounting valua-tion principles to people and is known as human resource (orasset) accounting. (This is discussed in detail in the next chapter.)
❏ Creating an index of “good” HR practices and relating these tobusiness results.
❏ Statistical summaries analyzing the composition of the workforceand measures of the productivity and output of people.
❏ Measuring the efficiency of HR functions and processes and thereturn on investment for “people” initiatives and programs.
❏ Integrating people-related measures in a performance managementframework.
INDICES OF GOOD HUMAN RESOURCE PRACTICES
There is now substantial research that has set out to study whether goodpeople management practices are directly linked to parameters of
Measuring Human Capital 47
Measurement scale
bestcompetitor target
lastyear today
area of relative liability
Figure 3.2 Sample measurement scale

business success. For example, a study in the UK sponsored by theInstitute of Personnel and Development with Sheffield Business Schooland the London School of Economics looked at 110 manufacturing com-panies, and related a variety of supporting processes to profitability. Theresearchers calculated that “employee commitment” accounted for 12percent of the variation between companies in their profitability, and 17percent in their productivity. Those firms with a strong human relationsethos showed more consistently good results than the others.
Mark Huselid of Rutgers University in the US has been studyingthe relationship between a company’s personnel policies and its businessperformance for many years. One set of data he collected in 1995 from968 firms related HR practices to attrition, productivity, and financialresults. His analysis showed, for example, that one standard deviation inthe “index of work practices” accounted for a 16 percent increase in pro-ductivity. Organizations that make development of their people a fullystrategic goal performed spectacularly better than others.
Jeffrey Pfeffer of Stanford University, in his book The HumanEquation (1998), argues eloquently for the “seven practices for success-ful organizations” that made a difference, according to his research. Theseare listed as employment security, selective hiring, self-managed teamsand decentralized decision making, comparatively high compensationlinked to organizational performance, extensive training, minimal statusdifferences, and extensive openness in sharing financial and performanceinformation.
The Corporate Leadership Council worked with Coopers andLybrand in 1992–6 and surveyed 1,500 companies on “high performancework practices,” a range of HR systems and approaches. The findingswere matched against criteria of business alignment and financial results.The researchers computed that each standard deviation improvement intheir index of good HR systems led to an increase of $40,000 peremployee in market value and $27,000 in sales.
Lynda Gratton at London Business School has worked with sevenmajor companies and one large hospital since 1992 in the “Leading EdgeConsortium.” This is a very deep study, involving hundreds of managersand employees, into the relations between people processes and businessstrategy and results. The better-performing companies were those that
48 The Human Value of the Enterprise
placed significant emphasis on communication, managed change, andemployee involvement.
Watson Wyatt’s Human Capital Index (HCI)
Watson Wyatt, a firm of consultants, has developed what it calls the“Human Capital Index” (HCI). The consultants surveyed over 400 USand Canadian companies in 1999 and linked human resource practiceswith market value by tracking shareholder returns over a five-yearperiod. They found a strong correlation between their index, a consoli-dation of 30 key HR practices, and increases in shareholder value—acknowledging that correlations are not the same as direct causal links.Over five years the third of the sample showing the lowest index hadrisen 53 percent in market value, as compared to 103 percent for theupper third. The 30 practices were split into five groups. The figuresshown in brackets below are the increases in shareholder value creationover give years associated with one standard deviation of improvement inthat part of the Human Capital Index:
❏ Recruiting excellence (10.1%)❏ Clear rewards and accountability (10.2%)❏ A collegial and flexible workplace (3.8%)❏ Communications integrity (5.0%)❏ Prudent use of resources (–10.0%)
Not all HR initiatives were found to be effective. The last category isparticularly interesting and was somewhat of a surprise to theresearchers. It covered some popular HR initiatives, such as 360º assess-ment. Watson Wyatt concluded that undue investment was put intopractices that in fact yielded very little benefit and could even becounter-productive. Importantly, the research found that there is a neg-ative impact where the activity is not directly supporting the objectivesof the organization.
In a separate study on employee attitudes, again in the US, WatsonWyatt also found a clear direct link between “high commitment” andenhanced three-year shareholder returns.
Measuring Human Capital 49
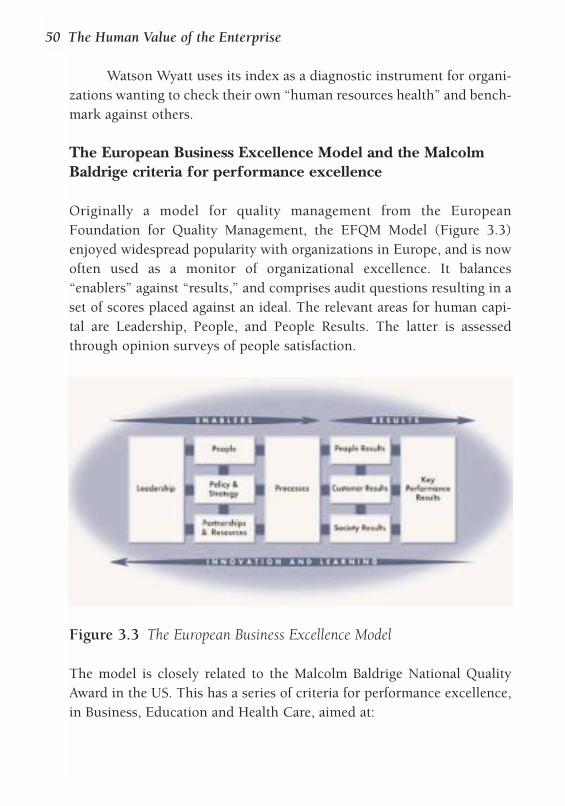
Watson Wyatt uses its index as a diagnostic instrument for organi-zations wanting to check their own “human resources health” and bench-mark against others.
The European Business Excellence Model and the MalcolmBaldrige criteria for performance excellence
Originally a model for quality management from the EuropeanFoundation for Quality Management, the EFQM Model (Figure 3.3)enjoyed widespread popularity with organizations in Europe, and is nowoften used as a monitor of organizational excellence. It balances“enablers” against “results,” and comprises audit questions resulting in aset of scores placed against an ideal. The relevant areas for human capi-tal are Leadership, People, and People Results. The latter is assessedthrough opinion surveys of people satisfaction.
The model is closely related to the Malcolm Baldrige National QualityAward in the US. This has a series of criteria for performance excellence,in Business, Education and Health Care, aimed at:
50 The Human Value of the Enterprise
Figure 3.3 The European Business Excellence Model
❏ ever-improving value to customers❏ improved organizational effectiveness❏ organizational and personal learning.
Seven categories are used and 1,000 points are distributed between them:550 points are shared between Leadership, Strategic Planning,Information and Analysis, Customer and Market Focus, HumanResources Focus, and Business Results; the remaining 450 cover BusinessResults, with 80 allocated to Human Resource Results.
The Human Resource Focus covers:
❏ works systems, aimed at high performance ❏ employee education, training, and development ❏ employee wellbeing and satisfaction (focusing on the work
environment).
Applicants for this quality award describe in detail their processes and thedata regarding their effectiveness. Self-assessment can be made againstdetailed check questions, and a library of good practice is available.
William Mercer’s Human Capital Wheel
William Mercer, another leading specialist HR consultancy, has developeda “wheel” divided into six segments entitled “people” (capability andexperience), “structure” (hierarchy and organization), “processes” (howwork is organized), “decision making,” “information flow,” and “reward.”Concrete measures exist for each.
Changes that have happened in each sector over the previous threeto five years are plotted on the wheel. These are then related to measuresof performance and quality such as added value per employee or anothermeasure of productivity. In a large organization, separate business unitscan be compared on the relationship between their success and theirpositioning on the sectors of the wheel.
Measuring Human Capital 51
Arthur Andersen’s approach to human capital management
Friedman, Hatch, and Walker, three partners in Arthur Andersen, publisheda book that topped the US bestsellers lists in 1999, entitled Delivering on thePromise: How to Attract, Manage and Retain Human Capital. Their systemis known as Human Capital Appraisal™ and is a matrix of systematic inter-vention steps vs. five HR areas of activity. The steps are clarify, assess, design,implement, and monitor, and the areas of activity covered are:
❏ recruitment, retention and retirement❏ performance management and rewards❏ career development, succession planning, and training❏ organization design❏ human capital “enablers”—compliance, employee relations, com-
munications, IT.
These two dimensions of steps and activities result in a 5 × 5 matrix thateffectively acts as an audit checklist for good human capital managementpractices.
Potentially of more interest for our purpose is Arthur Andersen’sFit–Cost–Value™ framework. Each program or initiative is plotted ontwo dimensions of high/low strategic fit and cost > value/value > cost, asin Figure 3.4. “Strategic fit” rates each HR approach against businessstrategy, best practice, and (where relevant) the market. However, valueis determined by the consolidated impressions of employees in each ofthe five areas, which does not take us much further forward thanemployee satisfaction surveys. We are measuring only the value to onestakeholder, and in a rather generalized way.
All the above approaches start with the struc-tural capital of HR processes and initiatives,and with the existing culture. They are partic-ularly useful in benchmarking people man-agement practices. It is good news—thoughhardly a surprise—that treating your humancapital well yields good results. In our terms,
52 The Human Value of the Enterprise
THE VALUE-CREATING ORGANIZATION
STARTS WITH THE STREAMS OF ADDED
VALUE PROVIDED TO STAKEHOLDERS,
AND THEN PUTS IN PLACE PRACTICES
THAT WILL MAXIMIZE THAT VALUE.
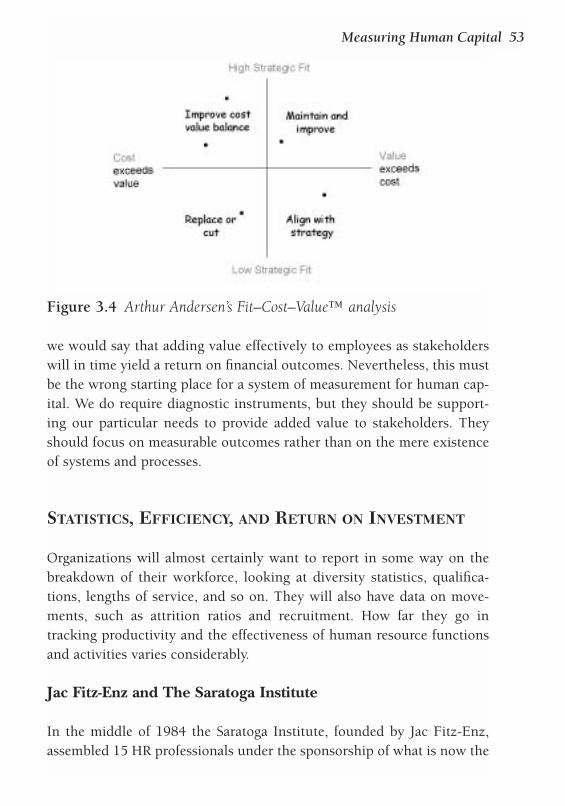
we would say that adding value effectively to employees as stakeholderswill in time yield a return on financial outcomes. Nevertheless, this mustbe the wrong starting place for a system of measurement for human cap-ital. We do require diagnostic instruments, but they should be support-ing our particular needs to provide added value to stakeholders. Theyshould focus on measurable outcomes rather than on the mere existenceof systems and processes.
STATISTICS, EFFICIENCY, AND RETURN ON INVESTMENT
Organizations will almost certainly want to report in some way on thebreakdown of their workforce, looking at diversity statistics, qualifica-tions, lengths of service, and so on. They will also have data on move-ments, such as attrition ratios and recruitment. How far they go intracking productivity and the effectiveness of human resource functionsand activities varies considerably.
Jac Fitz-Enz and The Saratoga Institute
In the middle of 1984 the Saratoga Institute, founded by Jac Fitz-Enz,assembled 15 HR professionals under the sponsorship of what is now the
Measuring Human Capital 53
Figure 3.4 Arthur Andersen’s Fit–Cost–Value™ analysis
Society for Human Resource Management, to develop a set of measuresfor the work of the HR function. It has since established itself as the lead-ing authority on comparative measures in human resource managementworldwide, with some 2,000 subscribers covering every kind of organi-zation. It collects thousands of pieces of data regularly, by sector andcompany size, and subscribers can compare themselves with similar com-panies. This is a valuable service, provided that intelligence is used ininterpretation and in knowing how the data is collected and appreciatingany consequent limitations.
In 2000 Fitz-Enz published a comprehensive summary of people-related measures under the title of The ROI of Human Capital: Measuringthe Economic Value of Employee Performance. He organizes the measureson three levels, all of which need to be integrated:
❏ The overall enterprise—the relationship between human capitaland its contribution at the level of the whole enterprise.
❏ By process or function—leading to service, quality or productivity.❏ The human capital itself—how it is managed.
The level of the enterprise The most common comparative measure in use has been revenue peremployee. FTE (full time equivalent) used to be calculated based only onemployees, full and part time. However, in acknowledgment of today’sflexible labor market, it now embraces all “contingent worker” contribu-tions (American government statistics in 1998 estimated that 14 percentof the workforce was in the “contingent” category). The term now usedby Saratoga is the human capital revenue factor.
Other ratios divided by FTEs that reflect the contribution of peo-ple include overall intellectual capital value (as calculated by subtract-ing net book value from market value), financial value added, andeconomic value added. These last two are calculated according to stan-dard accounting formulae.
We outlined above the problems of measures that have “head-count” as a denominator; one head is not the same as another in contri-bution, nor in cost. This factor therefore differs widely between types oforganization, depending on the makeup of their workforce and their geo-
54 The Human Value of the Enterprise
graphical distribution (salaries vary widely between countries). Thus, wewould much prefer to look at ratios where the denominator is the totalcost of people remuneration, or compensation as it tends to be called inthe US. One such is the human capital return on investment, which looksat the financial value added related to compensation costs. This is calcu-lated as:
Revenue – (operating expenses less compensation) / compensation
At the overall enterprise level, Fitz-Enz also outlines various ratios thatare useful for planning and costing. These are not linked to any output,and could be categorized as statistics. Examples are:
❏ Total employee costs per FTE❏ Remuneration per FTE❏ Percentage of specified types of employee❏ Employee costs : contingent worker costs❏ Training and development costs as a percentage of payroll costs❏ Training days per FTE.
Statistics of workforce movement would include attrition rate and hiringrate.
Cultural and process norms are recognized as critical aspects of theworking environment. Saratoga studied some 1,000 companies over fouryears in the 1990s and concluded that there were eight practices of excep-tional companies to be tracked and measured: balanced values, commit-ment, culture, partnering, collaboration, innovation and risk,communication, and “competitive passion.”
The level of the process or functionFitz-Enz is here concerned with the human contribution to outputs suchas service, quality, or productivity. He lists performance metrics for eachtypical organizational function, which enable change and improvementto be managed. In the terms we are using, this level is about the humancontribution to increasing structural capital.
Measuring Human Capital 55

The level of the human capital itselfThe focus here is not on measuring the value of human capital, as inChapter 4 of this book, but on the effectiveness of six human resourcemanagement functions. These are planning, acquiring, maintaining,developing, retaining, and evaluating. According to Fitz-Enz, the middlefour of these activities should be measured against the following:
❏ Costs—per unit of activity❏ Time—elapsed per activity❏ Quantity—numbers handled❏ Error rates—percentage of “right first time”❏ Reaction—levels of satisfaction.
These are mostly about the effectiveness and performance of HR profes-sionals, and as such provide a useful framework.
ROI: Return on investment
Whereas Arthur Andersen’s model described above recognizes that valueis in the eye of the beholder, i.e., in their approach to employees, othersput their focus on evaluating the financial return against the costs of aparticular activity. Paul Kearns of Personnel Works in the UK is an ardentadvocate of this concept, and has many fellow thinkers in the US. Kearnsfounded the Profitable Human Investment and Resource ManagementNetwork in 1991, which researches and promotes the link between everyindividual and financial organizational goals. His methodology is calledHuman Contribution Management, and he claims that its distinction isthat it starts at the bottom line and works backwards. His exclusive focuson the financial bottom line, however, misses the value given to otherstakeholders.
Various formulae have been put forward to measure return oninvestment. One such is from the Corporate Leadership Council in theUS, as follows:
❏ Calculate all the costs of the intervention, including the time ofspecialists and participants
56 The Human Value of the Enterprise
❏ Multiply the number of employees participating by:—the percentage of the job related to performance changes —the performance change (in standard deviations) —the value of one standard deviation in performance —the duration of performance gain in years
❏ Subtract the costs❏ Divide the result by the costs to give return on investment.
Some of the factors here will be very difficult and time consuming toquantify. They also assume that financial benefit is the only goal, and thatthe resulting changes can be isolated to one cause, the intervention itself.
If we adopt the approach that value given to a stakeholder is a validoutcome in itself, we will not look immediately for purely financial mea-sures from training and HR programs, even though we expect an eventualfinancial return in the long term. So, a program may be about better com-munications, or cultural change, or improved benefits to employees,where the financial benefit may be some way ahead. Too many other fac-tors are likely to dilute any attempt at a direct link. In this area we needto distinguish between validation—did the intervention meet its objec-tives?—and evaluation—did it actually influence a key business mea-sure? Often the first is difficult enough, especially if the objectives of theinitiative are vague or unquantified.
Investment in personal development has a long-term return; gradu-ate trainee programs and apprenticeships, for example. Computer com-pany ICL (now part of Fujitsu) had a Eurograduate training program,hiring graduates from various European countries and training themtogether. Much of the 10 months’ training took the form of work assign-ments, but these were essentially a vehicle for learning. The cost was about£30,000 per person. The return from this investment started after the firstyear but the long-term benefit—the creation of a group of cross-nationalfriends who would use their network and cross-cultural experiences inleadership roles—was 10 years ahead. Sadly, 10 years on, only 15 percentof the graduates remained in the company. Many factors had led to thissignificant loss of human capital, but nobody was tracking the assets.
When we move outside of the simple arithmetic of a financialreturn, we are faced with the question of an acceptable level of added
Measuring Human Capital 57
value. We do know the costs of the activities; we have to ask whether theoutcome is justified by the cost. For example, for a program aimed atimproving relationships with the community as a stakeholder, how muchis a reasonable cost input for a measured change in image? One way toevaluate this is the cost of not doing the program or taking an initiative.Not investing in some environmental issues could have devastatingfuture effects on image, cleanup costs, and lawsuits. Likewise, not pro-viding opportunities for people to explore their career development couldlead to frustration about personal development and consequentunwanted attrition.
INTEGRATING PEOPLE-RELATED MEASURES IN APERFORMANCE MANAGEMENT FRAMEWORK
The Saratoga approach and others like it are closely linked to accoun-tancy thinking, analyzing numbers and history. A better way is to startwith the organization’s goals, because all stakeholders contribute to valuecreation, and, without looking after them all, the ultimate goal of finan-cial wealth will not be achieved. There are two main approaches in use,those based on a balanced set of measures that reflect the different stake-holders (scorecards), and those derived from the starting point of theorganization’s intellectual capital. The former looks for a relatively smallnumber of key measures that are essential inputs to the strategic goals.The latter starts from human capital as a major component of intellectualcapital, and asks how this can be effectively tracked and managed. It mayyield a larger number of measures, but is much more closely aligned toour Human Capital Monitor.
The Balanced Scorecard
In 1992 Robert Kaplan, a Professor at Harvard, and David Norton, a con-sultancy CEO, wrote an article in the Harvard Business Review called“The Balanced Scorecard: Measures that Drive Performance.” This wasbuilt on a research study exploring whether running companies on thebasis of financial measures alone was becoming increasingly obsolete.
58 The Human Value of the Enterprise
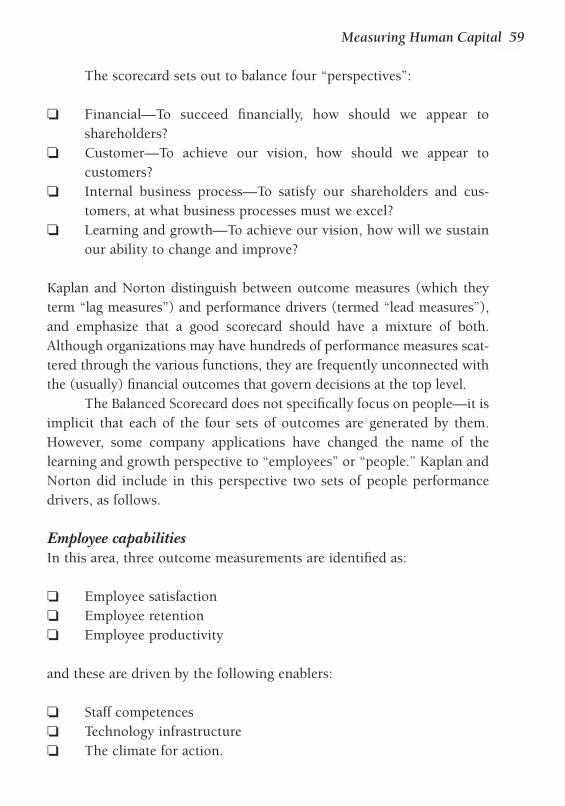
The scorecard sets out to balance four “perspectives”:
❏ Financial—To succeed financially, how should we appear toshareholders?
❏ Customer—To achieve our vision, how should we appear tocustomers?
❏ Internal business process—To satisfy our shareholders and cus-tomers, at what business processes must we excel?
❏ Learning and growth—To achieve our vision, how will we sustainour ability to change and improve?
Kaplan and Norton distinguish between outcome measures (which theyterm “lag measures”) and performance drivers (termed “lead measures”),and emphasize that a good scorecard should have a mixture of both.Although organizations may have hundreds of performance measures scat-tered through the various functions, they are frequently unconnected withthe (usually) financial outcomes that govern decisions at the top level.
The Balanced Scorecard does not specifically focus on people—it isimplicit that each of the four sets of outcomes are generated by them.However, some company applications have changed the name of thelearning and growth perspective to “employees” or “people.” Kaplan andNorton did include in this perspective two sets of people performancedrivers, as follows.
Employee capabilitiesIn this area, three outcome measurements are identified as:
❏ Employee satisfaction❏ Employee retention❏ Employee productivity
and these are driven by the following enablers:
❏ Staff competences❏ Technology infrastructure❏ The climate for action.
Measuring Human Capital 59
Motivation, empowerment, and alignmentThe outcome measures described here are:
❏ Measures of suggestions made and implemented❏ Measures of improvement (in processes)❏ Measures of organizational and individual alignment (this refers to
individual and team goals being consistent with and supportive ofthe overall business goals).
In their book describing the concept and some applications, Kaplan andNorton say: “We can supply many fewer examples of company-specificmeasures for this perspective compared to the financial, customer andinternal process perspectives.” They comment rightly that this reflects afailing of companies to understand that all their strategies and goals arein the end dependent on people.
Mooraj and Oyon, at the University of Lausanne, combined withHostettler of Tetra Pak to analyze the use of the balanced business score-card in an article “The balanced scorecard: A necessary good or an unnec-essary evil?” (1999). They were unreservedly positive, but made someinteresting observations: For example, that national and organizationalcultures have a big influence on both what is chosen and how effectivelyit is implemented. The approach sits comfortably with well-controlled,process-centered organizations. Many have found that, despite their com-pleting scorecards, the emphasis continues to be essentially financialunless the balance is reflected in managerial incentive plans.
The Skandia Navigator
Leif Edvinsson, for many years director of intellectual capital at Swedishfinancial services company Skandia, adapted the balanced scorecard toform the “Skandia Navigator.” He placed “people” in the center as the dri-ver of all four outcomes and thus had five sets of measures. In his pas-sionate and highly readable book Intellectual Capital, he lists 32measures for “Renewal and Development” and 23 for the “HumanFocus”. Figure 3.5 shows the concept and a few of the measures used ineach category.
60 The Human Value of the Enterprise
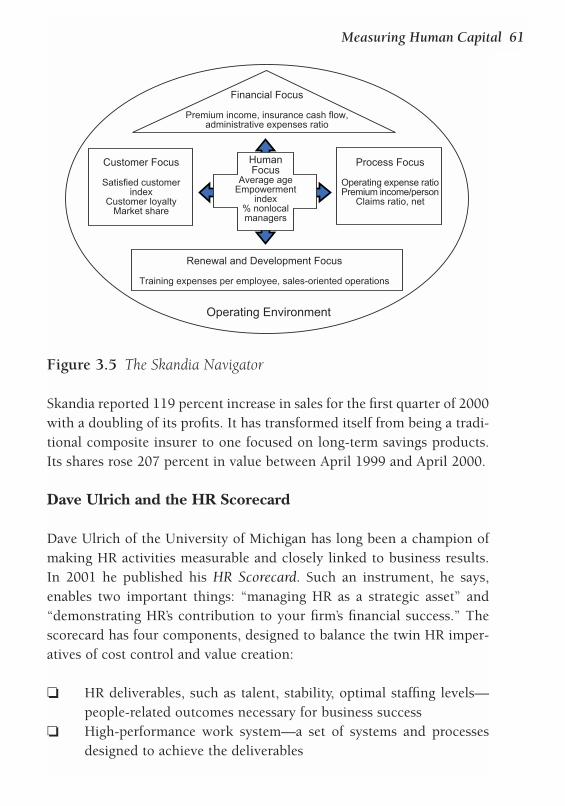
Skandia reported 119 percent increase in sales for the first quarter of 2000with a doubling of its profits. It has transformed itself from being a tradi-tional composite insurer to one focused on long-term savings products.Its shares rose 207 percent in value between April 1999 and April 2000.
Dave Ulrich and the HR Scorecard
Dave Ulrich of the University of Michigan has long been a champion ofmaking HR activities measurable and closely linked to business results.In 2001 he published his HR Scorecard. Such an instrument, he says,enables two important things: “managing HR as a strategic asset” and“demonstrating HR’s contribution to your firm’s financial success.” Thescorecard has four components, designed to balance the twin HR imper-atives of cost control and value creation:
❏ HR deliverables, such as talent, stability, optimal staffing levels—people-related outcomes necessary for business success
❏ High-performance work system—a set of systems and processesdesigned to achieve the deliverables
Measuring Human Capital 61
Customer Focus
Satisfied customerindex
Customer loyaltyMarket share
Process Focus
Operating expense ratioPremium income/person
Claims ratio, net
Financial Focus
Premium income, insurance cash flow,administrative expenses ratio
Renewal and Development Focus
Training expenses per employee, sales-oriented operations
Operating Environment
HumanFocus
Average ageEmpowerment
index% nonlocalmanagers
Figure 3.5 The Skandia Navigator
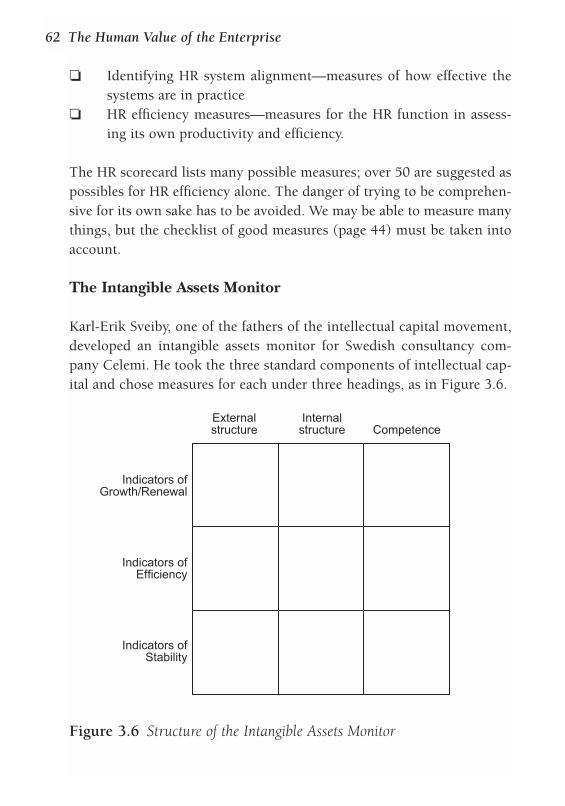
❏ Identifying HR system alignment—measures of how effective thesystems are in practice
❏ HR efficiency measures—measures for the HR function in assess-ing its own productivity and efficiency.
The HR scorecard lists many possible measures; over 50 are suggested aspossibles for HR efficiency alone. The danger of trying to be comprehen-sive for its own sake has to be avoided. We may be able to measure manythings, but the checklist of good measures (page 44) must be taken intoaccount.
The Intangible Assets Monitor
Karl-Erik Sveiby, one of the fathers of the intellectual capital movement,developed an intangible assets monitor for Swedish consultancy com-pany Celemi. He took the three standard components of intellectual cap-ital and chose measures for each under three headings, as in Figure 3.6.
62 The Human Value of the Enterprise
Externalstructure
Internalstructure Competence
Indicators ofGrowth/Renewal
Indicators ofEfficiency
Indicators ofStability
Figure 3.6 Structure of the Intangible Assets Monitor
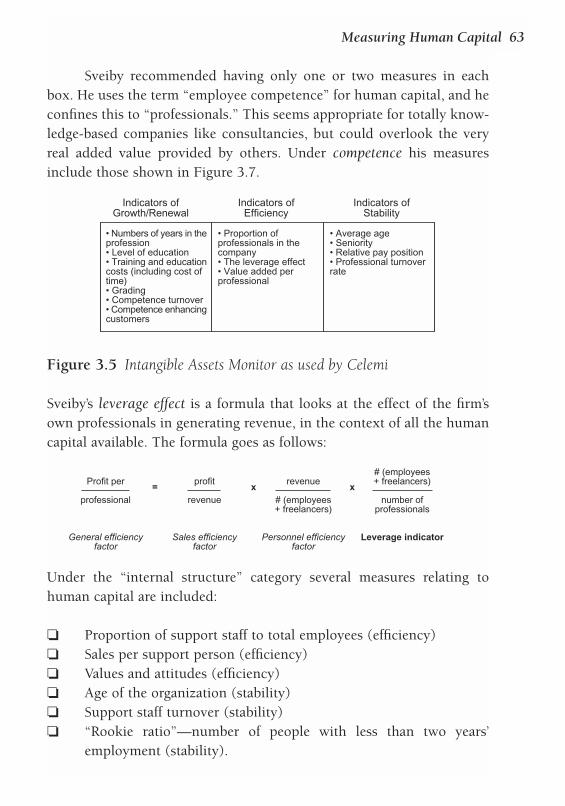
Sveiby recommended having only one or two measures in eachbox. He uses the term “employee competence” for human capital, and heconfines this to “professionals.” This seems appropriate for totally know-ledge-based companies like consultancies, but could overlook the veryreal added value provided by others. Under competence his measuresinclude those shown in Figure 3.7.
Sveiby’s leverage effect is a formula that looks at the effect of the firm’sown professionals in generating revenue, in the context of all the humancapital available. The formula goes as follows:
Under the “internal structure” category several measures relating tohuman capital are included:
❏ Proportion of support staff to total employees (efficiency)❏ Sales per support person (efficiency)❏ Values and attitudes (efficiency)❏ Age of the organization (stability)❏ Support staff turnover (stability)❏ “Rookie ratio”—number of people with less than two years’
employment (stability).
Measuring Human Capital 63
Indicators ofGrowth/Renewal
Indicators ofEfficiency
Indicators ofStability
• Numbers of years in theprofession• Level of education• Training and educationcosts (including cost oftime)• Grading• Competence turnover• Competence enhancingcustomers
• Proportion ofprofessionals in thecompany• The leverage effect• Value added perprofessional
• Average age• Seniority• Relative pay position• Professional turnoverrate
Figure 3.5 Intangible Assets Monitor as used by Celemi
Profit per
professional
General efficiencyfactor
profit
revenue
Sales efficiencyfactor
revenue
# (employees+ freelancers)
Personnel efficiencyfactor
# (employees+ freelancers)
number ofprofessionals
Leverage indicator
= x x
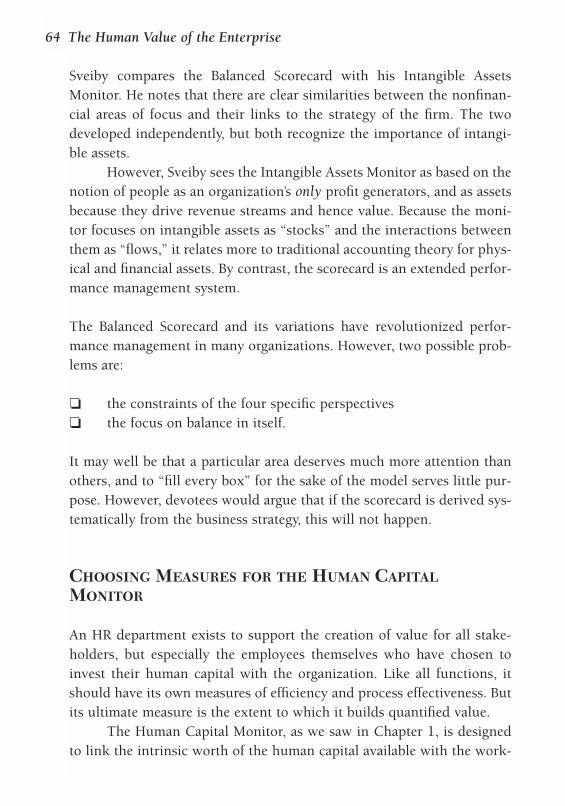
Sveiby compares the Balanced Scorecard with his Intangible AssetsMonitor. He notes that there are clear similarities between the nonfinan-cial areas of focus and their links to the strategy of the firm. The twodeveloped independently, but both recognize the importance of intangi-ble assets.
However, Sveiby sees the Intangible Assets Monitor as based on thenotion of people as an organization’s only profit generators, and as assetsbecause they drive revenue streams and hence value. Because the moni-tor focuses on intangible assets as “stocks” and the interactions betweenthem as “flows,” it relates more to traditional accounting theory for phys-ical and financial assets. By contrast, the scorecard is an extended perfor-mance management system.
The Balanced Scorecard and its variations have revolutionized perfor-mance management in many organizations. However, two possible prob-lems are:
❏ the constraints of the four specific perspectives❏ the focus on balance in itself.
It may well be that a particular area deserves much more attention thanothers, and to “fill every box” for the sake of the model serves little pur-pose. However, devotees would argue that if the scorecard is derived sys-tematically from the business strategy, this will not happen.
CHOOSING MEASURES FOR THE HUMAN CAPITALMONITOR
An HR department exists to support the creation of value for all stake-holders, but especially the employees themselves who have chosen toinvest their human capital with the organization. Like all functions, itshould have its own measures of efficiency and process effectiveness. Butits ultimate measure is the extent to which it builds quantified value.
The Human Capital Monitor, as we saw in Chapter 1, is designedto link the intrinsic worth of the human capital available with the work-
64 The Human Value of the Enterprise
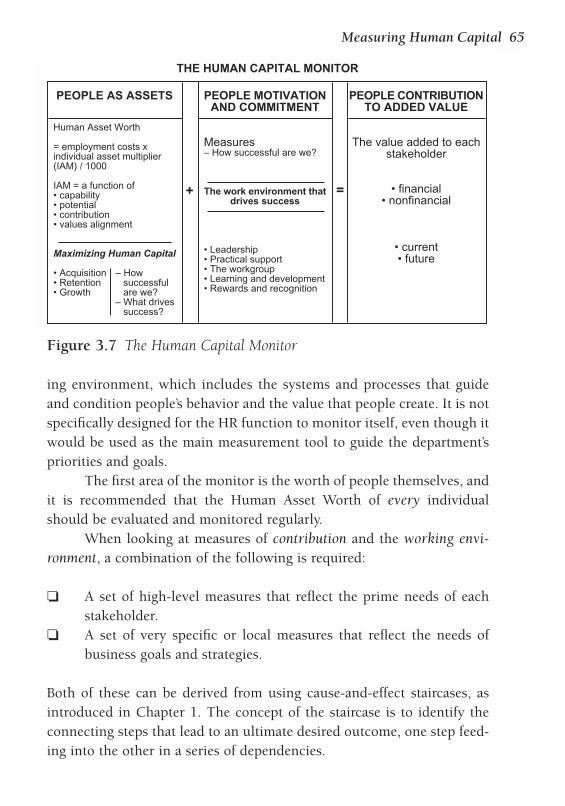
ing environment, which includes the systems and processes that guideand condition people’s behavior and the value that people create. It is notspecifically designed for the HR function to monitor itself, even though itwould be used as the main measurement tool to guide the department’spriorities and goals.
The first area of the monitor is the worth of people themselves, andit is recommended that the Human Asset Worth of every individualshould be evaluated and monitored regularly.
When looking at measures of contribution and the working envi-ronment, a combination of the following is required:
❏ A set of high-level measures that reflect the prime needs of eachstakeholder.
❏ A set of very specific or local measures that reflect the needs ofbusiness goals and strategies.
Both of these can be derived from using cause-and-effect staircases, asintroduced in Chapter 1. The concept of the staircase is to identify theconnecting steps that lead to an ultimate desired outcome, one step feed-ing into the other in a series of dependencies.
Measuring Human Capital 65
PEOPLE AS ASSETS
Human Asset Worth
= employment costs xindividual asset multiplier(IAM) / 1000
IAM = a function of• capability• potential• contribution• values alignment
Maximizing Human Capital
• Acquisition – How• Retention successful• Growth are we?
– What drivessuccess?
PEOPLE MOTIVATIONAND COMMITMENT
Measures– How successful are we?
The work environment thatdrives success
• Leadership• Practical support• The workgroup• Learning and development• Rewards and recognition
PEOPLE CONTRIBUTIONTO ADDED VALUE
The value added to eachstakeholder
• financial• nonfinancial
• current• future
THE HUMAN CAPITAL MONITOR
+ =
Figure 3.7 The Human Capital Monitor
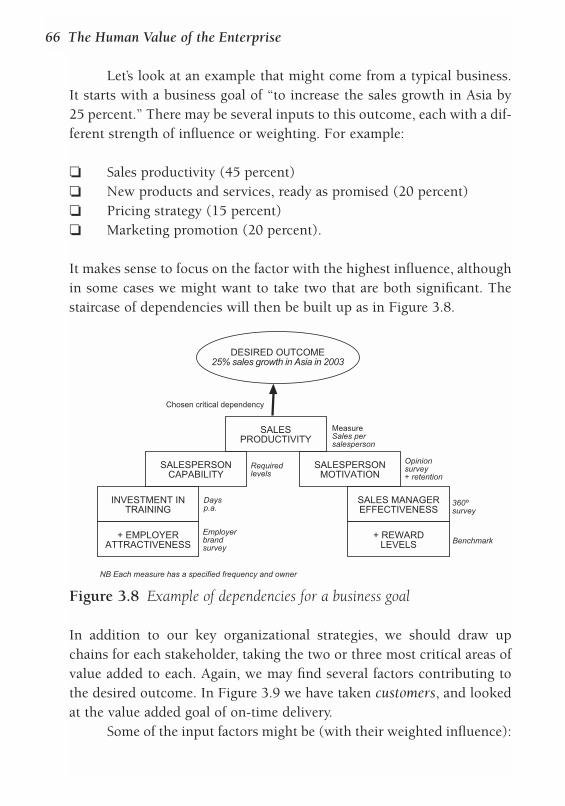
Let’s look at an example that might come from a typical business.It starts with a business goal of “to increase the sales growth in Asia by25 percent.” There may be several inputs to this outcome, each with a dif-ferent strength of influence or weighting. For example:
❏ Sales productivity (45 percent)❏ New products and services, ready as promised (20 percent)❏ Pricing strategy (15 percent)❏ Marketing promotion (20 percent).
It makes sense to focus on the factor with the highest influence, althoughin some cases we might want to take two that are both significant. Thestaircase of dependencies will then be built up as in Figure 3.8.
In addition to our key organizational strategies, we should draw upchains for each stakeholder, taking the two or three most critical areas ofvalue added to each. Again, we may find several factors contributing tothe desired outcome. In Figure 3.9 we have taken customers, and lookedat the value added goal of on-time delivery.
Some of the input factors might be (with their weighted influence):
66 The Human Value of the Enterprise
SALESPRODUCTIVITY
DESIRED OUTCOME25% sales growth in Asia in 2003
SALESPERSONCAPABILITY
SALESPERSONMOTIVATION
INVESTMENT INTRAINING
+ EMPLOYERATTRACTIVENESS
SALES MANAGEREFFECTIVENESS
+ REWARDLEVELS
Chosen critical dependency
MeasureSales persalesperson
Requiredlevels
Daysp.a.
Employerbrandsurvey
Opinionsurvey+ retention
360ºsurvey
Benchmark
NB Each measure has a specified frequency and owner
Figure 3.8 Example of dependencies for a business goal
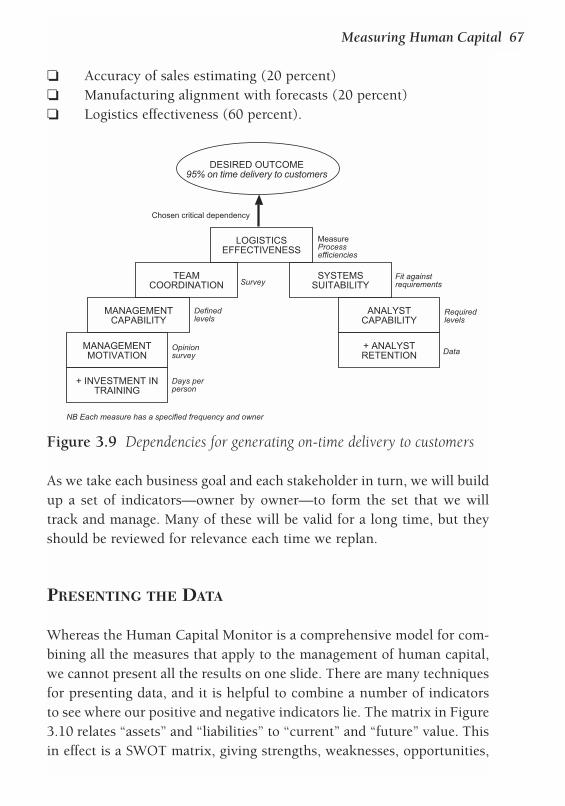
❏ Accuracy of sales estimating (20 percent)❏ Manufacturing alignment with forecasts (20 percent)❏ Logistics effectiveness (60 percent).
As we take each business goal and each stakeholder in turn, we will buildup a set of indicators—owner by owner—to form the set that we willtrack and manage. Many of these will be valid for a long time, but theyshould be reviewed for relevance each time we replan.
PRESENTING THE DATA
Whereas the Human Capital Monitor is a comprehensive model for com-bining all the measures that apply to the management of human capital,we cannot present all the results on one slide. There are many techniquesfor presenting data, and it is helpful to combine a number of indicatorsto see where our positive and negative indicators lie. The matrix in Figure3.10 relates “assets” and “liabilities” to “current” and “future” value. Thisin effect is a SWOT matrix, giving strengths, weaknesses, opportunities,
Measuring Human Capital 67
LOGISTICSEFFECTIVENESS
DESIRED OUTCOME95% on time delivery to customers
TEAMCOORDINATION
SYSTEMSSUITABILITY
MANAGEMENTCAPABILITY
MANAGEMENTMOTIVATION
ANALYSTCAPABILITY
+ ANALYSTRETENTION
Chosen critical dependency
MeasureProcessefficiencies
Survey
Definedlevels
Opinionsurvey
Fit againstrequirements
Requiredlevels
Data
NB Each measure has a specified frequency and owner
+ INVESTMENT INTRAINING
Days perperson
Figure 3.9 Dependencies for generating on-time delivery to customers
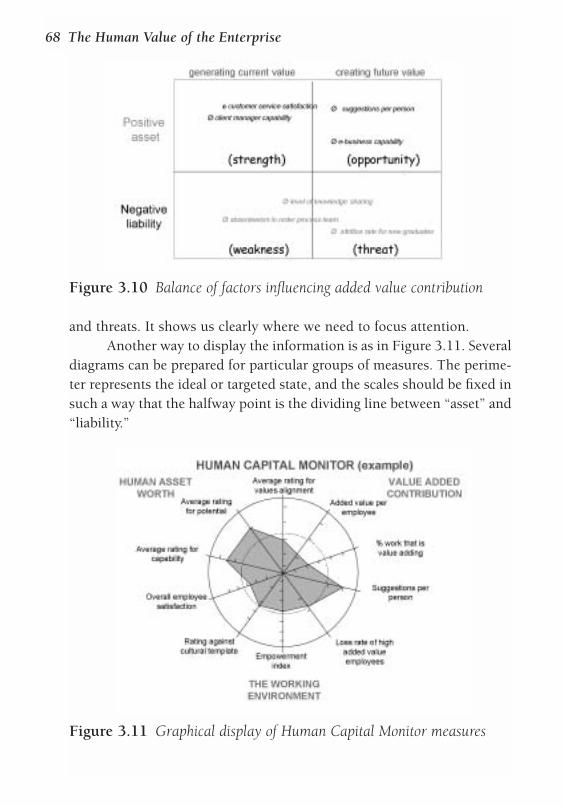
and threats. It shows us clearly where we need to focus attention.Another way to display the information is as in Figure 3.11. Several
diagrams can be prepared for particular groups of measures. The perime-ter represents the ideal or targeted state, and the scales should be fixed insuch a way that the halfway point is the dividing line between “asset” and“liability.”
68 The Human Value of the Enterprise
Figure 3.10 Balance of factors influencing added value contribution
Figure 3.11 Graphical display of Human Capital Monitor measures
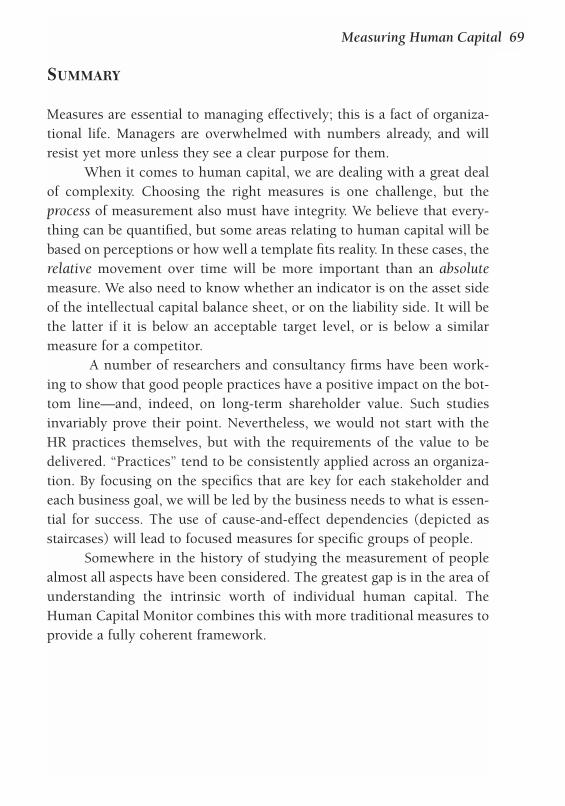
SUMMARY
Measures are essential to managing effectively; this is a fact of organiza-tional life. Managers are overwhelmed with numbers already, and willresist yet more unless they see a clear purpose for them.
When it comes to human capital, we are dealing with a great dealof complexity. Choosing the right measures is one challenge, but theprocess of measurement also must have integrity. We believe that every-thing can be quantified, but some areas relating to human capital will bebased on perceptions or how well a template fits reality. In these cases, therelative movement over time will be more important than an absolutemeasure. We also need to know whether an indicator is on the asset sideof the intellectual capital balance sheet, or on the liability side. It will bethe latter if it is below an acceptable target level, or is below a similarmeasure for a competitor.
A number of researchers and consultancy firms have been work-ing to show that good people practices have a positive impact on the bot-tom line—and, indeed, on long-term shareholder value. Such studiesinvariably prove their point. Nevertheless, we would not start with theHR practices themselves, but with the requirements of the value to bedelivered. “Practices” tend to be consistently applied across an organiza-tion. By focusing on the specifics that are key for each stakeholder andeach business goal, we will be led by the business needs to what is essen-tial for success. The use of cause-and-effect dependencies (depicted asstaircases) will lead to focused measures for specific groups of people.
Somewhere in the history of studying the measurement of peoplealmost all aspects have been considered. The greatest gap is in the area ofunderstanding the intrinsic worth of individual human capital. TheHuman Capital Monitor combines this with more traditional measures toprovide a fully coherent framework.
Measuring Human Capital 69
CHALLENGES FOR ACTION
❏ How many of the stumbling blocks to measurement can you identify in your
own organization?
❏ What people-related measures are currently in use in your organization and
where? How many fit the characteristics of a good measure? How many are
useful in leading to action?
❏ Is there any attempt to have a more balanced approach to strategic perfor-
mance management in your organization? If so, what measures are in use on
the people side and how seriously are they taken?
❏ Are there important areas of human capital management that have no quan-
tified measures in your organization?
❏ When you look at the added value that stakeholders demand, which areas
have credible measures that are in use in the organization?
❏ If you draw out the cause-and-effect dependencies on key strategies, how
many steps have or do not have related measures in your organization?
70 The Human Value of the Enterprise
4The Worth of People asAssets
THE HUMAN CAPITAL MONITOR STARTS WITH THE INTRINSIC WORTH OF
people, since this is the “raw material” of the human contribu-tion. There have been several attempts over the last 30 years tovalue people, going generally under the heading of human asset
(or human resource) accounting. However, none of the methods proposedhas become widely adopted. One has to conclude that attempts to usefinancial valuation methods in respect of people have too many pitfalls.
In this chapter a way of calculating the relative worth of people isproposed based on a combination of their costs (this being some indica-tor of their market value) and an “individual asset multiplier,” looking atfour aspects of personal human capital that bring value to an organiza-tion. Very few organizations at the time of writing have a systematic, inte-grated way of balancing the costs of theirpeople with a measure of the value they areable to contribute, and this is the goal of thischapter.
Why should we bother to find a way todescribe the asset value for people, individu-ally and collectively, given the difficulties attached to such so-calledassets? After all, many organizations have delivered increasing value overthe decades without solving this dilemma—is it a real problem?
Years of growth and progress may yet hide a multitude of poor deci-sions that have subtracted potential value from stakeholders, including
RESOURCING DECISIONS SHOULD BE
MORE ABOUT VALUE THAN ABOUT
COST.
the owners and shareholders. Precious assets and knowledge may havebeen lost through restructuring. To manage effectively for value creationwe need to:
❏ Be able to counter the one-sidedness of “people are costs” with“they also have worth as assets and they add value.” It will alwaysbe necessary to adjust manpower levels, but resourcing decisionsshould be more about value than about cost
❏ Understand the relative value of individuals and teams, and makechoices regarding who we must retain if at all possible. It is not justperformance over one year that should shape our judgment; thereis much more to our human capital than that
❏ Make informed and intelligent investment decisions, and under-stand the relative benefits of investing in people compared to otherassets
❏ Most of all, “keep stock” of talent and expertise in a much moremeaningful way than counting heads, and know whether thehuman capital available to us is increasing or decreasing. The man-agement of talent has rightly become one of the great priorities inthis era of managing intellectual capital.
Very few organizations can say that they know how to balance theexpense of people with their respective value. They may have lists of peo-ple with potential, perhaps also of key players who make a special con-tribution. Most are conscious of their significant talent and where itresides. What is lacking is a systematic, rigorous approach to under-standing the value of people.
CALCULATING THE ASSET WORTH OF PEOPLE
The problem of finding a satisfactory method of accounting for peoplehas never been solved in a way that has led to its widespread use. In thecontext of society, the law places a value on lost lives and limbs, and thisvaries according to earning power and benefit to the family. Soccer clubsvalue players through transfer fees (for example, Real Madrid bought
72 The Human Value of the Enterprise
Zinedine Zidane in July 2001 for a record £46 million), and increasinglyfirms pay “golden hellos” to secure individuals they really want. Theamounts indicate that they are valued assets, but they are not calculatedin any formal way, being the result of negotiation.
Analysts and investors are conscious of the value of businesspeoplewho have a public profile. Readers of daily stock market reports will fre-quently see a price rise or fall if a key player joins or departs—not quitethe same as football transfer fees, but the principle is the same. WhenRobert Ayling left British Airways in 2000, the company’s share pricewent up; fairly or unfairly, the perception was that he had become bad forthe airline despite his tough stance on cost cutting. More commonly wesee the opposite. A typical headline found in the Financial Times read“MOL shares plummet after chief resigns.” Hungary’s biggest company, inoil and gas, lost its chief executive after a dispute with the government.The shares fell by 10 percent and had to be suspended.
Human resource accounting
The father of this niche of study is Professor Eric Flamholz, Professor ofManagement at the Anderson Graduate School of Management at theUniversity of California. He has worked for 25 years in the field and pub-lished many articles, as well as the definitive work, Human ResourceAccounting. Flamholz’s methods and formulae have not been taken upwidely in practice. This may be for the following reasons:
❏ There has been very little pressure, either from accountants or fromelsewhere (including statutory bodies), to look at people in anyway other than as costs
❏ HR people generally prefer to work with “softer” issues❏ Applying many of his concepts introduces a level of complication
beyond the patience of many practitioners❏ The method relies on predictions and probabilities about the future
that are increasingly difficult to make.
The Worth of People as Assets 73

Interest in human resource accounting blossomed in the early 1970s,when several committees were set up by accounting bodies on the sub-ject. However, it has waned since then, and was overtaken in the 1990sby some of the other approaches outlined in Chapter 3.
The economic concept of value has two dimensions, usefulness (orutility—value to the owner) and exchange (value to another owner).Flamholz suggests that there are three criteria for defining any asset:
❏ It possesses future service potential❏ It is measurable in monetary terms❏ It is subject to the ownership and control of the firm, or it is rented
or leased.
When it comes to valuing assets, there are three traditional ways:
❏ Cost based—this method typically looks at acquisition or replace-ment cost
❏ Market based—the price to be paid in an open market❏ Income based—the cash streams to be expected into the organiza-
tion related to the contribution of the human asset, calculated asthe present value of the expected net cash flows.
Cost basedThere are variations of this approach. One method looks at all the costsof acquiring a human asset—recruiting, selecting, hiring, training—andamortizes the total over the expected future service of the person. Thefull replacement cost includes the actual costs of replacement itself,which can be substantial, plus the loss of contribution while a new per-son is being retrained up to the same level. A host of problems arise withthis: It denies the impact of personal experience and development, andimplies that value and contribution will be directly related to recruitmentcost alone.
Another very simple way is to take an individual’s gross remunera-tion. This includes salary and related benefits, and should also includetaxes on employers such as social security, which vary considerably fromcountry to country. Variable bonuses based on performance should not be
74 The Human Value of the Enterprise
included as they do not reflect the basic value of the individual. The onlyexception to this might be positions where the mix of fixed and variablepay is designed to provide a certain figure for on-target earnings, in whichcase we would use this instead of salary. This method is really equatingvalue with cost, and does not add much in relation to our purpose.
A variation proposed by Lev and Schwartz (1971) is to use dis-counted future remuneration levels. This is more of a traditional assetvaluation approach, and has all the problems of predicting future earn-ings and choosing a discount rate, as well as assumptions about thelength of careers. Also, being cost based, it makes the assumption thatcost and value are closely related. In its intellectual capital report for1998, Skandia calculated this and called it the “human capital basevalue,” using five years and 20 percent discount. It rose from SEK9 bil-lion in 1995 through 10.6 billion in 1996 to 12.7 in 1998. Lev’s method-ology has not generally been taken up by US companies, but has beenadopted by several Indian companies, such as Infosys. Its annual reportfor 1997 showed its 1,700 employees broken down into production, tech-nical support, and others, and calculates the human asset value for eachgroup. The value of the total human resources in 1997 is quoted asR278.56 lakhs against costs of R51.63 lakhs and added value of R99.41lakhs. The ratios are interesting, the value calculation being more thanfive times costs.
Market basedEvery employee has a figure in their mind of their own market value,which often represents a bigger job than they currently hold, believingthat they could successfully apply for such. Although remuneration spe-cialists try to assess market rates for a particular role, a job-basedapproach does not take account of the variable value of individuals. Itdoes provide a broad guide to what one might have to pay for a rolethrough recruitment. Another way to look at this is the cost of buying thecapability and experience through interim management or consultancy.However, such costs vary with the supplying organization, depending onits reputation and overheads. The rates are always higher than would bepaid for a fully contracted employee, because the flexibility of the vari-able resource has a value in itself.
The Worth of People as Assets 75
Market value would be a good base to take for our purpose. Inpractice, however, it is a difficult and time-consuming exercise to assessthis with any realism for every individual.
Income basedInstead of seeing value as closely tied to costs, this method looks at themoney that a person might bring into the organization. This is the clos-est to accepted valuation techniques. Unfortunately, it is particularly dif-ficult to apply to most employees, except in certain roles; consultants orsalespeople, for example. In a consultancy, one might choose to take thediscounted expected revenue streams for, say, five years ahead as the baseof an individual’s asset value.
A time has to be chosen for the expected future life of the personand this will significantly affect any numeric answer, because, needless tosay, it is difficult to predict. Many of the models in the literature assumea relatively steady state of employment, which has been largely replaced.
The method takes no account of value added other than financial.
Flamholz’s approachFlamholz asserts that the aim of human resource management is to opti-mize human resource value. He defines the measure of individual valueas resulting from two interacting variables: a person’s conditional valueand the probability that they will stay with the organization. An individ-ual’s conditional value is the present worth of the potential services thatcould be rendered if they stay with the organization for x years. The con-ditional value is a combination of productivity (performance), transfer-ability (flexible skills), and promotability. The latter two are heavilyinfluenced by the first element. This is then multiplied by a probabilityfactor that the individual will stay for the x years. This gives the expectedrealizable value, which is a measure of the person’s worth.
Flamholz extends the principle to evaluating the effectiveness ofdevelopment programs. If a program produces a measured change in pro-ductivity, transferability, or promotability, this translates into an increasein the value of the individuals concerned.
There are a number of difficulties with this approach, not least ofwhich is the estimation of potential future services. It also leads to lower
76 The Human Value of the Enterprise
values for older and more experienced people who have less time to ren-der future services. There is a case for looking at them this way if we con-sider value over a future lifetime, but it fails to take account of the wealthof value in past experience.
WalgemoedWalgemoed is a management consultancy in the Netherlands. In 1999 itwas commissioned along with three other major consultancies by theDutch Ministry of Economic Affairs to examine “Balancing Accountswith Knowledge.” Each consultancy analyzed a small number of compa-nies and reported on how it believed intangible assets should be evalu-ated. The initiative was prompted by a previous 1996 study showing thatover 50 percent of national investment in the country was intangible. Ofthe four companies, only Walgemoed made a concerted attempt to lookat the valuation of human resources.
It first analyzed the costs of recruitment, replacement, training, andso on and proposed allocating them to individual balance sheets. Itacknowledged that these “input costs” say little about the ability of peo-ple to generate value for the company, and suggested that the input costsshould be compared with the income generated by the individual as apersonal “profit and loss account,” although this is clearly not possiblefor every person.
After discussing the difficulties of individual financial evaluation,Walgemoed finally suggested a points system based on the importance ofthe role performed, qualifications, experience, and age.
Giles and RobinsonGiles and Robinson (1972) also came to the conclusion that a points sys-tem was needed. They developed a factor called the Human AssetMultiplier, which is applied to gross remuneration. An average multiplieris derived from a financial formula based on the market value of theorganization. This is then weighted for different categories of employees,by assessing their personal value using a weighting that reflects qualifica-tions/expertise, experience, attitudes, promotion capability, loyalty,replacement scarcity, and an estimate of expected future service.
The Worth of People as Assets 77
We can conclude that, whereas it would be neat if we could have a real-istic, generally accepted, absolute financial formula, this is unlikely to beachieved. There are very real problems in following definitions and meth-ods that fit the principles of economics in valuation. Furthermore, thevariables to be considered are very complex, and the uncertainty of futurepredictions immense. We should end up with formulae so complicatedthat they would be unusable—and to some extent this is what has hap-pened to human resource accounting as a discipline. It has rested largelywith the academics.
Our conclusions are allied to those of Walgemoed andGiles/Robinson; that is, that there are characteristics of people that enablevalue to be delivered to stakeholders. What we need is to identify thosecharacteristics, and then find ways of measuring and tracking them. Wewant at least to start the search for a relative asset value, even if anabsolute financial value is beyond us.
HUMAN ASSET WORTH: A PRACTICAL FORMULA
What is it that makes one person more valuable than another? Theanswer is very organization specific. For some, it is finding people whowill fit in well and make good team members. For others, the ability toget certain kinds of results is all that matters. So any approach has to havesome flexibility to meet different situations.
The formula suggested in the Human Capital Monitor for calculat-ing Human Asset Worth is as follows:
HAW = EC × IAM / 1,000(Human Asset Worth = Employment Cost × Individual Asset Multiplier / 1,000)
We divide by 1,000 so that the end result will not look like a monetaryamount that can be directly compared with cost, as this would be mis-leading. The purpose is to be able to understand relativities and providea guide to taking appropriate actions.
Although one might naturally start with a person’s market value,as we saw above this is hard to ascertain and is not going to be readily at
78 The Human Value of the Enterprise
hand. What we do know is people’s remuneration and we keep close trackof this. It may well reflect accidents of history (either positive or nega-tive) and be under- or over-rated in respect of the market, but it providesthe best starting point.
EC—Employment Cost
This is the cost of employing a person, including taxes such as socialsecurity or national insurance, and the value of the benefits package. Itshould exclude bonuses unless they are in whole or part guaranteed. Italso does not include the overheads of providing space and equipment, asthese are so variable and are likely to be averaged out on a per personbasis.
Employment Cost =Base salary + value of benefits + employer taxes
IAM—Individual Asset Multiplier
Every person is an individual, not just another “head.” They bring a dif-ferent level of present and potential value to their current role and to theorganization. The Individual Asset Multiplier is designed to reflect this.
Some people we are happy to lose. There is a replacement cost, butno real asset loss. What factors make the difference? There are four thatpredominate and determine the worth of an individual to us, as follows:
Individual Asset MultiplierWeighted Average assessment of:
Capability—the cumulative skills, knowledge, experience, and usefulnetworks
Potential—to grow and contribute at a higher levelContribution—to stakeholder valueAlignment—to organizational values
Capability and potential are discussed in more detail in Chapter 5. To cal-culate the IAM, each of these factors is assessed on a scale of 0.1 to 2.0.
The Worth of People as Assets 79
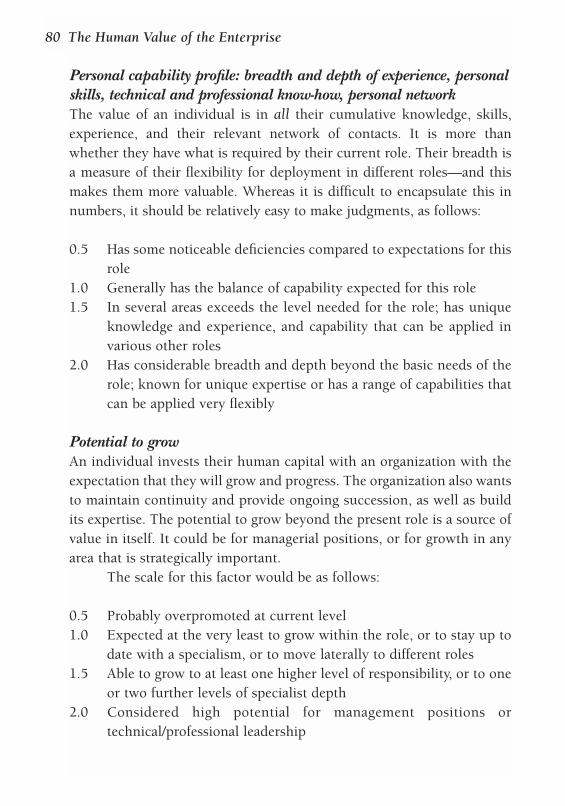
Personal capability profile: breadth and depth of experience, personalskills, technical and professional know-how, personal network The value of an individual is in all their cumulative knowledge, skills,experience, and their relevant network of contacts. It is more thanwhether they have what is required by their current role. Their breadth isa measure of their flexibility for deployment in different roles—and thismakes them more valuable. Whereas it is difficult to encapsulate this innumbers, it should be relatively easy to make judgments, as follows:
0.5 Has some noticeable deficiencies compared to expectations for thisrole
1.0 Generally has the balance of capability expected for this role 1.5 In several areas exceeds the level needed for the role; has unique
knowledge and experience, and capability that can be applied invarious other roles
2.0 Has considerable breadth and depth beyond the basic needs of therole; known for unique expertise or has a range of capabilities thatcan be applied very flexibly
Potential to growAn individual invests their human capital with an organization with theexpectation that they will grow and progress. The organization also wantsto maintain continuity and provide ongoing succession, as well as buildits expertise. The potential to grow beyond the present role is a source ofvalue in itself. It could be for managerial positions, or for growth in anyarea that is strategically important.
The scale for this factor would be as follows:
0.5 Probably overpromoted at current level 1.0 Expected at the very least to grow within the role, or to stay up to
date with a specialism, or to move laterally to different roles1.5 Able to grow to at least one higher level of responsibility, or to one
or two further levels of specialist depth 2.0 Considered high potential for management positions or
technical/professional leadership
80 The Human Value of the Enterprise
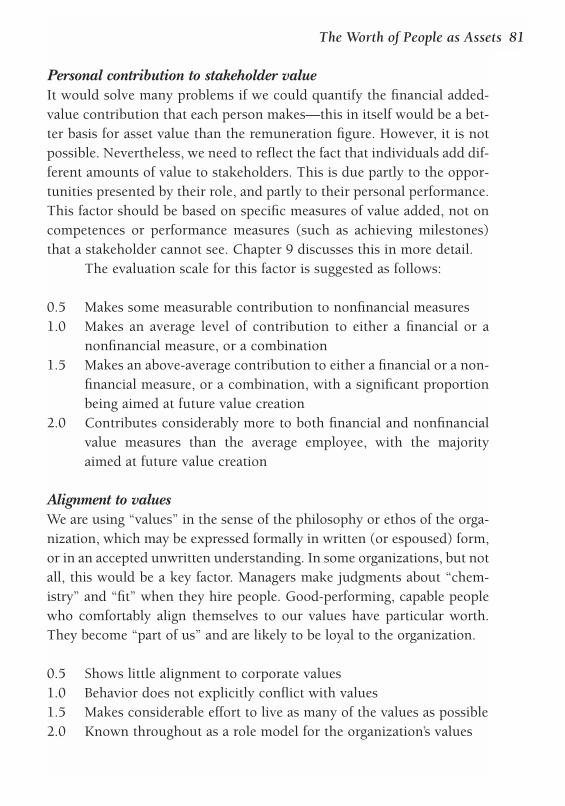
Personal contribution to stakeholder value It would solve many problems if we could quantify the financial added-value contribution that each person makes—this in itself would be a bet-ter basis for asset value than the remuneration figure. However, it is notpossible. Nevertheless, we need to reflect the fact that individuals add dif-ferent amounts of value to stakeholders. This is due partly to the oppor-tunities presented by their role, and partly to their personal performance.This factor should be based on specific measures of value added, not oncompetences or performance measures (such as achieving milestones)that a stakeholder cannot see. Chapter 9 discusses this in more detail.
The evaluation scale for this factor is suggested as follows:
0.5 Makes some measurable contribution to nonfinancial measures1.0 Makes an average level of contribution to either a financial or a
nonfinancial measure, or a combination1.5 Makes an above-average contribution to either a financial or a non-
financial measure, or a combination, with a significant proportionbeing aimed at future value creation
2.0 Contributes considerably more to both financial and nonfinancialvalue measures than the average employee, with the majorityaimed at future value creation
Alignment to valuesWe are using “values” in the sense of the philosophy or ethos of the orga-nization, which may be expressed formally in written (or espoused) form,or in an accepted unwritten understanding. In some organizations, but notall, this would be a key factor. Managers make judgments about “chem-istry” and “fit” when they hire people. Good-performing, capable peoplewho comfortably align themselves to our values have particular worth.They become “part of us” and are likely to be loyal to the organization.
0.5 Shows little alignment to corporate values 1.0 Behavior does not explicitly conflict with values1.5 Makes considerable effort to live as many of the values as possible2.0 Known throughout as a role model for the organization’s values
The Worth of People as Assets 81
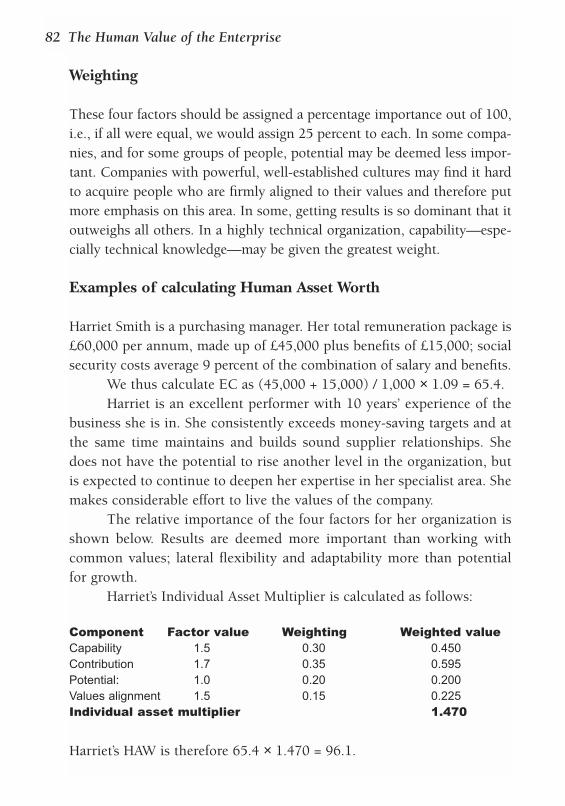
Weighting
These four factors should be assigned a percentage importance out of 100,i.e., if all were equal, we would assign 25 percent to each. In some compa-nies, and for some groups of people, potential may be deemed less impor-tant. Companies with powerful, well-established cultures may find it hardto acquire people who are firmly aligned to their values and therefore putmore emphasis on this area. In some, getting results is so dominant that itoutweighs all others. In a highly technical organization, capability—espe-cially technical knowledge—may be given the greatest weight.
Examples of calculating Human Asset Worth
Harriet Smith is a purchasing manager. Her total remuneration package is£60,000 per annum, made up of £45,000 plus benefits of £15,000; socialsecurity costs average 9 percent of the combination of salary and benefits.
We thus calculate EC as (45,000 + 15,000) / 1,000 × 1.09 = 65.4.Harriet is an excellent performer with 10 years’ experience of the
business she is in. She consistently exceeds money-saving targets and atthe same time maintains and builds sound supplier relationships. Shedoes not have the potential to rise another level in the organization, butis expected to continue to deepen her expertise in her specialist area. Shemakes considerable effort to live the values of the company.
The relative importance of the four factors for her organization isshown below. Results are deemed more important than working withcommon values; lateral flexibility and adaptability more than potentialfor growth.
Harriet’s Individual Asset Multiplier is calculated as follows:
Component Factor value Weighting Weighted valueCapability 1.5 0.30 0.450Contribution 1.7 0.35 0.595Potential: 1.0 0.20 0.200Values alignment 1.5 0.15 0.225Individual asset multiplier 1.470
Harriet’s HAW is therefore 65.4 × 1.470 = 96.1.
82 The Human Value of the Enterprise
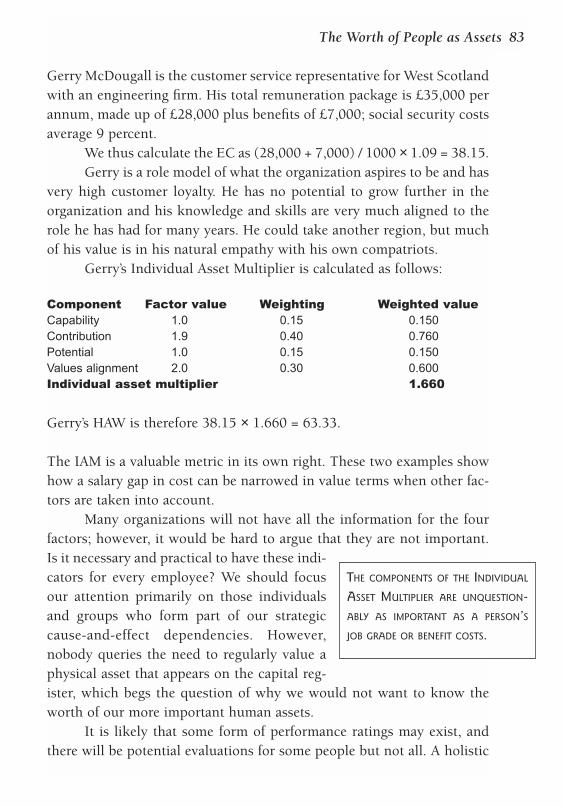
Gerry McDougall is the customer service representative for West Scotlandwith an engineering firm. His total remuneration package is £35,000 perannum, made up of £28,000 plus benefits of £7,000; social security costsaverage 9 percent.
We thus calculate the EC as (28,000 + 7,000) / 1000 × 1.09 = 38.15.Gerry is a role model of what the organization aspires to be and has
very high customer loyalty. He has no potential to grow further in theorganization and his knowledge and skills are very much aligned to therole he has had for many years. He could take another region, but muchof his value is in his natural empathy with his own compatriots.
Gerry’s Individual Asset Multiplier is calculated as follows:
Component Factor value Weighting Weighted valueCapability 1.0 0.15 0.150Contribution 1.9 0.40 0.760Potential 1.0 0.15 0.150Values alignment 2.0 0.30 0.600Individual asset multiplier 1.660
Gerry’s HAW is therefore 38.15 × 1.660 = 63.33.
The IAM is a valuable metric in its own right. These two examples showhow a salary gap in cost can be narrowed in value terms when other fac-tors are taken into account.
Many organizations will not have all the information for the fourfactors; however, it would be hard to argue that they are not important.Is it necessary and practical to have these indi-cators for every employee? We should focusour attention primarily on those individualsand groups who form part of our strategiccause-and-effect dependencies. However,nobody queries the need to regularly value aphysical asset that appears on the capital reg-ister, which begs the question of why we would not want to know theworth of our more important human assets.
It is likely that some form of performance ratings may exist, andthere will be potential evaluations for some people but not all. A holistic
The Worth of People as Assets 83
THE COMPONENTS OF THE INDIVIDUAL
ASSET MULTIPLIER ARE UNQUESTION-
ABLY AS IMPORTANT AS A PERSON’S
JOB GRADE OR BENEFIT COSTS.
evaluation of total capability will be rare, as will any systematic approachto values alignment. These are challenges to be grasped.
Jobs become redundant, through restructuring or technicalprogress. We could say they fall out of any value-creating chain. So manygood individuals have been lost to organizations because their role is nolonger needed. A value-creating organization would see the value pri-marily in the person rather than in the role, hence the importance of thefactors we have suggested. Although costs may well need to be reduced,understanding the relative value of people enables more intelligent deci-sions to be made.
COLLECTIVE HUMAN ASSET WORTH
The purpose of an organization is to organize the human capital of indi-viduals in ways that produce more than they would as individual con-tributors. A team should be more than the sum of the individuals thatmake it up. When we look at the working environment, workgroup effec-tiveness is picked out as one of the contributing factors to value-addingcontribution. But for the purposes of asset value comparisons, we canlook at teams by combining the Human Asset Worth of all the members.If we have evaluated each individual in the way suggested, we have thebasis for some important analysis of our human capital. For example:
❏ The relative value of teams and departments. Our efforts on theretention of talent can be focused through seeing the relative valueof different groups of people. This value may then be comparedwith the contribution that the group is making—and, indeed, theircosts. Arguably, there should be a more or less linear relationshipbetween “asset value” and “value added” for most groups.
❏ The distribution of potential. We can get an understanding of howpotential is distributed and where we may have continuity problems.
❏ The extent of values alignment. We can look at the factors that havebeen judged and get a feel of how values alignment is distributed,in functions and in areas. This may lead to some action to shift theculture more toward the espoused values.
84 The Human Value of the Enterprise
❏ The flexibility of our workforce. The higher the average factor for“capability,” the more flexible our people are. In times of restruc-turing this may save unnecessary redundancies and it also gives usmore options in career management.
IS ALL OUR HUMAN CAPITAL INSIDE?
Should we assume that our human capital is only those people with anexclusive contract to us, those we would regard as employees?Boundaries are breaking down in many ways: Previous competitors col-laborate, customers and suppliers interact electronically and shareknowledge databases, and individuals work for a variety of organizations.Former employee departments become outsourced suppliers. Are theystill part of our human capital? Or is our asset value confined to the man-agement activity of them as a supplier?
Exclusivity is not a satisfactory criterion, since consultants andassociates may be able to add significant value to stakeholders throughtheir capability, and still apply themselves uniquely and confidentially tothe organization just as if they worked for it. Their services have a cost,as do employees; the main difference is the continuity of their contribu-tion and the tenure of their services.
The HAW formula cannot be applied in the same way for non-employees. It is better to see them as service providers, as suppliers oftemporary human capital, in the way that a bank loan provides tempo-rary financial capital. They are certainly stakeholders in their own right,even though their input may or may not be adding value to others.Consultants advising on restructuring, for example, are probably notadding value to any other stakeholder, even though the cost may be feltnecessary. A contractor on a customer project hopefully will be addingvalue. It is important to be clear about what each subcontracted humancost is contributing.
The Worth of People as Assets 85
SUMMARY
This chapter studied the intrinsic worth of people as assets. People bringtheir own “human capital” to an employer, and that employer has theopportunity to develop it for mutual benefit. In a value-creating organi-zation, it is vital to have some way of systematically distinguishing theworth of each individual, and also of teams.
Attempts at human resource accounting, which began in the 1970s,have not been widely taken up. This has happened for various reasons,but mainly because accounting rules cannot be rigorously applied to peo-ple, especially in turbulent times. We concluded that any indicatorshould not pretend to be financial, and has to be based on some factorsthat can be rated.
We recommended the measure Human Asset Worth, a combinationof employment cost and an Individual Asset Multiplier. The latter reflectsthe distinctive value a person brings to the organization, a combinationof capability, potential, performance, and their alignment to organiza-tional values. These factors need not have the same weighting—whatbrings value to a particular organization must be assessed. Although thereare sound arguments for calculating and monitoring the Individual AssetMultiplier for every employee, in practice our attention will go first tothose individuals and groups who feature in the vital links leading toachievement of business results and key added value to stakeholders.
This formula enables a great deal of helpful analysis to take place.We can not only distinguish between individuals but also look at teams.We can monitor the “health” of teams, particularly those in the front lineof strategy. It enables us to manage our stock of human capital, whethergenerally or for specific groups, and has particular application in manag-ing mergers and acquisitions.
CHALLENGES FOR ACTION
❏ What information do you currently have that relates to the value of the indi-
viduals in your organization? How would you practically set up a system to
maintain the data for each component in the IAM?
86 The Human Value of the Enterprise

❏ If you were to employ the four suggested components of the IAM, what
weighting would you give them?
❏ Why not try out the HAW approach on two or three groups in your organi-
zation and see how useful it could be to you in managing the human capital
concerned?
The Worth of People as Assets 87
5Capability and Potential
WHAT AN INDIVIDUAL BRINGS THROUGH THE DOOR OF AN
organization is essentially their accumulated capability,and their potential to grow, given the right nurturingand opportunities. These two components—capability
and potential—must be understood, regularly assessed, and updated. The systems generally in use for measuring levels of capability are
far from consistent, however, and often not very comprehensive. This is anarea that deserves more attention, since a sound framework for describingcapability provides a vital bridge between people and job roles. Capabilityencompasses the strengths a person has at a given point in time and it hassix components. This chapter looks at these and how they can be mea-sured and assessed. We also discuss how the potential for growth isdescribed and evaluated, and consider the question of openness.
CAPABILITY AS PERSONAL CAPITAL
Capability is the essence of an individual’s per-sonal assets—their own human capital. It isthat which they can hire out or sell to anemployer, or capitalize on through self-employment. It is more than competency,which has come to refer very much to per-sonal traits and attitudes.
The focus in this chapter is very muchon people’s strengths. Of course, everybody
“CAPABILITY” MEANS ALL THAT A
PERSON BRINGS THAT ENABLES THEM TO
ACHIEVE BOTH THEIR GOALS AND THOSE
OF THE ORGANIZATION. IT IS SUCH AN
IMPORTANT INPUT TO THE PROCESS OF
ADDING VALUE THAT IT REQUIRES
SERIOUS ANALYSIS AND MEASUREMENT.
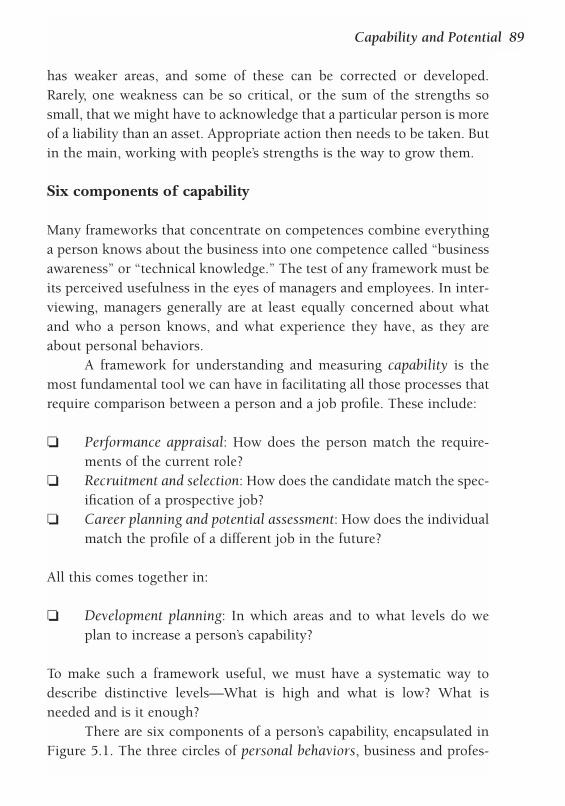
has weaker areas, and some of these can be corrected or developed.Rarely, one weakness can be so critical, or the sum of the strengths sosmall, that we might have to acknowledge that a particular person is moreof a liability than an asset. Appropriate action then needs to be taken. Butin the main, working with people’s strengths is the way to grow them.
Six components of capability
Many frameworks that concentrate on competences combine everythinga person knows about the business into one competence called “businessawareness” or “technical knowledge.” The test of any framework must beits perceived usefulness in the eyes of managers and employees. In inter-viewing, managers generally are at least equally concerned about whatand who a person knows, and what experience they have, as they areabout personal behaviors.
A framework for understanding and measuring capability is themost fundamental tool we can have in facilitating all those processes thatrequire comparison between a person and a job profile. These include:
❏ Performance appraisal: How does the person match the require-ments of the current role?
❏ Recruitment and selection: How does the candidate match the spec-ification of a prospective job?
❏ Career planning and potential assessment: How does the individualmatch the profile of a different job in the future?
All this comes together in:
❏ Development planning: In which areas and to what levels do weplan to increase a person’s capability?
To make such a framework useful, we must have a systematic way todescribe distinctive levels—What is high and what is low? What isneeded and is it enough?
There are six components of a person’s capability, encapsulated inFigure 5.1. The three circles of personal behaviors, business and profes-
Capability and Potential 89
sional know-how, and their network of contacts or know-who are the core,and they are developed primarily through experience. Know-how can alsobe developed through systematic study or qualifications. The way inwhich the core is demonstrated is then conditioned by the attitudes andvalues that the person holds—these being the most difficult to change.
PERSONAL BEHAVIORS
This area covers personal traits, attitudes, and behaviors that aredemanded by a role, or that generally characterize “high performance.”They are undoubtedly important and very individual.
In many job roles, aspects of personal behavior can be extremely per-tinent to the likelihood of success. As one goes up the management ladder,these behaviors gain increasing importance and can outweigh the technicalknowledge that might have been more important in junior jobs.
Nevertheless, this aspect needs to be kept in proportion whenthinking about a person’s value. Paul Dobson of City University BusinessSchool in the UK argued this persuasively:
❏ Personal competencies alone are unlikely to deliver superior per-formance outcomes. This is because of the influence of the environ-
90 The Human Value of the Enterprise
People as Assets
Human Asset Worth
= employment costs xindividual asset multiplier(IAM) / 1000
IAM = a function of• capability• potential• contribution• values alignment
THE HUMAN CAPITAL MONITOR
Personalbehaviors
Businessand
professionalknow-how
Network ofcontacts—know-who
Qualifications andexperience
Attitudes and
values
Figure 5.1 The components of capability
ment in which people work, and the fact that they are only one com-ponent of capability.
❏ There are severe limitations in the way that competencies are cho-sen, validated and assessed, and they lack the flexibility needed tocope with change and diversity.
❏ Results can be achieved successfully in many different ways.Moreover each area of adding value demands its own set of behav-iours for success.
Measurement
The concept of “universal competences for all” conflicts with the know-ledge that men and women achieve results in different ways, and that dif-ferent national cultures have effective leaders with their own distinctiveapproaches. Also, requirements and priorities change with time, so com-panies are finding that competency frameworks are out of date three tofour years after they are developed. Instead, many organizations find cre-ating a dictionary helpful. This lists the range of behaviors that haveimportance in the organization in different roles and at different levels,from which those that are important for a specific role can be selected. Adictionary can be added to, and enables each role to be specificallydescribed according to the critical attributes.
Figure 5.2 overleaf shows a three-level approach that would beapplied to each “job family” in an organization. The center has a smallnumber of core behaviors that reflect the common values of the organi-zation. These are a passport to entry for all and a condition of retention.They relate directly to the Individual Asset Multiplier component of “val-ues alignment.” Then, each “job family” has its distinctive set of personaland know-how components.
Most organizations do not have more than six to eight distinctivejob families. For example, a large software company identified thefollowing:
❏ Business leaders❏ People managers❏ Technical specialists
Capability and Potential 91
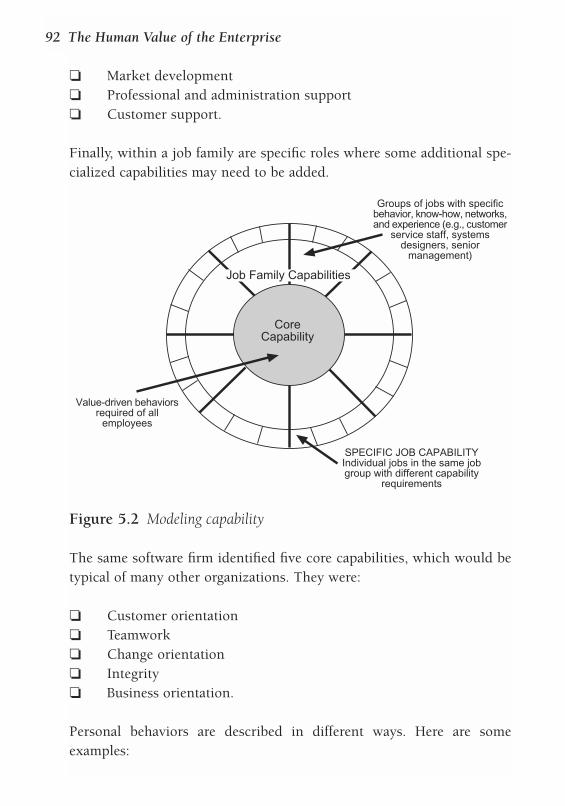
❏ Market development ❏ Professional and administration support❏ Customer support.
Finally, within a job family are specific roles where some additional spe-cialized capabilities may need to be added.
The same software firm identified five core capabilities, which would betypical of many other organizations. They were:
❏ Customer orientation❏ Teamwork ❏ Change orientation❏ Integrity ❏ Business orientation.
Personal behaviors are described in different ways. Here are someexamples:
92 The Human Value of the Enterprise
CoreCapability
Job Family Capabilities
Value-driven behaviorsrequired of all
employees
SPECIFIC JOB CAPABILITYIndividual jobs in the same jobgroup with different capability
requirements
Groups of jobs with specificbehavior, know-how, networks,and experience (e.g., customer
service staff, systemsdesigners, senior
management)
Figure 5.2 Modeling capability
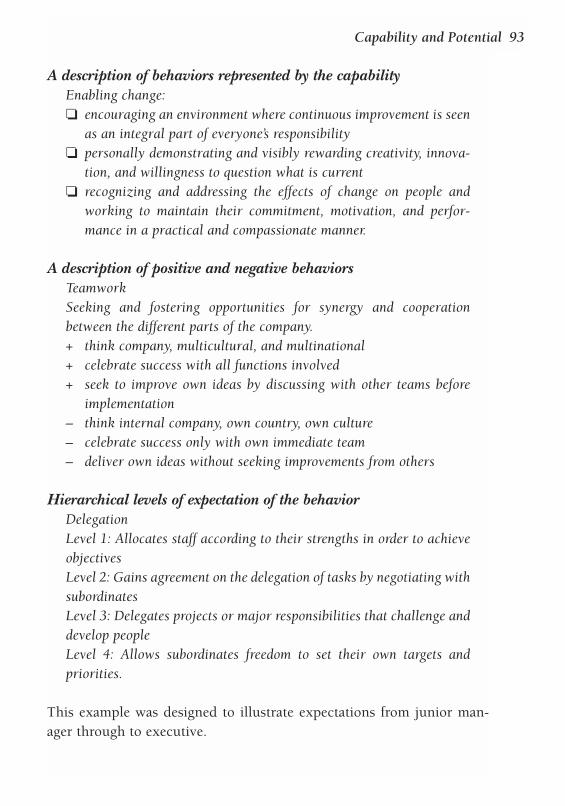
A description of behaviors represented by the capabilityEnabling change:❏ encouraging an environment where continuous improvement is seen
as an integral part of everyone’s responsibility❏ personally demonstrating and visibly rewarding creativity, innova-
tion, and willingness to question what is current❏ recognizing and addressing the effects of change on people and
working to maintain their commitment, motivation, and perfor-mance in a practical and compassionate manner.
A description of positive and negative behaviorsTeamworkSeeking and fostering opportunities for synergy and cooperationbetween the different parts of the company.+ think company, multicultural, and multinational+ celebrate success with all functions involved+ seek to improve own ideas by discussing with other teams before
implementation– think internal company, own country, own culture– celebrate success only with own immediate team– deliver own ideas without seeking improvements from others
Hierarchical levels of expectation of the behaviorDelegationLevel 1: Allocates staff according to their strengths in order to achieveobjectivesLevel 2: Gains agreement on the delegation of tasks by negotiating withsubordinatesLevel 3: Delegates projects or major responsibilities that challenge anddevelop peopleLevel 4: Allows subordinates freedom to set their own targets andpriorities.
This example was designed to illustrate expectations from junior man-ager through to executive.
Capability and Potential 93
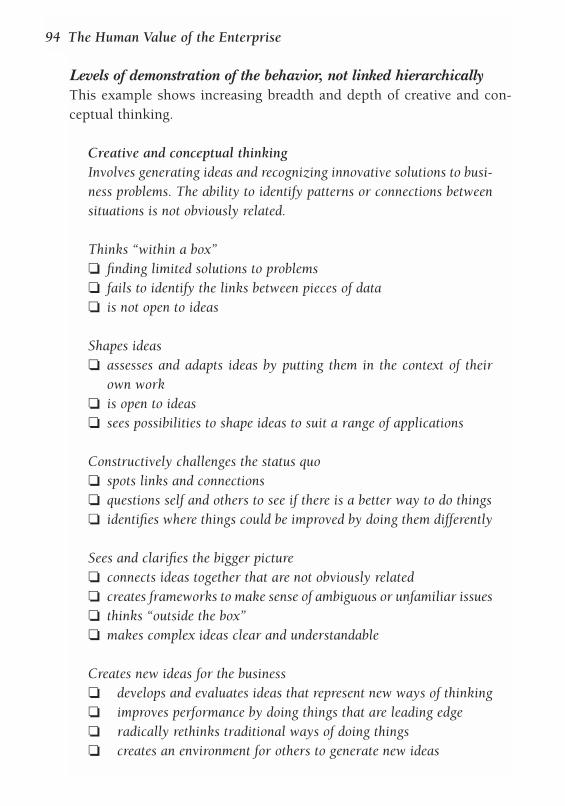
Levels of demonstration of the behavior, not linked hierarchicallyThis example shows increasing breadth and depth of creative and con-ceptual thinking.
Creative and conceptual thinkingInvolves generating ideas and recognizing innovative solutions to busi-ness problems. The ability to identify patterns or connections betweensituations is not obviously related.
Thinks “within a box”❏ finding limited solutions to problems❏ fails to identify the links between pieces of data❏ is not open to ideas
Shapes ideas❏ assesses and adapts ideas by putting them in the context of their
own work❏ is open to ideas❏ sees possibilities to shape ideas to suit a range of applications
Constructively challenges the status quo❏ spots links and connections❏ questions self and others to see if there is a better way to do things❏ identifies where things could be improved by doing them differently
Sees and clarifies the bigger picture❏ connects ideas together that are not obviously related❏ creates frameworks to make sense of ambiguous or unfamiliar issues❏ thinks “outside the box”❏ makes complex ideas clear and understandable
Creates new ideas for the business ❏ develops and evaluates ideas that represent new ways of thinking❏ improves performance by doing things that are leading edge❏ radically rethinks traditional ways of doing things❏ creates an environment for others to generate new ideas
94 The Human Value of the Enterprise
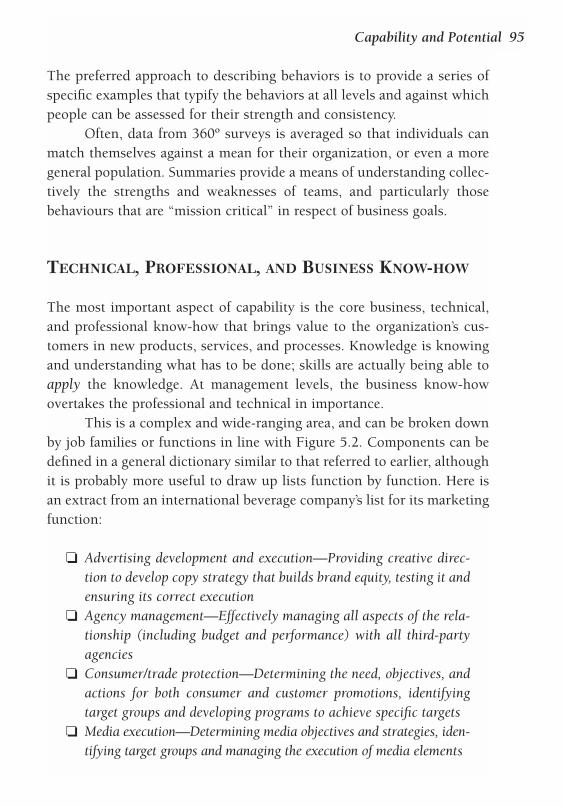
The preferred approach to describing behaviors is to provide a series ofspecific examples that typify the behaviors at all levels and against whichpeople can be assessed for their strength and consistency.
Often, data from 360º surveys is averaged so that individuals canmatch themselves against a mean for their organization, or even a moregeneral population. Summaries provide a means of understanding collec-tively the strengths and weaknesses of teams, and particularly thosebehaviours that are “mission critical” in respect of business goals.
TECHNICAL, PROFESSIONAL, AND BUSINESS KNOW-HOW
The most important aspect of capability is the core business, technical,and professional know-how that brings value to the organization’s cus-tomers in new products, services, and processes. Knowledge is knowingand understanding what has to be done; skills are actually being able toapply the knowledge. At management levels, the business know-howovertakes the professional and technical in importance.
This is a complex and wide-ranging area, and can be broken downby job families or functions in line with Figure 5.2. Components can bedefined in a general dictionary similar to that referred to earlier, althoughit is probably more useful to draw up lists function by function. Here isan extract from an international beverage company’s list for its marketingfunction:
❏ Advertising development and execution—Providing creative direc-tion to develop copy strategy that builds brand equity, testing it andensuring its correct execution
❏ Agency management—Effectively managing all aspects of the rela-tionship (including budget and performance) with all third-partyagencies
❏ Consumer/trade protection—Determining the need, objectives, andactions for both consumer and customer promotions, identifyingtarget groups and developing programs to achieve specific targets
❏ Media execution—Determining media objectives and strategies, iden-tifying target groups and managing the execution of media elements
Capability and Potential 95
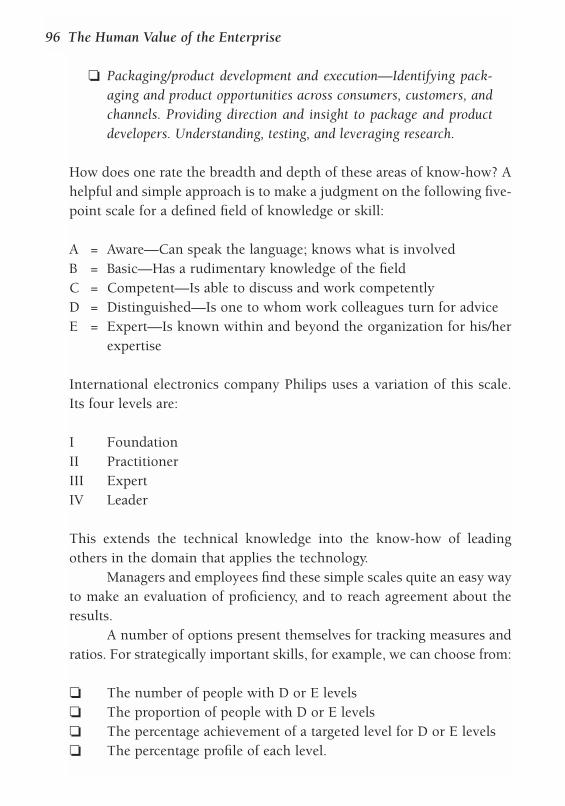
❏ Packaging/product development and execution—Identifying pack-aging and product opportunities across consumers, customers, andchannels. Providing direction and insight to package and productdevelopers. Understanding, testing, and leveraging research.
How does one rate the breadth and depth of these areas of know-how? Ahelpful and simple approach is to make a judgment on the following five-point scale for a defined field of knowledge or skill:
A = Aware—Can speak the language; knows what is involvedB = Basic—Has a rudimentary knowledge of the fieldC = Competent—Is able to discuss and work competently D = Distinguished—Is one to whom work colleagues turn for adviceE = Expert—Is known within and beyond the organization for his/her
expertise
International electronics company Philips uses a variation of this scale.Its four levels are:
I FoundationII PractitionerIII ExpertIV Leader
This extends the technical knowledge into the know-how of leadingothers in the domain that applies the technology.
Managers and employees find these simple scales quite an easy wayto make an evaluation of proficiency, and to reach agreement about theresults.
A number of options present themselves for tracking measures andratios. For strategically important skills, for example, we can choose from:
❏ The number of people with D or E levels❏ The proportion of people with D or E levels❏ The percentage achievement of a targeted level for D or E levels❏ The percentage profile of each level.
96 The Human Value of the Enterprise
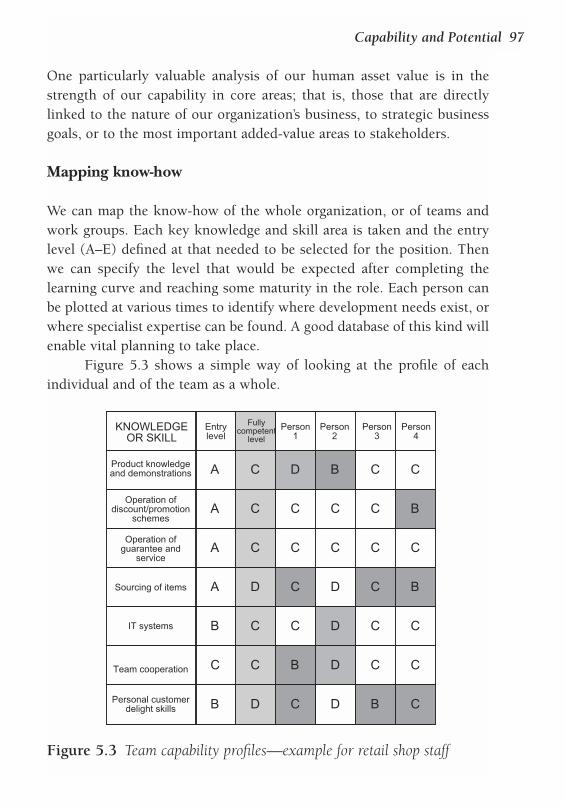
One particularly valuable analysis of our human asset value is in thestrength of our capability in core areas; that is, those that are directlylinked to the nature of our organization’s business, to strategic businessgoals, or to the most important added-value areas to stakeholders.
Mapping know-how
We can map the know-how of the whole organization, or of teams andwork groups. Each key knowledge and skill area is taken and the entrylevel (A–E) defined at that needed to be selected for the position. Thenwe can specify the level that would be expected after completing thelearning curve and reaching some maturity in the role. Each person canbe plotted at various times to identify where development needs exist, orwhere specialist expertise can be found. A good database of this kind willenable vital planning to take place.
Figure 5.3 shows a simple way of looking at the profile of eachindividual and of the team as a whole.
Capability and Potential 97
KNOWLEDGEOR SKILL
Product knowledgeand demonstrations
Operation ofdiscount/promotion
schemes
Operation ofguarantee and
service
Sourcing of items
IT systems
Team cooperation
Personal customerdelight skills
Entrylevel
Fullycompetent
level
Person1
Person2
Person3
Person4
A
A
A
A
B
C
B
C
C
C
D
C
C
D
D
C
C
C
C
B
C
B
C
C
D
D
D
D
C
C
C
C
C
C
B
C
B
C
B
C
C
C
Figure 5.3 Team capability profiles—example for retail shop staff
Training events can be aimed at one of the levels, so that people can behelped in planning their development.
EDUCATIONAL LEVEL AND PROFESSIONAL QUALIFICATIONS
Qualifications tend to be downplayed in the UK, but they have greaterimportance in the US and many European countries where studies can bemuch longer and more focused. They represent a standard that has beenreached that gives confidence to an employer or a customer. If I have aMaster’s degree in a specialist subject, it will be assumed that I know a greatdeal about that subject unless proved otherwise. A professional qualificationmay be necessary to give me a license to practice, as well as encouragingpeople to deal with me. In many countries there are occupational qualifica-tions, such as the vast array of National Vocational Qualifications in the UK.These always include aspects of technical know-how referred to above.
For some organizations, or parts of organizations, qualificationsmay have special importance. In an R&D environment, the percentage ofpeople with higher degrees may be a critical measure and a benchmarkagainst competition; in finance, the percentage who are fully qualified isa measure of departmental strength.
Measurement
Measurement here is simple. It will be based on the number with—asopposed to the number without—a certain level of qualification. This canbe expressed as an absolute number or as a percentage of a population.
Thus, we might have measures such as the percentage of employ-ees with postgraduate degrees or those with a professional qualificationin accountancy. Organization-wide measures may be useful. It dependson their nature and size, but measures that concentrate on subgroups ofthe total are likely to be the most useful for monitoring.
Targets may be set to change the figures if they are deemed too low,as may be the case through benchmarking against competitors. Findingout, for example, that a rival is using graduates as salespeople raises ques-tions about our policies and consequent ability to compete.
98 The Human Value of the Enterprise
EXPERIENCE
Even though some organizations still cheerfully find ways to say goodbyeto people above a certain age to “make way for new blood,” experience isgenerally valued and respected. While broadly having a maturing effectand increasing personal capability, experience can also have a negativeaspect, in the sense that people rely on a past that has become irrelevant.Nevertheless, experience generates much of our know-how (particularlythat which is industry and company specific) and has value in itself.Thus, the context in which we learn our knowledge and skills can beimportant as the know-how gained. Experience gives us both breadth anddepth.
Measurement
Different kinds of experience would include:
❏ Time spent in a certain field❏ Having been in certain kinds of organization ❏ Having had certain responsibilities or accountabilities❏ Having been in particular situations.
Experience may not result in any spectacular achievement yet still havevalue in itself. Obviously successful experiences are good news, butsometimes unsuccessful ones can still have much value for learning. Onecompany gives advice to young ambitious graduates as follows: “Makesure you spend one to two years in a role that directly involves customers;it does not matter so much whether you are particularly successful, buteveryone needs to know how customers think and act.”
Experience is obtained in the following ways:
❏ Being accountable in a function for some results or value added❏ Being in a particular type of situation❏ A type of project❏ A type of problem or opportunity.
Capability and Potential 99
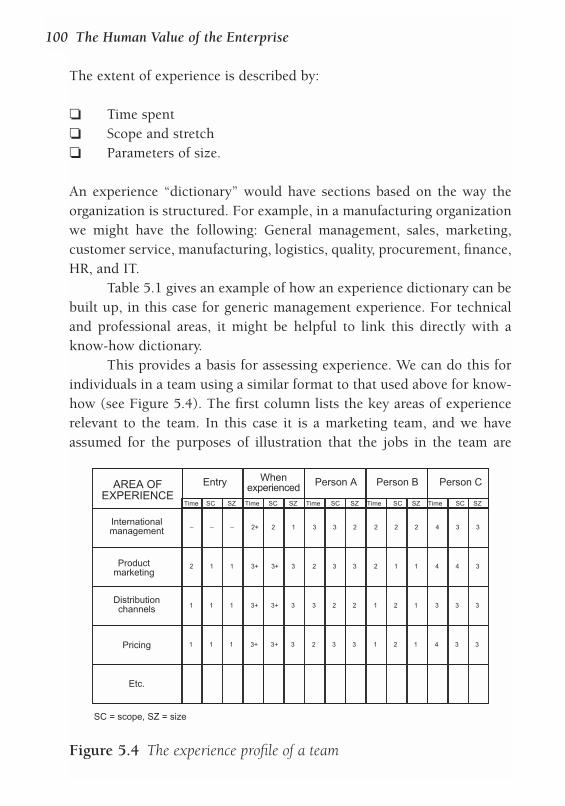
The extent of experience is described by:
❏ Time spent❏ Scope and stretch❏ Parameters of size.
An experience “dictionary” would have sections based on the way theorganization is structured. For example, in a manufacturing organizationwe might have the following: General management, sales, marketing,customer service, manufacturing, logistics, quality, procurement, finance,HR, and IT.
Table 5.1 gives an example of how an experience dictionary can bebuilt up, in this case for generic management experience. For technicaland professional areas, it might be helpful to link this directly with aknow-how dictionary.
This provides a basis for assessing experience. We can do this forindividuals in a team using a similar format to that used above for know-how (see Figure 5.4). The first column lists the key areas of experiencerelevant to the team. In this case it is a marketing team, and we haveassumed for the purposes of illustration that the jobs in the team are
100 The Human Value of the Enterprise
AREA OFEXPERIENCE
Internationalmanagement
Productmarketing
Distributionchannels
Pricing
Etc.
Entry Whenexperienced Person A Person B Person C
Time Time Time Time TimeSC SC SC SC SCSZ SZ SZ SZ SZ
– – –
2 1 1
1 1 1
1 1 1
2+ 2 1
3+ 3+ 3
3+ 3+ 3
3+ 3+ 3
3 3 2
2 3 3
3 2 2
2 3 3
2 2 2
2 1 1
1 2 1
1 2 1
4 3 3
4 4 3
3 3 3
4 3 3
SC = scope, SZ = size
Figure 5.4 The experience profile of a team
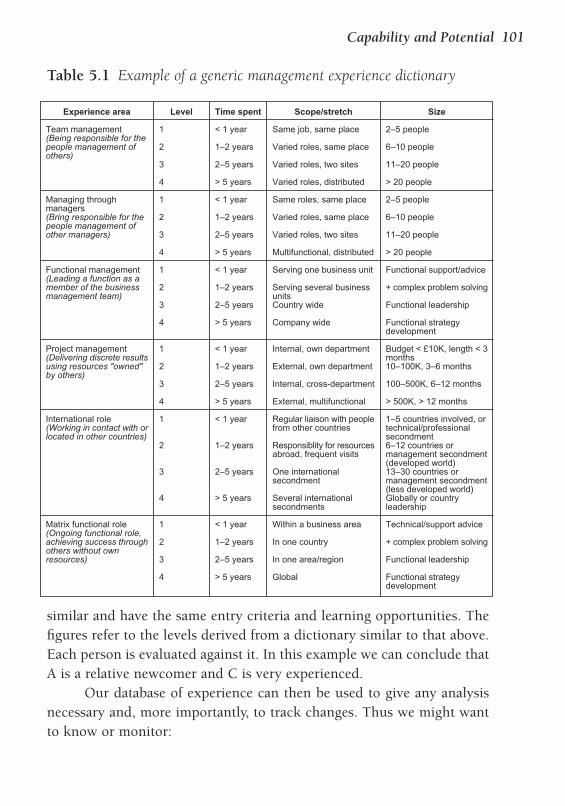
similar and have the same entry criteria and learning opportunities. Thefigures refer to the levels derived from a dictionary similar to that above.Each person is evaluated against it. In this example we can conclude thatA is a relative newcomer and C is very experienced.
Our database of experience can then be used to give any analysisnecessary and, more importantly, to track changes. Thus we might wantto know or monitor:
Capability and Potential 101
Experience area
Team management(Being responsible for thepeople management ofothers)
Managing throughmanagers(Bring responsible for thepeople management ofother managers)
Functional management(Leading a function as amember of the businessmanagement team)
Project management(Delivering discrete resultsusing resources "owned"by others)
International role(Working in contact with orlocated in other countries)
Matrix functional role(Ongoing functional role,achieving success throughothers without ownresources)
Scope/stretch
Same job, same place
Varied roles, same place
Varied roles, two sites
Varied roles, distributed
Same roles, same place
Varied roles, same place
Varied roles, two sites
Multifunctional, distributed
Serving one business unit
Serving several businessunitsCountry wide
Company wide
Internal, own department
External, own department
Internal, cross-department
External, multifunctional
Regular liaison with peoplefrom other countries
Responsiblity for resourcesabroad, frequent visits
One internationalsecondment
Several internationalsecondments
Within a business area
In one country
In one area/region
Global
Size
2–5 people
6–10 people
11–20 people
> 20 people
2–5 people
6–10 people
11–20 people
> 20 people
Functional support/advice
+ complex problem solving
Functional leadership
Functional strategydevelopment
Budget < £10K, length < 3months10–100K, 3–6 months
100–500K, 6–12 months
> 500K, > 12 months
1–5 countries involved, ortechnical/professionalsecondment6–12 countries ormanagement secondment(developed world)13–30 countries ormanagement secondment(less developed world)Globally or countryleadership
Technical/support advice
+ complex problem solving
Functional leadership
Functional strategydevelopment
Level
1
2
3
4
1
2
3
4
1
2
3
4
1
2
3
4
1
2
3
4
1
2
3
4
Time spent
< 1 year
1–2 years
2–5 years
> 5 years
< 1 year
1–2 years
2–5 years
> 5 years
< 1 year
1–2 years
2–5 years
> 5 years
< 1 year
1–2 years
2–5 years
> 5 years
< 1 year
1–2 years
2–5 years
> 5 years
< 1 year
1–2 years
2–5 years
> 5 years
Table 5.1 Example of a generic management experience dictionary
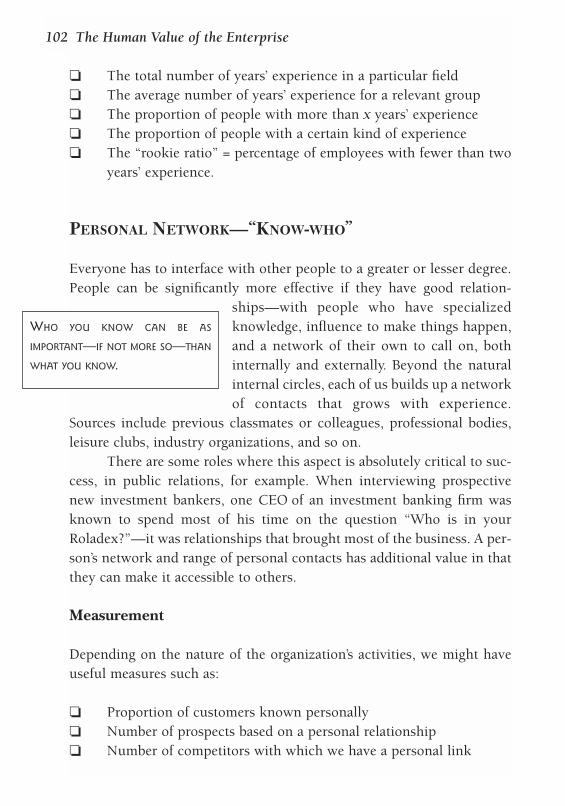
❏ The total number of years’ experience in a particular field❏ The average number of years’ experience for a relevant group❏ The proportion of people with more than x years’ experience❏ The proportion of people with a certain kind of experience❏ The “rookie ratio” = percentage of employees with fewer than two
years’ experience.
PERSONAL NETWORK—“KNOW-WHO”
Everyone has to interface with other people to a greater or lesser degree.People can be significantly more effective if they have good relation-
ships—with people who have specializedknowledge, influence to make things happen,and a network of their own to call on, bothinternally and externally. Beyond the naturalinternal circles, each of us builds up a networkof contacts that grows with experience.
Sources include previous classmates or colleagues, professional bodies,leisure clubs, industry organizations, and so on.
There are some roles where this aspect is absolutely critical to suc-cess, in public relations, for example. When interviewing prospectivenew investment bankers, one CEO of an investment banking firm wasknown to spend most of his time on the question “Who is in yourRoladex?”—it was relationships that brought most of the business. A per-son’s network and range of personal contacts has additional value in thatthey can make it accessible to others.
Measurement
Depending on the nature of the organization’s activities, we might haveuseful measures such as:
❏ Proportion of customers known personally❏ Number of prospects based on a personal relationship ❏ Number of competitors with which we have a personal link
102 The Human Value of the Enterprise
WHO YOU KNOW CAN BE AS
IMPORTANT—IF NOT MORE SO—THAN
WHAT YOU KNOW.
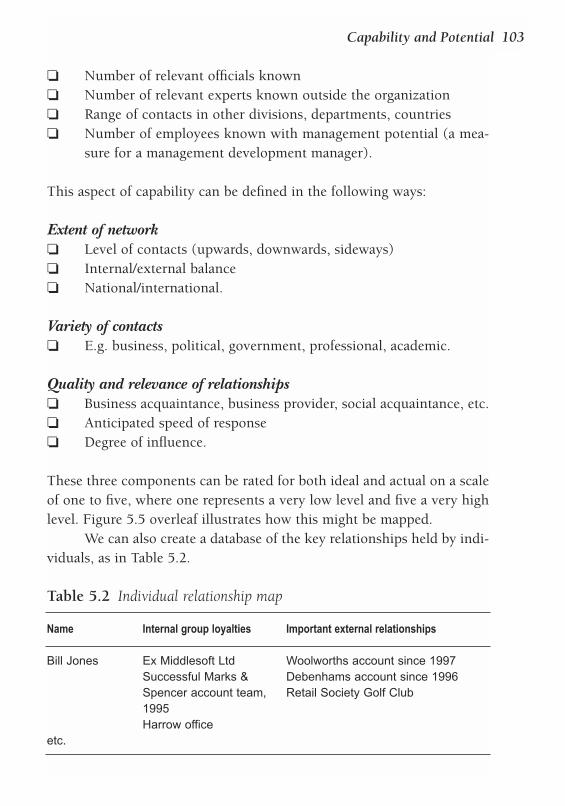
❏ Number of relevant officials known❏ Number of relevant experts known outside the organization❏ Range of contacts in other divisions, departments, countries❏ Number of employees known with management potential (a mea-
sure for a management development manager).
This aspect of capability can be defined in the following ways:
Extent of network❏ Level of contacts (upwards, downwards, sideways)❏ Internal/external balance❏ National/international.
Variety of contacts❏ E.g. business, political, government, professional, academic.
Quality and relevance of relationships❏ Business acquaintance, business provider, social acquaintance, etc.❏ Anticipated speed of response❏ Degree of influence.
These three components can be rated for both ideal and actual on a scaleof one to five, where one represents a very low level and five a very highlevel. Figure 5.5 overleaf illustrates how this might be mapped.
We can also create a database of the key relationships held by indi-viduals, as in Table 5.2.
Table 5.2 Individual relationship map
Name Internal group loyalties Important external relationships
Bill Jones Ex Middlesoft Ltd Woolworths account since 1997Successful Marks & Debenhams account since 1996Spencer account team, Retail Society Golf Club1995Harrow office
etc.
Capability and Potential 103
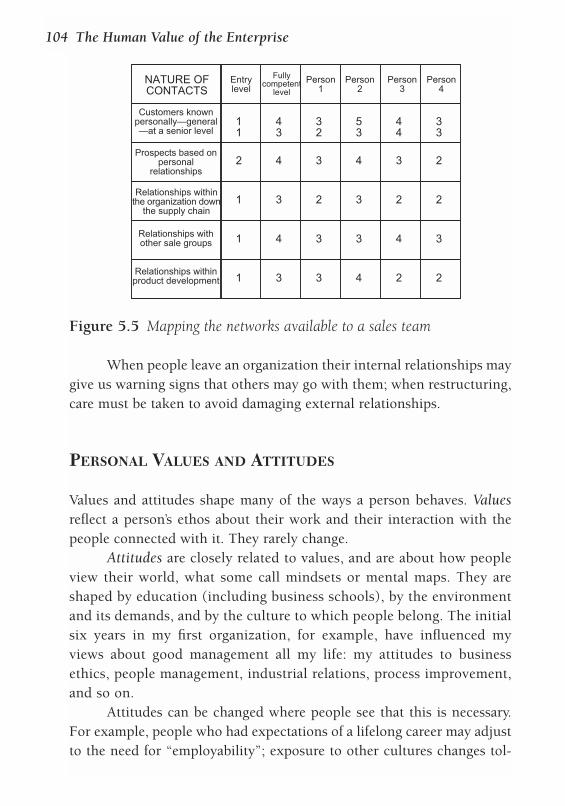
When people leave an organization their internal relationships maygive us warning signs that others may go with them; when restructuring,care must be taken to avoid damaging external relationships.
PERSONAL VALUES AND ATTITUDES
Values and attitudes shape many of the ways a person behaves. Valuesreflect a person’s ethos about their work and their interaction with thepeople connected with it. They rarely change.
Attitudes are closely related to values, and are about how peopleview their world, what some call mindsets or mental maps. They areshaped by education (including business schools), by the environmentand its demands, and by the culture to which people belong. The initialsix years in my first organization, for example, have influenced myviews about good management all my life: my attitudes to businessethics, people management, industrial relations, process improvement,and so on.
Attitudes can be changed where people see that this is necessary.For example, people who had expectations of a lifelong career may adjustto the need for “employability”; exposure to other cultures changes tol-
104 The Human Value of the Enterprise
NATURE OFCONTACTS
Customers knownpersonally—general—at a senior level
Prospects based onpersonal
relationships
Relationships withinthe organization down
the supply chain
Relationships withother sale groups
Relationships withinproduct development
Entrylevel
Fullycompetent
level
Person1
Person2
Person3
Person4
11
2
1
1
1
43
4
3
4
3
32
3
2
3
3
53
4
3
3
4
44
3
2
4
2
33
2
2
3
2
Figure 5.5 Mapping the networks available to a sales team
erance levels, and previously held beliefs about work, management, andnorms of behavior can all be changed.
Measurement
Values and attitudes should not be measured separately, because it is theiroutcome that matters. They will be reflected in a person’s behaviors. Thedegree of alignment with company values is a suggested component ofthe Individual Asset Multiplier. Assessment of this alignment has to bebased on the strength of those behaviors that specifically support theorganization’s written and unwritten values.
PROCESSES FOR EVALUATING CAPABILITY
The process of measurement of capability has varying degrees of diffi-culty. Qualifications, experience, and a person’s network are factual andpresent no problem. “Know-how” can be assessed reasonably objectivelywithin a good framework; the simple A–E system mentioned above worksremarkably well. Tests can be applied to both knowledge and skill areas.
Assessing personal behaviors and attitudes is judgmental, however,and need to be based on perceptions. They can vary with circumstances,with motivation, with different types of work and so on.
Appraisal systems
Systems for appraising performance are being continually redesigned.This is because changing cultures and values alter the priorities of whatwe look for in performance.
❏ In assessing results, we want to focus on value added. We shouldhave set targets in this way, and we want to discuss how they wereor were not met.
❏ We want to discuss the value added to the employee, as a stake-holder. How have the person’s capability, motivation, job challenge,and so on changed?
Capability and Potential 105
❏ We want to review the range of capabilities the person has and howthey could be developed.
❏ We want to discuss their potential to deepen or broaden these inthe future.
❏ We want to discuss their alignment with company values.
This is an opportunity to reassess the components of the Individual AssetMultiplier. The overall “value contribution factor” should be judgedagainst the targets for adding value to stakeholders. It should be validatedby others: a more senior manager, or peer manager, or a trained HR prac-titioner. There are thus three outputs of an appraisal discussion:
❏ A narrative summary of performance ❏ A revision of the IAM factor ratings❏ A personal development plan.
There are alternatives to hierarchical appraisal that reflect the reality ofmany modern project-based organizations, where people do differentthings in different teams during a year, and no one person is “boss.” AnIT consultancy in the City of London developed an approach as follows:
❏ Each individual chose a mentor for the year, who could be a peeror any more senior person.
❏ When the person was assigned to a project, the project managercompleted a one-page summary of their contribution and gave it tothe individual and their mentor.
❏ They also belonged to a technical group with a technical leader,who commented on their technical capability.
❏ Finally, they belonged to an administrative group, and their linemanager also had an input to their appraisal.
The role of the mentor was the key one here, in pulling together the var-ious components and guiding the development plan.
106 The Human Value of the Enterprise
360o feedback
For many years, the person’s manager was the only judge—and in manyorganizations still is. This is generally fine for “know-how,” which can beassessed more objectively, although even here, the individual and theirpeers are probably the best judges of how good they are. However, whenlooking at personal behaviors one has to ask who has the best informa-tion. Who is the best judge of leadership capability? Surely those beingled. Of teamworking? The other members of the team. Of customerfocus? The customers themselves.
This has led to the extensive use of multi-input feedback systemsor 360º approaches, where views are obtained from people both aboveand below the individual concerned. HR departments have tended tooffer this first to leaders and managers, but the principle applies to all.Any person concerned for their own growth would want the best possiblefeedback they can get on their capability.
It has become accepted that feedback should be anonymous.Nevertheless, the most valuable part of feedback is the narrative com-ments obtained, and openness should at least be considered. In my lastmanagerial role we instituted a simple, employee-owned approach whereeach individual chose some of those they had worked with and askedthree simple questions:
❏ What do you think I have done particularly well this period, andwhy?
❏ What do you think I could have done better and why?❏ What advice would you give me for improving the value from my
contribution?
The answers were discussed with their mentor, a person they also chosethemselves.
Self-assessment would be part of a 360º feedback exercise, butneed not be so formal. A good dictionary allows people to make theirown self-evaluation. Many organizations have sophisticated softwareenabling this, and leading to options for development from which peo-ple can choose.
Capability and Potential 107
Assessment centers
Since the 1970s, assessment centers and, latterly, development centershave been used extensively in the US and the UK, less so elsewhere.These work traditionally to a formula of multiple competences to beassessed (typically 8–12); multiple situations (simulations, tests, discus-sions); and multiple observer assessors (one per two participants). Bycareful design to bring out competences in as varied a way as possible,evaluations of strengths and weaknesses are made.
This format is particularly valuable if a person is not known well,or if there are varied opinions about capability. It has several dangers,however: untrained assessors, the use of weak evidence to give the sem-blance of an evaluation, and the artificiality of the simulations.
Assessing real-life performance will generally be a better guide,unless we are testing a person against quite new demands through usingthe center.
THE PERSONAL CAPABILITY PROFILE
A CV or resumé is a chronological and biographical summary of where aperson has been. A personal capability profile is about where a person is.
It is a summary of their particular strengthsunder each area of capability. In our A–E scalefor know-how, it would list those areas wherea proficiency of C or above exists. It is a state-ment of an individual’s own human capital. Assuch, it forms a basis of comparison withprospective, current, and future roles, and for
individual development planning. For most people it should change eachyear.
A format is given in Figure 5.6. The column “Strategic importance”is optional but can be used to relate to core capabilities—either in rela-tion to the overall business itself or to a major strategy.
108 The Human Value of the Enterprise
EVERYONE SHOULD HAVE A PERSONAL
CAPABILITY PROFILE, A STATEMENT OF
THEIR PERSONAL CAPITAL THAT COVERS
THEIR RANGE OF CAPABILITIES.
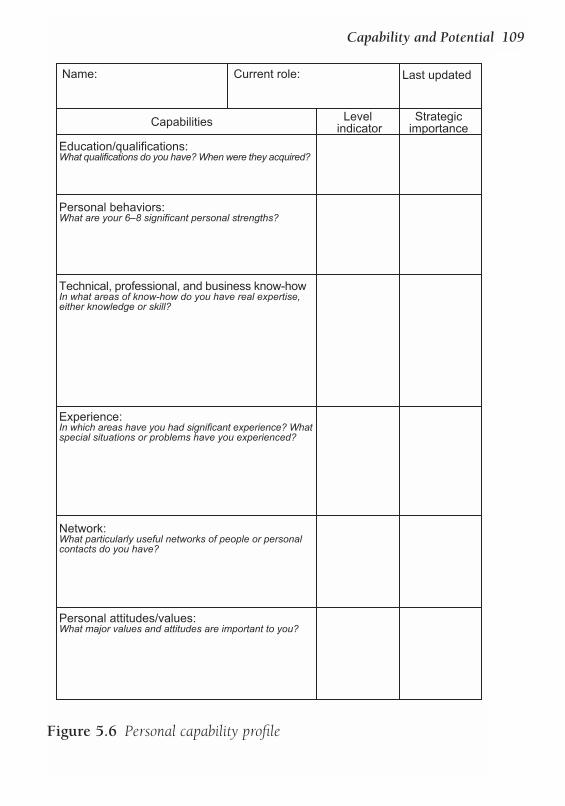
Capability and Potential 109
Name: Current role: Last updated
Capabilities Level indicator
Strategicimportance
Education/qualifications:What qualifications do you have? When were they acquired?
Personal behaviors:What are your 6–8 significant personal strengths?
Technical, professional, and business know-howIn what areas of know-how do you have real expertise,either knowledge or skill?
Experience:In which areas have you had significant experience? Whatspecial situations or problems have you experienced?
Network:What particularly useful networks of people or personalcontacts do you have?
Personal attitudes/values:What major values and attitudes are important to you?
Figure 5.6 Personal capability profile
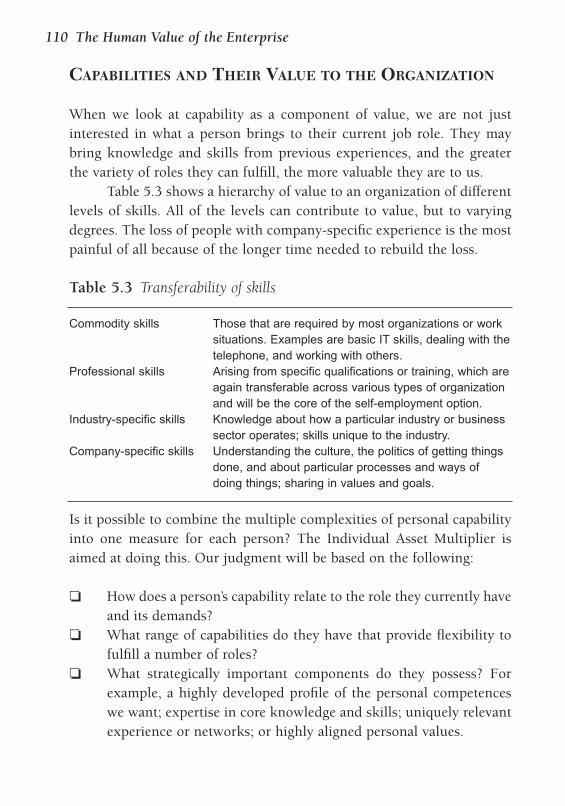
CAPABILITIES AND THEIR VALUE TO THE ORGANIZATION
When we look at capability as a component of value, we are not justinterested in what a person brings to their current job role. They maybring knowledge and skills from previous experiences, and the greaterthe variety of roles they can fulfill, the more valuable they are to us.
Table 5.3 shows a hierarchy of value to an organization of differentlevels of skills. All of the levels can contribute to value, but to varyingdegrees. The loss of people with company-specific experience is the mostpainful of all because of the longer time needed to rebuild the loss.
Table 5.3 Transferability of skills
Commodity skills Those that are required by most organizations or work situations. Examples are basic IT skills, dealing with thetelephone, and working with others.
Professional skills Arising from specific qualifications or training, which areagain transferable across various types of organization and will be the core of the self-employment option.
Industry-specific skills Knowledge about how a particular industry or business sector operates; skills unique to the industry.
Company-specific skills Understanding the culture, the politics of getting things done, and about particular processes and ways of doing things; sharing in values and goals.
Is it possible to combine the multiple complexities of personal capabilityinto one measure for each person? The Individual Asset Multiplier isaimed at doing this. Our judgment will be based on the following:
❏ How does a person’s capability relate to the role they currently haveand its demands?
❏ What range of capabilities do they have that provide flexibility tofulfill a number of roles?
❏ What strategically important components do they possess? Forexample, a highly developed profile of the personal competenceswe want; expertise in core knowledge and skills; uniquely relevantexperience or networks; or highly aligned personal values.
110 The Human Value of the Enterprise
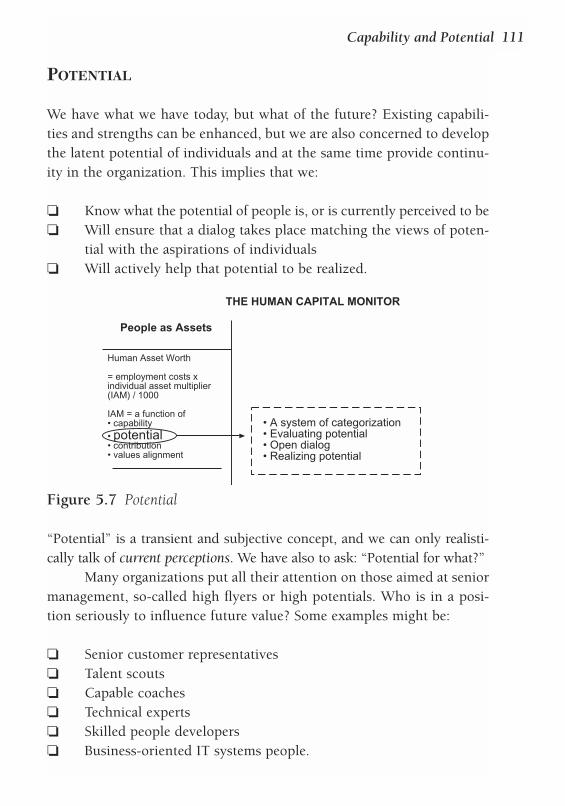
POTENTIAL
We have what we have today, but what of the future? Existing capabili-ties and strengths can be enhanced, but we are also concerned to developthe latent potential of individuals and at the same time provide continu-ity in the organization. This implies that we:
❏ Know what the potential of people is, or is currently perceived to be❏ Will ensure that a dialog takes place matching the views of poten-
tial with the aspirations of individuals ❏ Will actively help that potential to be realized.
“Potential” is a transient and subjective concept, and we can only realisti-cally talk of current perceptions. We have also to ask: “Potential for what?”
Many organizations put all their attention on those aimed at seniormanagement, so-called high flyers or high potentials. Who is in a posi-tion seriously to influence future value? Some examples might be:
❏ Senior customer representatives❏ Talent scouts❏ Capable coaches❏ Technical experts❏ Skilled people developers❏ Business-oriented IT systems people.
Capability and Potential 111
People as Assets
Human Asset Worth
= employment costs xindividual asset multiplier(IAM) / 1000
IAM = a function of• capability• potential• contribution• values alignment
THE HUMAN CAPITAL MONITOR
• A system of categorization• Evaluating potential• Open dialog• Realizing potential
Figure 5.7 Potential
The development of depth of expertise in a core competence may be anequally important form of potential and deserves as much attention asbuilding future management—who in any case are not likely to representmore than 10 percent of the organization.
Development and growth have both direction and speed. This com-ponent of the Individual Asset Multiplier could be looked at as in Table 5.4.
THE LANGUAGE OF POTENTIAL
Language gives powerful messages. Since developing our human assets isone of the most important things we do in a value-creating organization,we need to use language with care. A set of descriptions of potential thatreinforce hierarchy and grades will not be consistent with the need todevelop all our capabilities.
It is strongly recommended that the language used always includesthe term “current perception,” such as “CPP—Current Perception ofPotential.” People change in their aspirations, as a result of development,and in how they are seen to have performed.
Systems in use include:
112 The Human Value of the Enterprise
Table 5.4 Evaluating potential
Direction
Upwards hierarchically
Upwards hierarchically
Toward technical orprofessional expert
Toward technical orprofessional expert
Available for lateralmovement
In the right job at the rightlevel, but with a special skillsuch as coaching
In the right job at the rightlevel
Operating at a level beyondcapability
Speed
Fast
Slower
Fast
Slower
As needed
Static
Static
Action—manage problem
Goal
2–3 levels higher
1–2 levels higher
International expert
Company/local expert
Flexible, multiple skills
Expand role; develop tosuperior role competenceplus growing special skill toexpert level
Expand role; develop tosuperior role competence
Position that fits theperson's level
Valuation
1.6–2.0
1.1–1.5
1.6–2.0
1.1–1.5
1.0–1.3
0.5–1.2
0.5–0.9
0.1–0.4
❏ Expected timescale for next promotion—now/+1/+2/+5 years, forexample
❏ Anticipated ultimate grade level❏ Number of levels expected to rise and the speed of doing so.
The third option has been adopted in assessing the potential part of theIndividual Asset Multiplier. The first is too pragmatic and short term; thesecond looks too far ahead.
For example, Consignia (the UK Post Office), in an effort to avoidthe implied connection between potential and hierarchy, talks about lev-els of “stretch.” Unisys has a seven-point classification that recognizes theimportance of the nonpromotable key player, as well as different speedsof anticipated progression. Sainsbury’s categorizes its managers as:
❏ Career manager❏ Restricted mobility manager❏ Stable/expert manager❏ Stable general manager.
HSBC Bank uses a three-dimensional approach to classifying people andtheir contribution, as in Table 5.5.
These examples all recognize and value a range of different kinds ofpotential.
Many organizations find it difficult to be open and transparent withtheir people concerning their views on potential. The case both for andagainst openness is summarized in Table 5.6.
Capability and Potential 113
Table 5.5 Three-dimensional approach to classification
Scope for growth(hierarchical)
1 = ⇑⇑⇑
2 = ⇑⇑
3 = ⇑
4 = ⇔
Short-term value
Key expertise 1–4
Long-term value
Professional/technicaland/or management
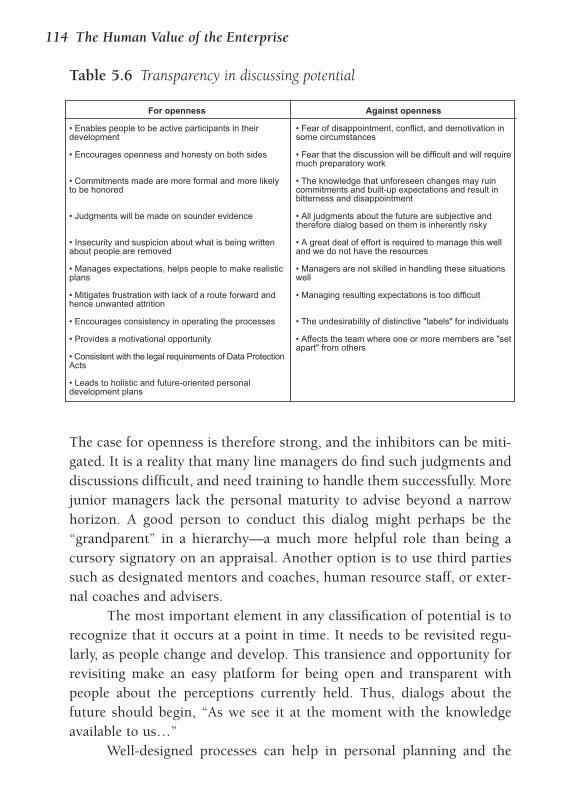
The case for openness is therefore strong, and the inhibitors can be miti-gated. It is a reality that many line managers do find such judgments anddiscussions difficult, and need training to handle them successfully. Morejunior managers lack the personal maturity to advise beyond a narrowhorizon. A good person to conduct this dialog might perhaps be the“grandparent” in a hierarchy—a much more helpful role than being acursory signatory on an appraisal. Another option is to use third partiessuch as designated mentors and coaches, human resource staff, or exter-nal coaches and advisers.
The most important element in any classification of potential is torecognize that it occurs at a point in time. It needs to be revisited regu-larly, as people change and develop. This transience and opportunity forrevisiting make an easy platform for being open and transparent withpeople about the perceptions currently held. Thus, dialogs about thefuture should begin, “As we see it at the moment with the knowledgeavailable to us…”
Well-designed processes can help in personal planning and the
114 The Human Value of the Enterprise
Table 5.6 Transparency in discussing potential
For openness
• Enables people to be active participants in theirdevelopment
• Encourages openness and honesty on both sides
• Commitments made are more formal and more likelyto be honored
• Judgments will be made on sounder evidence
• Insecurity and suspicion about what is being writtenabout people are removed
• Manages expectations, helps people to make realisticplans
• Mitigates frustration with lack of a route forward andhence unwanted attrition
• Encourages consistency in operating the processes
• Provides a motivational opportunity
• Consistent with the legal requirements of Data ProtectionActs
• Leads to holistic and future-oriented personaldevelopment plans
Against openness
• Fear of disappointment, conflict, and demotivation insome circumstances
• Fear that the discussion will be difficult and will requiremuch preparatory work
• The knowledge that unforeseen changes may ruincommitments and built-up expectations and result inbitterness and disappointment
• All judgments about the future are subjective andtherefore dialog based on them is inherently risky
• A great deal of effort is required to manage this welland we do not have the resources
• Managers are not skilled in handling these situationswell
• Managing resulting expectations is too difficult
• The undesirability of distinctive "labels" for individuals
• Affects the team where one or more members are "setapart" from others
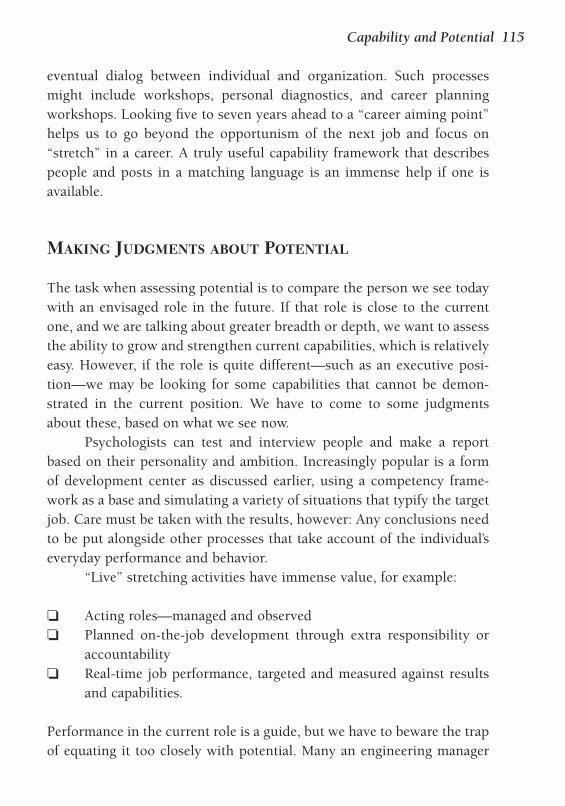
eventual dialog between individual and organization. Such processesmight include workshops, personal diagnostics, and career planningworkshops. Looking five to seven years ahead to a “career aiming point”helps us to go beyond the opportunism of the next job and focus on“stretch” in a career. A truly useful capability framework that describespeople and posts in a matching language is an immense help if one isavailable.
MAKING JUDGMENTS ABOUT POTENTIAL
The task when assessing potential is to compare the person we see todaywith an envisaged role in the future. If that role is close to the currentone, and we are talking about greater breadth or depth, we want to assessthe ability to grow and strengthen current capabilities, which is relativelyeasy. However, if the role is quite different—such as an executive posi-tion—we may be looking for some capabilities that cannot be demon-strated in the current position. We have to come to some judgmentsabout these, based on what we see now.
Psychologists can test and interview people and make a reportbased on their personality and ambition. Increasingly popular is a formof development center as discussed earlier, using a competency frame-work as a base and simulating a variety of situations that typify the targetjob. Care must be taken with the results, however: Any conclusions needto be put alongside other processes that take account of the individual’severyday performance and behavior.
“Live” stretching activities have immense value, for example:
❏ Acting roles—managed and observed❏ Planned on-the-job development through extra responsibility or
accountability❏ Real-time job performance, targeted and measured against results
and capabilities.
Performance in the current role is a guide, but we have to beware the trapof equating it too closely with potential. Many an engineering manager
Capability and Potential 115
should still be an engineer, but has been promoted because it was theonly route forward and because they were the best engineer in the team.Well-defined profiles of the capabilities needed for each role makes itmuch easier to avoid this problem.
Different levels of judgment can be used:
❏ The person’s manager❏ A consensus of several managers❏ Peer consensus❏ Self-assessment❏ Mentor assessment.
The more of these that are combined, the better.
SUMMARY
The essence of individual human capital is the capability that peoplebring to the organization. One of the greatest challenges is to be able todefine and measure its components. Much effort has been expended inthis cause in building competency frameworks, but many of these areheavily biased toward personal behaviors. The evidence is clear that man-agers look for more than this when making job-matching decisions.
Six components of capability were discussed and how they can bemeasured. We will find time and again, when using strategic cause-and-effect staircases, that the level of capability of a particular area is crucialto success.
A person also brings potential to grow, and to do so in differentways. Growing in specialist depth can bring as much future value as hav-ing the ability to be a senior executive. We need a broad understandingof potential, therefore, and a descriptive language that is inclusive. Thecontinuous reassessment of potential is important, as both perceptionsand aspirations change with time. Being open with people about howtheir potential is perceived is recommended, and the earlier we help peo-ple understand what a career means to them, the better.
116 The Human Value of the Enterprise
CHALLENGES FOR ACTION
❏ How is capability defined in your organization? Does it provide a common
language that all managers and employees can relate to easily, and does it
enable objective matching of people against current or future posts?
❏ Do you have measures that enable assessment of the levels of capability that
people have, and help define development objectives?
❏ How inclusive is your approach to description, identification, and assessment
of potential? Do you recognize several kinds of potential that bring value?
❏ How frequently is potential reassessed? How is it done?
❏ How often does an individual get the opportunity to discuss their aspirations
and with whom?
Capability and Potential 117
6 Maximizing HumanCapital
SINCE THE HUMAN CAPITAL AT OUR DISPOSAL IS INDEED OUR MOST
valuable asset in terms of what it can contribute, it deserves to belooked after carefully. This chapter focuses on the ways in whichwe can categorize and record assets, and the examination of three
key processes in managing human capital: acquiring new assets, keepingthose we have, and developing their capability and potential. For each ofthese we consider how success might be measured and the factors thatcan influence it. Planning for human capital investment and reporting onprogress are also covered, as is the effective management of continuityand careers. The chapter extends the first column of the Human CapitalMonitor as in Figure 6.1.
CATEGORIZING HUMAN CAPITAL
Traditional systems for grouping people are based on grade and func-tional structures, and often only in terms of headcount or cost. In thevalue-creating organization, however, we are not interested in boundariesof this kind since they may bear little relationship to either stakeholdersor adding value. Categories that would be of interest include:
❏ Those based on the components of “Individual Asset Multipliers”—What is the distribution of different kinds of potential? Who are the
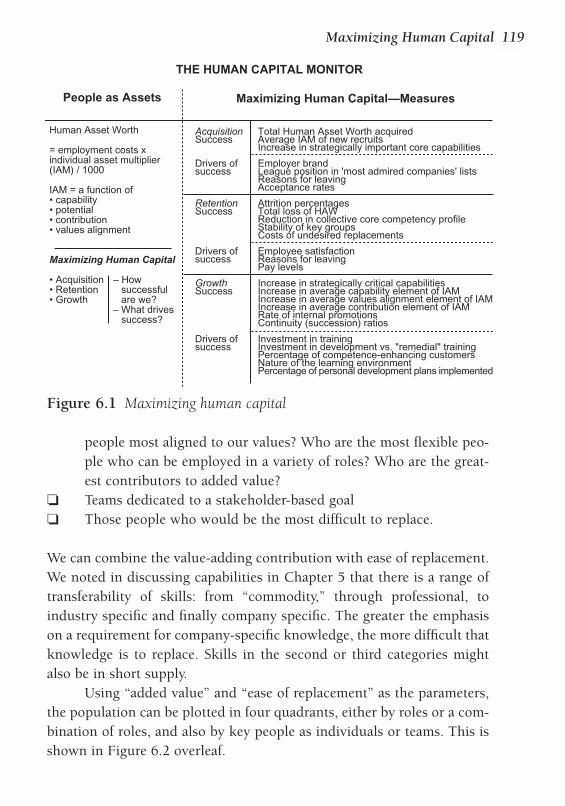
people most aligned to our values? Who are the most flexible peo-ple who can be employed in a variety of roles? Who are the great-est contributors to added value?
❏ Teams dedicated to a stakeholder-based goal❏ Those people who would be the most difficult to replace.
We can combine the value-adding contribution with ease of replacement.We noted in discussing capabilities in Chapter 5 that there is a range oftransferability of skills: from “commodity,” through professional, toindustry specific and finally company specific. The greater the emphasison a requirement for company-specific knowledge, the more difficult thatknowledge is to replace. Skills in the second or third categories mightalso be in short supply.
Using “added value” and “ease of replacement” as the parameters,the population can be plotted in four quadrants, either by roles or a com-bination of roles, and also by key people as individuals or teams. This isshown in Figure 6.2 overleaf.
Maximizing Human Capital 119
People as Assets
Human Asset Worth
= employment costs xindividual asset multiplier(IAM) / 1000
IAM = a function of• capability• potential• contribution• values alignment
Maximizing Human Capital
• Acquisition – How• Retention successful• Growth are we?
– What drivessuccess?
THE HUMAN CAPITAL MONITOR
Maximizing Human Capital—Measures
Total Human Asset Worth acquiredAverage IAM of new recruitsIncrease in strategically important core capabilities
Employer brandLeague position in 'most admired companies' listsReasons for leavingAcceptance rates
Attrition percentagesTotal loss of HAWReduction in collective core competency profileStability of key groupsCosts of undesired replacements
Employee satisfactionReasons for leavingPay levels
Increase in strategically critical capabilitiesIncrease in average capability element of IAMIncrease in average values alignment element of IAMIncrease in average contribution element of IAMRate of internal promotionsContinuity (succession) ratios
Investment in trainingInvestment in development vs. "remedial" trainingPercentage of competence-enhancing customersNature of the learning environmentPercentage of personal development plans implemented
AcquisitionSuccess
Drivers ofsuccess
RetentionSuccess
Drivers ofsuccess
GrowthSuccess
Drivers ofsuccess
Figure 6.1 Maximizing human capital
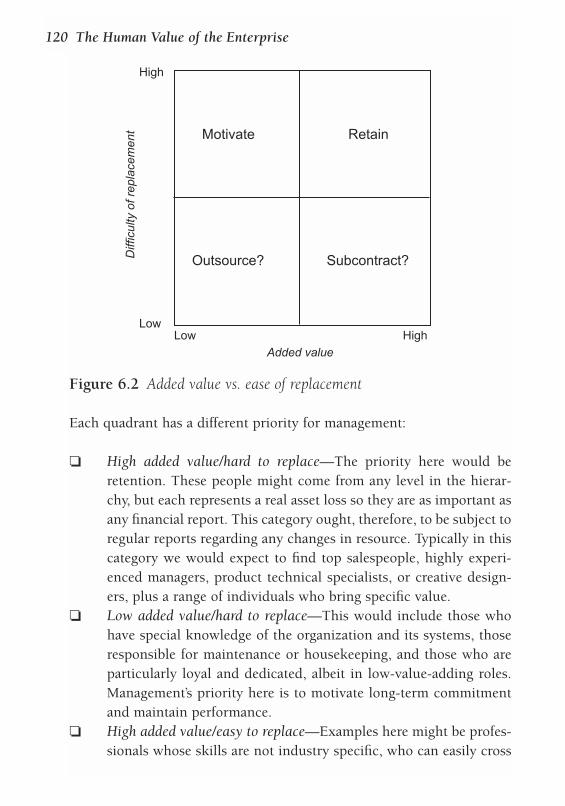
Each quadrant has a different priority for management:
❏ High added value/hard to replace—The priority here would beretention. These people might come from any level in the hierar-chy, but each represents a real asset loss so they are as important asany financial report. This category ought, therefore, to be subject toregular reports regarding any changes in resource. Typically in thiscategory we would expect to find top salespeople, highly experi-enced managers, product technical specialists, or creative design-ers, plus a range of individuals who bring specific value.
❏ Low added value/hard to replace—This would include those whohave special knowledge of the organization and its systems, thoseresponsible for maintenance or housekeeping, and those who areparticularly loyal and dedicated, albeit in low-value-adding roles.Management’s priority here is to motivate long-term commitmentand maintain performance.
❏ High added value/easy to replace—Examples here might be profes-sionals whose skills are not industry specific, who can easily cross
120 The Human Value of the Enterprise
Retain
Subcontract?Outsource?
Motivate
Low High
High
Low
Added value
Diff
icul
ty o
f rep
lace
men
t
Figure 6.2 Added value vs. ease of replacement
organizational boundaries and yet bring significant value. ManyHR people are in this category, as are finance, PR, and legal profes-sionals. They are often self-directed, and management has theoption to subcontract their services, or to use interim resources orconsultants.
❏ Low added value/easy to replace—this group might comprise peo-ple doing routine tasks that are common to many other organiza-tions. Such groups can often provide classic opportunities foroutsourcing.
The traditional HR approach of considering all employees in much thesame way, often on the grounds of a kind of justice or fairness, mightneed rethinking once the organization starts to look at them according tothe value they contribute. More attention will be paid to the retention orgrowth of some groups than others. This need not, of course, cut acrossany equal opportunity policies or programs.
THE HUMAN ASSET REGISTER
Just as we have an “asset register” of more traditional assets, so we wantto keep regular track of what is happening to our “stock” of human cap-ital. Modern information systems can organize data in just about any waythe organization requires it, but the value-creating organization is pri-marily interested in grouping people by stakeholder-facing teams. So aregister would look like the one in Figure 6.3 overleaf.
A key role for HR management, in partnership with operationalcolleagues, consists in the maintenance and growth of this stock ofhuman capital. There are three distinct tasks:
❏ Getting the best people ❏ Keeping them❏ Growing them.
Fortune magazine creates annual league tables of the perceived ability of USfirms to attract, develop, and keep talented people. The pharmaceutical
Maximizing Human Capital 121
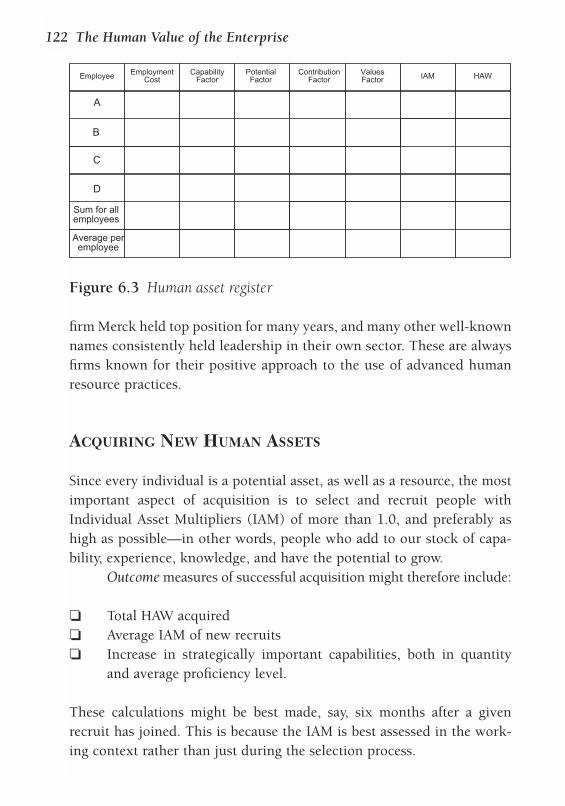
firm Merck held top position for many years, and many other well-knownnames consistently held leadership in their own sector. These are alwaysfirms known for their positive approach to the use of advanced humanresource practices.
ACQUIRING NEW HUMAN ASSETS
Since every individual is a potential asset, as well as a resource, the mostimportant aspect of acquisition is to select and recruit people withIndividual Asset Multipliers (IAM) of more than 1.0, and preferably ashigh as possible—in other words, people who add to our stock of capa-bility, experience, knowledge, and have the potential to grow.
Outcome measures of successful acquisition might therefore include:
❏ Total HAW acquired❏ Average IAM of new recruits❏ Increase in strategically important capabilities, both in quantity
and average proficiency level.
These calculations might be best made, say, six months after a givenrecruit has joined. This is because the IAM is best assessed in the work-ing context rather than just during the selection process.
122 The Human Value of the Enterprise
Employee EmploymentCost
CapabilityFactor
PotentialFactor
ContributionFactor
ValuesFactor IAM HAW
A
B
C
D
Sum for allemployees
Average peremployee
Figure 6.3 Human asset register
If we are to be successful in attracting the best people, we need toensure that potential applicants perceive the organization to be worthjoining. Success will be influenced by employer attractiveness. How canwe understand and monitor this?
Measures of the influences on successful acquisition managementinclude:
❏ Employer brand—regular survey of features seen to be attractive orunattractive
❏ League position in “Most admired companies” lists❏ Reasons for leaving—information about what frustrates people❏ Acceptance rates—percentage of offers made that are accepted.
The employer brand
The word “brand” comes from the Norse for “promise.” It is what iscommunicated—consciously or unconsciously—to every employee orprospective employee. How is our organization perceived by prospectiverecruits, and how do we want to be perceived? What kind of character-istics will attract the people we need? This is more complex than justbeing seen as a good employer or a reputable and well-known one.Employee perceptions are often based on public image, or on whatfriends or relatives might say about an employer for which they haveworked.
It is essential to establish and develop our own particular brand,which might be rather different from our image in the marketplace. Dowe want to attract people who will work many hours, or be especiallyachievement oriented? Do we want the best technical brains we can find?One of the schemes that has greatly aided employer reputations in theUK—particularly smaller ones—has been the “Investors in People”award for investment in training and development. Companies who haveachieved it give a signal that “this is a good place to work.”
Once the brand is defined, our success in marketing it effectivelyneeds to be measured. Those potential recruits who declined an interviewor rejected a job offer will comprise a useful population in this context.Their perceptions can be invaluable in assessing the brand.
Maximizing Human Capital 123
Fortune magazine publishes an annual “America’s Most AdmiredCompanies” list, and other similar lists are available in different coun-tries. In the UK, Management Today publishes a survey of the best Britishcompanies to work for, and in February 2001 the UK Sunday Timesprinted the first of a regular review of the top 50 companies that peopleenjoyed working for most. League tables like these can have a significantinfluence on prospective employees. Universum, a Swedish publisher,surveys annually the companies that MBA graduates want to join. Ofcourse, public admiration may be different from the perception ofknowledgeable professionals. In the US, “admiration” is closely related toprofitability and perhaps the feeling that “share options will grow here.”
Each organization needs to choose its own benchmark list, and seewhere it would like to be. League positions also provide a useful meansof target setting and benchmarking with competitors.
One very effective way of influencing the employer brand is to cre-ate comprehensive links with schools, universities, and the community.Rolls-Royce, for example, has over 200 UK employees who are schoolgovernors, and provides a variety of engineering-related support to edu-cational institutions.
All brands require investment. There are many diverse ways tobuild this type of brand and it takes time, so regular monitoring is vitalto ensure that it is moving in the right direction.
Reasons for leaving analysis
When people leave the organization we can be certain that they will tellmany other people why they have made their choice. Dissatisfied leaversare sure to spread the dirt about your company and work against theimage you may be trying to create. So we need to take the reasons forleaving very seriously. One way to get a more accurate steer on this is toask people three months after they have left what their real reasons were.(In the interests of good relations these are often covered up in the face-to-face exit interview).
Thomas Davenport’s research suggests that “interesting work” isthe main reason people stayed with a company. Most organizations cate-gorize the reasons for people leaving and it is very often the case that the
124 The Human Value of the Enterprise
largest category concerns lack of personal growth and career progress.These are precisely the kind of things that a value-creating organizationwould want to get right.
The numbers of people leaving ought to be analyzed regularly intothe relevant categories. These may be expressed as a percentage of all thepeople leaving. The attrition (labor turnover) analysis, as a whole, shouldthen be conducted according to those groups who are critical to value-creating staircases.
Acceptance rates
The rate of acceptance of job offers is a measure of recruitment effective-ness and also has an impact on the associated costs. But it can also be animportant sign of comfort with what people conclude about the organi-zation and the people they have met—their reaction to an offer is a voteof confidence and vice versa. It makes sense to analyze these by particu-lar kinds of potential recruit. One key area, for example, is the intake ofyoung entrants—typically graduates and postgraduates—since this kindof recruitment, at least in boom times, is characterized by intensecompetition.
The measurement can be calculated, in each category, as the per-centage of offers accepted over, say, the last six months. The particularmethodology will depend to some extent on the frequency and scale ofrecruitment activities overall.
New assets are also acquired through takeovers and alliances. Managingthis effectively is discussed in Chapter 10.
What the value-creating organization looks for in recruiting
The objective in choosing recruits is to increase all of the components ofthe Individual Asset Monitor. So acquiring specific know-how, experi-ence, and know-who capabilities will add to the current stock.Nevertheless, there are some particular skills and attributes that thevalue-creating organization would seek in any recruit:
Maximizing Human Capital 125
❏ Commitment to continuous learning and the ability to learneffectively
❏ Commitment to continuous innovation—always looking for newand better ways
❏ Commitment to personal knowledge management—giving andreceiving knowledge through deliberate sharing
❏ Commitment to continuous change—adaptable, flexible, improve-ment seeking.
There will be evidence of these behaviors both inside and outside thework situation.
In the value-creating organization we focus on much more thanmerely the demands of the current job vacancy. We will be interested inthe potential for other jobs in the future, plus responsibilities that can betaken outside of the job itself, plus bringing knowledge from outside toshare with others. We want to see our new human asset as a long-terminvestment. The current vacancy may be relatively short term in compar-ison to the cumulative service that we may hope for from a new colleaguein the organization.
RETAINING HUMAN ASSETS
Human capital is mobile, but once we have acquired it and maybeinvested in it, we want to hang on to it. In the 1990s in particular, orga-nizations became very laissez-faire about letting people go, accepting thatincreased mobility would be the norm. As the value of human capital hascome to be more appreciated, strategies for retention are now high onmost organizations’ agendas.
People will leave, of course. In markets that are competitive forscarce skills, people and teams will be courted and tempted. In a com-mercial firm, losing a key asset to a competitor is a double loss—not onlydo we not have the benefit, but it might actively work against us. Somesay that the more competitors are tempted to hire your people, the higherthe external view of your human capital worth. This may be true, but itcan also be a signal of other negative factors like your inability to provide
126 The Human Value of the Enterprise
attractive opportunities. Some companies, even in sectors that employhighly marketable skills, are noticeably more successful than others inkeeping their people. Money, in itself, might well be an insufficient rea-son to cause people to move. Loyalty, relationships, a particular type ofwork, or feeling generally comfortable about the organization’s culture,can be enough to keep people. The more people move from job to job,the more they get used to it, however. It is always the first change that isthe hardest to make.
Having said that, why do people choose to stay or leave? It is crit-ical for an organization to understand the causes of voluntary resignation,which can be split into three categories:
❏ Personal reasons (spouse moving; pregnancy, etc.)❏ Dissatisfaction with a “hygiene factor”—pay, supervision,
resources, flexibility of working❏ Dissatisfaction with in an inadequate “motivator”—opportunities,
training, recognition.
The most common reason for people leaving is feeling they aren’t mak-ing progress or have no opportunity. In other words, people are saying:“This organization is ceasing to add value to me; I will take my humancapital and offer it elsewhere.”
In Chapter 2 we discussed the value an organization adds to peo-ple in exchange for loaning their human capital. If they feel that value isinadequate, inevitably it raises the question: “Will I get more elsewhere?”They weigh up the value of any new opportunity relative to the currentone, and offset any psychological, financial, or other costs incurred inmaking a move.
Organizations can often lack imagination and creativity when itcomes to creating appropriate opportunities. Returning expatriates are anobvious example. Headcount constraints, and devolved profit responsi-bilities, can mitigate against what is self-evidently right for the company;namely, keeping the person. The organization can so easily fail to con-sider the good sense in this despite having, at the same time, veritablearmies of consultants and contractors.
The key outcome measure in this area would be attrition itself
Maximizing Human Capital 127
(labor turnover), which perhaps in the future will be known as assetlosses. All losses are expensive if they require replacement, but some areclearly more so than others—especially if they are in the upper right-hand quadrant of Figure 6.2. The cost of unwanted losses is certainlyworth tracking in its own right. They include recruitment and selec-tion—typically 20–35 percent of a year’s remuneration; the lost opportu-nity cost of the value that the person was adding; and the cost of thelearning curve bringing the new recruit up to speed. Best expressed as apercentage of salary, a table can be drawn up (from experience in our ownorganization) for different types of job and the appropriate percentageapplied. For most managers and skilled technical staff this figure will beclose to 100 percent of a year’s remuneration. However, it is not just aquestion of the cost of replacement, but also the value that is lost.
HR departments report attrition as the number of people who haveleft divided by the average headcount for a period. Such figures reflectheadcount thinking. Our emphasis should be much about who has left usand their value to us. If we are using a measure of value such as HumanAsset Worth, we have an ongoing measure of “absolute” loss that can betracked. This can be compared with the acquisition of new HAW referredto above. In a similar way, we should track the loss of key capabilitiesusing the same categorization as for acquisition.
In addition to retaining the individual assets themselves, there isvalue in stability and this would be an additional outcome measure. Theservice–profit chain described by Heskett, Sasser, and Schlesinger, whichhas proved its validity in a number of organizations, links customerretention and employee retention directly, and this is all to do with thestability of relationships between customers and staff. The measure mightbe expressed as the proportion of a particular staff group with more thanx years’ service, or service in a particular field. This would be valuable inlooking at customer service teams, and others where stable relationshipshave particular value.
The factors that influence our success in retention are many andvaried, but particularly reflect the levels of motivation and satisfactionthat people are experiencing within the organization. It seems extraordi-nary that many companies still do not do any kind of employee surveys,or do them so infrequently that they are unable to show any trends or
128 The Human Value of the Enterprise
connections with changes put in place. Cost is often given as a reason.However, the costs involved in compiling financial information areaccepted as essential to the business; again, it is a question of balance.Questions in a survey that particularly affect retention will be as follows:
❏ How important to you are … (list here elements of potential addedvalue to employees such as those listed on page 21: pay, benefits,development, the right tools for the job, etc.)?
❏ How satisfied do you feel with what is provided (for each element)?❏ What is your overall satisfaction with the company?
And the nub of them all:
❏ If you had a better opportunity to go elsewhere tomorrow, whatwould be the likelihood of your taking it?
The percentage of people responding positively to these questions shouldbe regularly tracked, and analyzed appropriately according to group.
We cannot ignore the fact that perceptions of poor pay will alsocause people to leave, even though it is rarely a major reason. So we willcertainly want to track our position in the market, especially for the keyskills that are strategically important.
To summarize, outcome measures of successful retention manage-ment are:
❏ Attrition percentages of key groups derived from cause-and-effectstaircases
❏ Total loss of Human Asset Worth, both as an absolute amount andas a percentage of the current stock
❏ Changes in the collective proficiency level of core capabilities ❏ Stability—percentage of key groups with more than x years’ service❏ Cost of undesired replacements.
Measures of the influences on successful retention management include:
❏ Employee satisfaction—regular survey of levels of satisfaction,
Maximizing Human Capital 129
particularly areas of frustration relative to the areas of adding valueto people
❏ Reasons for leaving—further information about what frustratespeople
❏ Pay levels—position in the market for key skills.
Practical approaches to retention
Retaining the best human assets is an absolute priority in the value-creating organization. When retention is managed effectively, the organi-zation is never taken by surprise. There are some fundamental means ofensuring that this is done well.
Understanding what drives and motivates each individual There are various instruments available to assess this, such as the WorkInterests Schedule developed by John Hunt of the London BusinessSchool, and the well known Myers-Briggs Type Indicator. However, themost important practice is regular and continuing dialog with peopleabout how they feel about their work and the organization.
Every decision to leave is a combination of “push” and “pull” fac-tors. Pull factors come from opportunities for new pastures that arebrought to someone’s attention. With the continual extension of theheadhunter’s reach, one does not have to be an executive to “get the call.”If the would-be seducer strikes fertile ground where there are alreadypush factors—various elements of dissatisfaction—it is a slippery slope tothe employee leaving.
Dialog with key individuals needs to be very regular, and muchmore frequent than the once-a-year exercise of the typical appraisal dis-cussion. When people are identified having a number of single days off,or seen scanning the appointments pages and websites, it may be too late!
At the World Economic Forum in Davos, Switzerland in 2001, Dr.David Finegold of the University of Southern California presented apaper on employee retention in high-tech companies. He argued thatwhat employees say is important to them (in surveys and focus groups)does not necessarily match the way they behave. He particularly pin-pointed the fact that employees tend to say that work–life balance is
130 The Human Value of the Enterprise
important, but he showed statistically that there was no correlationbetween working excessive hours and people leaving. Nor was pay a greatinfluence (other than for the very youngest employees), except for stockoptions. These mattered considerably to people, along with careeradvancement and the opportunity for innovation and risk.
Having a flexible approach to employment conditionsThe value-creating organization will make available to all employees thesame processes of performance review, career planning, application forpromotion, and so on. This does not mean that it will treat everyone inthe same way as a result. What motivates individuals is so variable thatwe need a great deal of flexibility to meet people’s needs. There are manyoptions for working time and place, flexible benefit policies, and a vari-ety of reward strategies, for example.
In large companies, this kind of flexibility can sometimes beachieved by spinning off various units into separate entities, each with itsown rules. For example, IPC, a large UK publisher, created a reduction inturnover of vital IT staff from 20 to 2 percent in 1999 by moving 50 e-commerce staff into a discrete company called IPC Electric. The neworganization created its own approach to remuneration, and effectively aquite different culture: informal dress code, office layouts suiting thestaff, flexible hours, and so on. This initiative included a share scheme inthe new company that was an incentive to all employees to stay.
Providing an environment that minimizes dissatisfaction factors andmaximizes satisfiersThis is such a significant influence that the next chapter is devoted to itin detail. Surveys show that the most common source of stress is the rela-tionship with the boss, although many other factors can cause people tolook elsewhere. This is one argument for reducing the sanctity of theboss–subordinate relationship, and involving third parties such ascoaches and mentors.
Creating an attractive futureOne increasingly common strategy for retention is providing employeeswith equity, or another form of long-term reward, to tie them into the
Maximizing Human Capital 131
longer term or some more specific point in the future. This future can berolled forward through new awards each year. It is not always easy to rad-ically change the salary base of those whom we particularly want to keep.Nevertheless, rewarding contribution to added value through long-termincentives can be both discriminating, based on the different levels ofcontribution, and attractive to the individual.
There are other kinds of future that provide incentives to stay.These include the anticipation of promotion or greater responsibility;planned expansion and diversification that will bring new opportunities;involvement in some special aspect of the organization outside the cur-rent job that might hold particular appeal; the opportunity for an inter-national assignment; or the promise of early retirement.
Do employees return?
Few companies today would take the view that once a valued employeehas left they should not be allowed to return. When I failed to save thehigh-potential graduates in ICL who wanted a new and different experi-ence, I would say: “I am happy for you to take an ‘external secondment,’it will make you much more valuable when you return!” If they went offto another organization I kept track of them, even inviting them to com-pany graduate events, recognizing the importance of maintaining the net-work. We invited some of them to tell us what they were doing—asignificant number were now suppliers or customers of ICL. They werestill stakeholders, but in a different category.
Consultancy McKinsey trains its people well, even in the know-ledge that it might lose a large proportion of them. What is important isthat it wants to ensure that every leaver feels positively about the firm.There is a good chance these ex-employees, in any new role, might wellbe looking for the kinds of services that McKinsey provides. Effectively,the firm is protecting and growing potential revenue. It would be hard totrack, but what a great measure of intellectual capital: Ex-employees whonow bring revenue into the company!
132 The Human Value of the Enterprise
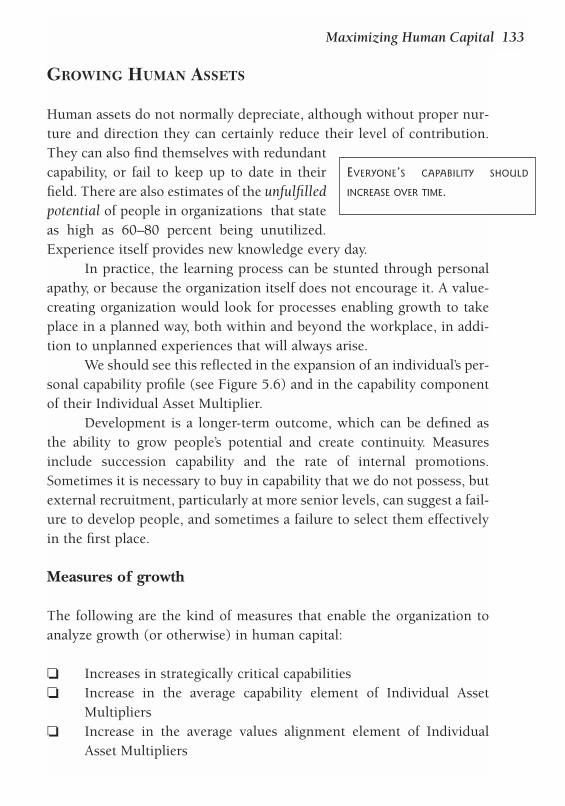
GROWING HUMAN ASSETS
Human assets do not normally depreciate, although without proper nur-ture and direction they can certainly reduce their level of contribution.They can also find themselves with redundantcapability, or fail to keep up to date in theirfield. There are also estimates of the unfulfilledpotential of people in organizations that stateas high as 60–80 percent being unutilized.Experience itself provides new knowledge every day.
In practice, the learning process can be stunted through personalapathy, or because the organization itself does not encourage it. A value-creating organization would look for processes enabling growth to takeplace in a planned way, both within and beyond the workplace, in addi-tion to unplanned experiences that will always arise.
We should see this reflected in the expansion of an individual’s per-sonal capability profile (see Figure 5.6) and in the capability componentof their Individual Asset Multiplier.
Development is a longer-term outcome, which can be defined asthe ability to grow people’s potential and create continuity. Measuresinclude succession capability and the rate of internal promotions.Sometimes it is necessary to buy in capability that we do not possess, butexternal recruitment, particularly at more senior levels, can suggest a fail-ure to develop people, and sometimes a failure to select them effectivelyin the first place.
Measures of growth
The following are the kind of measures that enable the organization toanalyze growth (or otherwise) in human capital:
❏ Increases in strategically critical capabilities ❏ Increase in the average capability element of Individual Asset
Multipliers❏ Increase in the average values alignment element of Individual
Asset Multipliers
Maximizing Human Capital 133
EVERYONE’S CAPABILITY SHOULD
INCREASE OVER TIME.
❏ Increase in the average contribution element of Individual AssetMultipliers
❏ Rate of internal promotions❏ Continuity (succession) ratios.
Success will be influenced by factors such as those that follow.
Investment levelsMuch of the investment in training and development programs is an actof faith (as illustrated by the frequent vagueness of objectives), or a con-sequence of budgetary allocation (related to a previous year), or both. Itshould, of course, be based on the needs of the organization at the time.
Accounting for the costs of training and development rarely distin-guishes between that which is needed for maintenance and that which isan investment for the future. The former is about creating a higher currentcontribution through better knowledge and skills. The latter is concernedwith growing individuals (or teams) to enable them to contribute more ordifferently in the future. In Siemens’ annual report, for example, expendi-ture on training is positioned alongside that on R&D and capital expendi-ture, giving the clear message that these are all seen as investments.
One budgetary allocation might cover all the following elements.The first of these is a genuine expense; the others are investments aimedat a return through more effective future contributions:
❏ Training new recruits in the essentials of their jobs and thebusiness
❏ Increasing the personal effectiveness of employees in order toimprove current value contribution
❏ Increasing current added value (such as in the use of new systemsand better methodologies)
❏ Developing expertise and potential so that people can contribute ata higher level of value in the future.
The overall investment in this area can be quoted in various ways, forexample:
134 The Human Value of the Enterprise
❏ A percentage of the pay costs of the organization or group (typi-cally between 3 and 8 percent)
❏ A percentage of revenues (typically 1–3 percent) ❏ Training days per person per year (between 2 and 10).
So much learning happens through real work experiences that the nor-mal measurement of what takes place off the job is a limited indicator. Itis an easy one, nevertheless, and a reasonable measure of commitment topeople development. It also has the advantage of being a standard bench-marking measure.
Competence-enhancing customers Celemi, a Swedish learning and change consultancy, uses an interestingconcept. Recognizing that some of its customers provide unique learningopportunities to its business, it introduced the measure of “percentage ofcustomers who are competence enhancing.” Its particular interest is theextent to which a given customer can bring new knowledge to the firmas a whole. Individuals who benefit from customer knowledge pass itaround to ensure that it is shared.
The learning environmentThe underlying culture and climate of the organization are discussed inChapter 8. A key part of this is the focus on learning and development.One factor is how supportive people find the culture in terms of theirown learning. The existence and successful implementation of personaldevelopment plans form a way of measuring this.
To summarize, measures of the influences on success in growth manage-ment include:
❏ Investment in training—increasing current capability—as a per-centage of payroll costs
❏ Investment in development, compared with expenditure that isremedial or training aimed at maintaining current value
❏ Percentage of customers who are competence enhancing❏ The nature of the learning environment, measured by surveys
Maximizing Human Capital 135
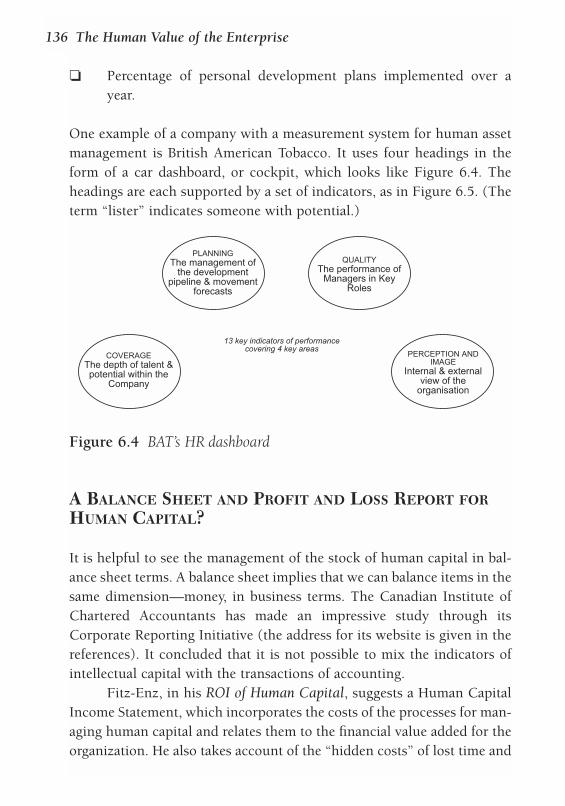
❏ Percentage of personal development plans implemented over ayear.
One example of a company with a measurement system for human assetmanagement is British American Tobacco. It uses four headings in theform of a car dashboard, or cockpit, which looks like Figure 6.4. Theheadings are each supported by a set of indicators, as in Figure 6.5. (Theterm “lister” indicates someone with potential.)
A BALANCE SHEET AND PROFIT AND LOSS REPORT FORHUMAN CAPITAL?
It is helpful to see the management of the stock of human capital in bal-ance sheet terms. A balance sheet implies that we can balance items in thesame dimension—money, in business terms. The Canadian Institute ofChartered Accountants has made an impressive study through itsCorporate Reporting Initiative (the address for its website is given in thereferences). It concluded that it is not possible to mix the indicators ofintellectual capital with the transactions of accounting.
Fitz-Enz, in his ROI of Human Capital, suggests a Human CapitalIncome Statement, which incorporates the costs of the processes for man-aging human capital and relates them to the financial value added for theorganization. He also takes account of the “hidden costs” of lost time and
136 The Human Value of the Enterprise
PLANNINGThe management of
the developmentpipeline & movement
forecasts
QUALITYThe performance of
Managers in KeyRoles
COVERAGEThe depth of talent &potential within the
Company
PERCEPTION ANDIMAGE
Internal & externalview of the
organisation
13 key indicators of performancecovering 4 key areas
Figure 6.4 BAT’s HR dashboard
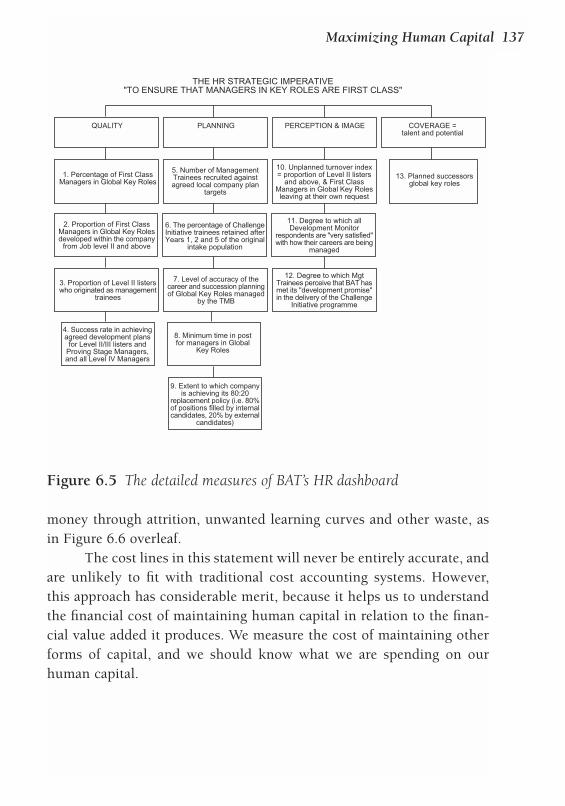
money through attrition, unwanted learning curves and other waste, asin Figure 6.6 overleaf.
The cost lines in this statement will never be entirely accurate, andare unlikely to fit with traditional cost accounting systems. However,this approach has considerable merit, because it helps us to understandthe financial cost of maintaining human capital in relation to the finan-cial value added it produces. We measure the cost of maintaining otherforms of capital, and we should know what we are spending on ourhuman capital.
Maximizing Human Capital 137
THE HR STRATEGIC IMPERATIVE"TO ENSURE THAT MANAGERS IN KEY ROLES ARE FIRST CLASS"
QUALITY PLANNING PERCEPTION & IMAGE COVERAGE =talent and potential
1. Percentage of First ClassManagers in Global Key Roles
5. Number of ManagementTrainees recruited againstagreed local company plan
targets
10. Unplanned turnover index= proportion of Level II listers
and above, & First ClassManagers in Global Key Rolesleaving at their own request
13. Planned successorsglobal key roles
2. Proportion of First ClassManagers in Global Key Rolesdeveloped within the company
from Job level II and above
6. The percentage of ChallengeInitiative trainees retained afterYears 1, 2 and 5 of the original
intake population
11. Degree to which allDevelopment Monitor
respondents are "very satisfied"with how their careers are being
managed
7. Level of accuracy of thecareer and succession planningof Global Key Roles managed
by the TMB
12. Degree to which MgtTrainees perceive that BAT hasmet its "development promise"in the delivery of the Challenge
Initiative programme
9. Extent to which companyis achieving its 80:20
replacement policy (i.e. 80%of positions filled by internalcandidates, 20% by external
candidates)
3. Proportion of Level II listerswho originated as management
trainees
4. Success rate in achievingagreed development plans
for Level II/III listers andProving Stage Managers,and all Level IV Managers
8. Minimum time in postfor managers in Global
Key Roles
Figure 6.5 The detailed measures of BAT’s HR dashboard
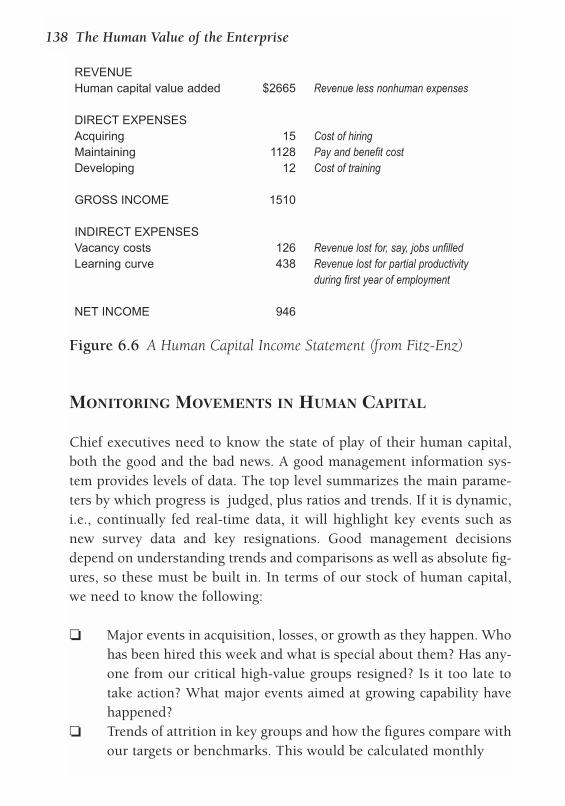
MONITORING MOVEMENTS IN HUMAN CAPITAL
Chief executives need to know the state of play of their human capital,both the good and the bad news. A good management information sys-tem provides levels of data. The top level summarizes the main parame-ters by which progress is judged, plus ratios and trends. If it is dynamic,i.e., continually fed real-time data, it will highlight key events such asnew survey data and key resignations. Good management decisionsdepend on understanding trends and comparisons as well as absolute fig-ures, so these must be built in. In terms of our stock of human capital,we need to know the following:
❏ Major events in acquisition, losses, or growth as they happen. Whohas been hired this week and what is special about them? Has any-one from our critical high-value groups resigned? Is it too late totake action? What major events aimed at growing capability havehappened?
❏ Trends of attrition in key groups and how the figures compare withour targets or benchmarks. This would be calculated monthly
138 The Human Value of the Enterprise
REVENUEHuman capital value added $2665 Revenue less nonhuman expenses
DIRECT EXPENSESAcquiring 15 Cost of hiringMaintaining 1128 Pay and benefit costDeveloping 12 Cost of training
GROSS INCOME 1510
INDIRECT EXPENSESVacancy costs 126 Revenue lost for, say, jobs unfilledLearning curve 438 Revenue lost for partial productivity
during first year of employment
NET INCOME 946
Figure 6.6 A Human Capital Income Statement (from Fitz-Enz)
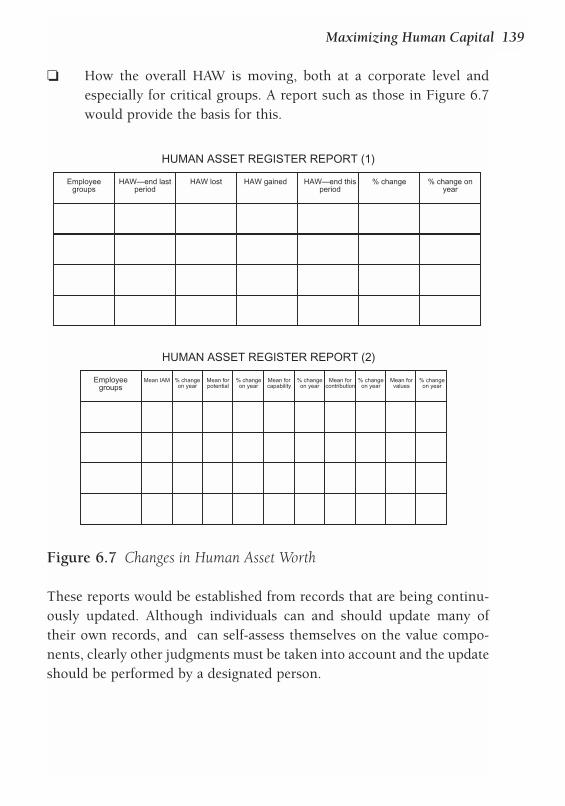
❏ How the overall HAW is moving, both at a corporate level andespecially for critical groups. A report such as those in Figure 6.7would provide the basis for this.
These reports would be established from records that are being continu-ously updated. Although individuals can and should update many oftheir own records, and can self-assess themselves on the value compo-nents, clearly other judgments must be taken into account and the updateshould be performed by a designated person.
Maximizing Human Capital 139
Employeegroups
HAW—end lastperiod
HAW lost HAW gained HAW—end thisperiod
% change % change onyear
HUMAN ASSET REGISTER REPORT (1)
Employeegroups
HUMAN ASSET REGISTER REPORT (2)
Mean IAM % changeon year
Mean forpotential
Mean forcapability
Mean forcontribution
Mean forvalues
% changeon year
% changeon year
% changeon year
% changeon year
Figure 6.7 Changes in Human Asset Worth
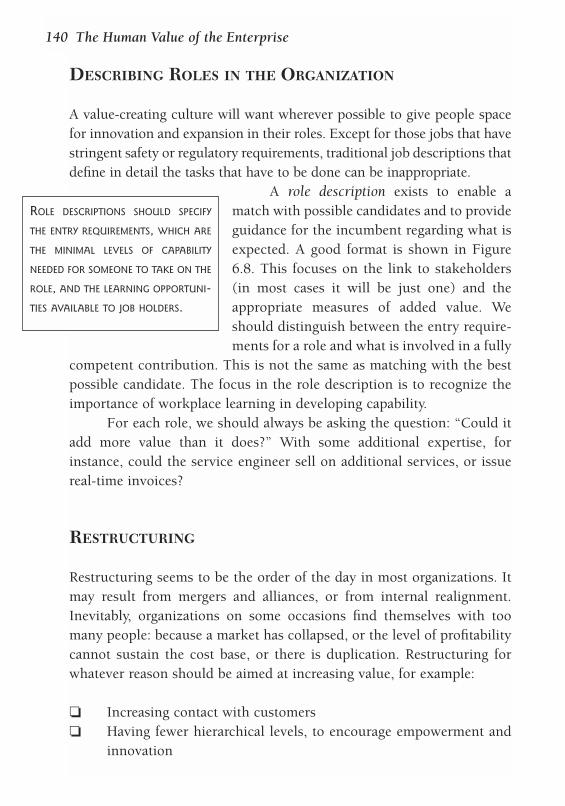
DESCRIBING ROLES IN THE ORGANIZATION
A value-creating culture will want wherever possible to give people spacefor innovation and expansion in their roles. Except for those jobs that havestringent safety or regulatory requirements, traditional job descriptions thatdefine in detail the tasks that have to be done can be inappropriate.
A role description exists to enable amatch with possible candidates and to provideguidance for the incumbent regarding what isexpected. A good format is shown in Figure6.8. This focuses on the link to stakeholders(in most cases it will be just one) and theappropriate measures of added value. Weshould distinguish between the entry require-ments for a role and what is involved in a fully
competent contribution. This is not the same as matching with the bestpossible candidate. The focus in the role description is to recognize theimportance of workplace learning in developing capability.
For each role, we should always be asking the question: “Could itadd more value than it does?” With some additional expertise, forinstance, could the service engineer sell on additional services, or issuereal-time invoices?
RESTRUCTURING
Restructuring seems to be the order of the day in most organizations. Itmay result from mergers and alliances, or from internal realignment.Inevitably, organizations on some occasions find themselves with toomany people: because a market has collapsed, or the level of profitabilitycannot sustain the cost base, or there is duplication. Restructuring forwhatever reason should be aimed at increasing value, for example:
❏ Increasing contact with customers❏ Having fewer hierarchical levels, to encourage empowerment and
innovation
140 The Human Value of the Enterprise
ROLE DESCRIPTIONS SHOULD SPECIFY
THE ENTRY REQUIREMENTS, WHICH ARE
THE MINIMAL LEVELS OF CAPABILITY
NEEDED FOR SOMEONE TO TAKE ON THE
ROLE, AND THE LEARNING OPPORTUNI-
TIES AVAILABLE TO JOB HOLDERS.
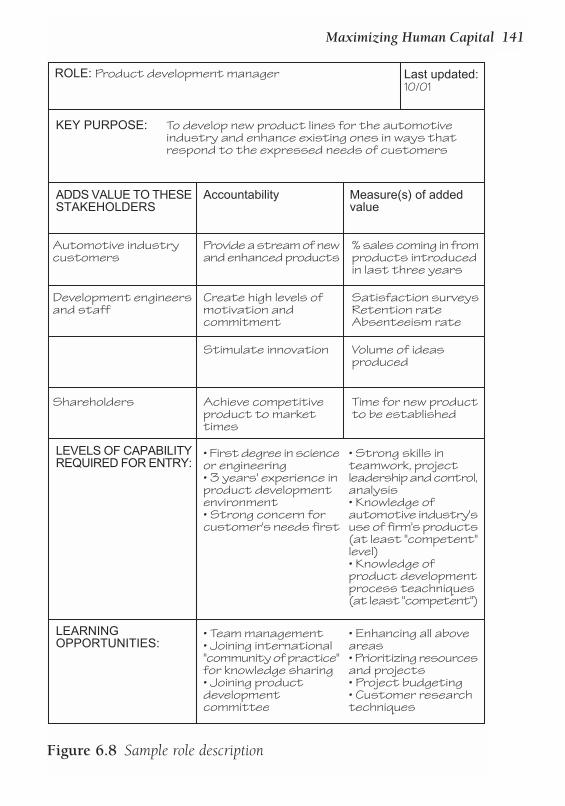
Maximizing Human Capital 141
ROLE: Product development manager Last updated:10/01
KEY PURPOSE: To develop new product lines for the automotive industry and enhance existing ones in ways that respond to the expressed needs of customers
ADDS VALUE TO THESESTAKEHOLDERS
Accountability Measure(s) of addedvalue
Automotive industrycustomers
Provide a stream of newand enhanced products
% sales coming in fromproducts introducedin last three years
Development engineersand staff
Create high levels ofmotivation andcommitment
Satisfaction surveysRetention rateAbsenteeism rate
Stimulate innovation Volume of ideasproduced
Shareholders Achieve competitiveproduct to markettimes
Time for new productto be established
LEVELS OF CAPABILITYREQUIRED FOR ENTRY:
• First degree in scienceor engineering• 3 years' experience inproduct developmentenvironment• Strong concern forcustomer's needs first
• Strong skills inteamwork, projectleadership and control,analysis• Knowledge ofautomotive industry'suse of firm's products(at least "competent"level)• Knowledge ofproduct developmentprocess teachniques(at least "competent")
LEARNINGOPPORTUNITIES:
• Team management• Joining international"community of practice"for knowledge sharing• Joining productdevelopmentcommittee
• Enhancing all aboveareas• Prioritizing resourcesand projects• Project budgeting• Customer researchtechniques
Figure 6.8 Sample role description
❏ Eliminating non-added-value work❏ Eliminating duplication.
Some reductions are over such a long term that natural wastage takes careof the reduction. We are happy to lose people who have low IAM factors.However, there will be times when a job is not available for a valuableperson. Do we let them negotiate a package? Or should we send themunwillingly to the outplacement firm? Do we in fact provide incentivesfor people to leave, such as beneficial early retirement, enhanced redun-dancy terms, funded retraining, part-time opportunities, and so on?When IBM underwent a massive staff reduction in the early 1990s itcould claim that it never forced any individual to take redundancy.However, it offered such a high level of incentive in some countries thatdeparture became impossible to refuse.
Indiscriminately allowing every person who puts up their hand totake advantage of these benefits is clearly not in the interests of a value-creating organization. Losing significant amounts of human asset worthhas happened many times, only for the organization to find that uniqueknowledge and capabilities have to be bought back from the individualsunder a completely different type of contract, both written and psycho-logical. By then the apparent cost saving has gone on the record.
Computer services company ICL has for many years had a unitcalled Linkwise. This is a pool of people whose jobs have disappeared andwho are available for new assignments. They are used as a resource to topup projects or do temporary assignments, until they find a new post. Thisis an approach clearly compatible with valuing human capital.
MANAGING CONTINUITY
Providing the organization with continuity—a better term than “succes-sion planning”—is of undoubted value in itself. Porras and Collins(1994), in their well-known study of visionary companies, found conti-nuity of management to be a major factor in success, together with themaintenance of a distinctive culture to which all employees were aligned.Successful visionary companies carefully developed, promoted, and
142 The Human Value of the Enterprise
selected managerial talent from inside the company. Across a total of1,700 years of company history studied, there were only four individualcases of an outsider coming directly into the role of chief executive.
Although there is always the attraction of bringing in new bloodand capability, the evidence is that a primary policy of growing our ownassets is a better strategy for long-term value. There is no doubt that anorganization that seeks to promote internally wherever possible, andmakes everyone aware of this, encourages retention of its talent.Continuity planning becomes a key process. The ideal is to have peoplein the right place with the right capabilities at the right time. We needcontinuity in all the key added-value areas in the business, not just man-agement, particularly where the knowledge of the organization, its cul-ture, and its people is a major contributor to performance.
In the dynamic environment, building a continuity plan on thebasis of existing organizational “boxes” (which so often deploys the samenames in several boxes) is unlikely to be the best approach. Linked withbusiness development, our concern is whether we have enough “pools”of specific potential to meet our future requirements. Looking for clonesof existing leaders can be a dangerous, but easy, trap to fall into. However,there will be certain roles for which we will want to know if we have suc-cession: the CEO, for example, and some critical posts that would be par-ticularly difficult or undesirable to fill from outside.
Regular auditing of talent and continuity is a feature of the value-creating organization. We would like to know:
❏ The proportion of a population with “high” and “some” potentialin each of the areas we believe are critical to success
❏ The availability of specified pools of succession capability❏ The percentage of promotions resourced from inside❏ The cost of recruitment due to inadequate succession.
Human capital reviews
Discussions of talent and how we manage it are a fundamental process inthe value-creating organization. Some have annual rituals, where seniormanagers gather to discuss their management resources and their high
Maximizing Human Capital 143
flyers, sharing judgments on performance and potential, reviewing suc-cession, and making plans for some people. This is most likely to be donefunction by function and department by department. However, in addi-tion there should be a focus on those core capabilities that add the keyareas of value to stakeholders, and that will take us beyond the often lim-ited population that is normally reviewed.
At the other extreme, people movement and development are amonthly item on the executive agenda. In this case, the topic is oftenrushed, however. No business is static and decisions are continuallybeing made on people movement, so the annual discussion is soon out ofdate.
The optimum is a regular meeting of a dedicated and representativegroup of executives, suitably empowered by the board. They should meetas frequently as the pace of change demands—probably every one to fourmonths—and be involved in reviewing each unit of organization andeach individual in the defined target population, as follows:
❏ Reviewing the role requirements and capabilities needed to meetthe demands of the future
❏ Setting measures and targets for people development and monitor-ing achievement
❏ Reviewing the state of continuity in key areas❏ Continual monitoring of the positions and people who are key in
adding value❏ Making recommendations on plans for individuals and filling
vacancies that arise❏ Maintaining functional capability, through recommending specific
training and development programs as needs dictate❏ Ensuring that the necessary data maintenance is adequately
resourced.
We would expect this group to have a continuing interest in the HumanAsset Worth registers.
Part of managing talent is to be aware of the special opportunitiesthat the organization has to offer. There are always some positions thatoffer unique learning opportunities. For example, many headquarters
144 The Human Value of the Enterprise
jobs provide a helicopter view of the organization and give external con-tacts. Roles involving business planning, international operations, ormanaging alliances are other examples. There are positions in every func-tion that do not require in-depth previous knowledge or experience, butwhere personal capabilities provide a sufficient platform for transfer.These enable a person to change function and quickly be effective. Suchpositions need to be identified and kept unblocked and available for indi-viduals’ career progression.
Career management
Dialog with employees about their ambitions is an important part of thevalue-creating organization. Personal aspirations and corporate judg-ments must be matched and modified as needed. Not only do we knowthat many people leave because they are frustrated at not knowing whatmight be planned for them, all discussions about personal growth arefundamental to human capital management. Yet many organizations shyaway from an open discussion, for the same reasons that we listed inChapter 5 in respect of potential. They mostly do so out of fear: of con-frontation, of creating expectations that might not be realized, of expos-ing what might be an unsubstantiated judgment, of demotivatingsomeone at the wrong time. They also do so out of a feeling of inade-quacy, that maybe there is no plan for the individual, or that discussionsabout potential have been merely cursory.
Despite most employees’ suspicions of behind-the-scenes careerplotting, many organizations do not have plans for career developmentfor the majority of people. Arguably, such plans are a poor use of timeanyway, since life brings so much uncertainty and turbulence. At leastthere should be a view of direction and speed and, depending on thedirection, some critical kinds of experience that are required as a guide tonext steps.
It is part of the popular rhetoric to tell people that they are respon-sible for their careers. Certainly, they should feel ownership. Most orga-nizations advertise jobs openly, at least up to the level below the definedsenior management group. Many now have web-based systems, withintranet application. However, there are limits to an individual’s ability to
Maximizing Human Capital 145
make things happen. Self-development, unchanneled and unadvised, canbe wrongly directed and counter-productive. If people have to rely solelyon keeping their eyes open for the right opportunity and applying for it,they may well find it very hard to get through the doors of a new func-tion and cross a boundary. Disappointment and demotivation can set in.
The benefit of dialog is that with a common agreement betweenindividual and organization, help can be provided where it is needed.Sometimes it is in the longer-term interest of the organization not to takethe best-qualified person for the job, since that implies the person withthe least to learn. A good network of mentors can help significantly here,opening the doors that an individual may find it hard to do on their own.
Should the organization manage careers behind the scenes? Somecontinue to do so, such as ExxonMobil, which believes that this enablesit to develop people in a systematic way to meet its future needs. In thevalue-creating organisation we just want to make sure that we are devel-oping potential, providing continuity, and retaining our best people. Atthe very least, we are going to plan together with those people, and thensee what can be coordinated as we merge the individual plans. Inevitably,we will take more interest in those who are seen to be future senior man-agers. They need to cross organizational boundaries (such as functionsand countries) to broaden their experience and may require some assis-tance in doing so.
HUMAN CAPITAL BUDGETING AND PLANNING
A human capital investment plan will be built around the strategic andstakeholder value staircases discussed on page 16. The organization’s
requirements—for example, for increasedcapability or accelerating the readiness of peo-ple with potential—will be compared withwhat is in the Human Asset Worth register.
Capital investments are typically sub-ject to tests of rate of return. Where the valueadded is going to be financial, we can developformulae based on the net present value of
146 The Human Value of the Enterprise
A VALUE-CREATING ORGANIZATION
WILL PLAN FOR CHANGES IN ITS
HUMAN CAPITAL BUDGET ALONGSIDE
ITS BUDGET FOR PEOPLE-RELATED
EXPENSES.
expected returns. If it is nonfinancial, we have to make a judgment as tothe impact of the investment on the strategic staircase. Take investmentin a business school program for executives. This will have capabilityobjectives (in knowledge and networking), and perhaps expectations ofgreater leadership effectiveness, or cultural change. Each of these may belinked through to a specific strategic goal, and we assume a logic that saysthat a percentage improvement in these parameters feeds up the system,influencing the desired result in due course.
Resources are always limited. Not every category of stakeholdervalue has the same merit, and it is a matter of careful judgment as to whogets the priority for investment. Our desired outcome is long-term share-holder return, and first priority goes to investments aimed at future earn-ings streams. Some investments are directed to avoiding valuesubtraction, such as in image or employee retention. Therefore, eachinvestment needs to be rated against:
❏ Impact on strategic business goals❏ Impact on future income streams❏ Impact on critical increases in stakeholder value measures❏ Avoidance of unwanted value loss or expense.
SUMMARY
Managing the stock of human capital, as reflected in a register of HumanAsset Worth, is arguably the most critical activity of management. First,we need to categorize people according to their capacity to delivervalue—a function of their role and personal application. This gives ussome direction about who the vital human assets are in the organization,and the extent of attention that should be given to them. A human assetregister will help us make intelligent decisions when restructuring, sothat high-value people are retained if at all possible.
The key processes for managing our human capital are acquisition,retention, and growth. In the value-creating organization these needalways to be approached with value in mind, which means thinking ofstakeholders and the long term in addition to any immediate needs. Each
Maximizing Human Capital 147
of these areas deserves its own measures of success and indicators for thefactors that influence that success the most.
Growing and developing people are fundamental activities for anorganization dedicated to future value. They require a range of roles,skills, and processes that demand disciplined involvement throughout. Acharacteristic of the value-creating organization lies in the prevalence andimportance given to individual development plans.
The major part of learning comes from experience, and the way wemanage the provision of new job opportunities is a vital activity.Traditional role specifications tend to describe the capability required ofa fully competent person. The learning opportunities that are provided byeach role should be carefully identified, and the requirements to enter ajob should be as low as possible.
Managing continuity has the dual goals of developing individualsand meeting the human capital needs of the organization in the future.Processes for both are needed.
Finally, just as we budget for the expenses related to people, so weshould make a plan for human capital investment that is clearly linked toour strategic and stakeholder value goals.
CHALLENGES FOR ACTION
❏ How do you classify people in your organization? Does the method have any
relation to value added?
❏ What would be needed for you to be able to understand the value that is
added by individuals and teams?
❏ Do you have any kind of register of the overall value that people contribute?
❏ Looking at who left the organization in the last year, who do you regard as a
major asset loss and why?
❏ How do you measure your attractiveness as an employer?
❏ What is your data on retention/attrition telling you? Is it giving you the real
information needed for retention management?
❏ Do you have measures for employee growth and continuity?
❏ Do you know the costs of managing human capital processes?
❏ How is talent managed in your organization? When and how is it discussed?
148 The Human Value of the Enterprise
How often are there surprises?
❏ What is your investment in training and development compared to that of
competitors?
❏ Do your people have personal development plans? Do you know the extent
to which these are implemented? Do people feel that the environment
encourages continuous learning, sharing, and innovation? When and how did
you last check?
❏ What is your process for continuity management and the movement of
people?
❏ How does the movement of people between jobs take place? Is there a sen-
sible balance between personal responsibility and corporate assistance?
❏ How are roles described? Do they distinguish between entry criteria and
learning opportunities?
❏ Do you make a human capital investment plan alongside budgeting for the
costs of employing people?
Maximizing Human Capital 149
7Motivation andCommitment
PEOPLE BRING THEIR PERSONAL HUMAN CAPITAL, IN ALL ITS DIVERSITY, toour organization and we may nurture and develop it. But whatis it that influences and enables them to give superior perfor-mance? We can have people with enormous capability, yet who
fail to realize the contribution that they could make. They may lack com-mitment or motivation. Perhaps their efforts are misdirected, or they arepursuing their own personal agenda. People in organizations operate inan environment, which we may think of as a soil—the basic underlyingculture—and a climate, which is more transient and local. Together theyaffect, as with plants, the output and growth of people.
In this chapter we will look at motivation itself and the indicatorsof whether it is high or low. We then examine aspects of organizationalculture and local climate that influence motivation, and how these canalso be measured.
In other words, we come to the second column of the HumanCapital Monitor (Figure 7.1). First, we need indicators of the evidence ofmotivation and commitment, and secondly, measures for the contribut-ing influences. We have five of these, listed in Table 7.1.
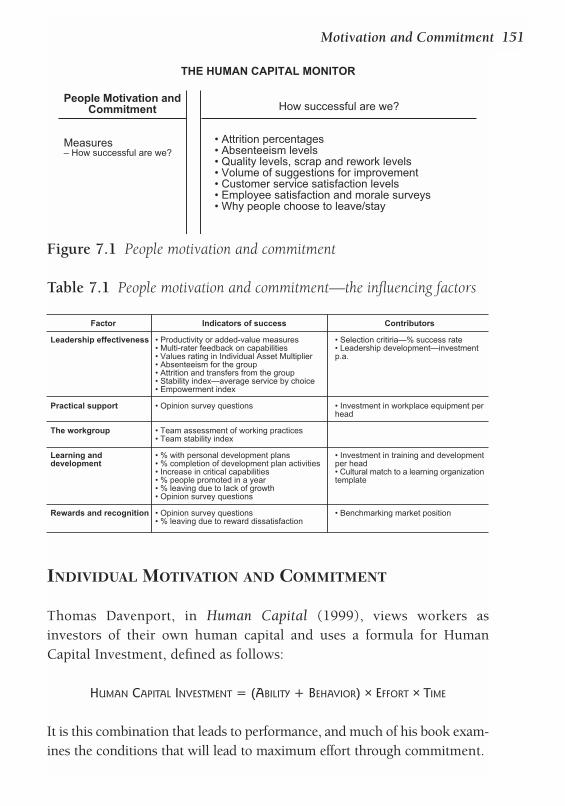
INDIVIDUAL MOTIVATION AND COMMITMENT
Thomas Davenport, in Human Capital (1999), views workers asinvestors of their own human capital and uses a formula for HumanCapital Investment, defined as follows:
HUMAN CAPITAL INVESTMENT = (ABILITY + BEHAVIOR) × EFFORT × TIME
It is this combination that leads to performance, and much of his book exam-ines the conditions that will lead to maximum effort through commitment.
Motivation and Commitment 151
People Motivation andCommitment
Measures– How successful are we?
THE HUMAN CAPITAL MONITOR
How successful are we?
• Attrition percentages• Absenteeism levels• Quality levels, scrap and rework levels• Volume of suggestions for improvement• Customer service satisfaction levels• Employee satisfaction and morale surveys• Why people choose to leave/stay
Figure 7.1 People motivation and commitment
Table 7.1 People motivation and commitment—the influencing factors
Factor
Leadership effectiveness
Practical support
The workgroup
Learning anddevelopment
Rewards and recognition
Indicators of success
• Productivity or added-value measures• Multi-rater feedback on capabilities• Values rating in Individual Asset Multiplier• Absenteeism for the group• Attrition and transfers from the group• Stability index—average service by choice• Empowerment index
• Opinion survey questions
• Team assessment of working practices• Team stability index
• % with personal development plans• % completion of development plan activities• Increase in critical capabilities• % people promoted in a year• % leaving due to lack of growth• Opinion survey questions
• Opinion survey questions• % leaving due to reward dissatisfaction
Contributors
• Selection critiria—% success rate• Leadership development—investmentp.a.
• Investment in workplace equipment perhead
• Investment in training and developmentper head• Cultural match to a learning organizationtemplate
• Benchmarking market position
“Effort” is described as “the conscious application of mental andphysical resources towards a particular end … by applying or withholdingit, we control the when, where and how of human capital contribution.”
Who plays the main part in determining commitment and moti-vation: the organization or the employee? Sometimes personal, non-work-related problems can weigh on people’s minds and affectcommitment. Often these are temporary situations and demand manage-rial sensitivity.
Frederick Herzberg followed on from the Theory X and Theory Ythinking of Douglas McGregor with his famous article in 1966, “OneMore Time—How do You Motivate Employees?”. He distinguishedbetween “hygiene factors”—those that, if not addressed, lead to dissatis-faction—and “motivation factors”—those that contribute to positive jobsatisfaction. At the time he was protesting against an approach he char-acterized as KITA (“Kick in the Ass”). Negative KITA is about pushingand subtly threatening employees; positive KITA is exemplified by incen-tives, offering more benefits and communicating well. Herzberg demon-strated that significantly important motivators were achievement,recognition, work itself, and responsibility. Personal growth and advance-ment were also important. On the other hand, demotivators were pri-marily to do with supervision and the working environment. His solutionwas to focus on enriching people’s jobs.
In 1987 the Harvard Business Review republished the article as aclassic. Herzberg commented that 20 years on KITA was alive and well,particularly in the context of a preoccupation with the bottom line. Hefelt that his analysis had stood the test of time, and most managers wouldprobably agree with him.
Despite these more general observations, motivation can varyaccording to temperament and also to career stage—the particular pointa given individual has reached. For example, desire for high earningsmight dominate in the early years, where, for others, the opportunity totravel or to be in leading-edge work might be what is most important.Everyone has their own aspirations. Generation X—younger peoplebrought up in the IT economy—are characterized by not expecting tostay in the same career or with the same organization, as their parentsperhaps did. Instead, opportunities to gain valuable qualifications, or to
152 The Human Value of the Enterprise
have the freedom to try new ideas are important. And they are usuallykeen to have a financial stake in their organization’s success.
There are many visible effects of high commitment and motivation:People working particularly hard, prepared to take on extra tasks, want-ing to be involved in many aspects of the organization. But how can wequantify levels of motivation? We can see its effect in both business out-puts and in the way people behave. It is much easier to make a collectiveassessment than to track individual by individual.
Output indicators particularly affected by employee motivation
Customer satisfactionThe service–profit chain, mentioned on page 128, argues that customersatisfaction is directly linked to employee satisfaction, particularly forthose employees involved directly with customers. These may include awide variety in practice, for example:
❏ Salespeople❏ Call center operators❏ Customer service people❏ Service deliverers such as shop assistants, airline cabin crews,
garage mechanics ❏ Invoice departments❏ Supply chain specialists❏ Telephonists and receptionists.
The method used for customer evaluation is critical. Increasingly, firmsask for immediate feedback from a customer to the individual represen-tative of the service. This may put the customer in a tricky position, how-ever—feedback tends to be more honest if it is given anonymously.
Measures of customer service are also affected by systems andresources. Comparing the measures over time must be accompanied bylooking at any system changes that have taken place before conclusionsare drawn regarding employee commitment. For example, a new call cen-ter system that schedules engineer visits may cause a deterioration inservice that is nothing to do with the engineers themselves.
Motivation and Commitment 153
Quality and rework levelsWhatever employees are working with, products or services, the level ofthe quality of their work is a measure of their commitment. If they careabout their work and their customers, whether internal or external, theywill be concerned to do things right first time.
Suggestions and improvementsThe quantity and quality of suggestions and improvements made, espe-cially voluntarily, can be an indicator of people’s involvement in theirwork. There will always be suggestions for improving hygiene factors,and these should be distinguished from those that relate to the work itselfor to customer benefits, for example. We would judge whether the num-ber received is a positive or negative indicator by reference to previoushistory, or to internal or external benchmarking. Quality can be reflectedin the percentage of suggestions that are adopted, and the value added tostakeholders (including cost savings) that accrue from them.
SurveysEmployee surveys can give us clear signals and create “morale indices” fortracking over time, can allow us to measure progress against cultural goals,and enable us to benchmark key indicators with other organizations.
How often should they be done? This depends on the pace ofchange in the organization. Employees can get fed up with filling in ques-tionnaires, and excess quantity reduces quality. Once a year would benormal, but for a specific culture change program surveys might be donebefore the change, during, and after.
One company example is the Individual Dignity Entitlement sur-vey used by Motorola. This produces an index, which affects managers’bonuses. Six questions are tracked every quarter:
❏ Do you have a substantive meaningful job that contributes to thesuccess of Motorola?
❏ Do you have on-the-job behaviors and the knowledge base to besuccessful?
❏ Has training been identified and made available to continuouslyupgrade your skills?
154 The Human Value of the Enterprise
❏ Do you have a career plan and is it exciting, achievable, and beingacted on?
❏ Have you received candid positive or negative feedback within thelast 30 days that has been helpful in improving your performanceor achieving your career plan?
❏ Is there appropriate sensitivity to your personal circumstances,gender, and cultural heritage so that such issues do not distractfrom your success?
Organizations exist to coordinate the exchange of survey results betweencompanies, and firms also create their own clubs for this purpose. Ideally,the questions we would want to benchmark would be those that we seeas fundamental to our value-management strategy. They will be aboutinnovation, learning, knowledge and information sharing, personaldevelopment, and overall satisfaction.
One organization that collates and disseminates such data is ISR(International Survey Research), which has monitored certain key ques-tions in a variety of countries for over ten years. In 2000, for example, ISRreported that in the 1990s in eight European countries, the overallemployee satisfaction level varied between 55 percent for Italy and theUK and 69 percent for Switzerland. There are definite cultural factors inhow people respond to such surveys, so that comparisons within coun-tries and against time have more validity than those between countries.Relatively little change had happened over 10 years, Switzerland showingthe greatest increase (+6 percent), and the UK declining by 2 percent. Thesubsidiary questions showed the highest satisfaction overall with “thework itself” and the least with “pay.” “Performance and development”was also one of the lowest figures.
In terms of testing commitment and motivation, we will want toask questions such as:
❏ To what extent do you look forward to coming to work on Mondaymornings?
❏ How positive do you feel about the goals and objectives of your group?❏ How satisfied do you feel with the nature and challenges of your
work?
Motivation and Commitment 155
Excessive absenteeism and staff losses“Excessive” is a judgmental word. Here we mean “beyond the industrynorm, or beyond a target level we believe is achievable.” The SaratogaInstitute, collecting information worldwide, shows median, 25th per-centile, and 75th percentile absenteeism rates for different countries. InEurope, Germany has the highest overall rate with a median of 4.6 per-cent of days lost, compared to 3.1 percent for the UK. (Despite this,Germany has substantially higher productivity than the UK.)
People who are highly motivated by their work have less time offthan those who find their work unfulfilling or where there is a generalmalaise concerning morale. Similar organizations or units can vary sig-nificantly in their absentee rates. We should set a target that we believewe should be able to expect from a highly motivated workforce, andregard the difference between this and our actual rate as a gap to beclosed.
We can measure absenteeism as a percentage, and also as a real cost.No added value is created by a person who is absent, and absence mayincur extra costs through overtime, temporary staff, and loss of output.
As we saw in Chapter 6, attrition or labor turnover rates are perhapsthe most potent indicator of poor morale—people voting with their feet.Again, we need to judge whether the level is beyond a reasonable target.Internal benchmarking can be a helpful guide. For example, in the do-it-yourself and hardware chain B&Q, a study in 1999 found that the beststore had an attrition rate of 20 percent and the worst 220 percent. Evenallowing for some factors of geography, this helped set a general target.
Whenever we look at collective data, we need to be careful thataveraging and consolidating are not hiding what we really want to know.Some groups of people are much more strategically important than oth-ers, and we might want to make the attrition target zero for them.
To summarize, indicators of the levels of motivation are:
❏ Attrition percentages, especially against industry norms❏ Absenteeism levels compared to industry norms❏ Quality levels, scrap and rework levels ❐ Quantity of suggestions for improvement, and value added as a
result
156 The Human Value of the Enterprise
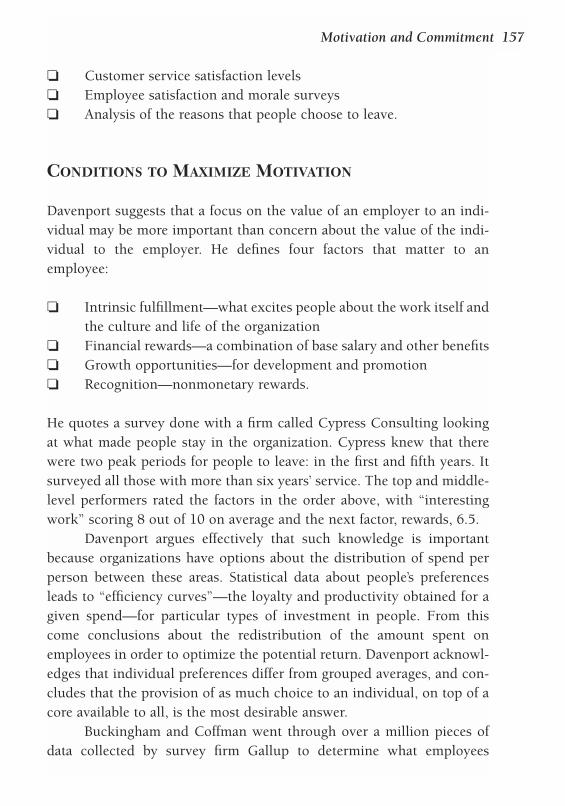
❏ Customer service satisfaction levels ❏ Employee satisfaction and morale surveys ❏ Analysis of the reasons that people choose to leave.
CONDITIONS TO MAXIMIZE MOTIVATION
Davenport suggests that a focus on the value of an employer to an indi-vidual may be more important than concern about the value of the indi-vidual to the employer. He defines four factors that matter to anemployee:
❏ Intrinsic fulfillment—what excites people about the work itself andthe culture and life of the organization
❏ Financial rewards—a combination of base salary and other benefits❏ Growth opportunities—for development and promotion❏ Recognition—nonmonetary rewards.
He quotes a survey done with a firm called Cypress Consulting lookingat what made people stay in the organization. Cypress knew that therewere two peak periods for people to leave: in the first and fifth years. Itsurveyed all those with more than six years’ service. The top and middle-level performers rated the factors in the order above, with “interestingwork” scoring 8 out of 10 on average and the next factor, rewards, 6.5.
Davenport argues effectively that such knowledge is importantbecause organizations have options about the distribution of spend perperson between these areas. Statistical data about people’s preferencesleads to “efficiency curves”—the loyalty and productivity obtained for agiven spend—for particular types of investment in people. From thiscome conclusions about the redistribution of the amount spent onemployees in order to optimize the potential return. Davenport acknowl-edges that individual preferences differ from grouped averages, and con-cludes that the provision of as much choice to an individual, on top of acore available to all, is the most desirable answer.
Buckingham and Coffman went through over a million pieces ofdata collected by survey firm Gallup to determine what employees
Motivation and Commitment 157
regarded as a positive working environment. One of their standard ques-tions concerns whether employees feel “engaged,” “disengaged,” or“actively disengaged.” Their extensive studies in the US showed 26 per-cent in the first category and 19 percent in the last. A similar study in theUK in 2001 showed figures of 17 and 20 percent. In researching what itis that makes the difference, Buckingham and Coffman came up with 12questions to which people wanted positive answers:
1 Do I know what is expected of me at work?2 Do I have the materials and equipment I need to do my work right?3 At work, do I have the opportunity to do what I do best every day?4 In the last seven days have I received recognition or praise for good
work?5 Does my supervisor, or someone at work, seem to care about me as
a person?6 Is there someone at work who encourages my development?7 At work, do my opinions count? 8 Does the mission/purpose of my company make me feel that my
work is important?9 Are my co-workers committed to doing quality work?10 Do I have a best friend at work?11 In the last six months have I talked to someone about my progress?12 At work, have I had opportunities to learn and grow?
If we can create a workplace where these answers to these questions willbe “yes,” we are likely to maximize motivation and commitment. Thereis no doubt that, as Herzberg, Davenport, and others have emphasized,the nature of work itself—in terms of interest, challenge, and learningopportunities—comes top of the motivation league.
CULTURE AND CLIMATE
Culture refers to the systems, processes, and behavioral expectations—built up over time—that affect all parts of the organization. Exampleswould be the structure of rewards, corporate values, or standardized
158 The Human Value of the Enterprise
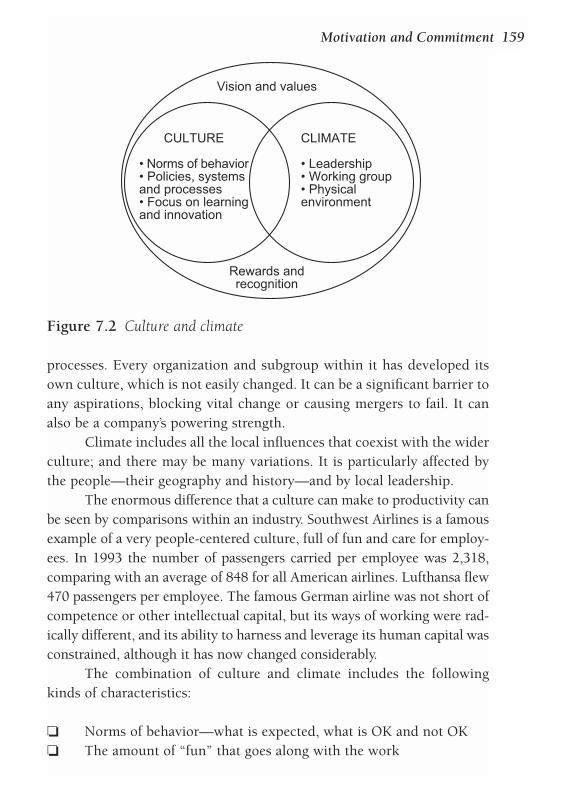
processes. Every organization and subgroup within it has developed itsown culture, which is not easily changed. It can be a significant barrier toany aspirations, blocking vital change or causing mergers to fail. It canalso be a company’s powering strength.
Climate includes all the local influences that coexist with the widerculture; and there may be many variations. It is particularly affected bythe people—their geography and history—and by local leadership.
The enormous difference that a culture can make to productivity canbe seen by comparisons within an industry. Southwest Airlines is a famousexample of a very people-centered culture, full of fun and care for employ-ees. In 1993 the number of passengers carried per employee was 2,318,comparing with an average of 848 for all American airlines. Lufthansa flew470 passengers per employee. The famous German airline was not short ofcompetence or other intellectual capital, but its ways of working were rad-ically different, and its ability to harness and leverage its human capital wasconstrained, although it has now changed considerably.
The combination of culture and climate includes the followingkinds of characteristics:
❏ Norms of behavior—what is expected, what is OK and not OK❏ The amount of “fun” that goes along with the work
Motivation and Commitment 159
Vision and values
Rewards andrecognition
CULTURE
• Norms of behavior• Policies, systemsand processes• Focus on learningand innovation
CLIMATE
• Leadership• Working group• Physicalenvironment
Figure 7.2 Culture and climate
❏ What gets rewarded❏ Degrees of freedom and empowerment as opposed to bureaucracy
and restraint❏ The match between authority and responsibility ❏ The extent and effectiveness of communication❏ The amount of trust in the organization ❏ The level of respect and flexibility regarding the individual.
These are not fixed for ever, although most can be affected by changes inmanagement and direction. If the organization is taken over or merged, itcan experience a revolution—which is usually acutely uncomfortable.Merging two organizations with polarized approaches to some of thedimensions above is a recipe for disaster.
Five factors that influence successful motivation
The following factors have been chosen as those that make the most dif-ference, for which we need indicators of our degree of success:
❏ Leadership direction and management style❏ Physical environment ❏ Working group❏ Opportunities to learn and develop❏ Rewards and recognition.
How these relate to culture and climate is summarized in Table 7.2opposite.
THE EFFECTIVENESS OF LEADERSHIP
Those who study the rise and fall of firms have no doubt that high-qualityleadership is an organization’s major asset. Poor leadership not onlyaffects things like low morale, absenteeism, and attrition, but might alsogive rise to complacency, failure to respond to markets and customers,poor strategic choices, and many other undesired effects. Share values
160 The Human Value of the Enterprise
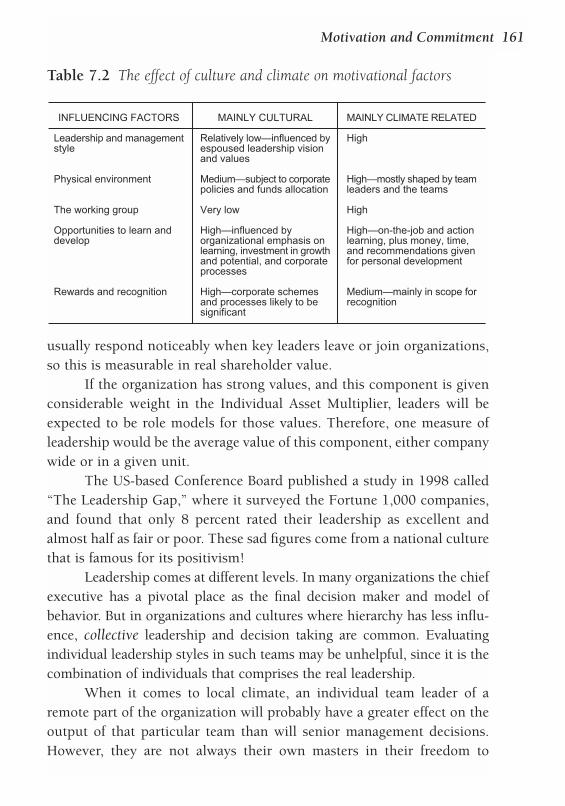
usually respond noticeably when key leaders leave or join organizations,so this is measurable in real shareholder value.
If the organization has strong values, and this component is givenconsiderable weight in the Individual Asset Multiplier, leaders will beexpected to be role models for those values. Therefore, one measure ofleadership would be the average value of this component, either companywide or in a given unit.
The US-based Conference Board published a study in 1998 called“The Leadership Gap,” where it surveyed the Fortune 1,000 companies,and found that only 8 percent rated their leadership as excellent andalmost half as fair or poor. These sad figures come from a national culturethat is famous for its positivism!
Leadership comes at different levels. In many organizations the chiefexecutive has a pivotal place as the final decision maker and model ofbehavior. But in organizations and cultures where hierarchy has less influ-ence, collective leadership and decision taking are common. Evaluatingindividual leadership styles in such teams may be unhelpful, since it is thecombination of individuals that comprises the real leadership.
When it comes to local climate, an individual team leader of aremote part of the organization will probably have a greater effect on theoutput of that particular team than will senior management decisions.However, they are not always their own masters in their freedom to
Motivation and Commitment 161
Table 7.2 The effect of culture and climate on motivational factors
INFLUENCING FACTORS
Leadership and managementstyle
Physical environment
The working group
Opportunities to learn anddevelop
Rewards and recognition
MAINLY CULTURAL
Relatively low—influenced byespoused leadership visionand values
Medium—subject to corporatepolicies and funds allocation
Very low
High—influenced byorganizational emphasis onlearning, investment in growthand potential, and corporateprocesses
High—corporate schemesand processes likely to besignificant
MAINLY CLIMATE RELATED
High
High—mostly shaped by teamleaders and the teams
High
High—on-the-job and actionlearning, plus money, time,and recommendations givenfor personal development
Medium—mainly in scope forrecognition
manage. I am continually amazed at the constraints placed on many affil-iate (as US companies call their overseas operations) company managersby headquarters back home in America, and this is often also true ofGermany or Japan and others. The local people may have some simplesolutions to a morale problem, such as pay adjustments, bonus changes,new office layouts, but they are not allowed to implement them as theyare not consistent with “policy.”
The role of leadership in maximizing the effectiveness of humancapital is spoken and written about continuously. In a value-creatingorganization these are the behaviors we want to see:
❏ Providing clear direction and vision, enabling people to take deci-sions themselves
❏ Ensuring that people are clearly accountable❏ Being a visible role model for the organization’s values ❏ Showing an overriding and balanced concern for stakeholder
value❏ Supporting the growth of people’s capability through coaching and
work assignments❏ Building and maintaining a learning and sharing environment❏ Providing recognition for achievement❏ Empowering people to innovate and take decisions❏ Outlawing a “blame” culture❏ Continually being open to feedback❏ Keeping people fully informed of what is happening and regularly
listening to their input.
How can we track leadership capability and understand whether the bal-ance of its impact is positive or negative? First of all, it is leadership’s jobto produce results. The productivity or added value of the unit is the ulti-mate output measure and this is a fair reflection of a leader’s ability togain results through people.
The best people to judge how effectively a leader is leading are thefollowers, hence the strong emphasis on behavioral assessments, basedon capability frameworks and 360º feedback. The resulting summary ofperceptions is also an output measure of leadership effectiveness, since
162 The Human Value of the Enterprise
the style and behavior of leaders will affect morale and motivation. Goodsystems of multi-input feedback will give more than a mere numeric eval-uation, but through open comments offer examples that enable individu-als to relate to the reality of how they are seen. However, some of theinstruments in use are extremely complex, and delve into such detail ofperfection that they risk being demotivating to the leader concerned.
One other sign of good leadership is that people want to join theteam and are reluctant to leave. So a stability index may be useful here:the average time people have been with the particular leader by choice.
Are there any inputs to leadership effectiveness other than the lead-ers themselves? Clearly, one is our ability to select—and promote—theright people, and the criteria and processes we use have a significantinfluence. A measure would be the percentage of appointments made thatare successful. We adapt our criteria based on experience and in order toincrease the success rate. Another input is the extent to which we investin leadership development, programs aimed at self-awareness, personalchange, and people management skill improvement. Not all such pro-grams achieve very much in terms of the outcomes we have mentioned,however, and this is often due a lack of clarity on the desired outcome.
Leif Edvinsson introduced to Skandia a human capital measurecalled the empowerment index. This is constructed from an indepen-dently conducted survey of how people feel about control over theirdaily work. It is about being provided with the necessary time, training,resources, and authority to do what you feel your accountabilityrequires. This requires considerable trust and security on the part of theleader. Given the knowledge and skills, and hence personal confidence,much evidence shows that people perform and grow more successfullyunder these conditions. It seems a worthwhile output of effectiveleadership.
To summarize, measures of effective leadership include:
❏ Productivity or added-value measures for the group being led ❏ Multi-rater feedback on leadership capabilities❏ Values rating in Individual Asset Multiplier❏ Absenteeism for the group❏ Losses from the group through attrition and transfers
Motivation and Commitment 163
❏ Empowerment index—perception of self-determination of theworking environment
❏ Stability index—average service in the team by choice.
Measures of influences on effective leadership are:
❏ Selection criteria—percentage success rate of appointments made ❏ Leadership development—days’ investment per year per leader.
THE PRACTICAL ENVIRONMENT
In my first management job as a production manager with Procter andGamble, my six months’ training period included Friday afternoon ses-sions with the plant manager. In these meetings we would discuss vari-ous people management topics. Soon after my appointment, I rememberputting into practice a simple lesson from his session on motivation. Iwent around the operators asking what frustrated them most. As a resultof this, three simple purchases of long-awaited equipment got me off to agood start as their manager! Small things can be very influential onmorale and motivation—office temperature, some privacy, a printer thatworks, a coffee machine, and so on.
British Airways designed its new headquarters with the goal ofmaximizing the opportunity for people to meet and exchange. A central“street” provides refreshments, places to sit with colleagues, and infor-mation booths. Flexibility of time and place for many roles has led to“hotdesking,” where it is assumed that desks are only required for part ofthe time and you take the nearest desk available. Some people value thefreedom inherent in the arrangement; others become very demotivated byan absence of personal space and having their established environmentturned upset down. Personal productivity is reduced until a person feelsstabilized. We need to avoid general rules for all without taking the trou-ble to understand the needs and concerns of each person individually.
Space is one thing, but equipment and facilities are another. The“brain drain” of doctors and scientists from the UK to the US in the 1970sand 1980s was largely due to the prospect of being able to work with the
164 The Human Value of the Enterprise
latest equipment. Today, for example, information systems hardware andsoftware are such essential tools that their availability can be a majormotivating or demotivating factor.
All too often, company policy determines what is “good for you” inthe work environment. Standardization of where and how people workcomes from seeing people as cost-based human resources. Case studies ofhighly innovative companies show how freedom for people to definetheir own working space, facilities, and equipment can be very signifi-cant. So one input measure here would be the degree of freedom that peo-ple have to “do their own thing.”
These are the kinds of questions worth asking:
❏ How satisfied are you with the tools and equipment provided foryour work?
❏ What changes in your working environment would you find moti-vating, or would remove irritations and dissatisfaction for you?
THE WORKING GROUP
For most people, the group they work with can be a powerful influenceon their level of satisfaction. Many people want to make and enjoyfriendships at work, and like the social side of it as much as anythingelse. The rise in voluntary working from home and self-employment ismuch publicised, but this section of the population is still very much aminority.
A workgroup is often unjustifiably called a “team,” which shouldbe defined as a group with one common goal and yet interdependence.Good leaders seek to maximize team spirit, on the assumption that thisis a positive input to motivation in its own right. But many work on theirown personal accountabilities, with some dependence, either psycholog-ically or workflow-wise, on other colleagues. Sometimes the dependenceis critical, and an input or output from other group members determinesthe person’s effectiveness.
It might be worth asking a particular group to define its owndesired “character.” Their resultant picture of themselves can then
Motivation and Commitment 165
comprise a useful benchmark for them to periodically check against. Forexample, the group might say:
We want to be a group where:❏ We all have special skills and knowledge that is known and
respected❏ We share new learning from any source❏ We put the team needs above personal preferences❏ We celebrate success and work to learn from our mistakes❏ We always talk positively about the group to others❏ We face up to interpersonal difficulties honestly and constructively.
At some agreed interval, group members can rate how far the group isfrom achieving its goal, in their view. If teamwork is one of the espousedvalues of the organisation, data from such surveys might be collected andmonitored.
There are many openly available tools for members of a team toenable mutual assessment and team development. One of the betterknown is by Dr. Meredith Belbin, who identified nine different contribu-tory roles, and his questionnaire identifies the primary and secondaryroles of each person. Another is the Team Management Index developedby Margerison McCann. This groups team members under Explorers,Organizers, Controllers, and Advisers, and has a 15-minute questionnairefor individuals to complete.
Relationships with other workgroups—either internal or exter-nal—may also be very important, and this can be built into the measure-ment instrument, such as “We cooperate fully with the X or Y team.”
There is evidence that stability of teams and workgroups who sharecommon goals is related to continuing performance. People learn how towork (and play) effectively together; they come to share similar values andprocesses and trust one another; they plan and strive for common pur-poses—celebrating or commiserating about their achievements together.
In summary, examples of measures here are:
❏ Team assessment against an ideal template of working practices❏ Inter-team cooperation indices
166 The Human Value of the Enterprise
❏ A team stability index, by taking the average time that team mem-bers have spent with the team (this index can be averaged for unitsor departments).
LEARNING AND DEVELOPMENT
In exchange for the loan of human capital, learning and developmentform a major part of the added value that people expect in return. Thisdoes not necessarily mean progressing contin-ually onwards and upwards, as that is for rela-tively few. But people want to see investmentin their capability, and opportunities to usetheir potential.
There are some fundamental aspects ofthe organizational culture that foster learning,innovation, and change. These are so critical to the value-creating organi-zation that the next chapter is devoted to understanding them. Here we willfocus on the individual’s perspective, and how we add value to everyone.
Supporting individual learning
We want to enable all employees, at all levels, to be consciously compe-tent as regards the processes of learning. They should see improvingtheir own value as closely linked to building their capability—not in avague general sense, but in a planned and targeted way. Table 7.3 out-lines the steps that they should be able to undertake and the skillsneeded to do so.
All of this requires considerable knowledge of how learning can bemade effective. Ian Cunningham, in The Wisdom of Strategic Learning,provides excellent advice on self-managed learning, and how it can bemade a way of life within an organization. One effective mechanism islearning sets, where individuals come together from diverse back-grounds, but at approximately the same level in the organization. Theyexplore concepts and ideas, share experiences and knowledge, and helpeach other with their own learning plans.
Motivation and Commitment 167
A SENSE OF MAKING CONTINUAL
PERSONAL PROGRESS IS WHAT
CONSTITUTES A CAREER FOR MANY
PEOPLE.
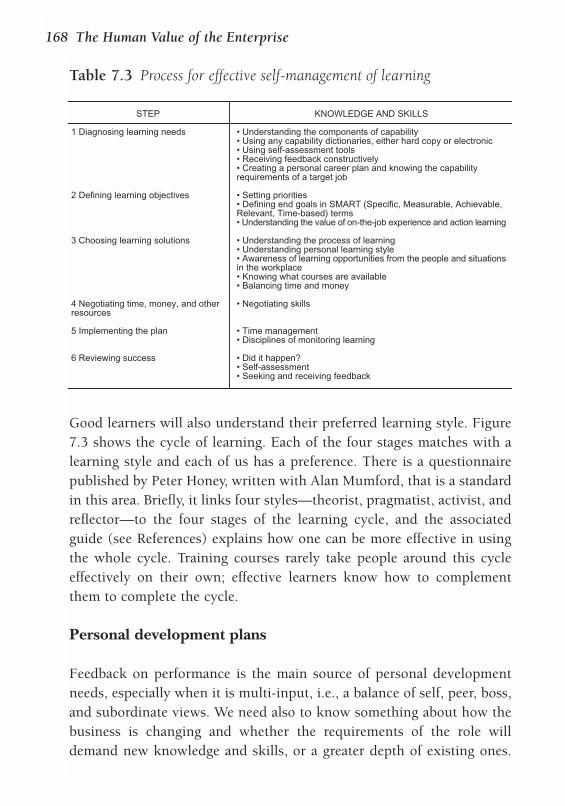
Good learners will also understand their preferred learning style. Figure7.3 shows the cycle of learning. Each of the four stages matches with alearning style and each of us has a preference. There is a questionnairepublished by Peter Honey, written with Alan Mumford, that is a standardin this area. Briefly, it links four styles—theorist, pragmatist, activist, andreflector—to the four stages of the learning cycle, and the associatedguide (see References) explains how one can be more effective in usingthe whole cycle. Training courses rarely take people around this cycleeffectively on their own; effective learners know how to complementthem to complete the cycle.
Personal development plans
Feedback on performance is the main source of personal developmentneeds, especially when it is multi-input, i.e., a balance of self, peer, boss,and subordinate views. We need also to know something about how thebusiness is changing and whether the requirements of the role willdemand new knowledge and skills, or a greater depth of existing ones.
168 The Human Value of the Enterprise
Table 7.3 Process for effective self-management of learning
STEP
1 Diagnosing learning needs
2 Defining learning objectives
3 Choosing learning solutions
4 Negotiating time, money, and otherresources
5 Implementing the plan
6 Reviewing success
KNOWLEDGE AND SKILLS
• Understanding the components of capability• Using any capability dictionaries, either hard copy or electronic• Using self-assessment tools• Receiving feedback constructively• Creating a personal career plan and knowing the capabilityrequirements of a target job
• Setting priorities• Defining end goals in SMART (Specific, Measurable, Achievable,Relevant, Time-based) terms• Understanding the value of on-the-job experience and action learning
• Understanding the process of learning• Understanding personal learning style• Awareness of learning opportunities from the people and situationsin the workplace• Knowing what courses are available• Balancing time and money
• Negotiating skills
• Time management• Disciplines of monitoring learning
• Did it happen?• Self-assessment• Seeking and receiving feedback
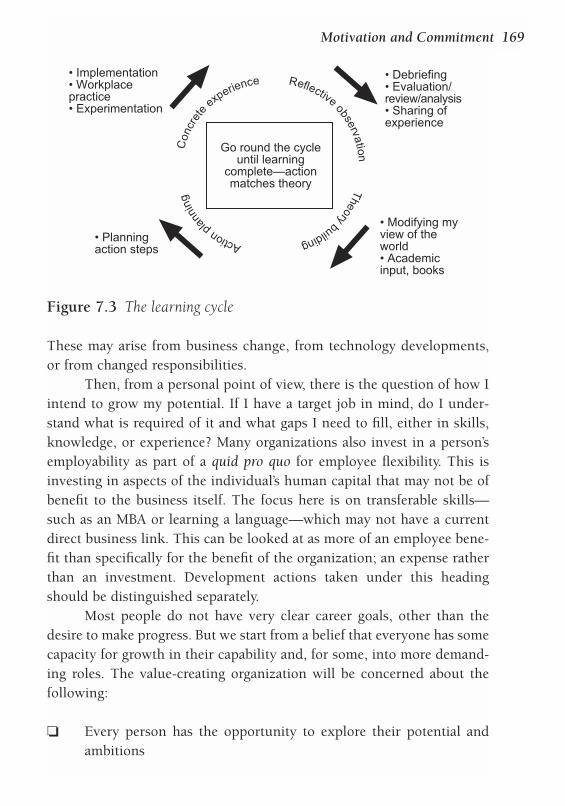
These may arise from business change, from technology developments,or from changed responsibilities.
Then, from a personal point of view, there is the question of how Iintend to grow my potential. If I have a target job in mind, do I under-stand what is required of it and what gaps I need to fill, either in skills,knowledge, or experience? Many organizations also invest in a person’semployability as part of a quid pro quo for employee flexibility. This isinvesting in aspects of the individual’s human capital that may not be ofbenefit to the business itself. The focus here is on transferable skills—such as an MBA or learning a language—which may not have a currentdirect business link. This can be looked at as more of an employee bene-fit than specifically for the benefit of the organization; an expense ratherthan an investment. Development actions taken under this headingshould be distinguished separately.
Most people do not have very clear career goals, other than thedesire to make progress. But we start from a belief that everyone has somecapacity for growth in their capability and, for some, into more demand-ing roles. The value-creating organization will be concerned about thefollowing:
❏ Every person has the opportunity to explore their potential andambitions
Motivation and Commitment 169
Go round the cycleuntil learning
complete—actionmatches theory
Con
cret
e
experience Reflective
observation T
heorybuilding Actionpla
nnin
g
• Debriefing• Evaluation/review/analysis• Sharing ofexperience
• Modifying myview of theworld• Academicinput, books
• Implementation• Workplacepractice• Experimentation
• Planningaction steps
Figure 7.3 The learning cycle
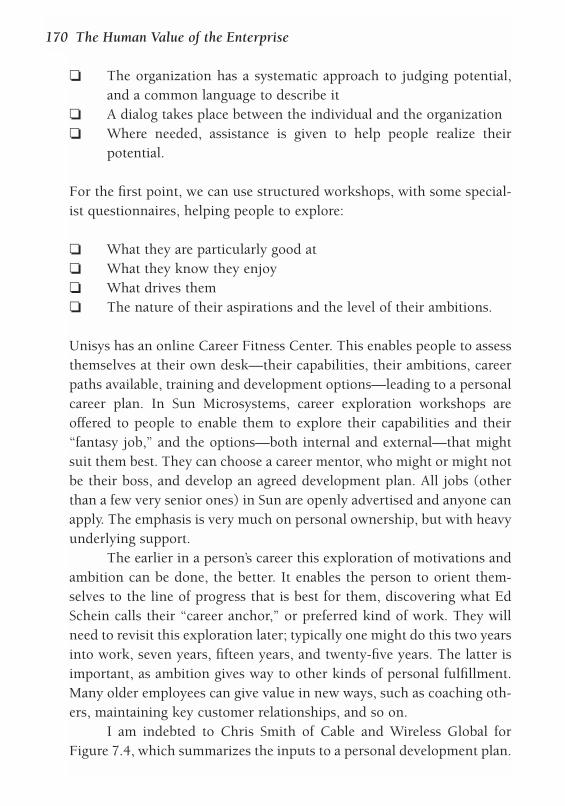
❏ The organization has a systematic approach to judging potential,and a common language to describe it
❏ A dialog takes place between the individual and the organization ❏ Where needed, assistance is given to help people realize their
potential.
For the first point, we can use structured workshops, with some special-ist questionnaires, helping people to explore:
❏ What they are particularly good at❏ What they know they enjoy ❏ What drives them❏ The nature of their aspirations and the level of their ambitions.
Unisys has an online Career Fitness Center. This enables people to assessthemselves at their own desk—their capabilities, their ambitions, careerpaths available, training and development options—leading to a personalcareer plan. In Sun Microsystems, career exploration workshops areoffered to people to enable them to explore their capabilities and their“fantasy job,” and the options—both internal and external—that mightsuit them best. They can choose a career mentor, who might or might notbe their boss, and develop an agreed development plan. All jobs (otherthan a few very senior ones) in Sun are openly advertised and anyone canapply. The emphasis is very much on personal ownership, but with heavyunderlying support.
The earlier in a person’s career this exploration of motivations andambition can be done, the better. It enables the person to orient them-selves to the line of progress that is best for them, discovering what EdSchein calls their “career anchor,” or preferred kind of work. They willneed to revisit this exploration later; typically one might do this two yearsinto work, seven years, fifteen years, and twenty-five years. The latter isimportant, as ambition gives way to other kinds of personal fulfillment.Many older employees can give value in new ways, such as coaching oth-ers, maintaining key customer relationships, and so on.
I am indebted to Chris Smith of Cable and Wireless Global forFigure 7.4, which summarizes the inputs to a personal development plan.
170 The Human Value of the Enterprise
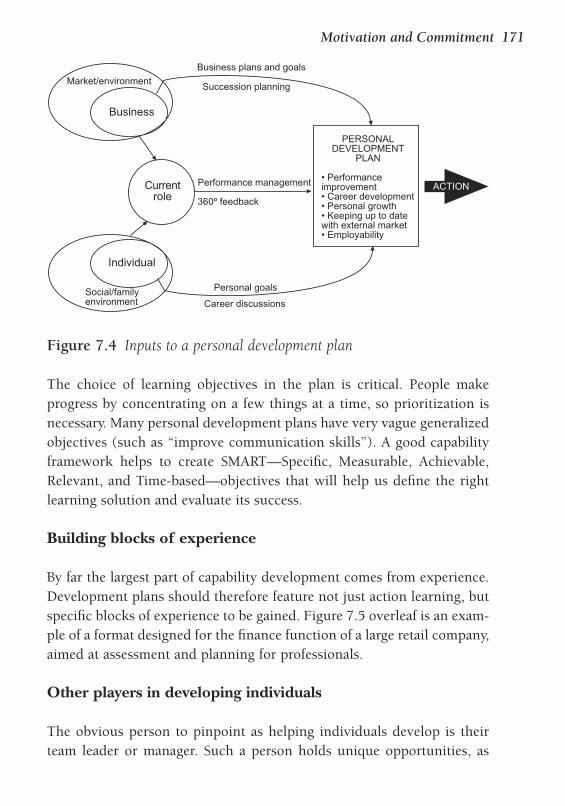
The choice of learning objectives in the plan is critical. People makeprogress by concentrating on a few things at a time, so prioritization isnecessary. Many personal development plans have very vague generalizedobjectives (such as “improve communication skills”). A good capabilityframework helps to create SMART—Specific, Measurable, Achievable,Relevant, and Time-based—objectives that will help us define the rightlearning solution and evaluate its success.
Building blocks of experience
By far the largest part of capability development comes from experience.Development plans should therefore feature not just action learning, butspecific blocks of experience to be gained. Figure 7.5 overleaf is an exam-ple of a format designed for the finance function of a large retail company,aimed at assessment and planning for professionals.
Other players in developing individuals
The obvious person to pinpoint as helping individuals develop is theirteam leader or manager. Such a person holds unique opportunities, as
Motivation and Commitment 171
PERSONALDEVELOPMENT
PLAN
• Performanceimprovement• Career development• Personal growth• Keeping up to datewith external market• Employability
Currentrole
Business
Individual
Social/familyenvironment
Market/environment
ACTIONPerformance management
360º feedback
Business plans and goals
Succession planning
Personal goals
Career discussions
Figure 7.4 Inputs to a personal development plan
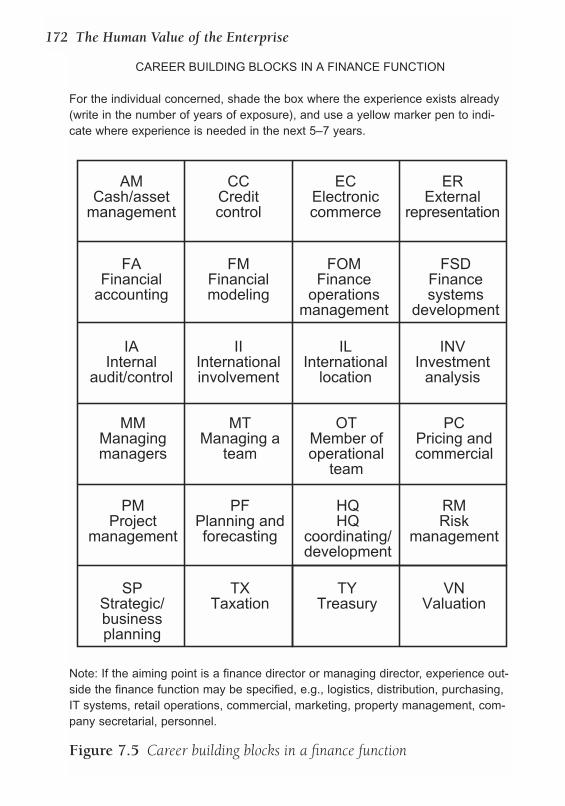
172 The Human Value of the Enterprise
CAREER BUILDING BLOCKS IN A FINANCE FUNCTION
For the individual concerned, shade the box where the experience exists already(write in the number of years of exposure), and use a yellow marker pen to indi-cate where experience is needed in the next 5–7 years.
Note: If the aiming point is a finance director or managing director, experience out-side the finance function may be specified, e.g., logistics, distribution, purchasing,IT systems, retail operations, commercial, marketing, property management, com-pany secretarial, personnel.
AMCash/asset
management
CCCreditcontrol
ECElectroniccommerce
ERExternal
representation
FAFinancial
accounting
FMFinancialmodeling
FOMFinance
operationsmanagement
FSDFinancesystems
development
IAInternal
audit/control
IIInternationalinvolvement
ILInternational
location
INVInvestment
analysis
MMManagingmanagers
MTManaging a
team
OTMember ofoperational
team
PCPricing andcommercial
PMProject
management
PFPlanning andforecasting
HQHQ
coordinating/development
RMRisk
management
SPStrategic/businessplanning
TXTaxation
TYTreasury
VNValuation
Figure 7.5 Career building blocks in a finance function
they determine who does which tasks, sits on which committees, or takeson new challenges. They control the management of experience.
Many organizations say how much they want their managers to becoaches, and this is clearly desirable. But some will never be good atcoaching and it is unrealistic to cajole them or hope that they will get bet-ter. We gain more from helping individuals learn how to detect the peo-ple around them who can help them: developing “coachee” skills, askingfor coaching help, and being clear about what is needed. For example,making requests such as: “I need to improve my relationships with theaccounts department. Could I just go over with you what is happeningperiodically and perhaps you can suggest ways in which I could approachthem differently?”
We could summarize the manager’s role in developing staff asincluding:
❏ Stimulating individuals to help themselves❏ Involving others in the learning process❏ Delegating responsibilities ❏ Looking for opportunities for new learning❏ Showing by example, role modeling❏ Systematic coaching❏ Organizing job sharing/rotation❏ Allowing risk taking❏ Encouraging experimentation❏ Giving (and receiving) feedback❏ Ensuring the transfer of off-the-job learning to others❏ Assisting with the implementation of new learning ❏ Budgeting sufficient funds❏ Arranging experience/knowledge sharing.
The manager is not the only partner in the learning process. Individualscan learn from all the people around them, and receive coaching as well.Indeed, it is not unknown for a manager to seek coaching from an expe-rienced subordinate. In my first job as a production manager, Arthur wasa senior operative who had seen young graduate managers come and gofor years. Arthur advised and coached me through both technical and
Motivation and Commitment 173
personnel problems just as much as my formal manager did. Many of theroles outlined for the manager can also be taken by team members, or byexternal coaches and mentors.
Mentors are people who have a long-term offline relationship withan individual, helping them with decisions about career moves or variousproblems they are facing. If organizations provide them at all, it tends tobe for certain populations such as new graduates or “high potentials.”Many people develop informal mentors of their own.
Measures for success in learning and development
We want to see processes working effectively, evidence of personalgrowth, and individuals who can answer “yes” to questions such as thetwelve summarized by Buckingham on page 158. These enable us todefine some key measures:
❏ The percentage of people with personal development plans❏ The percentage completion of development plan actions (measured
annually)❏ The increase in the capability component of the Individual Asset
Multiplier (measured individually or collectively)❏ The number of people leaving because of perceived lack of oppor-
tunities for growth❏ Opinion survey questions relating to how people see investment in
their growth, opportunities for career development, availability offeedback, manager support for learning, availability of training fortheir needs.
These output measures will be most influenced by the prevailing cultureand an appropriate level of investment in training and development.
REWARDS AND RECOGNITION
In reward management there are four fundamental questions:
174 The Human Value of the Enterprise
❏ How should we determine an individual’s base salary?❏ When and why should we increase it?❏ How would we want to utilize bonuses and incentives?❏ What would we want to recognize in a nonmonetary way, and how
should we do it?
In the value-creating organization, it is logical that remuneration in totalshould reflect a person’s Human Asset Worth. However, we suffer from achicken-and-egg syndrome, since we have decided that salary should bethe basis of calculating HAW. It is the Individual Asset Multiplier part ofthis that should give us clues about the relative value of people.Fortunately, we do not have to rely on base salary alone.
Job evaluation and grading
Evaluating jobs for their size and responsibility is primarily aimed atinternal fairness, since it is possible to agree more easily about the natureof a job than it is that of a person, and this helps avoid accusations of dis-crimination as well. Nevertheless, fixing a grade for a given job hasincreasing difficulties in a value-creating organization.
❏ It assumes that jobs and organizations are static when they are usu-ally not
❏ It perpetuates hierarchy as an organizational model, and size ofresponsibility as a major source of “points”
❏ It assumes that the boundaries of the job will be the same for eachindividual holder
❏ It takes no account of the prior knowledge and experience of anindividual, nor their potential
❏ It searches for internal relativity in a world where often pay ratesare determined by external market factors
❏ It causes political games to be played to secure desired results.
Because of this, the principle of paying for the job must be questioned.Clearly it is not totally irrelevant, but at best it should provide only a baseframework for salary banding. There is an inherent lack of logic in the
Motivation and Commitment 175
assumption that the value of an employee relates primarily to their cur-rent job. Jobs are not static and their boundaries are increasingly deter-mined by the individual involved, especially in the case of knowledgeworkers.
There are good arguments for not having grades at all (for exam-ple, to encourage lateral career moves), and some broadbandingapproaches have largely eliminated them. However, people often need tohave some visible sense of progress other than salary increases. One prac-tical solution is to maintain a framework of salary banding based on jobresponsibility, but to have different grades available for a particular job.For example, if the evaluated level for a role is X, then the range of peo-ple undertaking the role could be from X – 1 to X + 3. Another way isthrough the use of progressive job titles within the same broad band.
In the British Civil Service—and, indeed, in other large bureaucra-cies—a person’s grade defines their cumulative value, at least as perceivedby superiors. The Service values you for your experience and consistencyof performance, and grades you accordingly. Whereas jobs are alsograded, the system of promotion is based on the person and you are avail-able for jobs requiring a person of your grade.
Many organizations in the UK have multiple career ladders wherepeople can rise to higher levels because of expertise alone, withoutbecoming managers. This approach is consistent with rewarding personalvalue, but is not a common practice in many other cultures where hier-archy predominates and it is unacceptable to have subordinates with ahigher salary.
Base salary and its increase
What should base salary reflect? In the past it mostly reflected the currentjob size, and people moved within the band allocated by either timeserved (as in the public sector in many countries, and in Japan generally),or by annual performance, or a combination. HR departments conductedsalary surveys of the market, against job groups and particular individualjobs, to decide the range of increase desirable. Some organizations havepolicies about positioning in the market; for example: “We aim to pay inthe upper quartile,” or some similar statement.
176 The Human Value of the Enterprise
External salary benchmarking is nearly always job based, and elab-orate analysis is done to take account of company size. Data relating toindividual incumbents is rarely included, and this means that a roughguide is all that is achieved. The salary an individual actually holdswithin a company, especially at a senior or specialist level, is often theresult of recruitment bargaining or of the way salaries and promotionshave progressed internally over time.
Competency-based pay is a move toward individual valuation andaway from the job focus. It is often firmly within the job evaluationframework and may be a substitute for performance-based pay, or anadditional factor. More commonly, the assessed competency level is posi-tioned within broad salary bands. The issue is what constitutes “compe-tency” and whether the factors are holistically related to contribution,rather than mere behavior.
What would a value-creating approach look like?
The amount of value added is not consistent from period to period, andrewards based on it should be in variable pay (on which there is moredetail below). The basic value of a person must be related to the factorsthat comprise our Individual Asset Multiplier, namely:
❏ The range of relevant capabilities❏ Potential for growth❏ General contribution level to value added❏ Alignment with values.
We would expect salary to increase with any positive movement in thesefactors. Capability should grow with experience—new experiences thatare relevant and valuable, not just time served. If we cannot see anychange over a year, it would make sense to question whether the personshould remain in the role. Getting new knowledge through a course orqualification per se is not enough; “capability” implies that a person canapply what they have learnt within their role.
Promotion also tends to be associated with a salary increase. Thisis to some extent a legacy of job evaluation and hierarchical thinking. If
Motivation and Commitment 177
the promotion is an upgrading on a professional “ladder” resulting fromdemonstrating a new level of knowledge and experience, it is a retro-spective reward for increasing capability. If, however, it is a promotion toa higher level of responsibility, a token rise may be given in anticipationof the extra value expected from the new role, with the opportunity forfurther increase as increased value is demonstrated.
It is probably a good idea to move away from a fixed date ofincrease for everybody. A flexible approach can help emphasize the focuson the individual. Computer company ICL gave every manager a “pot” ofmoney each year, and planned how it could be used throughout the yearto recognize individual promotions or other changes in value contribu-tion. Such increases would take into account any general rise in salariesthrough cost of living. When a person moved departments, they tooktheir planned increase with them.
Performance
The basis of salary increases, other than on promotion, has movedstrongly toward performance. HR departments agonize about the num-ber and wording of performance levels to reflect accurately what peoplehave achieved and how they have done so. Elaborate procedures aredeveloped around the objective setting and performance reviews, aimedat finalizing an annual rating that feeds into the pay increase, eventhough in times of low inflation the differential reward may be minimalbetween one level and another. Performance in recent years frequentlyreflects assessed levels of behavioral competence as well as achievementof job-based objectives.
There are many difficulties with this approach.
❏ The assumption that a person’s value increases—either internallyor externally—because of a year’s performance has little logic. Thatdoes not mean that we would not appreciate their performance andwant to reward it, but it brings us back to the fundamental ques-tion of what base salary should reflect.
❏ Even with preset objectives, there are a number of factors thatinfluence performance other than the person’s efforts and capabil-
178 The Human Value of the Enterprise

ity. It is rare that one can control one’s organizational destiny overa year, and objectives themselves become out of date often shortlyafter being set. Readers may have experienced, as I have, objectivesnot being set till well past the second half of the year!
❏ The process of setting objectives is far from perfect in most organi-zations. Often it is through negotiation, but sometimes objectivesare submitted by the individual and approved without much dis-cussion. One person’s tough objectives may be another’s piece ofcake—and yet when it comes to performance ratings achievementis the goal rather than the value added from the achievement.
❏ The rating process itself is fraught with what are often emotionaldifficulties. To give a rating lower than last year might be objec-tively justified but can ruin self-esteem, especially if that ratinginfluences promotion discussions. Consequently, managers tend tominimize conflict. One UK public-sector organization’s experiencewas that after two years 95 percent of the people were good or verygood—effectively a two-point scale. The original purpose of scaleshad been lost.
❏ Ratings are usually individual. For people whose main goal is ashared team objective, they would be inappropriate unless we canisolate their own contribution.
❏ A rating is an average—and averages are the enemies of truth.What matters is the detail of what went well and what did not, andwhy. In the end, a narrative summary has to be communicated tobe of any value; why go beyond this?
In conclusion, ratings are not to be recommended. The performance thatreally matters is the achievement of targets for adding value to stake-holders. It is much more logical to reward results achieved through vari-able pay systems than through base salary. Of course, consistently goodresults will be reflected in the added-value factor of the IAM. This is whycompanies like Exxon-Mobil and Enron use a ranking system for payawards based on perceptions of the individual’s worth.
Motivation and Commitment 179
Variable pay
Variable pay comprises incentives and bonuses: money-based rewardsthat depend on results achieved. Incentives are designed to motivate peo-ple toward specific kinds or levels of achievement. To be effective therehas to be a close and (as perceived) worthwhile relationship between theeffort and the reward. Bonuses reward achievement after an event, and theanticipation may be an incentive in itself even if the final amount is ini-tially unknown. The trend in recent years has been to move to a higherratio of variable to base, and to extend the principle of variable pay tomore and more people. Nevertheless, many organizations are still ratherconservative in this respect, and the public sector particularly is con-strained by government policies from implementing a reward strategythat reflects its organizational goals.
Variable pay should reflect what is delivered. It can be done at threelevels:
❏ The individual’s personal contribution ❏ The contribution of the team ❏ The contribution of the organization (or unit) as a whole. This is
often included to demonstrate the “one family” concept and tocounter parochialism. Also it is the results of the whole organiza-tion that influence investor confidence.
Many schemes at the enterprise level have been created on the basis ofEconomic Value Added (EVA), enabling employees to share in the over-all results of the company and encouraging them to understand how theycan contribute to the value-adding process. Hewitt Associates, one of theleading consultancies in this area, calls such schemes VBM, or Value-Based Management. “The over-arching goal of any genuine VBM system,”they say, “is to create a company culture pervaded with value-creatingbehaviors like improved productivity, eliminating waste and reducinginventory.”
EVA-based schemes have been spreading for managers’ incentiveplans, although outside the US it is rare to take them to all employees.One interesting exception is the US Postal Service, which has more than
180 The Human Value of the Enterprise
70,000 people in its scheme. In 3M and Eli Lilly, where EVA (or an equiv-alent) is the main base of performance management, schemes are beingprogressively taken further and further down the organization. Theseexamples are all financially driven, and are appropriate for long-termincentive plans. When used on an annual basis (or less), they may wellseem to focus on cost cutting and process engineering under anothername. Incentive plans that balance value creation for all stakeholders areto be recommended in order to be consistent with the logic of short- andlong-term value creation.
The other powerful way of sharing in the value goals of the com-pany is to enable employees to be shareholders, thereby doubling theirstakeholder role. In a concept pioneered in the US and taken up exten-sively in the UK, more slowly in Europe, increasing numbers of employ-ees are becoming part owners of their company.
In the value-creating organization everyone should share in wealthcreation, with a mixture of individual and/or team-based targeted incen-tives plus enterprise-wide rewards. The timing of payments needs to becarefully considered. When a bonus is only annual, some extraordinarybehavior can be seen toward the end of the year as people become moreand more focused on their bonus plan. What we want is consistentcontribution.
The value-creating organization will be very open with peopleabout the measures in use, explaining where necessary, and ensuring thatthey are understood and that the way in which they can be influenced isfully comprehended.
Many of the quantified indicators that are commonly used may nothave a clear relationship to value. Salespeople can still be bonused on“orders received,” for example; the result can be orders at any level ofprofitability. Staff managers may be bonused on project milestones, activ-ities that are part of their job in any case. An example would be: “To putin place a new leadership development program by July 1st.” This is atask objective without any real measure other than a time milestone. Atthe very least, it should be accompanied by a measure of the value addedthat results from the activity. Such a program should be linked to bothincreased leadership capability, as perceived by those led, and toimproved results from the leader’s team. This may require going beyond
Motivation and Commitment 181
the financial year in question to get the measurement—a clear case of along-term component. If such a program is running regularly, then a tar-get for increase in the parameters of success (e.g., changed 360º percep-tions, productivity) can form an ongoing performance measure for theindividual concerned.
Restructuring and job changes can make longer-term rewards diffi-cult to manage. And frequent rounds of “musical chairs” also makeachievement of sustainable added value difficult. A good guideline to fol-low might be that a person stays in a role long enough to achieve boththe current and sustainable longer-term added value that the role isdesigned to produce.
Benefits
In some countries many benefits have come to be accepted as normaladditions to salaries, and these comprise a significant part of the valueadded to individuals. Benefits have been built on the top of job evalua-tion/grading systems and sometimes may be serious aspirations.Employees may be desperate to reach the grade that brings the companycar, or entry to the stock option executive group.
These kinds of incentive, if built on the grading structure, encour-age people to think that their value is increasing solely through hierar-chical progression. In fact, this is a very undesirable philosophy for theorganization. People who are unsuitable for management may feel thatthis is their only way to reach their aspirations; careers are forcedupwards in silos when we may need people to grow laterally and buildbreadth across several functions. Particularly in the UK, where some 40percent of new cars are corporately owned, the company car is a real sym-bol of status and often defines the level of a person in the organization.
All this is slowly changing for the better, toward fully or partiallyflexible benefit frameworks. Providing a menu of benefits, which can addup to a percentage of salary, enables individuals to tailor this part of theirremuneration to their individual circumstances. Best of all, it removes theinternal pressures for people to manage their careers in a way that maynot be in either their or their organization’s interest.
182 The Human Value of the Enterprise
Nonmonetary recognition
Nonmonetary recognition can provide an equally strong opportunity toreinforce key messages and reward desired behaviors. For example, therecognition that comes from delivering seminar papers may be highlyprized by research people. Some enjoy travel opportunities; others hav-ing time to contribute to their local communities. Being celebrated inthe newsletter may be appreciated, but a sincere “thank you” can makesomeone feel good. As with all recognition, a range of available optionsthat appeal to the individual is a better strategy than a general fixedapproach.
The value-creating organization particularly recognizes the following:
❏ Customer delight—occasions when a customer is so pleased thatthey become an “evangelist” for the organization as a supplier
❏ Suggestions and innovations, better ways to do things—the cost ofawards here is almost certain to be very much less than the bene-fits that result
❏ Knowledge creation and sharing—role models should be celebrated❏ Innovative learning—examples of creative initiatives❏ Recruitment of valuable staff—what more value-adding contribu-
tion than increasing the human asset value of the organization?❏ Enhancement of the organization’s image—through public presen-
tations or involvement in the community.
Measures of the effectiveness of rewards and recognition onmotivation
It is interesting that Davenport, in studying what mattered most to highand low performers, found that remuneration on its own had the lowestpriority for both groups. However, there are limits and we need to be reg-ularly checking how people feel about their levels and makeup of finan-cial reward. Dissatisfaction with salary can result from a perceived unfairincrease, from matching oneself against the market, or from feeling thatothers are doing better without good cause. It can also be due to the waythe system for administering rewards is managed. All of these need to be
Motivation and Commitment 183
checked. People will leave quoting salary as their reason—we should tryto distinguish between those who were genuinely dissatisfied and thosewho were attracted by the “offer they could not refuse.”
With regard to recognition, we need to check whether people feelit is enough, and what they think of the approaches we use. We mightalso track the numbers of people who are recognized in certainschemes—for example, excellence awards, idea contributors, or externalhonors granted.
Thus we have:
❏ Opinion survey questions built around the fairness of remunera-tion levels and systems
❏ Opinion survey questions concerning levels of recognition❏ Numbers of people receiving different kinds of recognition ❏ Reasons for leaving related to reward dissatisfaction.
HR policies and practices determine these areas and need continualreview. Whereas we want to benchmark against other companies and themarket, there are some dangers in changing to what is seen as best prac-tice in order to be fashionable without being very sure that the changewill enhance our value-creating environment.
HOW DO WE MEASURE CULTURE?
Almost certainly, we shall need to track culture on a number of criticaldimensions. We cannot measure culture in any absolute way, but we cancharacterize it and plan changes.
It is very unlikely that we will achieve any cultural change unlesswe know where we are going. We need more precision than mere one-linestatements such as “being more customer focused” or “being lean andmean.” People need a set of behaviors with which to identify, and thesemust be supported with processes that require those behaviors to happen.In tracking progress, we have two options:
❏ Utilizing an established cultural change instrument
184 The Human Value of the Enterprise
❏ Creating our own template, a set of statements describing wherewe want to be.
The diagnostic marketplace offers a number of instruments. One such isthe Organization Culture Inventory (OCI). This uses 12 interactingdimensions that are scored from one to six, as follows:
❏ Humanistic-encouraging—participative, involving❏ Affiliative—priority on good relationships❏ Approval—conflict avoiding❏ Conventional—rule based, risk averse❏ Dependent—hierarchical and centralized❏ Avoidance—blame placing, cautious❏ Oppositional—confrontational❏ Power—based on authority levels❏ Competitive—win-lose; me first❏ Perfectionistic—100% solution, no mistakes, highly detailed❏ Achievement—goal-oriented, problem solving❏ Self-actualizing—creative, fun, innovative
The main advantages of these openly available tools are that many (likethis one) are well researched and enable comparisons with other organi-zations to be made.
Creating your own template
There are benefits in building our own instrument, especially if it is doneby the senior management team defining the culture for which they wantto aim. It will then be clearly owned by its creators. As they identify gapsbetween the current situation and the desired state, they will set theirown priorities for cultural change programs and drive them. It will alsofocus on the key areas that they feel are important, rather than attempt-ing to describe every aspect of a culture. They need to be careful that theydo not commit themselves to values and behaviors that they are unableto demonstrate personally, however.
The recommended process for creating a template is as follows:
Motivation and Commitment 185
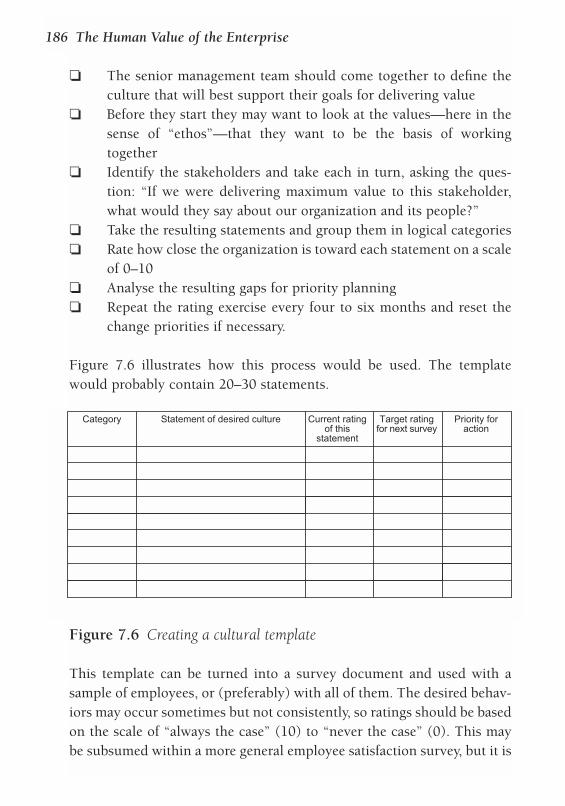
❏ The senior management team should come together to define theculture that will best support their goals for delivering value
❏ Before they start they may want to look at the values—here in thesense of “ethos”—that they want to be the basis of workingtogether
❏ Identify the stakeholders and take each in turn, asking the ques-tion: “If we were delivering maximum value to this stakeholder,what would they say about our organization and its people?”
❏ Take the resulting statements and group them in logical categories❏ Rate how close the organization is toward each statement on a scale
of 0–10❏ Analyse the resulting gaps for priority planning❏ Repeat the rating exercise every four to six months and reset the
change priorities if necessary.
Figure 7.6 illustrates how this process would be used. The templatewould probably contain 20–30 statements.
This template can be turned into a survey document and used with asample of employees, or (preferably) with all of them. The desired behav-iors may occur sometimes but not consistently, so ratings should be basedon the scale of “always the case” (10) to “never the case” (0). This maybe subsumed within a more general employee satisfaction survey, but it is
186 The Human Value of the Enterprise
Category Statement of desired culture Current ratingof this
statement
Target ratingfor next survey
Priority foraction
Figure 7.6 Creating a cultural template
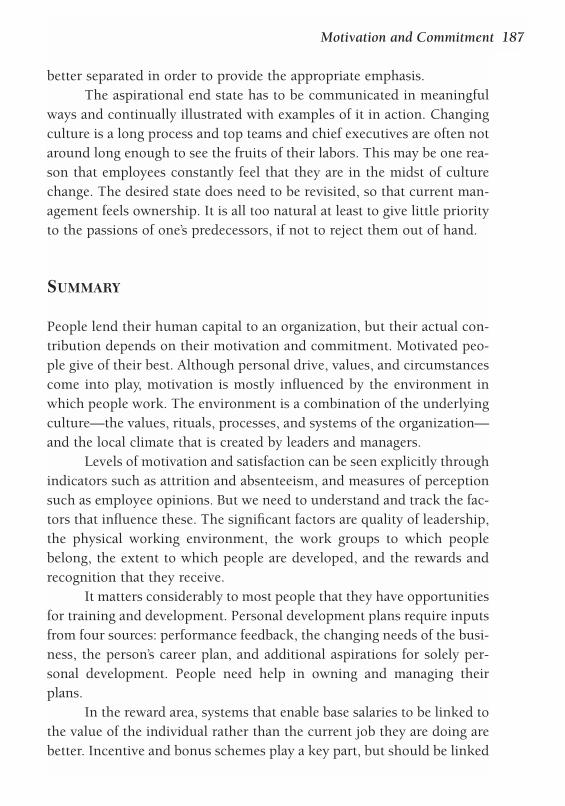
better separated in order to provide the appropriate emphasis. The aspirational end state has to be communicated in meaningful
ways and continually illustrated with examples of it in action. Changingculture is a long process and top teams and chief executives are often notaround long enough to see the fruits of their labors. This may be one rea-son that employees constantly feel that they are in the midst of culturechange. The desired state does need to be revisited, so that current man-agement feels ownership. It is all too natural at least to give little priorityto the passions of one’s predecessors, if not to reject them out of hand.
SUMMARY
People lend their human capital to an organization, but their actual con-tribution depends on their motivation and commitment. Motivated peo-ple give of their best. Although personal drive, values, and circumstancescome into play, motivation is mostly influenced by the environment inwhich people work. The environment is a combination of the underlyingculture—the values, rituals, processes, and systems of the organization—and the local climate that is created by leaders and managers.
Levels of motivation and satisfaction can be seen explicitly throughindicators such as attrition and absenteeism, and measures of perceptionsuch as employee opinions. But we need to understand and track the fac-tors that influence these. The significant factors are quality of leadership,the physical working environment, the work groups to which peoplebelong, the extent to which people are developed, and the rewards andrecognition that they receive.
It matters considerably to most people that they have opportunitiesfor training and development. Personal development plans require inputsfrom four sources: performance feedback, the changing needs of the busi-ness, the person’s career plan, and additional aspirations for solely per-sonal development. People need help in owning and managing theirplans.
In the reward area, systems that enable base salaries to be linked tothe value of the individual rather than the current job they are doing arebetter. Incentive and bonus schemes play a key part, but should be linked
Motivation and Commitment 187
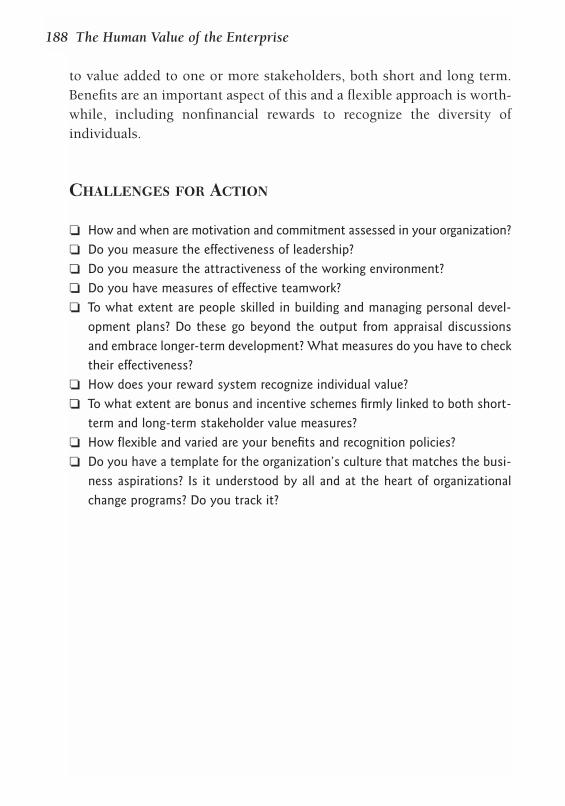
to value added to one or more stakeholders, both short and long term.Benefits are an important aspect of this and a flexible approach is worth-while, including nonfinancial rewards to recognize the diversity ofindividuals.
CHALLENGES FOR ACTION
❏ How and when are motivation and commitment assessed in your organization?
❏ Do you measure the effectiveness of leadership?
❏ Do you measure the attractiveness of the working environment?
❏ Do you have measures of effective teamwork?
❏ To what extent are people skilled in building and managing personal devel-
opment plans? Do these go beyond the output from appraisal discussions
and embrace longer-term development? What measures do you have to check
their effectiveness?
❏ How does your reward system recognize individual value?
❏ To what extent are bonus and incentive schemes firmly linked to both short-
term and long-term stakeholder value measures?
❏ How flexible and varied are your benefits and recognition policies?
❏ Do you have a template for the organization’s culture that matches the busi-
ness aspirations? Is it understood by all and at the heart of organizational
change programs? Do you track it?
188 The Human Value of the Enterprise
8Innovation and Learning
IN THE LAST CHAPTER WE EXAMINED MOTIVATION AND COMMITMENT, AND
the specific aspects of culture and climate that affect them. An orga-nization dedicated to future value growth is one that places a pre-mium on innovation, flexibility, responsiveness, continuous
learning, knowledge sharing, and adaptability to change. Many organiza-tions readily espouse these aspirations, but find it difficult to make thema reality.
In this chapter the characteristics of an innovative environment arediscussed, and creativity is examined as a capability. The concept of alearning organization is assessed, particularly at the level of the organiza-tion as a whole. We look at how knowledge is managed and shared, andsetting up a system to do this effectively. This is all fundamentally depen-dent on the expectations, norms, and processes that make up the cultureof the organization. The mindset of the human resource professional inthe value-creating organization is considered, as is how an organization’sHQ might be restructured to put the right focus on intellectual capitalmanagement.
INNOVATION
When investment analysts look at a company, they are heavily influencedby news about new products and services that are potential revenuestreams. But innovation means much more than designing new productsor services. Innovation includes:
❏ Acceptance of and readiness for change in every person, andthroughout the organization
❏ Dedication to continuous improvement of processes❏ Willingness to experiment and explore new ways of working, new
suppliers, new technology❏ Eagerness to learn from others❏ Creating new markets and customers❏ Building new relationships and alliances❏ Establishing new approaches to markets: channels and pricing
strategies❏ New and varied approaches to organization, management, and per-
formance measurement.
On the first day’s induction of new graduates in my first job, this maximwas given to us and has stayed with me ever since: “There is always a bet-ter way, and it is the job of all of us here to find it.” In the manufacturingdepartment, bonus schemes for all employees were based partly on mea-sures of innovation and change. One was about new methods, defined asany change that achieved the same quality of output but required lessresource. An annual target was set for a cost savings percentage (approx-imately equivalent to the rate of inflation), and teams around the factoryworked toward their particular part of the target. Another measure wasrevisions, which was the shortening of standard times for operationaltasks as better ways of working emerged. Everyone was involved in theprocesses of looking for improvement and was rewarded for it.
The process of innovation is itself a key business process. Some ofthe fundamental issues include: How are customer needs identified? Howare these translated into something customers want to buy? How are newproducts and services introduced and delivered? The measures here areabout fitness for purpose, speed to market, and rapidity of takeup by themarket. Another important issue is the number of times a product mighthave to be modified in the light of customer reaction. This factor can becritical, especially if the media pick up early bad signals about a newintroduction.
What characteristics do we expect of an environment that encour-ages innovation? It would include the following:
190 The Human Value of the Enterprise
❏ There are formal and informal systems for encouraging suggestionsfor improvement
❏ Suggestions are analyzed quickly and evaluated with an open mind❏ Suggestors are involved in implementation of successful ideas❏ Everyone is expected to contribute to change and improvement❏ Mistakes made from experimentation are in no way penalized (in
some companies “glorious failures” are celebrated)❏ Money and time are made available for experimentation❏ Exceptional new ideas are widely publicised❏ People are generally empowered to make change without seeking
prior authority.
In addition to these creativity-encouraging behaviors, disciplines withinworking practices must exist. The aim of product/service innovation is togenerate future profitability, not merely to have a volume of new productideas. Each market introduction requires manufacturing, marketing,training, selling, and servicing—all of which are costs that may not havea return. Those involved in design and development need constant closeliaison with frontline people, preferably with customers themselves. Theyalso need business knowledge, to enable them to understand the dynam-ics of product introduction costs and subsequent returns.
Peter Drucker argues that innovation is to do with hard systematicwork rather than genius or inspiration. He recommends the zero-basedaudit, taking a cold look at every process and aspect of the organizationevery three years or so, putting them on “trial for their lives.” Druckerrecognizes how important external stimuli are to innovation and puts agreat deal of emphasis on continuous listening, benchmarking, andreceiving feedback—all key aspects of the learning organization.
In Thriving on Chaos Tom Peters gives equally good advice. Heemphasizes the importance of multitudes of “small starts” and gives tenpreconditions for this to work well:
❏ Let everyone talk to customers and listen❏ Get customers into the organization ❏ Establish a “do-a-pilot” mentality rather than “write a proposal”❏ Use small teams for almost any task
Innovation and Learning 191
❏ View suppliers as co-innovators rather than adversaries❏ Remove bureaucracy to let small teams get on with it❏ Flatten the structure and work across functional boundaries❏ Develop a market-creation rather than market-sharing mentality❏ Treat products as experiments meriting constant improvement❏ Management must live the message of rapid innovation.
Companies frequently have innovation as one of their espoused values.3M has one of the best-known reputations in this area, and it features“3M Innovation” as a company strapline. It puts great emphasis on thefreedom to fail, and in R&D has built the priority of innovating into itsways of working. Here are some examples:
❏ The 25 percent rule: 25 percent of sales must come from productsdeveloped within the previous five years
❏ The 15 percent rule: people may spend up to 15 percent of theworking week at their discretion, provided it is product related
❏ Genesis grants: up to $50,000 for researchers to develop projectspast the idea stage
❏ Golden Step Awards: for projects achieving $2 million profitablesales within three years of launch.
Another company with a very successful innovation culture is IDEO, acontract R&D firm based in California. This was established in 1978 andhas won more than 30 Industrial Design Excellence Awards. “We believein a prototype-driven culture, not specification-driven,” says founderDavid Kelley. “That means learning from experience and expecting tomake mistakes.”
Some interesting aspects of IDEO’s culture are:
❏ No recruitment plans, but if someone is seen or approaches thecompany “who we must have,” they are hired
❏ Any potential hire is lunched by 10 employees who rate theprospect, who needs to be at 9 or 10 on all the selection criteria
❏ No hierarchy or organization charts, and therefore no opportunityfor promotion; employees do have mentors, however
192 The Human Value of the Enterprise
❏ Motivation comes from internal trophies presented at projectcompetitions
❏ There is no HR department❏ A great deal of effort goes into cross-fertilization of ideas and people.
Resources
In many organizations there are surprisingly few people dedicated tobuilding the future. There are many who are supposed to worry about italong with dealing with the present—and, not surprisingly, it is usuallythe future that gets squeezed out. In a sense, we want everyone to bethinking about the future in terms of continual improvement, whatevertheir role. But we also want people whose prime concerns are:
❏ Understanding what products and services people will want to buyin the future
❏ Designing and developing those products and services ❏ Understanding the trends in the competitive marketplace❏ Seeking and evaluating potential partners❏ Identifying new areas of competitive advantage❏ Building the future capability of people ❏ Culture and processes to be aligned with business goals.
Innovation/creativity as a personal capability
Individuals vary enormously in their ability to “think out of the box,”create new concepts, or develop new working methods. But truly creativepeople are rare, and do not always fit in easily with the bureaucracy asso-ciated with large organizations. However, we are after an attitude of mind,both in individuals and in the culture of which they are part, that istotally oriented to improvement. This is surely within everybody’s scope;all it requires is motivation and a supportive environment.
Innovative people are renowned for the following:
❏ Constantly challenging their own assumptions and those of others❏ Seeing problems as learning and innovation possibilities
Innovation and Learning 193
❏ Understanding and regularly using basic techniques for challeng-ing the status quo, like brainstorming
❏ Always being curious.
The implications for managers are about providing time for thinking andexperimentation, allowing mistakes, always being open minded, andencouraging ideas.
Fiona Patterson, together with Oxford Psychologists Press, hasdeveloped a specific tool for assessing innovation potential based on fiveyears’ research. Called the Innovation Potential Indicator, it focuses onkey behaviors that enhance or impede change and improvement. It mea-sures four scales:
❏ Motivation to change—the extent to which an individual is open tochange
❏ Challenging behavior—the questioning of the status quo❏ Consistency of work styles—an individual’s preferred approach to
work❏ Adaptation—the preference for doing things differently as opposed
to using tried-and-tested ways of working.
This instrument assesses natural inclinations and has value as such, but,as we have seen, how well they flourish is very much influenced by theenvironment in which people work.
Appropriate measures of innovation
We summarise the output measures of successful innovation in the nextchapter, which is focused on the contribution of people. From a culturalpoint of view, however, here are some indicators that are inputs to effec-tive innovation:
❏ Investment levels in intellectual capital—in people development,product/service development, market growth, systems that willbring better quality and delivery, etc.—as a percentage of revenues(or, for people, of employment cost)
194 The Human Value of the Enterprise
❏ Full-time equivalents (FTEs) of people spending time on futurevalue as a percentage of all FTEs
❏ Percentage of people rated high on creativity❏ Appropriate cultural measures and opinion survey questions that
support openness, experimentation, and empowerment.
A LEARNING ENVIRONMENT
Innovation and change come from learning. Learning in some people’sminds is associated primarily with study leading to qualifications. To oth-ers it is predominantly about training. Thetruth is that the majority of adult learningcomes from experience and experimentation.
The term “learning organization” datesfrom around 1989, and is frequently adopted asan aspiration, although many organizationsstruggle to realize its potential in practice. It is fundamental to growingfuture stakeholder value. The subject continues to preoccupy managementdebate, but the essential point is that a learning organization manageslearning in a deliberate and systematic way. In other words, learning is notsomething that simply happens, but rather something that is managed.
The best-known description of a learning organization is found inPeter Senge’s The Fifth Discipline. He sees it as maximizing fivedisciplines:
❏ Personal mastery—individual capability❏ Team learning—groups of people learning together❏ Shared mental models—a common view of how we should operate
together❏ A shared vision—a common aspiration that all individuals embrace
and the most powerful of all:
❏ Systems thinking—seeing the connectivity and synergy of the dif-ferent parts of the organization working together.
Innovation and Learning 195
THE MAJORITY OF ADULT LEARNING
COMES FROM EXPERIENCE AND
EXPERIMENTATION
In an effort to break the concept down to the practical details of everydayworking life, Elizabeth Lank (who became director of knowledge man-agement for ICL) and I developed a model that is described in The Powerof Learning. We defined a learning organization as one that:
harnesses all the brainpower, knowledge and experience available to it,in order to evolve for the benefit of all its stakeholders.
An organization needs a culture that maximizes learning at three levels: theorganization as a whole, the team or workgroup, and the individual. Thereare four key enablers to its achievement: a clear committed policy, support-ing leadership behaviors, people management processes, and effective use ofIT. We produced a Learning Organization Index, a template of some 70 prac-tices that typified an organization wanting to manage learning effectively.
Something like this can provide a good starting point.Nevertheless, it can be more beneficial to create a template that is specificto a given organization, not least so that particular and familiar ways ofsaying things can be adopted.
Managing learning
A good learning organization looks beyond training and off-the-job pro-grams. It takes a much broader view and considers the learning environ-ment as encompassing a wide range of activities. These four modes oflearning illustrate the principle.
❏ Education—this is about knowledge and insights, changing peo-ple’s “mental map.” It is not confined to studying for qualifications,valuable as these can be, but includes any form of learning aimedprimarily at the mind. This includes many business school pro-grams, e-learning offerings, and self-study through books andresearch. In terms of our approach to capability, it influences (inaddition to qualifications) the knowledge part of know-how, andalso may change attitudes and build networks.
❏ Training—aimed at skills, in business and professional know-how,and personal behaviors.
196 The Human Value of the Enterprise
❏ Experience—here we mean learning from one’s current job, plusthrough planned workplace assignments, projects, secondments,career moves, job rotation, special responsibilities, and so on.Experience also affects the other areas of capability: growing know-ledge, skills, and networks.
❏ Learning from others—this includes coaching, mentoring, sharedexperiences, belonging to communities of practice, seminars andconferences. Coaching relates more to specific problem areas need-ing help; mentoring is more a longer-term advisory role, oftentaken by someone other than a person’s manager. Organizationsmay have formal mentoring processes for certain groups of people(such as new graduates), but a network of informal mentoring willalmost certainly exist as well.
Any identified area of capability growth needs clear, SMART objectives,with the desired level of proficiency clearly stated. The learning solutionchosen might well involve a combination of the modes above. Table 8.1shows, for example, a menu of learning options for developing changemanagement capability:
There is a wealth of literature about the evaluation of training, ways toshow that training has been successful and influenced the bottom line.There are many other factors that may influence the final goal, but if wecan show that relevant capabilities themselves were enhanced, the train-ing will have an eventual effect on a key outcome. Much training may in
Innovation and Learning 197
Table 8.1 Example of learning options for change management capability
EDUCATION
• Understanding whenchange is necessary andwhen not• Doing cost–benefitanalyses on changeproposals• Models of organizationaland individual change:– Books (Kotter, Eccles,Bridges)– E-modules– Workshops– Kotter video– Techniques of analysis
TRAINING
• Workshops in self-awareness in change,communication, andinvolvement• Problem and potentialproblem analysis• Project management• Learning from experience
LEARNING FROMOTHERS
• Coaching from anexperienced manager ofchange• Exchange ofexperiences—successesand failures• Research of a changeproject against a chosenmodel—what worked andwhat didn't
EXPERIENCE
• Managing a real-lifechange project through adisciplined process; reviewwith colleagues or coaches• Self-analysis of personalexperience as a recipientof change
fact be subtracting value by taking people away from their workplace andengaging them in activities that do not increase their capability for pro-viding value.
ORGANIZATIONAL LEARNING AND KNOWLEDGEMANAGEMENT
Learning at the organizational level is about a mindset: of openness, lis-tening, constant iteration and adaptability. It is also about benchmarkingwith the best, to see what can be learned from outside. This includes set-ting up listening mechanisms with stakeholders: surveys, focus groups,meetings with management, and so on.
Lew Platt, former CEO of Hewlett-Packard, is quoted as saying,“Our problem is we don’t know what we know.” What he meant was that
each individual did not have access to all theknowledge and experience available in thecompany, and consequently was missing outon an immense potential advantage to theirwork effectiveness. Mistakes are repeated,projects are duplicated, successful new ideaskept quiet about, time wasted searching for
information already there. The acquisition, exchange, and application ofknowledge throughout the organization form what is often called know-ledge management. This is an essential part of a learning organizationculture, and therefore vital to human capital growth.
The sharing of knowledge in itself builds innovation, as ideas aresparked through interaction. Systematic management of knowledge there-fore helps both profitability and the creation of new intellectual capital.
What should be shared?
What kind of knowledge will be useful to others? We do not need to beinundated with the new knowledge acquired by every individual everyday, even if that were feasible. We need some kind of architecture for whatreally needs to be shared. Individuals find their own way of recording or
198 The Human Value of the Enterprise
AN ENORMOUS AMOUNT OF VALUE IS
LOST THROUGH INEFFICIENT USE OF
WHAT IS ALREADY KNOWN IN AN
ORGANIZATION.
remembering what is important to them, and each group needs to do thesame. At the level of the organization as a whole, there may be relativelylittle that is of interest to every employee, beyond shared informationabout the infrastructure and news of the company. Nevertheless, the corestrategies, competences, and processes of the organization will be sup-ported by what might be called “strategic knowledge assets.” Such assetsshould be owned and maintained by designated persons. They are thepeople who make sure that all who are involved in using them know whatshould be shared for general benefit.
An example of a core strategy might be “To focus on customer ser-vice and become the best”; and a core competence could be “Our supplychain.” A core process might be the methodology for managing mergersand acquisitions. All of these would be supported by our accumulatedknowledge in the area concerned.
Elizabeth Lank, writing in Long Range Planning, listed three cate-gories of knowledge for sharing.
❏ Repositories of reference material—This includes documents thatcan be shared or reused, such as proposals, market research, prod-uct uses, and so on. It also includes basic information about theinfrastructure of the organization: sites, procedures, policies, etc.
❏ Expertise maps—These enable the sharing of tacit knowledge totake place, making available the knowledge, expertise, and experi-ence of each individual in a way that enables easy access. It is morethan a job title and phone number, more than a CV. What we needis people’s personal profiles, but including past experience andareas outside of the workplace. The experience needs to be spe-cific—e.g., not just “Five years of project management experience,”but “Project management of a £5 million software installation forlocal government.” People should also include specialized know-ledge outside of work itself, which may be useful in some specificcustomer situations. So if a customer has a passionate interest inflying, the salesperson might want to find out more about it from acolleague, or even use that colleague in the selling process. Thisenables employees to quickly find the experts who can help them.NatWest Markets, an investment bank, created a “Green Pages”
Innovation and Learning 199
with the slogan “Two calls to find out anything you need.” BPAmoco has been immensely successful with a directory calledConnect, where people have individual web pages on the companyintranet.
❏ Just-in-time knowledge—Here we are bringing news, both internaland external, to people as it happens, enabling live discussionabout problems, and providing training or formalized knowledgeavailable as and when it is wanted.
How will sharing take place?
Many knowledge management initiatives have been driven by IT depart-ments, and some powerful tools have been developed. Individuals canprofile their interests and special search software will comb the internetdaily to find items of interest, which then appear in their mailbox. Theability to find information and to query or discuss with colleagues hasgrown very fast. Technology is not the problem! However, it can onlywork with what it is given, and is only useful so long as it is used. Manyhave found that the practicalities of input of, and access to, knowledgesystems are frustrating and time consuming. Surfers of the internet areaware of how long it can take to find out quite simple things despite theever increasing sophistication of search engines, because they are copingwith a mounting volume of available information and knowledge.
Organizations with experience in knowledge management haverealized the importance of facilitating face-to-face exchange and onlineelectronic discussions, rather than relying solely on complex electronicdatabases of text and reports and inputs of variable quality. Web andgroupware-based tools are becoming more and more sophisticated (andeasier to use) all the time, but harnessing them is always subject to themotivation of people to engage with them.
Why should people participate?
Why should an individual give their knowledge freely to others, or findout what others have done? There may be many excuses for not doing so.A very real problem is time: some of the more sophisticated knowledge
200 The Human Value of the Enterprise
management environments provide too much for people to access, evenwith the best will in the world. Accessing all the information availableand keeping up to date with it can consume many hours each week, asdoes taking the time to record and share knowledge and experience as itis acquired.
There are also deeper barriers. People see their knowledge as theirpersonal human capital, their power, and giving it to others might be anunacceptable loss of security. Programs to capture people’s knowledge donot often work well. Much better is to let the organization know who hasexpertise and how to get in touch with the right person. Helping a col-league is likely to be more amenable than giving to a system, and manypeople enjoy others coming to hear about what they know. It buildsrather than threatens their self-esteem. They can also control how muchthey give.
There may also be a natural obstinacy about accessing what othershave found, a desire to learn from your own mistakes or do it your way.These attitudes may be embedded in groups as much as in any individ-ual. The question to be answered always is: “What’s in it for me?” Perhapsit will make the job easier by providing easy access to knowledge that willhelp, or there may be some positive recognition for acquiring and shar-ing new knowledge.
One way to encourage people to take some ownership for know-ledge sharing is to foster communities of practice. McKinsey defines acommunity of practice as “a group of professionals informally bound toone another through exposure to a common class of problems, commonpursuit of solutions, and thereby themselves embodying a store of know-ledge.” Such communities can emerge naturally, but boundaries encour-age isolation in the devolution and decentralization of many largeorganizations.
National Semiconductor set up a Communities of Practice Council,with a community for each of the critical technologies for its business.The Council helps the communities deal with the technical side of com-munications, and provides funds for meetings and travel. The companyfound that building these communities helped staff retention at a timewhen this was a major problem. However, it avoided trying to manage thecommunities. Some of the most valuable experience has been in errors
Innovation and Learning 201
and mistakes from which people have learned a great deal, but they maynot be too keen to publicise them for all to see. They will share them withpeople they trust, and that is what communities of practice foster.
The supporting culture
Expectations in the working environment condition much of our behav-ior. What is acceptable and what is not acceptable? What is encouragedand what is discouraged? Admonitions and exhortations to be good shar-ers of knowledge are unlikely to achieve very much. Leaders are respon-sible for setting expectations and role modeling them. Unlike someeastern cultures, most western ones do not naturally encourage sharing.
Some of the characteristics we want to see in a value-creating orga-nization that is focused on knowledge management are these:
❏ Positive encouragement for sharing through setting up opportuni-ties and recognizing those that do this
❏ Outlawing personal blame when things do not go as anticipated;open learning from mistakes
❏ Having “managing knowledge” as an established and expectedcapability for everyone
❏ Building knowledge-recording disciplines into everyday processes❏ Giving time for storytelling❏ Providing an emphasis on coaching and knowledge transfer from
experienced people to the less experienced ❏ Systematic induction into new positions, including internal
transfers❏ Publicising (on a database system) each person’s special knowledge
and experience ❏ Using performance discussions to emphasize what is expected.
Building a knowledge-managing organization
Elizabeth Lank listed five practical suggestions gleaned from her experi-ence of trying to make knowledge management more effective in a largecomputer systems company.
202 The Human Value of the Enterprise
❏ Ensure that individual performance measurement and reward donot get in the way of sharing. This means not only care in thedesign of individual schemes, but providing incentives for peopleto contribute. In British Telecom, small financial inducements aregiven for people to both share and access information that is con-sidered strategically vital. It is not difficult to track individual con-tributions and reward them accordingly.
❏ Provide public recognition of the desired behaviors: encouragingpublication and speaking, and making knowledge sharers “heroes.”
❏ Integration with key business processes. Processes form the every-day life of an organization, and some simple disciplines can makeall the difference. In the UK, a unit of the Post Office called PostOffice Consulting has made this aspect a priority. Its project man-agement procedures, for example, not only have mandatory projectreviews with lessons learned to be posted on the database, but rightat the start a “knowledge plan” must be prepared. This is designedto force teams to think of the knowledge they should access beforethey start, how they will manage ongoing knowledge during theproject, and what they will do at the end.
❏ The role of IT. This is not only having sophisticated systems, butalso making sure that people know how to use them effectively.There are a surprising number of managers who are relatively illit-erate on basic IT applications; they can just about manage email. ITskills are essential for everyone if we want to maximize knowledgesharing.
❏ Make it easy. There are many demands on time, and people quicklybecome impatient. Systems must be as user friendly as possible. Ithelps to have some knowledge specialists who assist with the trans-fer of tacit knowledge, that in individuals’ minds and memories,into explicit knowledge, available to everyone. In Post OfficeConsulting, there are knowledge champions who take accountabil-ity for knowledge management in their area and help colleagues toparticipate. General Motors in the US instituted a process of deci-sion tracking, where trained people interviewed executives afterkey decisions had been made to understand what led to their judg-ments. In ICL’s service business a knowledge engineer has the job
Innovation and Learning 203
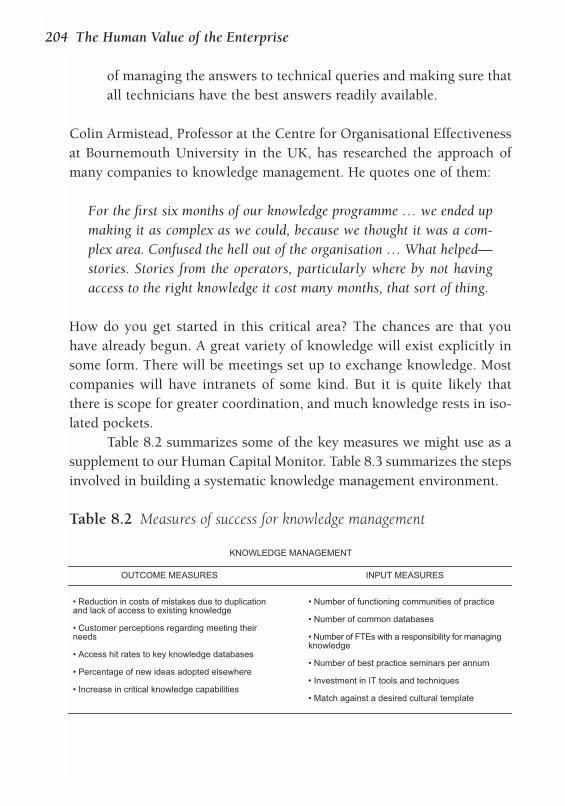
of managing the answers to technical queries and making sure thatall technicians have the best answers readily available.
Colin Armistead, Professor at the Centre for Organisational Effectivenessat Bournemouth University in the UK, has researched the approach ofmany companies to knowledge management. He quotes one of them:
For the first six months of our knowledge programme … we ended upmaking it as complex as we could, because we thought it was a com-plex area. Confused the hell out of the organisation … What helped—stories. Stories from the operators, particularly where by not havingaccess to the right knowledge it cost many months, that sort of thing.
How do you get started in this critical area? The chances are that youhave already begun. A great variety of knowledge will exist explicitly insome form. There will be meetings set up to exchange knowledge. Mostcompanies will have intranets of some kind. But it is quite likely thatthere is scope for greater coordination, and much knowledge rests in iso-lated pockets.
Table 8.2 summarizes some of the key measures we might use as asupplement to our Human Capital Monitor. Table 8.3 summarizes the stepsinvolved in building a systematic knowledge management environment.
204 The Human Value of the Enterprise
Table 8.2 Measures of success for knowledge management
INPUT MEASURES
• Number of functioning communities of practice
• Number of common databases
• Number of FTEs with a responsibility for managingknowledge
• Number of best practice seminars per annum
• Investment in IT tools and techniques
• Match against a desired cultural template
OUTCOME MEASURES
• Reduction in costs of mistakes due to duplicationand lack of access to existing knowledge
• Customer perceptions regarding meeting theirneeds
• Access hit rates to key knowledge databases
• Percentage of new ideas adopted elsewhere
• Increase in critical knowledge capabilities
KNOWLEDGE MANAGEMENT
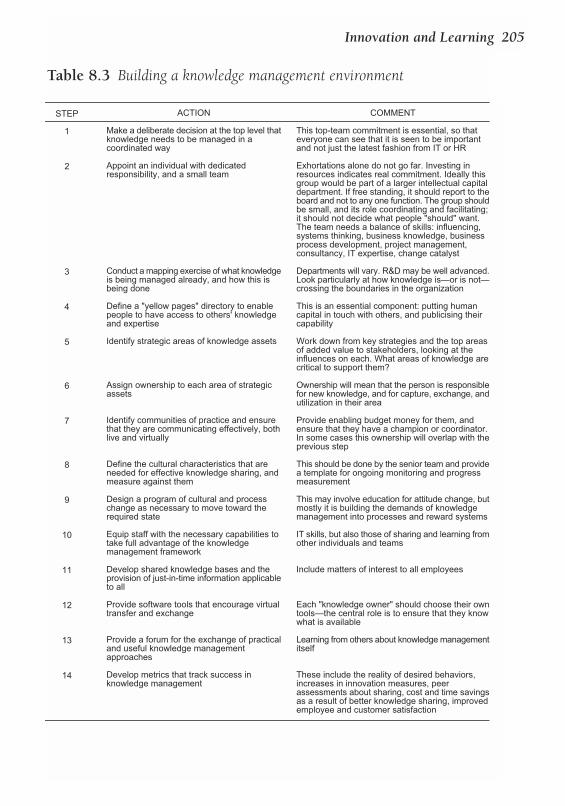
Innovation and Learning 205
Table 8.3 Building a knowledge management environment
STEP
1
2
3
4
5
6
7
8
9
10
11
12
13
14
ACTION
Make a deliberate decision at the top level thatknowledge needs to be managed in acoordinated way
Appoint an individual with dedicatedresponsibility, and a small team
Conduct a mapping exercise of what knowledgeis being managed already, and how this isbeing done
Define a "yellow pages" directory to enablepeople to have access to others' knowledgeand expertise
Identify strategic areas of knowledge assets
Assign ownership to each area of strategicassets
Identify communities of practice and ensurethat they are communicating effectively, bothlive and virtually
Define the cultural characteristics that areneeded for effective knowledge sharing, andmeasure against them
Design a program of cultural and processchange as necessary to move toward therequired state
Equip staff with the necessary capabilities totake full advantage of the knowledgemanagement framework
Develop shared knowledge bases and theprovision of just-in-time information applicableto all
Provide software tools that encourage virtualtransfer and exchange
Provide a forum for the exchange of practicaland useful knowledge managementapproaches
Develop metrics that track success inknowledge management
COMMENT
This top-team commitment is essential, so thateveryone can see that it is seen to be importantand not just the latest fashion from IT or HR
Exhortations alone do not go far. Investing inresources indicates real commitment. Ideally thisgroup would be part of a larger intellectual capitaldepartment. If free standing, it should report to theboard and not to any one function. The group shouldbe small, and its role coordinating and facilitating;it should not decide what people "should" want.The team needs a balance of skills: influencing,systems thinking, business knowledge, businessprocess development, project management,consultancy, IT expertise, change catalyst
Departments will vary. R&D may be well advanced.Look particularly at how knowledge is—or is not—crossing the boundaries in the organization
This is an essential component: putting humancapital in touch with others, and publicising theircapability
Work down from key strategies and the top areasof added value to stakeholders, looking at theinfluences on each. What areas of knowledge arecritical to support them?
Ownership will mean that the person is responsiblefor new knowledge, and for capture, exchange, andutilization in their area
Provide enabling budget money for them, andensure that they have a champion or coordinator.In some cases this ownership will overlap with theprevious step
This should be done by the senior team and providea template for ongoing monitoring and progressmeasurement
This may involve education for attitude change, butmostly it is building the demands of knowledgemanagement into processes and reward systems
IT skills, but also those of sharing and learning fromother individuals and teams
Include matters of interest to all employees
Each "knowledge owner" should choose their owntools—the central role is to ensure that they knowwhat is available
Learning from others about knowledge managementitself
These include the reality of desired behaviors,increases in innovation measures, peerassessments about sharing, cost and time savingsas a result of better knowledge sharing, improvedemployee and customer satisfaction
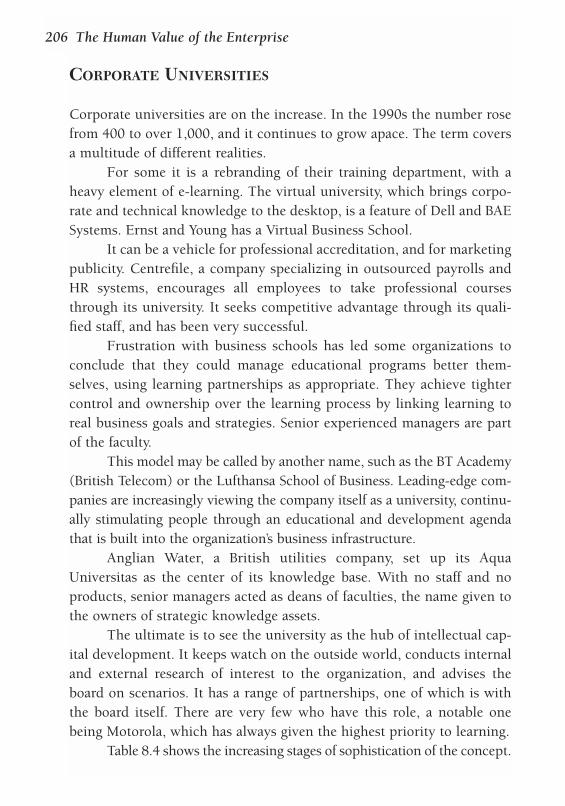
CORPORATE UNIVERSITIES
Corporate universities are on the increase. In the 1990s the number rosefrom 400 to over 1,000, and it continues to grow apace. The term coversa multitude of different realities.
For some it is a rebranding of their training department, with aheavy element of e-learning. The virtual university, which brings corpo-rate and technical knowledge to the desktop, is a feature of Dell and BAESystems. Ernst and Young has a Virtual Business School.
It can be a vehicle for professional accreditation, and for marketingpublicity. Centrefile, a company specializing in outsourced payrolls andHR systems, encourages all employees to take professional coursesthrough its university. It seeks competitive advantage through its quali-fied staff, and has been very successful.
Frustration with business schools has led some organizations toconclude that they could manage educational programs better them-selves, using learning partnerships as appropriate. They achieve tightercontrol and ownership over the learning process by linking learning toreal business goals and strategies. Senior experienced managers are partof the faculty.
This model may be called by another name, such as the BT Academy(British Telecom) or the Lufthansa School of Business. Leading-edge com-panies are increasingly viewing the company itself as a university, continu-ally stimulating people through an educational and development agendathat is built into the organization’s business infrastructure.
Anglian Water, a British utilities company, set up its AquaUniversitas as the center of its knowledge base. With no staff and noproducts, senior managers acted as deans of faculties, the name given tothe owners of strategic knowledge assets.
The ultimate is to see the university as the hub of intellectual cap-ital development. It keeps watch on the outside world, conducts internaland external research of interest to the organization, and advises theboard on scenarios. It has a range of partnerships, one of which is withthe board itself. There are very few who have this role, a notable onebeing Motorola, which has always given the highest priority to learning.
Table 8.4 shows the increasing stages of sophistication of the concept.
206 The Human Value of the Enterprise
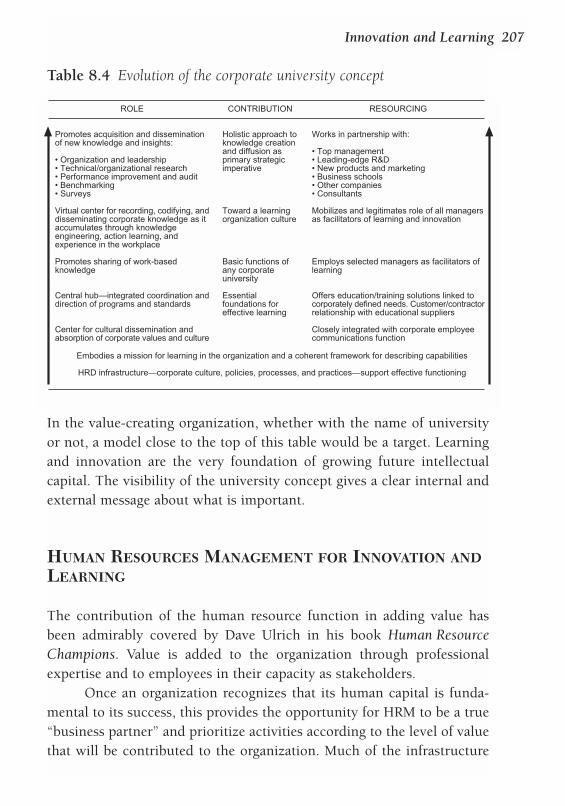
In the value-creating organization, whether with the name of universityor not, a model close to the top of this table would be a target. Learningand innovation are the very foundation of growing future intellectualcapital. The visibility of the university concept gives a clear internal andexternal message about what is important.
HUMAN RESOURCES MANAGEMENT FOR INNOVATION ANDLEARNING
The contribution of the human resource function in adding value hasbeen admirably covered by Dave Ulrich in his book Human ResourceChampions. Value is added to the organization through professionalexpertise and to employees in their capacity as stakeholders.
Once an organization recognizes that its human capital is funda-mental to its success, this provides the opportunity for HRM to be a true“business partner” and prioritize activities according to the level of valuethat will be contributed to the organization. Much of the infrastructure
Innovation and Learning 207
Table 8.4 Evolution of the corporate university concept
CONTRIBUTION
Holistic approach toknowledge creationand diffusion asprimary strategicimperative
Toward a learningorganization culture
Basic functions ofany corporateuniversity
Essentialfoundations foreffective learning
ROLE
Promotes acquisition and disseminationof new knowledge and insights:
• Organization and leadership• Technical/organizational research• Performance improvement and audit• Benchmarking• Surveys
Virtual center for recording, codifying, anddisseminating corporate knowledge as itaccumulates through knowledgeengineering, action learning, andexperience in the workplace
Promotes sharing of work-basedknowledge
Central hub—integrated coordination anddirection of programs and standards
Center for cultural dissemination andabsorption of corporate values and culture
RESOURCING
Works in partnership with:
• Top management• Leading-edge R&D• New products and marketing• Business schools• Other companies• Consultants
Mobilizes and legitimates role of all managersas facilitators of learning and innovation
Employs selected managers as facilitators oflearning
Offers education/training solutions linked tocorporately defined needs. Customer/contractorrelationship with educational suppliers
Closely integrated with corporate employeecommunications function
Embodies a mission for learning in the organization and a coherent framework for describing capabilities
HRD infrastructure—corporate culture, policies, processes, and practices—support effective functioning
created by the HR function has historically been built around a hierar-chical and cost-based approach to valuing people. The overall frameworkfor people management may need to be rethought to ensure that employ-ees develop a mindset based on adding value, particularly in terms oflearning and innovation.
Table 8.5 captures some of the characteristics of such a mindset.
A DIRECTORATE OF INTELLECTUAL CAPITAL?
Nobody questions the need for the finance function. It is generally apowerful and often large function, with a clear focus that everyone under-
208 The Human Value of the Enterprise
Table 8.5 The value-based approach to people management
WHAT WE WOULD NOT DO
• Organize by functions
• Divide and subdivide work for greater efficiency
• Look only internally, drawing walls around theorganization
• Apply the same contractual and compensationconditions to all
• Be limited to measures of the HR function'seffectiveness
• Focus on job value, regardless of the person
• Reduce salary costs through uncontrolled voluntaryredundancy schemes
• Build reward systems on hierarchical levels
• Treat all people as heads, equal for accountingpurposes
• Strive to cut heads
• Believe that only high-potential people needattention
• Restrain initiative through heavy bureaucracy andprocedures
• Have capability frameworks limited to personalbehaviors
• Restrict employees' access to information
• Produce headcount reports
WHAT WE WOULD DO
• Organize by stakeholders
• Focus multidisciplinary teams directed at addingvalue
• Look for complementary capabilities in aboundaryless world
• Be flexible and adaptive to local conditions andneeds
• Have a set of key people measures linked tostakeholder added value
• Understand who adds most value and how
• Have a priority of retaining high-value people
• Link rewards to added value
• Have a clear distinction between work thatmaintains today's value and that building futurevalue
• Strive to eliminate nonadded-value work
• Ensure that every person's potential isunderstood and developed
• Work toward a template of a value-adding, learning,innovative culture
• Have a comprehensive approach to describingcapability
• Encourage the input of, access to, and sharing ofinformation and knowledge
• Maintain a human asset register
stands. Money is spent all over the organization, and it is coordinated andcontrolled through a series of rules and processes to which people con-form perhaps more than any others. The finance function is also involvedin planning and financial engineering (tax and treasury) and often incor-porates the IT systems department. Even the HR function may be tuckedunder the finance director.
Our intellectual capital deserves much more attention, because ofits place in the value equation. It too is distributed all over an organiza-tion, but rarely is coordinated in any coherent way. It will be managed,if at all, function by function. Each function fights its own battles formoney and resources. Intellectual capital is compartmentalized; often thevarious parts of the organization do not have access to all that is availablebecause boundaries and politics get in the way.
In recent years some companies have set up a central knowledgemanagement unit reporting to the board, but without holding manyresources. Its job is to set up the structural capital required, coordinateinitiatives, and evangelize the cause of knowledge management. Thisconcept needs to be broadened to incorporate the whole of intellectualcapital—including human capital.
Operationally, the value-creating organization would organizearound delivering value to stakeholders. Cross-functional staff cometogether to create customer-serving teams, for example. A headquartersshould be structured around the type of support given to the organization.
Headquarters often has the image of the ultimate overhead withwhich contact should be avoided as far as possible. If asked what addedvalue is received from it, most operational people would give a wry smileat the irrelevance of such a question. It is with pride that many organiza-tions boast of the leanness of their headquarters, and progressive purgesbased on empowerment and decentralization, a focus on shareholdervalue, and a general reaction to overhead costs have brought some HQsof major corporations way below three figures.
Smaller they may be, but rarely have HQs been radically restruc-tured. In almost every case we will find the traditional functions alive andwell: finance, legal, corporate affairs, human resources, IT, corporateplanning, marketing, and quality. They may not all report to the CEOdirectly, but they will all be present and have their distinct boundaries.
Innovation and Learning 209
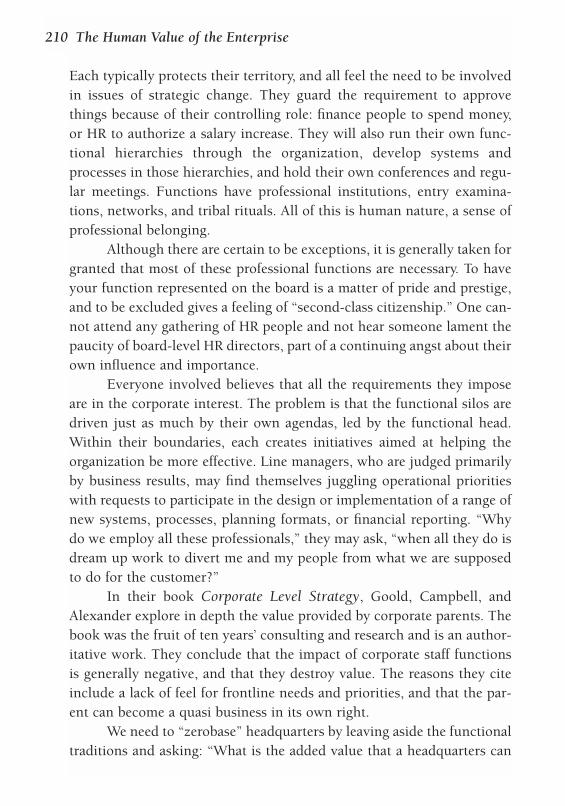
Each typically protects their territory, and all feel the need to be involvedin issues of strategic change. They guard the requirement to approvethings because of their controlling role: finance people to spend money,or HR to authorize a salary increase. They will also run their own func-tional hierarchies through the organization, develop systems andprocesses in those hierarchies, and hold their own conferences and regu-lar meetings. Functions have professional institutions, entry examina-tions, networks, and tribal rituals. All of this is human nature, a sense ofprofessional belonging.
Although there are certain to be exceptions, it is generally taken forgranted that most of these professional functions are necessary. To haveyour function represented on the board is a matter of pride and prestige,and to be excluded gives a feeling of “second-class citizenship.” One can-not attend any gathering of HR people and not hear someone lament thepaucity of board-level HR directors, part of a continuing angst about theirown influence and importance.
Everyone involved believes that all the requirements they imposeare in the corporate interest. The problem is that the functional silos aredriven just as much by their own agendas, led by the functional head.Within their boundaries, each creates initiatives aimed at helping theorganization be more effective. Line managers, who are judged primarilyby business results, may find themselves juggling operational prioritieswith requests to participate in the design or implementation of a range ofnew systems, processes, planning formats, or financial reporting. “Whydo we employ all these professionals,” they may ask, “when all they do isdream up work to divert me and my people from what we are supposedto do for the customer?”
In their book Corporate Level Strategy, Goold, Campbell, andAlexander explore in depth the value provided by corporate parents. Thebook was the fruit of ten years’ consulting and research and is an author-itative work. They conclude that the impact of corporate staff functionsis generally negative, and that they destroy value. The reasons they citeinclude a lack of feel for frontline needs and priorities, and that the par-ent can become a quasi business in its own right.
We need to “zerobase” headquarters by leaving aside the functionaltraditions and asking: “What is the added value that a headquarters can
210 The Human Value of the Enterprise
provide and how can it be effectively delivered?” This means looking atevery activity and what it is doing for the corporation. Starting with eachperson in each function, classify the nature of their work, and the type ofadded value (if any) that their activities provide. We then turn the HQthrough right angles, so that it is activity based rather than functionallydriven.
If we do so, we will probably find the following groupings, illus-trated in Figure 8.1.
Corporate administration and central services (stakeholders:shareholders, parent companies, government)An HQ has to coordinate and consolidate internally, and has to manage alarge part of the organization’s external interfaces. Most functions con-tribute to this in some ways. This group includes, for example, consoli-dated accounting, internal audit, tax management, treasury management,legal services, pensions, senior management contracts and remuneration,property management, investor relations, public relations and compli-ance, HR administration, and the “chairman’s office.”
Innovation and Learning 211
FROM
TO
CEO
CEO
Finance Legal HR Public Relations Quality Strategy
Corporate administrationand central services
Performance improvementand professional
consultancy
Intellectual capital andstrategy
Figure 8.1 Restructuring functions in the value-creating organization
These all need their specialists, but coordinating them under onedirector provides both coherence and efficiency in administration. Someactivities may be candidates for outsourcing, which is not the case withthe other two suggested units.
Performance improvement and professional consultancy (stakeholders:primarily shareholders through improved current performance) Where appropriate, the best professional experts in, for example, qualitymanagement, change management, process engineering, or systemsanalysis would be made available to the business units as internal con-sultants. These are the people concerned with how the organizationcould operate more effectively. This may mean solving today’s problems,taking new initiatives, or designing change programs.
Activities such as business unit performance monitoring wouldcome into this category, since this has little value unless it is action ori-ented. The design of corporate processes (such as are needed) would behere, and with the unit being made up of experts of several functions itwould be able to take a truly horizontal view. Some HR consultants wouldbe part of this team, people who understand cultures, reward systems,learning environments, and work analysis.
Intellectual capital and strategy (stakeholders: customers, employees,the public, suppliers, partners) This is the group that monitors and coordinates the development of intel-lectual capital, both structural and human. It will not get involved inareas that must be within operational control, such as customer relationsor local working environments, although it may well monitor the indica-tors and share good practices. Like all HQ departments, its prime roleshould be supportive rather than controlling. Such a unit would bringprofessionals in from many traditional functions, and its brief mayencompass:
❏ Strategic planning—setting directions and major business goals❏ The performance measurement system—supporting the business
goals and the needs of stakeholder value, managing the HumanCapital Monitor and similar instruments
212 The Human Value of the Enterprise
❏ Human resource development—increasing capability at the level oforganizational core competences, managing potential and careermovement
❏ Knowledge management—ensuring availability and flow of strate-gically important knowledge
❏ Patents management ❏ Research and development ❏ IT systems development ❏ Mergers and acquisitions management; joint ventures and partners
if at the corporate level❏ Community relations, at the corporate level.
For the functional baronies this may sound somewhat like turkeys votingfor Christmas, and it will take a brave CEO to restructure in such a way,with clear accountabilities and minimum overlap. But this would focuson value for stakeholders in a much more effective way. Individual pro-fessionals would retain their own expertise, but be using it in a differentway, and the broadening of their careers will become much easier sincefunctional boundaries and silos are removed.
SUMMARY
Building and maintaining the kind of environment in which people andideas will flourish is a real challenge. Innovation is much more thancreating new products and services: it embraces continual improvementof everything we do. We need a culture of experimentation and opennessto new ideas from within and from others. People don’t have to have anatural flair for creativity to play their part. It is worth keeping track ofthe percentage of people and their time that is dedicated to buildingfutures or to improvements, since it is so easy to be dragged continuallyinto the problems of the present.
The foundation of an innovative culture is a focus on learning inevery sense and at every level. A learning organization is one where peo-ple, teams, and the organization as a whole value learning, especially thatwhich comes from new experience. Managing the knowledge that the
Innovation and Learning 213
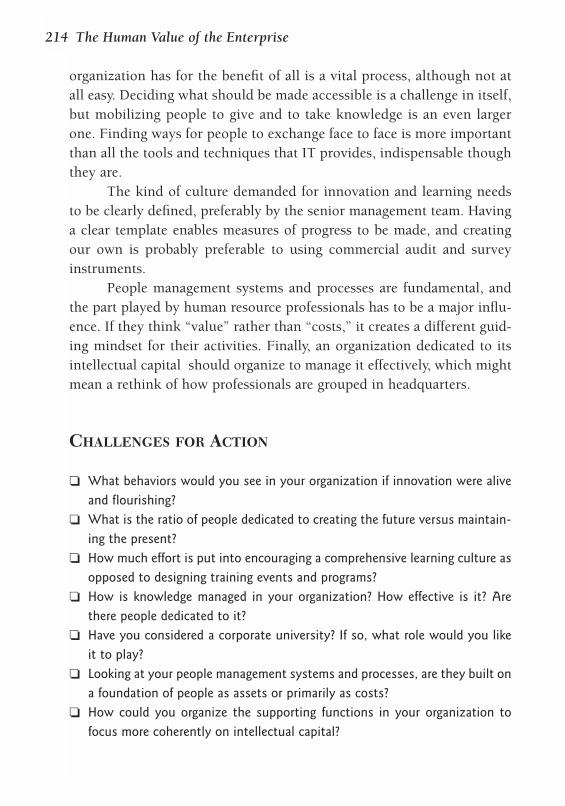
organization has for the benefit of all is a vital process, although not atall easy. Deciding what should be made accessible is a challenge in itself,but mobilizing people to give and to take knowledge is an even largerone. Finding ways for people to exchange face to face is more importantthan all the tools and techniques that IT provides, indispensable thoughthey are.
The kind of culture demanded for innovation and learning needsto be clearly defined, preferably by the senior management team. Havinga clear template enables measures of progress to be made, and creatingour own is probably preferable to using commercial audit and surveyinstruments.
People management systems and processes are fundamental, andthe part played by human resource professionals has to be a major influ-ence. If they think “value” rather than “costs,” it creates a different guid-ing mindset for their activities. Finally, an organization dedicated to itsintellectual capital should organize to manage it effectively, which mightmean a rethink of how professionals are grouped in headquarters.
CHALLENGES FOR ACTION
❏ What behaviors would you see in your organization if innovation were alive
and flourishing?
❏ What is the ratio of people dedicated to creating the future versus maintain-
ing the present?
❏ How much effort is put into encouraging a comprehensive learning culture as
opposed to designing training events and programs?
❏ How is knowledge managed in your organization? How effective is it? Are
there people dedicated to it?
❏ Have you considered a corporate university? If so, what role would you like
it to play?
❏ Looking at your people management systems and processes, are they built on
a foundation of people as assets or primarily as costs?
❏ How could you organize the supporting functions in your organization to
focus more coherently on intellectual capital?
214 The Human Value of the Enterprise
9The Value that PeopleCreate
THE NEXT CHALLENGE FOR THE VALUE-CREATING ORGANIZATION IS TO
think about the nature of the value that people create and howit can be measured. When we talk about people’s performance,we tend to think about achievement in terms of their objectives
and targets. Here we want to understand the nature of the value that isadded to each stakeholder.
The first contribution that people make to a commercial enterpriseis to create financial wealth that can be distributed; this is the “addedvalue” of accountants’ calculations. The second is the additional, non-financial value that they add to stakeholders generally, which encouragesthem to stay working with the organization. This applies to not-for-profitorganizations just as well. A third outcome is the result of innovation—new products, processes, and services that benefit customers or the pub-lic. We’ll look at these in turn.
People’s contribution to added value is the third column of ourHuman Capital Monitor (Figure 9.1 overleaf).
CREATING WEALTH FOR DISTRIBUTION
Wealth is not the same as profit. Employees create wealth that is distrib-uted to various stakeholders, and some is retained in the business andused for further investment. Profitability is important of course, although
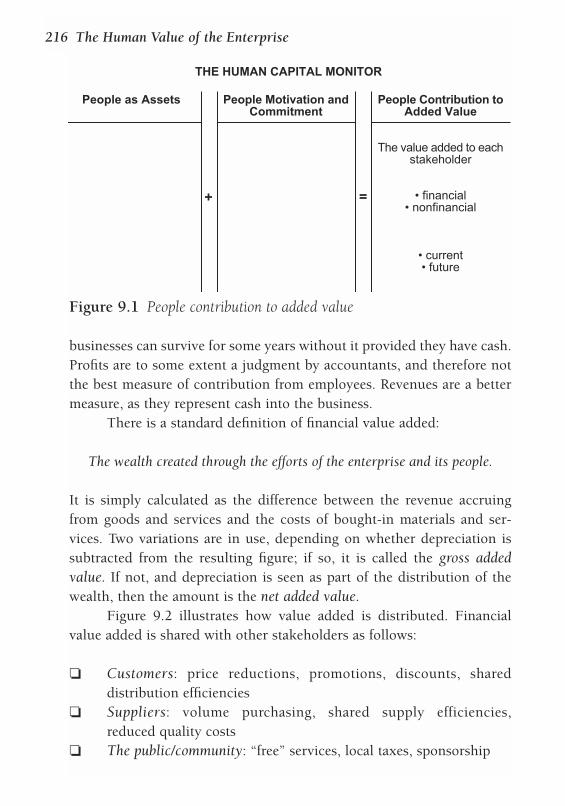
businesses can survive for some years without it provided they have cash.Profits are to some extent a judgment by accountants, and therefore notthe best measure of contribution from employees. Revenues are a bettermeasure, as they represent cash into the business.
There is a standard definition of financial value added:
The wealth created through the efforts of the enterprise and its people.
It is simply calculated as the difference between the revenue accruingfrom goods and services and the costs of bought-in materials and ser-vices. Two variations are in use, depending on whether depreciation issubtracted from the resulting figure; if so, it is called the gross addedvalue. If not, and depreciation is seen as part of the distribution of thewealth, then the amount is the net added value.
Figure 9.2 illustrates how value added is distributed. Financialvalue added is shared with other stakeholders as follows:
❏ Customers: price reductions, promotions, discounts, shareddistribution efficiencies
❏ Suppliers: volume purchasing, shared supply efficiencies,reduced quality costs
❏ The public/community: “free” services, local taxes, sponsorship
216 The Human Value of the Enterprise
People as Assets People Motivation andCommitment
People Contribution toAdded Value
The value added to eachstakeholder
• financial• nonfinancial
• current• future
THE HUMAN CAPITAL MONITOR
+ =
Figure 9.1 People contribution to added value
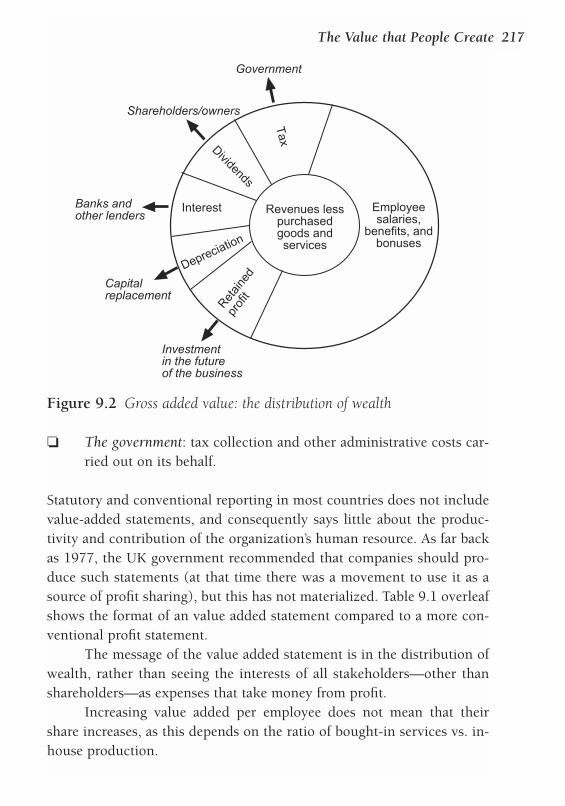
❏ The government: tax collection and other administrative costs car-ried out on its behalf.
Statutory and conventional reporting in most countries does not includevalue-added statements, and consequently says little about the produc-tivity and contribution of the organization’s human resource. As far backas 1977, the UK government recommended that companies should pro-duce such statements (at that time there was a movement to use it as asource of profit sharing), but this has not materialized. Table 9.1 overleafshows the format of an value added statement compared to a more con-ventional profit statement.
The message of the value added statement is in the distribution ofwealth, rather than seeing the interests of all stakeholders—other thanshareholders—as expenses that take money from profit.
Increasing value added per employee does not mean that theirshare increases, as this depends on the ratio of bought-in services vs. in-house production.
The Value that People Create 217
Revenues lesspurchasedgoods andservices
Employeesalaries,
benefits, andbonuses
Tax
Dividends
Interest
Depreciation
Retai
ned
prof
it
Government
Shareholders/owners
Banks andother lenders
Capitalreplacement
Investmentin the futureof the business
Figure 9.2 Gross added value: the distribution of wealth
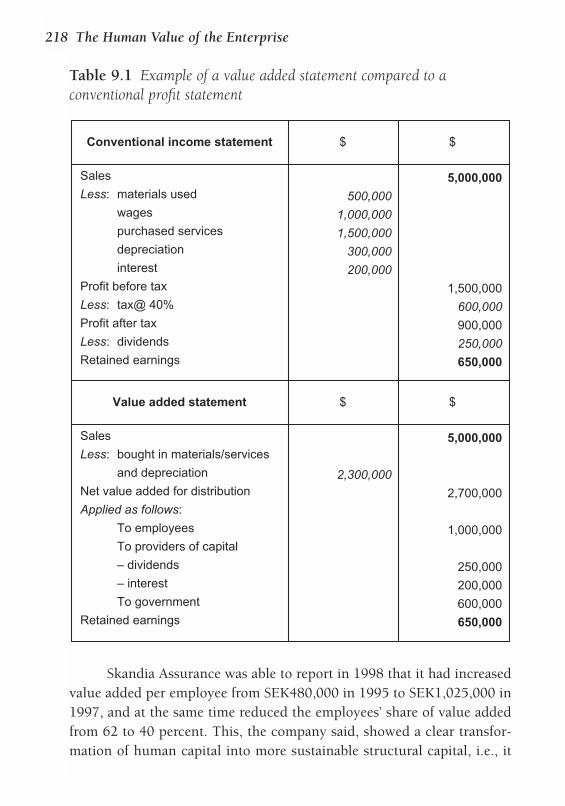
Skandia Assurance was able to report in 1998 that it had increasedvalue added per employee from SEK480,000 in 1995 to SEK1,025,000 in1997, and at the same time reduced the employees’ share of value addedfrom 62 to 40 percent. This, the company said, showed a clear transfor-mation of human capital into more sustainable structural capital, i.e., it
218 The Human Value of the Enterprise
Table 9.1 Example of a value added statement compared to aconventional profit statement
Conventional income statement $ $
Sales
Less: materials used
wages
purchased services
depreciation
interest
Profit before tax
Less: tax@ 40%
Profit after tax
Less: dividends
Retained earnings
500,000
1,000,000
1,500,000
300,000
200,000
5,000,000
1,500,000
600,000
900,000
250,000
650,000
Value added statement $ $
Sales
Less: bought in materials/services
and depreciation
Net value added for distribution
Applied as follows:
To employees
To providers of capital
– dividends
– interest
To government
Retained earnings
2,300,000
5,000,000
2,700,000
1,000,000
250,000
200,000
600,000
650,000
was using knowledge and system-based assets to generate sales withoutthe need for more people.
Skandia has also worked with an interesting figure called humancapital potential value. This takes the best-in-class—either internally byunit or externally by benchmark—and calculates what the total addedvalue would be if the whole company returned the same outcome. Thecompany quotes a potential increase in added value of 160 percent if itcould emulate the best unit across the whole of Skandia.
Efficiency ratios based on added value
The absolute amount of value added can be divided by the number ofpeople to give a figure per head. This is useful for comparing with otherorganizations in a similar sector. It should be calculated as far down theorganization as revenue breakdown figures permit, enabling us to assessthe added value from teams. The further one goes from the “sharp end”(i.e., directly connected to revenue generation), the less easy it is to eval-uate the added value of an individual employee.
Some useful ratios for managing through financial value addedinclude:
❏ Value added / costs of labor and capital—a measure of managerialefficiency
❏ Value added / sales—a better measure of productivity than the con-ventional profit/sales
❏ Value added / total compensation—perhaps the best overall mea-sure of productivity. This is sometimes referred to as the compen-sation recovery factor.
The proportion of value added to a particular stakeholder/total valueadded is a measure of the contribution to the particular stakeholder.Thus:
❏ Compensation / net value added is a measure of labor’s share in thewealth pool
❏ Net profit / net value added measures the shareholder’s share
The Value that People Create 219
❏ Dividends / net value added measures the shareholder’s currentreturn
❏ Taxation / net value added is the government’s share❏ Interest / net value added is the return to bondholders or banks.
PRODUCTIVITY
Productivity is the output achieved for a certain input. Where employeesdirectly contribute to a quantifiable delivery output, such as sales andproduction, measuring productivity is easy. It is more difficult when therole is a supporting one, such as an administrative or design function.Sheer volume of output does not indicate that the output is the right out-put. Productivity in delivering a service—such as IT support—can bemeasured by the achievement of stated service levels for the resource thatis used. In research and development, the volume measure is the numberof new products designed, but the real output is their ultimate addedvalue in sales in the marketplace.
Even “hard” productivity measures may not be directly proportionalto profitability, cash flow, or added value. For example, a favorite produc-tivity indicator is “revenue per head.” This can be growing, and yet prof-itability and added value can be decreasing because the costs of achievingthe revenue are rising faster. In the early stages of a startup this may be fine,since growth is more important than profits. Or we may measure tons orunits per head in a factory, encouraging output at the expense of quality.
I once ran a factory making gelatine. The work teams werebonused on tons per week. The scheme was not popular because cus-tomer demand was variable; when it was high the teams would produceas much as they could. However, in that market the price of the productdepended on a quality index determined for each consignment based onthe strength of the gelatine. When we changed the bonus scheme to bebased on quality and yield, profitability rose solidly. The obvious outputof volume, indicating physical effort, was replaced by an output based onknowledge and skill.
Another example of the dangers of productivity targets is to befound in the UK’s educational sector during the 1990s, where the need to
220 The Human Value of the Enterprise
meet student quantity targets overrode the quality of teaching and avail-able resources. As a result, students were recruited in numbers far out-stripping the capability of many institutions to deliver. The numberslooked good, but most will acknowledge that the marks needed for astandard level of educational achievement have softened. The risk is thatsuccess is measured on throughput, rather than outcome.
Another example is found in call centers, where the satisfaction ofthe call to the caller should be more important than the number of callshandled. People plead for a real person to talk to, and constantly tell sto-ries of endless automated loops and frustrated slamming down of thephone.
Improving productivity by cutting the workforce is what GaryHamel and C K Prahalad call “denominator management.“ It focuses oncutting the inputs to the productivity ratios. Much more effective is tofocus on growing the outputs—the numerators. Those will be in differ-ent forms of added value.
VALUE-ADDED WORK—AND ITS OPPOSITE
Accounting systems treat the work done by people as cost items such aswages and salaries, overtime, bonuses, benefits, pensions, social security,and so on. There is no distinction between the proportion of time spentthat is actually adding any value to a stakeholder, and the proportion thatisn’t.
Tony and Jeremy Hope, in Transforming the Bottom Line, argueconvincingly for the analysis of work in this way. They suggest a Value-adding Work Index, which is a product of the degree to which work isquality (in the sense of not having to be redone), and the percentage thatadds real value to a stakeholder. An enormous amount of time may beconsumed by such things as:
❏ Car travel❏ Meetings about internal affairs❏ Reviews and updates❏ Reading superfluous email
The Value that People Create 221
❏ Managing problems that should not have occurred❏ Redoing work❏ Reports and information provision❏ Consultation for its own sake (i.e., it is unlikely to add value to the
decision)❏ Internal negotiation and cross-charging❏ Arguing for resources❏ Mistakes, especially when repeated❏ Duplication❏ Waiting time❏ Computer downtime❏ Regulatory compliance.
You will be able to add to this list from your own experience.Every organization should have a blacklist of their own, and a
notice to place on people’s desks or in the meeting room: “Nonvalue-added work going on here!”
There are some roles that can add very little value to stakeholdersbecause they are primarily concerned with “housekeeping,” i.e., main-taining the internal workings of the organization. If they did not exist wemight well lose value. The extent or risk of that potential loss may be ameasure of their quasi-value added. Examples are bookkeeping, person-nel administration, buildings maintenance, security, legal services, and soon. Each of these is a candidate for outsourcing, rather than letting it takemanagement attention.
There was a time when all tasks were carefully examined and timed.With the growth of knowledge workers, this activity has largely disap-peared. No wonder that guru of gurus, Peter Drucker, said as far back as1991 that “the greatest future challenge is the productivity of knowledgeworkers.” The challenge applies to the vast majority of jobs today. Supportfunctions are adept at creating work (rather than value) for frontline peo-ple, whether in private or public-sector organizations. Indeed, the greatestcomplaint of health and education workers is the volume of paperworkand the need to comply with ever-increasing regulations. These are usu-ally instigated with the interests of the patient or child in mind, but in factoften take time away from looking after their intended beneficiaries.
222 The Human Value of the Enterprise
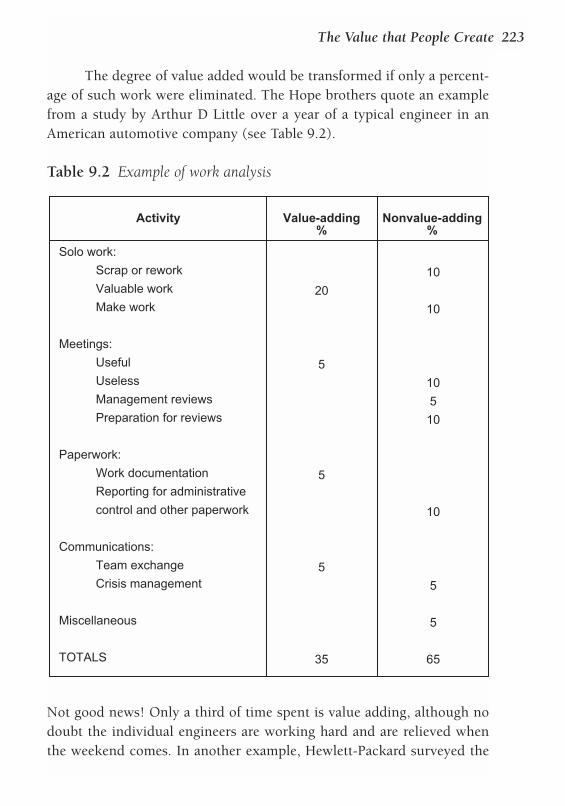
The degree of value added would be transformed if only a percent-age of such work were eliminated. The Hope brothers quote an examplefrom a study by Arthur D Little over a year of a typical engineer in anAmerican automotive company (see Table 9.2).
Not good news! Only a third of time spent is value adding, although nodoubt the individual engineers are working hard and are relieved whenthe weekend comes. In another example, Hewlett-Packard surveyed the
The Value that People Create 223
Table 9.2 Example of work analysis
Activity Value-adding%
Nonvalue-adding%
Solo work:
Scrap or rework
Valuable work
Make work
Meetings:
Useful
Useless
Management reviews
Preparation for reviews
Paperwork:
Work documentation
Reporting for administrative
control and other paperwork
Communications:
Team exchange
Crisis management
Miscellaneous
TOTALS
20
5
5
5
35
10
10
10
5
10
10
5
5
65
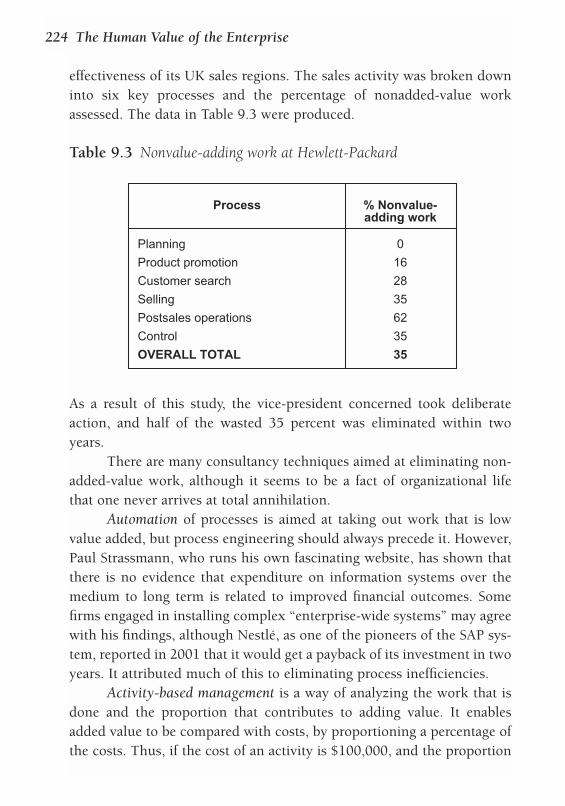
effectiveness of its UK sales regions. The sales activity was broken downinto six key processes and the percentage of nonadded-value workassessed. The data in Table 9.3 were produced.
As a result of this study, the vice-president concerned took deliberateaction, and half of the wasted 35 percent was eliminated within twoyears.
There are many consultancy techniques aimed at eliminating non-added-value work, although it seems to be a fact of organizational lifethat one never arrives at total annihilation.
Automation of processes is aimed at taking out work that is lowvalue added, but process engineering should always precede it. However,Paul Strassmann, who runs his own fascinating website, has shown thatthere is no evidence that expenditure on information systems over themedium to long term is related to improved financial outcomes. Somefirms engaged in installing complex “enterprise-wide systems” may agreewith his findings, although Nestlé, as one of the pioneers of the SAP sys-tem, reported in 2001 that it would get a payback of its investment in twoyears. It attributed much of this to eliminating process inefficiencies.
Activity-based management is a way of analyzing the work that isdone and the proportion that contributes to adding value. It enablesadded value to be compared with costs, by proportioning a percentage ofthe costs. Thus, if the cost of an activity is $100,000, and the proportion
224 The Human Value of the Enterprise
Table 9.3 Nonvalue-adding work at Hewlett-Packard
Process % Nonvalue-adding work
Planning
Product promotion
Customer search
Selling
Postsales operations
Control
OVERALL TOTAL
0
16
28
35
62
35
35
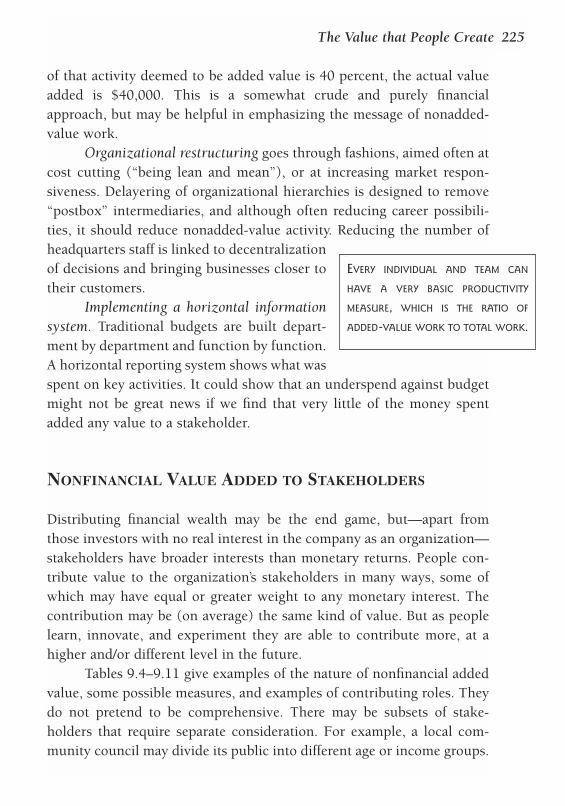
of that activity deemed to be added value is 40 percent, the actual valueadded is $40,000. This is a somewhat crude and purely financialapproach, but may be helpful in emphasizing the message of nonadded-value work.
Organizational restructuring goes through fashions, aimed often atcost cutting (“being lean and mean”), or at increasing market respon-siveness. Delayering of organizational hierarchies is designed to remove“postbox” intermediaries, and although often reducing career possibili-ties, it should reduce nonadded-value activity. Reducing the number ofheadquarters staff is linked to decentralizationof decisions and bringing businesses closer totheir customers.
Implementing a horizontal informationsystem. Traditional budgets are built depart-ment by department and function by function.A horizontal reporting system shows what wasspent on key activities. It could show that an underspend against budgetmight not be great news if we find that very little of the money spentadded any value to a stakeholder.
NONFINANCIAL VALUE ADDED TO STAKEHOLDERS
Distributing financial wealth may be the end game, but—apart fromthose investors with no real interest in the company as an organization—stakeholders have broader interests than monetary returns. People con-tribute value to the organization’s stakeholders in many ways, some ofwhich may have equal or greater weight to any monetary interest. Thecontribution may be (on average) the same kind of value. But as peoplelearn, innovate, and experiment they are able to contribute more, at ahigher and/or different level in the future.
Tables 9.4–9.11 give examples of the nature of nonfinancial addedvalue, some possible measures, and examples of contributing roles. Theydo not pretend to be comprehensive. There may be subsets of stake-holders that require separate consideration. For example, a local com-munity council may divide its public into different age or income groups.
The Value that People Create 225
EVERY INDIVIDUAL AND TEAM CAN
HAVE A VERY BASIC PRODUCTIVITY
MEASURE, WHICH IS THE RATIO OF
ADDED-VALUE WORK TO TOTAL WORK.
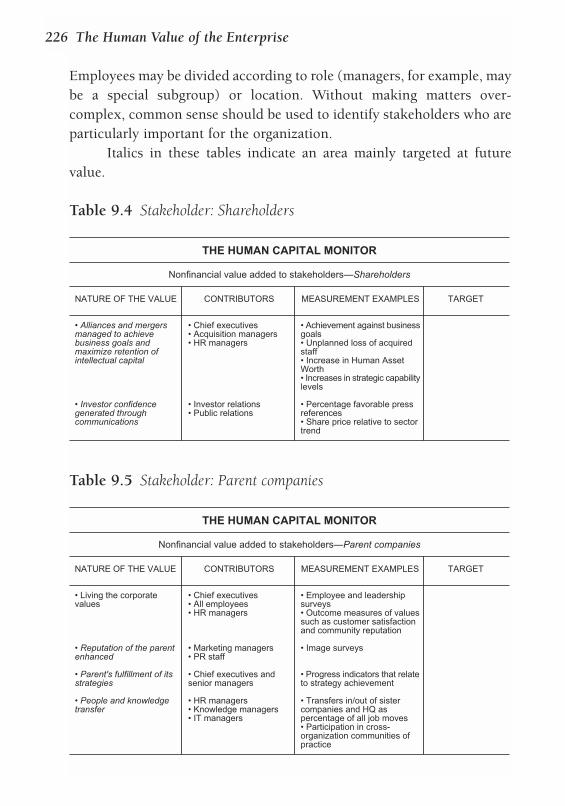
Employees may be divided according to role (managers, for example, maybe a special subgroup) or location. Without making matters over-complex, common sense should be used to identify stakeholders who areparticularly important for the organization.
Italics in these tables indicate an area mainly targeted at futurevalue.
226 The Human Value of the Enterprise
Table 9.4 Stakeholder: Shareholders
NATURE OF THE VALUE
• Alliances and mergersmanaged to achievebusiness goals andmaximize retention ofintellectual capital
• Investor confidencegenerated throughcommunications
CONTRIBUTORS
• Chief executives• Acquisition managers• HR managers
• Investor relations• Public relations
MEASUREMENT EXAMPLES
• Achievement against businessgoals• Unplanned loss of acquiredstaff• Increase in Human AssetWorth• Increases in strategic capabilitylevels
• Percentage favorable pressreferences• Share price relative to sectortrend
TARGET
Nonfinancial value added to stakeholders—Shareholders
THE HUMAN CAPITAL MONITOR
Table 9.5 Stakeholder: Parent companies
NATURE OF THE VALUE
• Living the corporatevalues
• Reputation of the parentenhanced
• Parent's fulfillment of itsstrategies
• People and knowledgetransfer
CONTRIBUTORS
• Chief executives• All employees• HR managers
• Marketing managers• PR staff
• Chief executives andsenior managers
• HR managers• Knowledge managers• IT managers
MEASUREMENT EXAMPLES
• Employee and leadershipsurveys• Outcome measures of valuessuch as customer satisfactionand community reputation
• Image surveys
• Progress indicators that relateto strategy achievement
• Transfers in/out of sistercompanies and HQ aspercentage of all job moves• Participation in cross-organization communities ofpractice
TARGET
Nonfinancial value added to stakeholders—Parent companies
THE HUMAN CAPITAL MONITOR
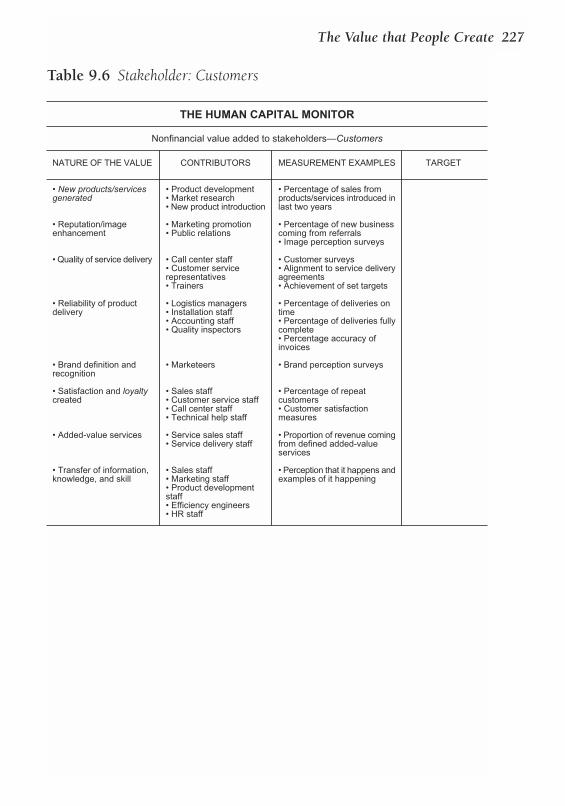
The Value that People Create 227
Table 9.6 Stakeholder: Customers
NATURE OF THE VALUE
• New products/servicesgenerated
• Reputation/imageenhancement
• Quality of service delivery
• Reliability of productdelivery
• Brand definition andrecognition
• Satisfaction and loyaltycreated
• Added-value services
• Transfer of information,knowledge, and skill
CONTRIBUTORS
• Product development• Market research• New product introduction
• Marketing promotion• Public relations
• Call center staff• Customer servicerepresentatives• Trainers
• Logistics managers• Installation staff• Accounting staff• Quality inspectors
• Marketeers
• Sales staff• Customer service staff• Call center staff• Technical help staff
• Service sales staff• Service delivery staff
• Sales staff• Marketing staff• Product developmentstaff• Efficiency engineers• HR staff
MEASUREMENT EXAMPLES
• Percentage of sales fromproducts/services introduced inlast two years
• Percentage of new businesscoming from referrals• Image perception surveys
• Customer surveys• Alignment to service deliveryagreements• Achievement of set targets
• Percentage of deliveries ontime• Percentage of deliveries fullycomplete• Percentage accuracy ofinvoices
• Brand perception surveys
• Percentage of repeatcustomers• Customer satisfactionmeasures
• Proportion of revenue comingfrom defined added-valueservices
• Perception that it happens andexamples of it happening
TARGET
Nonfinancial value added to stakeholders—Customers
THE HUMAN CAPITAL MONITOR
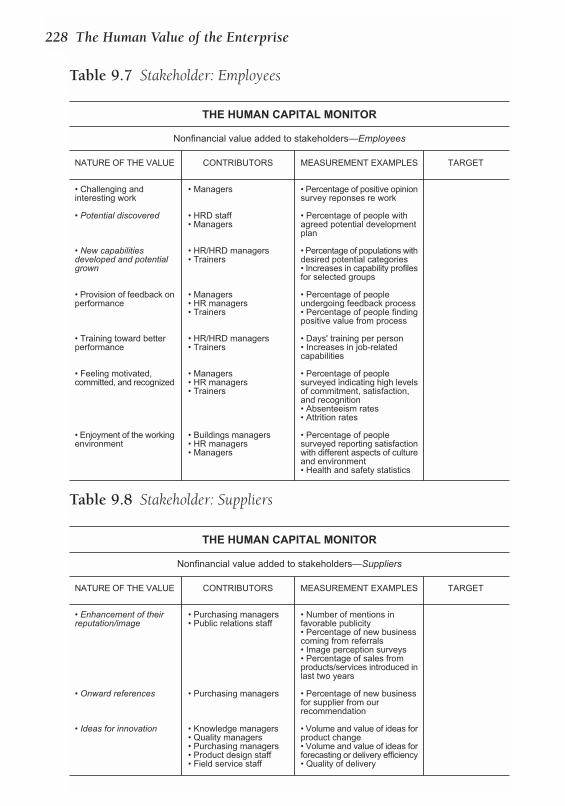
228 The Human Value of the Enterprise
Table 9.7 Stakeholder: Employees
NATURE OF THE VALUE
• Challenging andinteresting work
• Potential discovered
• New capabilitiesdeveloped and potentialgrown
• Provision of feedback onperformance
• Training toward betterperformance
• Feeling motivated,committed, and recognized
• Enjoyment of the workingenvironment
CONTRIBUTORS
• Managers
• HRD staff• Managers
• HR/HRD managers• Trainers
• Managers• HR managers• Trainers
• HR/HRD managers• Trainers
• Managers• HR managers• Trainers
• Buildings managers• HR managers• Managers
MEASUREMENT EXAMPLES
• Percentage of positive opinionsurvey reponses re work
• Percentage of people withagreed potential developmentplan
• Percentage of populations withdesired potential categories• Increases in capability profilesfor selected groups
• Percentage of peopleundergoing feedback process• Percentage of people findingpositive value from process
• Days' training per person• Increases in job-relatedcapabilities
• Percentage of peoplesurveyed indicating high levelsof commitment, satisfaction,and recognition• Absenteeism rates• Attrition rates
• Percentage of peoplesurveyed reporting satisfactionwith different aspects of cultureand environment• Health and safety statistics
TARGET
Nonfinancial value added to stakeholders—Employees
THE HUMAN CAPITAL MONITOR
Table 9.8 Stakeholder: Suppliers
NATURE OF THE VALUE
• Enhancement of theirreputation/image
• Onward references
• Ideas for innovation
CONTRIBUTORS
• Purchasing managers• Public relations staff
• Purchasing managers
• Knowledge managers• Quality managers• Purchasing managers• Product design staff• Field service staff
MEASUREMENT EXAMPLES
• Number of mentions infavorable publicity• Percentage of new businesscoming from referrals• Image perception surveys• Percentage of sales fromproducts/services introduced inlast two years
• Percentage of new businessfor supplier from ourrecommendation
• Volume and value of ideas forproduct change• Volume and value of ideas forforecasting or delivery efficiency• Quality of delivery
TARGET
Nonfinancial value added to stakeholders—Suppliers
THE HUMAN CAPITAL MONITOR
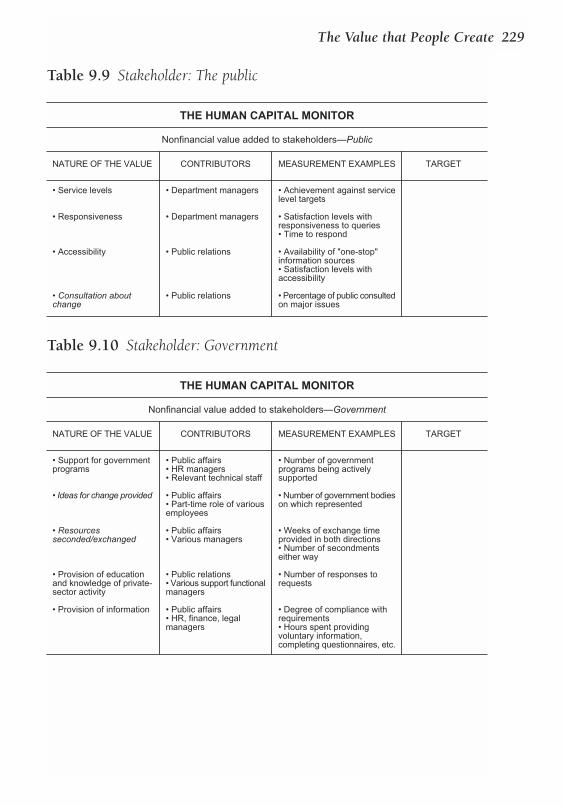
The Value that People Create 229
Table 9.9 Stakeholder: The public
NATURE OF THE VALUE
• Service levels
• Responsiveness
• Accessibility
• Consultation aboutchange
CONTRIBUTORS
• Department managers
• Department managers
• Public relations
• Public relations
MEASUREMENT EXAMPLES
• Achievement against servicelevel targets
• Satisfaction levels withresponsiveness to queries• Time to respond
• Availability of "one-stop"information sources• Satisfaction levels withaccessibility
• Percentage of public consultedon major issues
TARGET
Nonfinancial value added to stakeholders—Public
THE HUMAN CAPITAL MONITOR
Table 9.10 Stakeholder: Government
NATURE OF THE VALUE
• Support for governmentprograms
• Ideas for change provided
• Resourcesseconded/exchanged
• Provision of educationand knowledge of private-sector activity
• Provision of information
CONTRIBUTORS
• Public affairs• HR managers• Relevant technical staff
• Public affairs• Part-time role of variousemployees
• Public affairs• Various managers
• Public relations• Various support functionalmanagers
• Public affairs• HR, finance, legalmanagers
MEASUREMENT EXAMPLES
• Number of governmentprograms being activelysupported
• Number of government bodieson which represented
• Weeks of exchange timeprovided in both directions• Number of secondmentseither way
• Number of responses torequests
• Degree of compliance withrequirements• Hours spent providingvoluntary information,completing questionnaires, etc.
TARGET
Nonfinancial value added to stakeholders—Government
THE HUMAN CAPITAL MONITOR
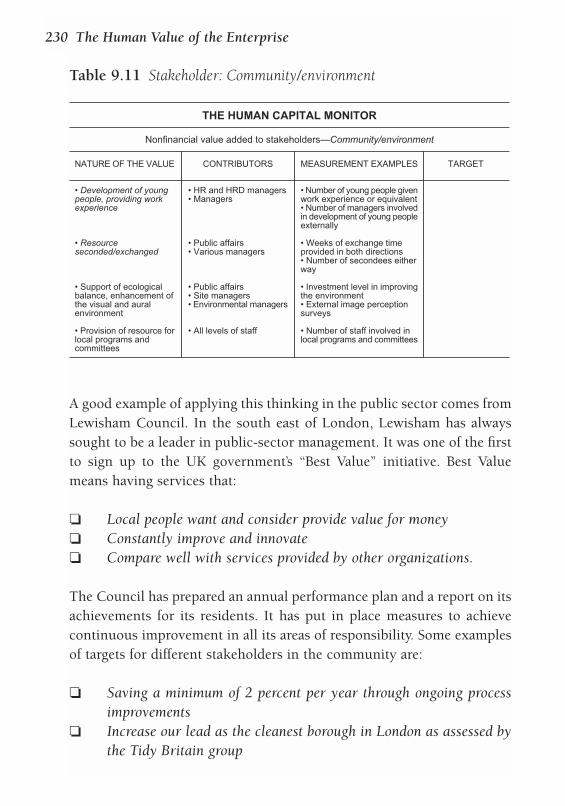
A good example of applying this thinking in the public sector comes fromLewisham Council. In the south east of London, Lewisham has alwayssought to be a leader in public-sector management. It was one of the firstto sign up to the UK government’s “Best Value” initiative. Best Valuemeans having services that:
❏ Local people want and consider provide value for money❏ Constantly improve and innovate❏ Compare well with services provided by other organizations.
The Council has prepared an annual performance plan and a report on itsachievements for its residents. It has put in place measures to achievecontinuous improvement in all its areas of responsibility. Some examplesof targets for different stakeholders in the community are:
❏ Saving a minimum of 2 percent per year through ongoing processimprovements
❏ Increase our lead as the cleanest borough in London as assessed bythe Tidy Britain group
230 The Human Value of the Enterprise
Table 9.11 Stakeholder: Community/environment
NATURE OF THE VALUE
• Development of youngpeople, providing workexperience
• Resourceseconded/exchanged
• Support of ecologicalbalance, enhancement ofthe visual and auralenvironment
• Provision of resource forlocal programs andcommittees
CONTRIBUTORS
• HR and HRD managers• Managers
• Public affairs• Various managers
• Public affairs• Site managers• Environmental managers
• All levels of staff
MEASUREMENT EXAMPLES
• Number of young people givenwork experience or equivalent• Number of managers involvedin development of young peopleexternally
• Weeks of exchange timeprovided in both directions• Number of secondees eitherway
• Investment level in improvingthe environment• External image perceptionsurveys
• Number of staff involved inlocal programs and committees
TARGET
Nonfinancial value added to stakeholders—Community/environment
THE HUMAN CAPITAL MONITOR
❏ Enabling at least 55 percent of leavers from care institutions to takeup further education or employment
❏ Increasing the number of new businesses started as a result of theCouncil’s economic development programs to 50 by 2004
❏ Target 38 percent of pupils in schools achieving five or more GCSEgrades at above C level.
Full information of targets and performance is published openly on theinternet.
Each organization will have its owntable of stakeholder added value. We candecide their relative importance through theirplace in the cause-and-effect staircases, andeveryone should be aware of the three or fourmost important areas for each stakeholder.
Measures such as in the tables aboveshould be featured in the everyday processesof people management. For example:
❏ Each job profile should specify the stakeholders that the role issupporting, and the measures applicable
❏ Measures are used in target setting, and therefore in bonus schemes❏ Each individual or team is reviewed on their progress against tar-
gets as a regular part of performance management.
INNOVATION AS AN OUTPUT
Innovation is a means to an end. However, it is so key to the creation offuture value that it should be considered as an output contribution ofpeople in its own right.
The results of successful innovation include:
❏ New services that add value to a stakeholder. Not all new servicesare directly aimed at revenues. For example, not so long ago offer-ing a telephone check-in service to an airline was an innovation
The Value that People Create 231
EVERY WORKGROUP AND INDIVIDUAL
(AND CONTINGENT CONTRIBUTORS) IN
THE ORGANIZATION SHOULD BE ABLE
TO RELATE WHAT THEY DO TO SOME
MEASURES OF ADDED VALUE TO
STAKEHOLDERS.
aimed at customer convenience, and consequent loyalty—which inthe longer term brings continuing revenues.
❏ New products are much more closely linked to revenue streams.Innovation involves not just the production of ideas but turning asufficient proportion of them into successful ones. A commonlyused output measure is:
the proportion of sales that come from products or services intro-duced in the last x years where x may be 1–3 depending on thesector.
For example, 3M uses a goal of at least 25 percent of annual salescoming from products less than four years old.
There are risks with measures like this. What constitutes a newproduct? Japanese electronic companies are adept in introducingalmost continual variations and improvements, many of which aretesting the market rather than responding to it. So a useful varia-tion of this is to track gross margin rather than sales. We may notknow which sales are actually profitable.
Another kind of measure—in, for example, the pharmaceuticalindustry—is the percentage of sales from proprietary products asopposed to those generically available to all suppliers.
❏ Improved processes and other cost efficiencies, which lead toenhanced profitability. Here we can look at measures such as per-centage change in cost per unit; or savings accruing from employeesuggestions made.
❏ We might well want to keep track of the production of ideas them-selves. We could use measures such as:—number of new patents registered (patent count) —number of ideas leading to projects—citations to patents; these are references by subsequent patent
applications, and imply that the original had some usefulness—number of new suggestions made from employees per head—number of process changes made in a time period.
232 The Human Value of the Enterprise
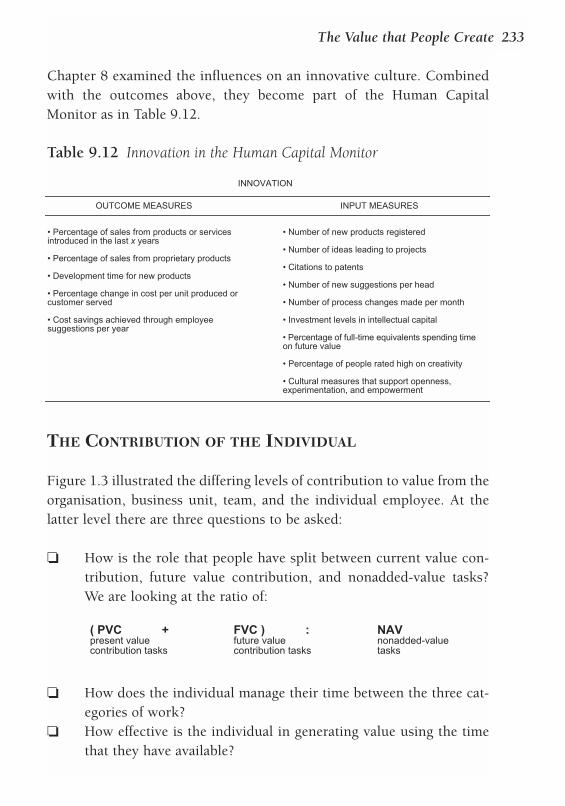
Chapter 8 examined the influences on an innovative culture. Combinedwith the outcomes above, they become part of the Human CapitalMonitor as in Table 9.12.
THE CONTRIBUTION OF THE INDIVIDUAL
Figure 1.3 illustrated the differing levels of contribution to value from theorganisation, business unit, team, and the individual employee. At thelatter level there are three questions to be asked:
❏ How is the role that people have split between current value con-tribution, future value contribution, and nonadded-value tasks?We are looking at the ratio of:
❏ How does the individual manage their time between the three cat-egories of work?
❏ How effective is the individual in generating value using the timethat they have available?
The Value that People Create 233
Table 9.12 Innovation in the Human Capital Monitor
INPUT MEASURES
• Number of new products registered
• Number of ideas leading to projects
• Citations to patents
• Number of new suggestions per head
• Number of process changes made per month
• Investment levels in intellectual capital
• Percentage of full-time equivalents spending timeon future value
• Percentage of people rated high on creativity
• Cultural measures that support openness,experimentation, and empowerment
OUTCOME MEASURES
• Percentage of sales from products or servicesintroduced in the last x years
• Percentage of sales from proprietary products
• Development time for new products
• Percentage change in cost per unit produced orcustomer served
• Cost savings achieved through employeesuggestions per year
INNOVATION
( PVC + FVC ) : NAVpresent value future value nonadded-valuecontribution tasks contribution tasks tasks
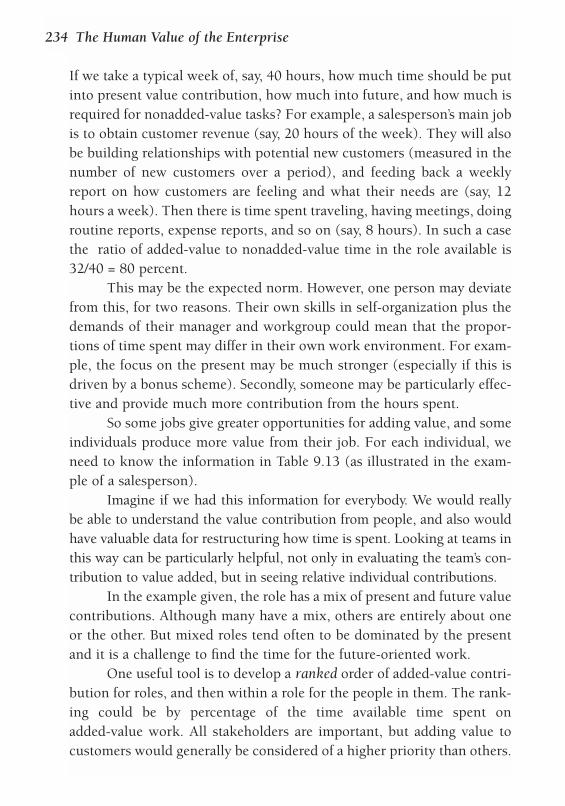
If we take a typical week of, say, 40 hours, how much time should be putinto present value contribution, how much into future, and how much isrequired for nonadded-value tasks? For example, a salesperson’s main jobis to obtain customer revenue (say, 20 hours of the week). They will alsobe building relationships with potential new customers (measured in thenumber of new customers over a period), and feeding back a weeklyreport on how customers are feeling and what their needs are (say, 12hours a week). Then there is time spent traveling, having meetings, doingroutine reports, expense reports, and so on (say, 8 hours). In such a casethe ratio of added-value to nonadded-value time in the role available is32/40 = 80 percent.
This may be the expected norm. However, one person may deviatefrom this, for two reasons. Their own skills in self-organization plus thedemands of their manager and workgroup could mean that the propor-tions of time spent may differ in their own work environment. For exam-ple, the focus on the present may be much stronger (especially if this isdriven by a bonus scheme). Secondly, someone may be particularly effec-tive and provide much more contribution from the hours spent.
So some jobs give greater opportunities for adding value, and someindividuals produce more value from their job. For each individual, weneed to know the information in Table 9.13 (as illustrated in the exam-ple of a salesperson).
Imagine if we had this information for everybody. We would reallybe able to understand the value contribution from people, and also wouldhave valuable data for restructuring how time is spent. Looking at teams inthis way can be particularly helpful, not only in evaluating the team’s con-tribution to value added, but in seeing relative individual contributions.
In the example given, the role has a mix of present and future valuecontributions. Although many have a mix, others are entirely about oneor the other. But mixed roles tend often to be dominated by the presentand it is a challenge to find the time for the future-oriented work.
One useful tool is to develop a ranked order of added-value contri-bution for roles, and then within a role for the people in them. The rank-ing could be by percentage of the time available time spent onadded-value work. All stakeholders are important, but adding value tocustomers would generally be considered of a higher priority than others.
234 The Human Value of the Enterprise
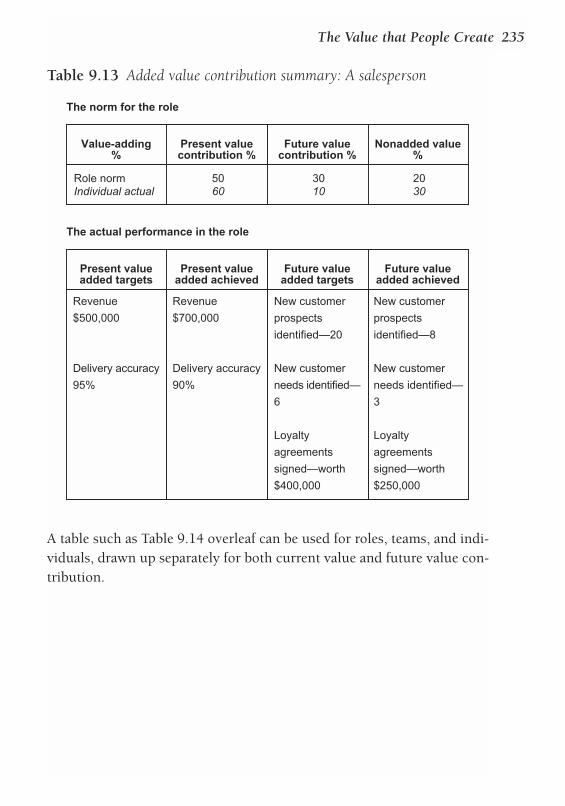
A table such as Table 9.14 overleaf can be used for roles, teams, and indi-viduals, drawn up separately for both current value and future value con-tribution.
The Value that People Create 235
Table 9.13 Added value contribution summary: A salesperson
Future valueadded targets
Future valueadded achieved
New customer
prospects
identified—20
New customer
needs identified—
6
Loyalty
agreements
signed—worth
$400,000
New customer
prospects
identified—8
New customer
needs identified—
3
Loyalty
agreements
signed—worth
$250,000
Present valueadded targets
Present valueadded achieved
Revenue
$500,000
Delivery accuracy
95%
Revenue
$700,000
Delivery accuracy
90%
Future valuecontribution %
Nonadded value%
Value-adding%
Present valuecontribution %
Role normIndividual actual
5060
3010
2030
The norm for the role
The actual performance in the role
SUMMARY
The traditional way to look at the output of people is to employ measuresof productivity. These have their uses, but the ultimate measure is thevalue that is added—the wealth that is available for distribution to thestakeholders. The ongoing assurance of that wealth for the future comesfrom the confidence that each stakeholder has their own needs for valuesatisfied. The challenge is to understand the nature of that value, both infinancial and nonfinancial terms, and then to quantify it. Every employeeshould be able to relate their activities to one or more sources of value.
An important area is the way in which people spend their time.Everyone finds themselves involved in nonadded-value work; theimportant question is, “What is the proportion?” Studies of this arelikely to lead to restructuring of work and elimination of nonadded-value activities.
Building future value depends on the capability to innovate and turnresults into real value. Measures for the outcomes of innovation are just asimportant to track as are other outputs of our human capital. They enableus to balance the demands of the present with the constant need to createan attractive future for all who have an interest in the organization.
236 The Human Value of the Enterprise
Table 9.14 Ranking of value contribution (current or future)
Role IncumbentsContribution
valuecomponent
A Customer account manager
B Supply chain manager
C Sales executive
D Management accountant
etc.
•••
•••
•••
•••
•••
•••
•••
•••
•••
•••
CHALLENGES FOR ACTION
❏ How is the contribution of people tracked at the level of the overall enterprise
in your organization?
❏ What measures do you have of added value to stakeholders other than finan-
cial ones? Looking at all stakeholders, are there areas where there are no mea-
sures in use?
❏ Do individuals and teams in your organization regularly evaluate how much
of the work done is adding value and how much is not?
❏ Do people have work targets directly linked to a measurable added-value
indicator?
❏ Do you have measures of innovation in every part of the organization?
❏ Could you rank roles and people according to the value they create?
The Value that People Create 237
10Mergers, Acquisitions,and Alliances
IN CHAPTER 6 WE DISCUSSED HOW TO MAXIMIZE OUR HUMAN CAPITAL. WE
focused on the organic areas of acquisition, retention, and growth.However, the quickest way to get new human capital is to acquire,merge with, or make alliances with other organizations. Cisco
Systems grew to become one of the world’s largest companies by buyingnumerous startup and research-driven companies—acquiring their peo-ple, knowledge, and ideas.
In managing human capital this is therefore a critical area.Unfortunately, it is often not done well, and much of the intellectual cap-ital (including the people) is lost. This chapter looks at some of the ques-tions to be asked and processes to be gone through to make sure that thisdoes not happen.
FAILURE TO ADD VALUE
Substantial new capabilities and technologies can be bought with an acqui-sition, assets shared and made more productive, and the range of customersrapidly extended. Value is captured through the transaction by transferringit from one economic entity to another. In the longer term, there also maybe an opportunity to achieve greater value creation through the synergyarising from the two entities sharing assets and working out a commonpurpose. A merger or alliance should have such specific goals.
There are several quite different scenarios. A merger implies anagreed combination of operations, where two enterprises believe thatthey will compete better together than on their own. An acquisition maybe hostile or agreed, but involves purchase of all or part of one organiza-tion by another. It is fashionable to refer to many of these by the softerterm merger, especially if the parties are of similar size. An alliance is nor-mally between organizations or parts of them and is an agreement to helpeach other in various ways; in product development or certain markets,for example. As the concept of the boundaryless organization takes root,more and more of these are put together based on the benefits of sharingintellectual capital. A joint venture is the offspring of two (or more) par-ents, aimed at a market to which each parent can contribute, but whereworking together can achieve more. This chapter is confined to mergersand acquisitions, as this is where most of the difficulties lie.
Each year the volume of deals grows. Boston Consulting Groupestimated the 1999 value to be $3.3 trillion, or 30 percent of the entireeconomic output of the EU. All of this creates great wealth for profes-sional advisers; but, sadly, these are the only players in the game guaran-teed to win. There are so many stories of failure in mergers, acquisitions,and alliances. Indeed, statistics are regularly quoted showing the per-centage that fail to reach their original business goals as being more thanhalf.
One of many such studies, by KPMG in 1999, showed that 53 per-cent of such deals destroyed value for shareholders. We can be sure thatvalue for other stakeholders was lost along the way too. According to theCSC Index, only 30 percent of mergers leave companies better off finan-cially than previously; J P Morgan found that 44 percent of cross-bordermergers in Europe failed to add value after three years—and so the stud-ies roll on with their depressing statistics. In terms of growing share-holder value, it is usually the victim that provides the return and rarelythe acquirer.
There are successes, of course. Statistics on percentages alwaysquote the proportion that makes the point! Nevertheless, the failure rateis a major cause of concern, and the reasons are commonly to do with thefollowing:
Mergers, Acquisitions, and Alliances 239
❏ Cultural dissonance❏ The battle for control❏ Loss of key players❏ Failure to maintain customer relationships.
This is one of the great tragedies of corporate life, as it is such a prevalentoccurrence, is so critical to the strategic plans of organizations, and pro-vides so much disruption to people and businesses. And yet, the samemistakes are repeated time and again. Conference programs that I receivein the post featuring “due diligence,” the term used for checking out thepotential partner, still only focus on the legal and financial routinesrequired. My own experience (as an HR director) of lawyers’ demandswas that they were entirely concerned with all the liabilities of employ-ment contracts and pensions, and had no interest at all in the richness ofintellectual capital that was being purchased.
The HR professional, if involved at the right time, will feel aresponsibility to go beyond these requirements. Once the merger oracquisition is happening, however, the pressures of communication,reorganization, and harmonization absorb time, and vital issues of man-aging the asset nature of human capital can be pushed to the background.How often are HR professionals able to highlight why a deal may notwork, when the business logic seems technically sound? Machismo andexcitement, plus a great deal of optimism, are barriers to listening.
THE REAL MEANING OF SYNERGY
Many—indeed most—mergers and acquisitions entail restructuring andcost synergies. Synergy is a positive word, meaning that a combination ismore than its constituent parts. The financial world has come to see it asthe cost savings that result from a merger or acquisition, normally in theloss of jobs. Of course, savings can and should result—but they are surelynot about costs alone. The interpretation is that saving costs must begood news for shareholders, but where are the statements of value lost?
A substantial premium over and above the financial and physicalcapital is usually paid for the intellectual capital of an organization being
240 The Human Value of the Enterprise
acquired. The proportion of attention given to each element is oftentotally out of balance, however. IBM paid seven times the book value forLotus, for example. One could expect that seven times the attentionwould be paid to securing the intellectual capital that had been purchased(in fact, IBM did put a lot of effort into this). This attention is rarelygiven, however, partly because of the focus on the figures, and partlybecause the nature and composition of the intellectual capital value arenot well understood. Tools and procedures for safeguarding it may notreadily be available.
It is nearly always the case in so-called mergers that one partner isdominant over the other. That dominance is usually by size, but therehave been many cases of minnows seeking to swallow whales. Someacquirers leave no one in any doubt about who is in charge: All the oldtop management is fired immediately and the company name changedovernight. This stance is justified by the need for people to know wherethey stand as quickly as possible and to avoid any potential opposition orundermining of the new owners. Others move more softly, involve peo-ple in the changes, and talk about creating a new company. Nevertheless,despite all the rhetoric that may go on at the time about respecting thenew partners and a totally fair distribution of positions, the dominantpartner generally absorbs the other into its culture.
Senior executives may often be given high-sounding board posi-tions to start with (such as deputy chairman), as a softening but tempo-rary palliative. It is not long before the majority of influential positionsare filled with managers from one partner, and the survivors in the lowerranks feel as if they have joined a completely new company.
Here are some examples.
❏ CityGroup was formed as the result of a merger in 1999 betweenCitiCorp and Travelers. CityCorp’s John Reed stepped down aschairman and co-chief executive in April 2000 and Travelers’ SandyWeill took complete charge. Four months later, five ex-CitiCorpdirectors had departed and only one remained on the board.
❏ The world’s largest pharmaceuticals company was created in 2000by “merging” Pfizer and Warner. As Pfizer consolidated its effectiveacquisition, not one of the 60 country managers in the new global
Mergers, Acquisitions, and Alliances 241
organization came from Warner, nor did 13 out of 15 global areamanagers above them. Henry McKinnell, Pfizer president andchief operating officer, said that “the best person for each job hadbeen selected,” but acknowledged that “Pfizer picked the personalready running the organization in order to avoid disruption ofthe business.”
❏ The joining together of Daimler and Chrysler in 1998 was hailed asa merger of equals. Yet the dominance of Daimler led to the depar-ture in droves of Chrysler senior executives, thousands of redun-dancies, and a disastrous fall in profits. The combination of twovery different national cultures was a significant additional stress toan already fraught situation, as conflicting approaches to manage-ment fought for dominance.
Human capital can make its own decisions about whether it wants to stay.Attractive packages often help them to leave, however. They take withthem their relationships, all their tacit knowledge, and their contributionto stakeholder value. Is it any wonder that value is eventually destroyedrather than grown? The speedy firing of the top management team seemsparticularly crass in this respect. These are the people who probablyknow the overall business, the key customers, the strengths and weak-nesses of their organization better than anyone. They may take with themloyal followers, especially if the acquired company has many long-servicepeople. The incoming management will not be a team by definition, andwill set about making their mark by introducing the methods andapproaches they know work for them. All of this is a pretty good recipefor losing value.
Laurence Capron at Insead studied 250 mergers to understand syn-ergy and leverage, and compared pre-acquisition motives with post-acquisition behavior. She found that most of the motives related torevenue-driven synergies, such as market share, extended product offer-ings, and so on. Far fewer were concerned with achieving economies ofscale for their own sake. However, life never goes quite according to plan.The highest benefits were reported from extension of product lines andmarket coverage, but in all other aspects studied, including profitability,approximately half of the companies showed a decline or no improve-
242 The Human Value of the Enterprise
ment. One interesting set of data concerned the rationalization of variouskinds of assets. Reductions were three to five times more likely to be fromthe target’s asset base than from those of the acquirer. The study con-cluded the following:
❏ More attention should be paid to competence transfer and exploita-tion of revenue-based synergies. Rushing to tell the market thatsomething is happening by announcing cost restructuring may notbe in the best long-term interest—even though such savings arevery likely to be made eventually.
❏ Rationalizing assets though acquisition does not necessarily lead tocost savings, particularly where the assets rationalized are those ofthe target company. This may be because the effect of doing this isless well understood than for the acquirer’s own asset base.
❏ Excessive rationalization of the target’s assets may damage theinnovation and market capabilities of the merged business. This isparticularly due to the loss of key people. Capron cites the acquisi-tion of First Interstate Bank by Wells Fargo in the US in 1997.Wells chose to close all FI’s branch network and 75 percent of thetop 500 executives left. FI had focused on relational banking—andas those relationships were steadily severed, so a large part of thecustomer base defected to competitors.
❏ Cost savings can be achieved by transfer of competences, particu-larly to the target but in both directions. This is the sharing of bestpractice between the two. Often it actually means “do it our wayplease,” which may cause loss of productivity and confusion for aperiod.
❏ Likewise, innovation and market capabilities can and should beimproved through mutual transfer. However, this is dependent onmany of the people who hold the key to those competencesremaining in the new organization. As above, the transfer of com-petences of the target to the acquirer is the more difficult toachieve, even though a substantial premium may have been paidfor them.
Mergers, Acquisitions, and Alliances 243
The challenges
The kind of synergy we want is where, for example, our ability to createcustomer loyalty is enhanced by a greater variety of products and ser-vices, by extended distribution capability, or by a larger number of peo-ple devoted to innovation. Or our opportunity to develop people isextended through the greater diversity and size of the new organization,and the wider career opportunities available.
We could describe the challenges of the successful merger, acquisi-tion, or alliance as:
❏ The achievement of the strategic goals set out in the plan❏ The maintenance and enhancement of the value provided to stake-
holders by the constituent companies (called “value capture” byHaspelagh and Jemison, 1991)
❏ The enhancement of the combined ability to create future value(termed “value creation” by the above authors).
All of this requires a real understanding of all the elements of intellectualcapital. The acquirer that starts with that is at a considerable advantage;if not, it is unlikely to assess and manage its acquired business success-fully. So we need to:
❏ Be able to link each strategic goal, through a cause-and-effectchain, with the key elements of intellectual capital that support it
❏ Take each stakeholder in turn, define the key areas of value contri-bution, and which individuals and teams are critical to thatcontribution
❏ Compare and contrast the working environment of the twoconstituents—their cultural norms, processes, values, psychologi-cal contracts, and so on—and identify areas of potentialdissonance.
244 The Human Value of the Enterprise
THE SIX PHASES OF MERGERS AND ACQUISITIONS
The implementation of mergers and acquisitions follows different pat-terns, but generally we can separate six phases:
1 Selection2 Negotiation3 Announcements4 Due diligence5 Integration6 Review.
The first four stages may vary chronologically depending on different sit-uations, such as:
❏ A hostile bid❏ An agreed bid❏ Competing for a company put up for sale❏ Mutual interest in a merger.
The issue is about the availability of information, which can be in threecategories:
❏ Only that which is public❏ That available through controlled and limited access inside the
company❏ Unrestricted access to people and documentation.
What would the value-creating organization be doing at each of thesestages? To look at every aspect of intellectual capital (i.e., including cus-tomer and structural capital) would be a book in itself, so we shall con-fine our discussion to human capital only.
Mergers, Acquisitions, and Alliances 245
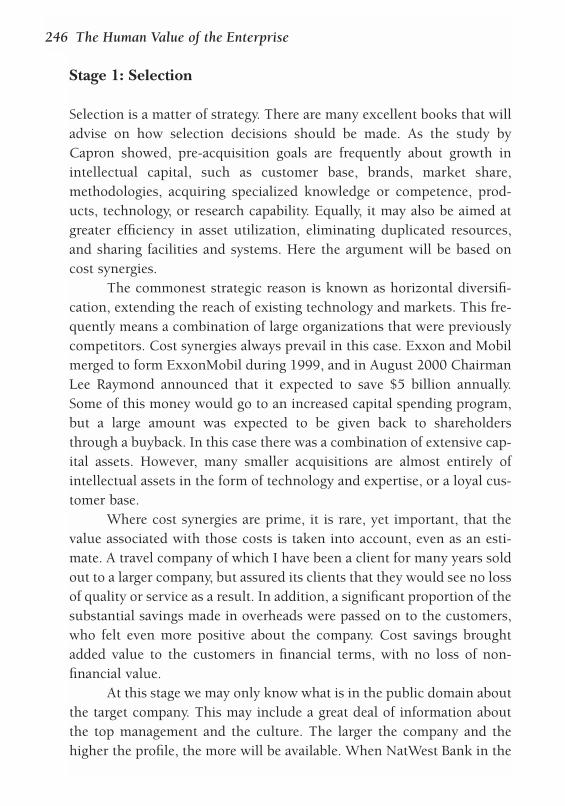
Stage 1: Selection
Selection is a matter of strategy. There are many excellent books that willadvise on how selection decisions should be made. As the study byCapron showed, pre-acquisition goals are frequently about growth inintellectual capital, such as customer base, brands, market share,methodologies, acquiring specialized knowledge or competence, prod-ucts, technology, or research capability. Equally, it may also be aimed atgreater efficiency in asset utilization, eliminating duplicated resources,and sharing facilities and systems. Here the argument will be based oncost synergies.
The commonest strategic reason is known as horizontal diversifi-cation, extending the reach of existing technology and markets. This fre-quently means a combination of large organizations that were previouslycompetitors. Cost synergies always prevail in this case. Exxon and Mobilmerged to form ExxonMobil during 1999, and in August 2000 ChairmanLee Raymond announced that it expected to save $5 billion annually.Some of this money would go to an increased capital spending program,but a large amount was expected to be given back to shareholdersthrough a buyback. In this case there was a combination of extensive cap-ital assets. However, many smaller acquisitions are almost entirely ofintellectual assets in the form of technology and expertise, or a loyal cus-tomer base.
Where cost synergies are prime, it is rare, yet important, that thevalue associated with those costs is taken into account, even as an esti-mate. A travel company of which I have been a client for many years soldout to a larger company, but assured its clients that they would see no lossof quality or service as a result. In addition, a significant proportion of thesubstantial savings made in overheads were passed on to the customers,who felt even more positive about the company. Cost savings broughtadded value to the customers in financial terms, with no loss of non-financial value.
At this stage we may only know what is in the public domain aboutthe target company. This may include a great deal of information aboutthe top management and the culture. The larger the company and thehigher the profile, the more will be available. When NatWest Bank in the
246 The Human Value of the Enterprise
UK became a target for takeover in 1999, an enormous amount of infor-mation was already in the public domain through studies, articles, pre-sentations, and literature.
Here is a checklist for the selection stage that would be relevant tothe organization’s human capital:
❏ What do we know about the top management? Their careers—background, seminal experiences, interests, directorships, publicinvolvement?
❏ Are any of them founding members of the company?❏ If the founder is not still in the company, did they leave a cultural
and stylistic legacy?❏ How many sites does the company have? What is the international
distribution of employees? Which are the dominant sites?❏ Is there any information about the number of people, or expendi-
ture level, in R&D?❏ If the company is already a competitor, what do our salespeople say
about it in the marketplace?❏ How does the company position itself in employment advertise-
ments? What kind of people does it advertise for? How often?❏ Has it acquired companies itself? Will it have pockets of people from
previous cultures? What do we know about how it handled them? ❏ What can we deduce about its culture (see below for detailed
parameters)?❏ What can we find out about its investment in training and
development?❏ What do the accounts tell us about productivity and added value?
How do they compare with industry norms?
There are many public sources of such information, via the internet,media publications, and company literature. Market research can be com-missioned, and specialist consultants can produce valuable reports.Employees may have knowledge of the target company that can be (care-fully) tapped into. The time will come when intellectual capital indica-tors are in the public domain. We give some examples of public reportingof this in Chapter 11.
Mergers, Acquisitions, and Alliances 247
Top management likes to believe that there are no barriers that can-not be overcome, if the merger or acquisition is seen as the right thing forcompany strategy. And yet there may be factors that come out of theabove analysis that would become a major barrier to success. WhenGlaxo and SmithKline Beecham first started talks, for example, they hadto be called off because of “key differences between the two chairmen.”Back in the late 1980s, Ford Europe and Fiat called off a merger “becausewe are both proud companies and each will believe our way is best.”
If the acquisition is hostile, there is no opportunity to get the vitaldetailed information that would provide a better judged decision. Theperceived strategic fit, plus the financial figures, may be all that drives us,and our valuation will be based on the current market value plus a pre-mium that advisers estimate might be sufficient to attract the target’smajor shareholders. Not surprisingly, many acquirers find later that theyhave overpaid handsomely, and are faced with quite unforeseen problemsto tackle.
On page 244, we listed three key requirements in relation to intel-lectual capital, and in particular human capital:
❏ Linking strategic goals with key elements of intellectual capital ❏ Defining the key areas of value contribution❏ Comparing and contrasting the working environments in which
value is generated.
Tables 10.1–10.3 give some examples of the kind of analysis that isneeded, and this will become more comprehensive as access to informa-tion extends.
At this stage, the analysis may be incomplete but it should beenough to give warning signals. Risk areas can be explored further, andevaluated as potential hidden costs. For example, we might assess a riskas 25 percent of the employees leaving voluntarily through inability toabsorb our culture. There will be a cost associated with this, but also—depending on who the employees are—a risk of total failure of the strate-gic goal. This is the time to stop, unless we are confident that thechallenges of overcoming the risk can be met.
248 The Human Value of the Enterprise
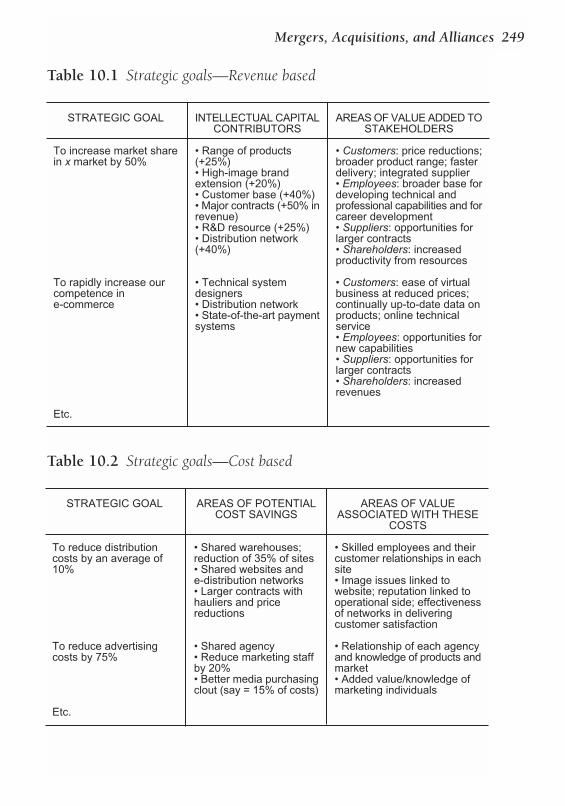
Mergers, Acquisitions, and Alliances 249
Table 10.1 Strategic goals—Revenue based
STRATEGIC GOAL
To increase market sharein x market by 50%
To rapidly increase ourcompetence ine-commerce
Etc.
INTELLECTUAL CAPITALCONTRIBUTORS
• Range of products(+25%)• High-image brandextension (+20%)• Customer base (+40%)• Major contracts (+50% inrevenue)• R&D resource (+25%)• Distribution network(+40%)
• Technical systemdesigners• Distribution network• State-of-the-art paymentsystems
AREAS OF VALUE ADDED TOSTAKEHOLDERS
• Customers: price reductions;broader product range; fasterdelivery; integrated supplier• Employees: broader base fordeveloping technical andprofessional capabilities and forcareer development• Suppliers: opportunities forlarger contracts• Shareholders: increasedproductivity from resources
• Customers: ease of virtualbusiness at reduced prices;continually up-to-date data onproducts; online technicalservice• Employees: opportunities fornew capabilities• Suppliers: opportunities forlarger contracts• Shareholders: increasedrevenues
Table 10.2 Strategic goals—Cost based
STRATEGIC GOAL
To reduce distributioncosts by an average of10%
To reduce advertisingcosts by 75%
Etc.
AREAS OF POTENTIALCOST SAVINGS
• Shared warehouses;reduction of 35% of sites• Shared websites ande-distribution networks• Larger contracts withhauliers and pricereductions
• Shared agency• Reduce marketing staffby 20%• Better media purchasingclout (say = 15% of costs)
AREAS OF VALUEASSOCIATED WITH THESE
COSTS
• Skilled employees and theircustomer relationships in eachsite• Image issues linked towebsite; reputation linked tooperational side; effectivenessof networks in deliveringcustomer satisfaction
• Relationship of each agencyand knowledge of products andmarket• Added value/knowledge ofmarketing individuals
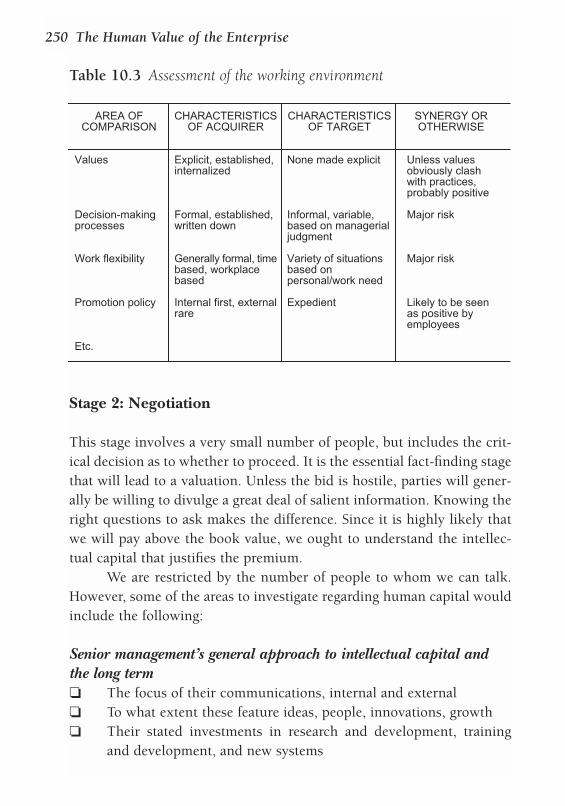
Stage 2: Negotiation
This stage involves a very small number of people, but includes the crit-ical decision as to whether to proceed. It is the essential fact-finding stagethat will lead to a valuation. Unless the bid is hostile, parties will gener-ally be willing to divulge a great deal of salient information. Knowing theright questions to ask makes the difference. Since it is highly likely thatwe will pay above the book value, we ought to understand the intellec-tual capital that justifies the premium.
We are restricted by the number of people to whom we can talk.However, some of the areas to investigate regarding human capital wouldinclude the following:
Senior management’s general approach to intellectual capital andthe long term❏ The focus of their communications, internal and external❏ To what extent these feature ideas, people, innovations, growth❏ Their stated investments in research and development, training
and development, and new systems
250 The Human Value of the Enterprise
Table 10.3 Assessment of the working environment
AREA OFCOMPARISON
Values
Decision-makingprocesses
Work flexibility
Promotion policy
Etc.
CHARACTERISTICSOF ACQUIRER
Explicit, established,internalized
Formal, established,written down
Generally formal, timebased, workplacebased
Internal first, externalrare
CHARACTERISTICSOF TARGET
None made explicit
Informal, variable,based on managerialjudgment
Variety of situationsbased onpersonal/work need
Expedient
SYNERGY OROTHERWISE
Unless valuesobviously clashwith practices,probably positive
Major risk
Major risk
Likely to be seenas positive byemployees
❏ What they say they are proud of❏ Their awareness of the external world: competitors, benchmarking,
industry involvement❏ The way knowledge is managed—are there specific individuals
who have responsibility for knowledge assets?❏ Details of customer satisfaction surveys.
Human capital❏ People-related policies❏ The principles of the remuneration system❏ What information is available on productivity and added value? ❏ Does the contribution of human capital feature in the company’s
performance measurement system? ❏ What do the retention statistics tell us (especially of key technical
groups, senior managers, graduates)?❏ What do the absenteeism statistics tell us?❏ What is the distribution of higher degrees and professional
qualifications?❏ How are role profiles constructed?❏ How is the organization structured? How many levels does it have?
How are accountability, responsibility, and authority distributed?❏ What is the distribution of people: functions, managers and spe-
cialists, locations?❏ To what extent have people come from previous mergers and
acquisitions?❏ What data do we have on employee satisfaction?❏ What is spent on training in relation to the competition?❏ Does the organization have any management development pro-
grams? What are their goals, and do they involve partners such asbusiness schools?
❏ Is there any information on the effectiveness of training investment? ❏ What are the systems for the identification and development of
talent?❏ How many people are identified with potential for significant
future growth?❏ To what extent is there succession in place?
Mergers, Acquisitions, and Alliances 251
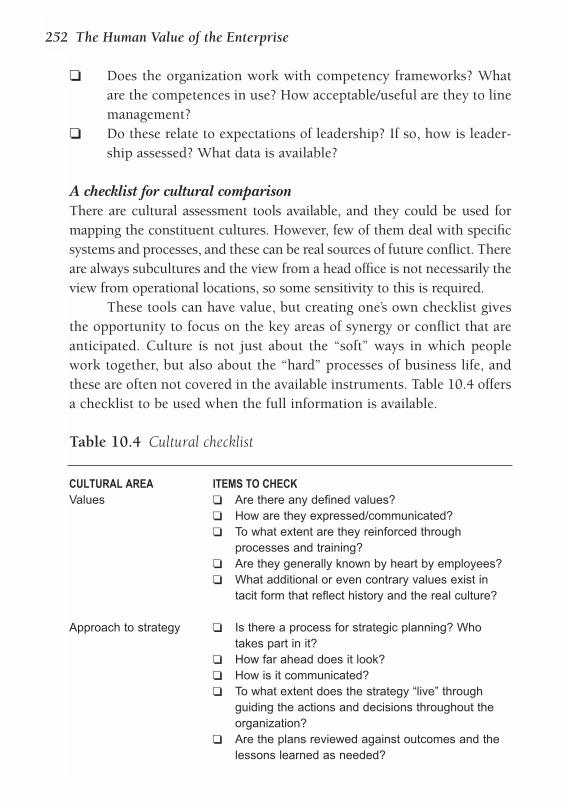
❏ Does the organization work with competency frameworks? Whatare the competences in use? How acceptable/useful are they to linemanagement?
❏ Do these relate to expectations of leadership? If so, how is leader-ship assessed? What data is available?
A checklist for cultural comparisonThere are cultural assessment tools available, and they could be used formapping the constituent cultures. However, few of them deal with specificsystems and processes, and these can be real sources of future conflict. Thereare always subcultures and the view from a head office is not necessarily theview from operational locations, so some sensitivity to this is required.
These tools can have value, but creating one’s own checklist givesthe opportunity to focus on the key areas of synergy or conflict that areanticipated. Culture is not just about the “soft” ways in which peoplework together, but also about the “hard” processes of business life, andthese are often not covered in the available instruments. Table 10.4 offersa checklist to be used when the full information is available.
CULTURAL AREA ITEMS TO CHECKValues ❏ Are there any defined values?
❏ How are they expressed/communicated?❏ To what extent are they reinforced through
processes and training?❏ Are they generally known by heart by employees?❏ What additional or even contrary values exist in
tacit form that reflect history and the real culture?
Approach to strategy ❏ Is there a process for strategic planning? Who takes part in it?
❏ How far ahead does it look?❏ How is it communicated?❏ To what extent does the strategy “live” through
guiding the actions and decisions throughout the organization?
❏ Are the plans reviewed against outcomes and the lessons learned as needed?
252 The Human Value of the Enterprise
Table 10.4 Cultural checklist
CULTURAL AREA ITEMS TO CHECKOrganization ❏ What principles underlie the structure?
❏ How many levels of management are there?❏ How are global and local needs balanced?❏ What are the main roles of HQ?❏ When was the company last reorganized and why?❏ Are there any pockets that have a special history
(e.g., a previous acquisition)?❏ What identifiable tribal loyalties exist? ❏ Which functions have been outsourced? How
satisfactory is the resulting service?
Knowledge management ❏ What is explicitly said in company literature aboutand learning these issues?
❏ Are they reflected in values or processes?❏ How natural is it to share across boundaries?❏ What mechanisms exist for this to happen? To what
extent are they used?❏ Are people able to get the information they need
easily?❏ Are people able to distinguish between learning
and training, and recognize varied forms of learning?
❏ To what extent do people have written personal development plans, and manage them?
Approach to quality and ❏ To what extent is quality seen to pervade the output customer service of every department?
❏ What happens when a customer complains? ❏ What is the status of any service level agreements?
Performance management ❏ What are the measures of performance most frequently discussed?
❏ Which measures are used as incentives for senior management?
❏ What process is used for reviewing performance forteams/units?
❏ What process is used for reviewing performance of individuals?
❏ Does the concept of added value have any currency? Would individuals be able to relate to it?
Mergers, Acquisitions, and Alliances 253
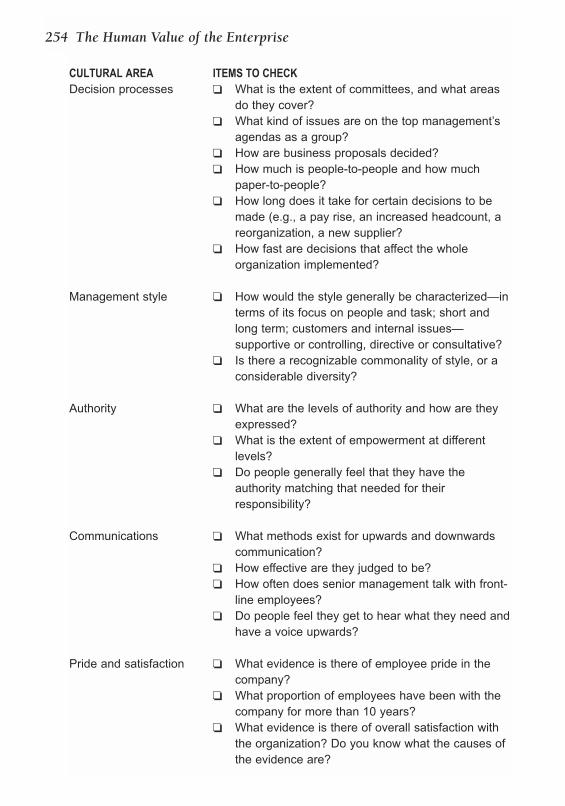
CULTURAL AREA ITEMS TO CHECKDecision processes ❏ What is the extent of committees, and what areas
do they cover?❏ What kind of issues are on the top management’s
agendas as a group?❏ How are business proposals decided?❏ How much is people-to-people and how much
paper-to-people?❏ How long does it take for certain decisions to be
made (e.g., a pay rise, an increased headcount, a reorganization, a new supplier?
❏ How fast are decisions that affect the whole organization implemented?
Management style ❏ How would the style generally be characterized—interms of its focus on people and task; short and long term; customers and internal issues— supportive or controlling, directive or consultative?
❏ Is there a recognizable commonality of style, or a considerable diversity?
Authority ❏ What are the levels of authority and how are they expressed?
❏ What is the extent of empowerment at different levels?
❏ Do people generally feel that they have the authority matching that needed for their responsibility?
Communications ❏ What methods exist for upwards and downwards communication?
❏ How effective are they judged to be?❏ How often does senior management talk with front-
line employees?❏ Do people feel they get to hear what they need and
have a voice upwards?
Pride and satisfaction ❏ What evidence is there of employee pride in the company?
❏ What proportion of employees have been with the company for more than 10 years?
❏ What evidence is there of overall satisfaction with the organization? Do you know what the causes of the evidence are?
254 The Human Value of the Enterprise
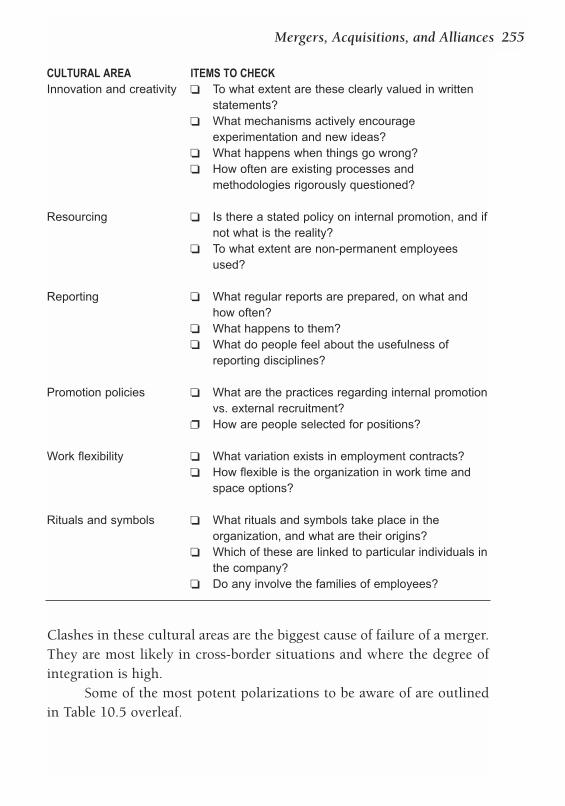
CULTURAL AREA ITEMS TO CHECKInnovation and creativity ❏ To what extent are these clearly valued in written
statements?❏ What mechanisms actively encourage
experimentation and new ideas?❏ What happens when things go wrong?❏ How often are existing processes and
methodologies rigorously questioned?
Resourcing ❏ Is there a stated policy on internal promotion, and ifnot what is the reality?
❏ To what extent are non-permanent employees used?
Reporting ❏ What regular reports are prepared, on what and how often?
❏ What happens to them?❏ What do people feel about the usefulness of
reporting disciplines?
Promotion policies ❏ What are the practices regarding internal promotionvs. external recruitment?
❐ How are people selected for positions?
Work flexibility ❏ What variation exists in employment contracts?❏ How flexible is the organization in work time and
space options?
Rituals and symbols ❏ What rituals and symbols take place in the organization, and what are their origins?
❏ Which of these are linked to particular individuals inthe company?
❏ Do any involve the families of employees?
Clashes in these cultural areas are the biggest cause of failure of a merger.They are most likely in cross-border situations and where the degree ofintegration is high.
Some of the most potent polarizations to be aware of are outlinedin Table 10.5 overleaf.
Mergers, Acquisitions, and Alliances 255
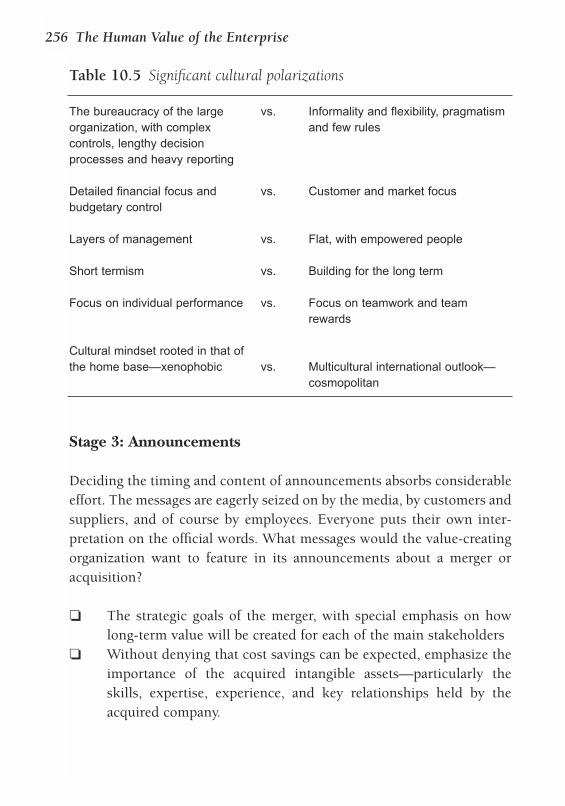
Table 10.5 Significant cultural polarizations
The bureaucracy of the large vs. Informality and flexibility, pragmatismorganization, with complex and few rulescontrols, lengthy decision processes and heavy reporting
Detailed financial focus and vs. Customer and market focusbudgetary control
Layers of management vs. Flat, with empowered people
Short termism vs. Building for the long term
Focus on individual performance vs. Focus on teamwork and team rewards
Cultural mindset rooted in that of the home base—xenophobic vs. Multicultural international outlook—
cosmopolitan
Stage 3: Announcements
Deciding the timing and content of announcements absorbs considerableeffort. The messages are eagerly seized on by the media, by customers andsuppliers, and of course by employees. Everyone puts their own inter-pretation on the official words. What messages would the value-creatingorganization want to feature in its announcements about a merger oracquisition?
❏ The strategic goals of the merger, with special emphasis on howlong-term value will be created for each of the main stakeholders
❏ Without denying that cost savings can be expected, emphasize theimportance of the acquired intangible assets—particularly theskills, expertise, experience, and key relationships held by theacquired company.
256 The Human Value of the Enterprise
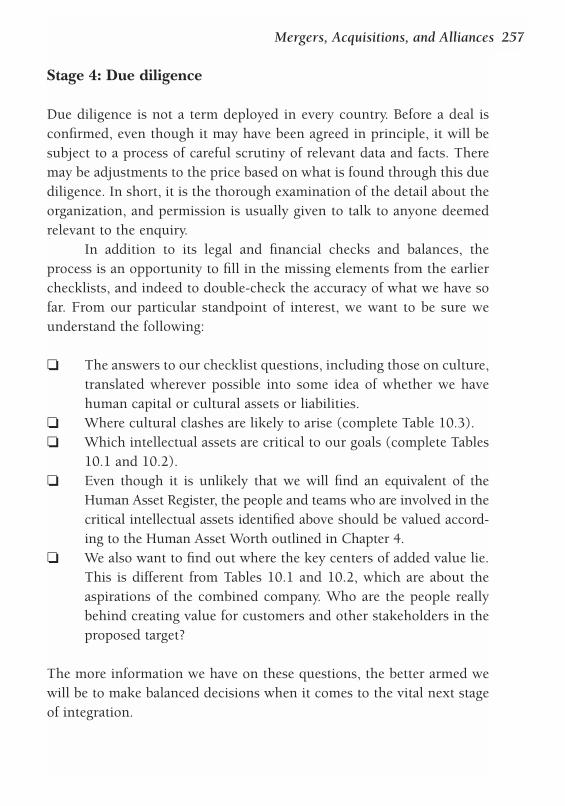
Stage 4: Due diligence
Due diligence is not a term deployed in every country. Before a deal isconfirmed, even though it may have been agreed in principle, it will besubject to a process of careful scrutiny of relevant data and facts. Theremay be adjustments to the price based on what is found through this duediligence. In short, it is the thorough examination of the detail about theorganization, and permission is usually given to talk to anyone deemedrelevant to the enquiry.
In addition to its legal and financial checks and balances, theprocess is an opportunity to fill in the missing elements from the earlierchecklists, and indeed to double-check the accuracy of what we have sofar. From our particular standpoint of interest, we want to be sure weunderstand the following:
❏ The answers to our checklist questions, including those on culture,translated wherever possible into some idea of whether we havehuman capital or cultural assets or liabilities.
❏ Where cultural clashes are likely to arise (complete Table 10.3).❏ Which intellectual assets are critical to our goals (complete Tables
10.1 and 10.2).❏ Even though it is unlikely that we will find an equivalent of the
Human Asset Register, the people and teams who are involved in thecritical intellectual assets identified above should be valued accord-ing to the Human Asset Worth outlined in Chapter 4.
❏ We also want to find out where the key centers of added value lie.This is different from Tables 10.1 and 10.2, which are about theaspirations of the combined company. Who are the people reallybehind creating value for customers and other stakeholders in theproposed target?
The more information we have on these questions, the better armed wewill be to make balanced decisions when it comes to the vital next stageof integration.
Mergers, Acquisitions, and Alliances 257
Stage 5: Integration
This is where successes and failures are created. In 1999, a study by theBoston Consulting Group of 200 postmerger integrations was summa-rized in the Financial Times under the heading of “Seven Deadly Sins.”These were as follows:
❏ Missing strategic opportunities from the merger. Too often thefocus is on cost savings, and meanwhile opportunities to createmuch greater value from new revenue synergies are missed
❏ Preoccupation with managing change, and failing to lead, to createa vision, and provide united direction
❏ Delaying decisions about the future shape of the business, causinguncertainty and missing opportunities that arise from the periodwhen people expect change
❏ Trying to be fair to both partners and give equal treatment—as weobserved earlier, this will not work out practically
❏ Applying a universal integration process to all units regardless ofdifferences in size or difficulty—the integration in the homebase ofa multinational will always require more extensive attention thanin smaller units
❏ Trying to get all details of the new company and its organizationagreed before initiating action and change—this uncertainty poten-tially loses customers and employees
❏ Declaring completion too soon, and failing to follow through andtrack changes. Integration is not over just because the project plansare complete.
Many guides have been written on how to do integration successfully.There is a balance to be struck between speed and thoroughness, sinceboth are desirable. Depending on the time available in the previousstages, it may be possible to have a fully fledged, thorough integrationplan ready to implement at the official time of integration. This is theideal balance if it can be achieved.
The value-creating organization will have an overriding prioritynot to lose value-creating assets. It is very easy to do this with the cost
258 The Human Value of the Enterprise
focus of traditional management accounting, and without any real under-standing of how and where value is created.
What is proved time and time again is that inexperienced integra-tors always make mistakes. Overwhelmed with the volume of tasks to bedone, often under pressure to make savings quickly, fired up with theexcitement of something new and different from everyday work—allthese factors can work together to cause the initial objectives to fail. Avery experienced integration director from the erstwhile prestigious com-pany ITT told me at the time of one of my very early experiences in acqui-sition: “Never put a person in charge of an integration who is out to makea name for him- or herself.” In other words, wisdom and experience willserve you best.
One key question is: “How vital is integration anyway?” It is oftenthe case that an acquisition can continue with its own branding and itsprevious management. Their unique capability is available to the parent,and the latter’s expertise and services can help efficiency in the new fam-ily member. At least in the early days, unless the strategic goals are allabout synergy from combination, this may be the best strategy to retainthe intangible assets. Haspelagh and Jemison list three integrationapproaches based on the two key parameters of the need for strategicinterdependence, and the need for organizational autonomy:
❏ Absorption—the anticipated value is dependent on full consolida-tion of the constituent parties
❏ Preservation—there is a low need for interdependence; theacquired company is nurtured. As far as possible its own cultureand methodologies are left intact
❏ Symbiotic—this is a combination of a high need for both strategicinterdependence and for organizational autonomy, and is the mostcomplex scenario.
Research showed that two other factors may influence the integrationapproach: the quality of the acquired company and the absolute and rel-ative sizes involved. If the acquired company lacks quality of manage-ment, it is natural to supplement it from the parent. This is fine if the twoare in similar businesses; risky if the acquired company is in a new
Mergers, Acquisitions, and Alliances 259
market. On the size issue, if the parent is very much larger it runs tworisks, either overdomination or neglect. Whatever the right approach, aclear set of integration objectives should be set up.
Integration is typically done by setting up functional and market-based project teams, made up of members from each constituent com-pany, coordinated by an integration director. They reflect the traditionalsilos of the organization. The value-creating organization would wantcoordinating teams linked not to functions or departments, but to stake-holder interests. There will also be one concerned with overall intellec-tual capital, and subsets of this such as a team responsible for knowledgeassets. This is the heart of integration: the transfer of intangible assetvalue in terms of capabilities, knowledge, and methodologies.
Common difficulties and pitfalls in integrationThis is a major subject and space does not allow for the treatment itdeserves. Below we list just some of the problems that commonly arisewith particular reference to human capital, and suggested responses fromthe value-creating organization.
Table 10.6 Typical difficulties in managing human capital in integratingmergers and acquisitions
260 The Human Value of the Enterprise
DIFFICULTY
In the interests of cost synergy, salesoffices are combined and the sales-forces “rationalized”
The appointment of general managersis done on the basis of the best personavailable. Then we find that results arenot what we expected, or the personsuddenly quits
POSSIBLE RESPONSE
The issue here is how important cus-tomer relationships are. If we lose cus-tomers, we may save cost, but that islittle benefit if the revenue goes with it.So there is a vital analysis of key (=loyal, profitable, high-potential) cus-tomers and whether they are stronglylinked to individuals in the acquiredfirm
The question here is what we mean by“best.” Having the best track record ofbottom-line results in the previous cul-ture does not guarantee a continuingrecord if (a) a local merging of cultureshas to take place; and (b) the individual
Mergers, Acquisitions, and Alliances 261
DIFFICULTY
Sending in managers from the parentto help the acquired managementteams, and finding that they areunable to influence what goes on
In rationalizing offices and systems,vital data, information, and knowledgeare lost
After power struggles, key senior peo-ple resign. Other people follow in theirwake
Information and knowledge are closelyguarded from the new parent
POSSIBLE RESPONSE
finds him- or herself subject to thedemands of an alien culture. Highemotional intelligence and sensitivitymay, for a while, be more necessarycharacteristics than a successful busi-ness record
Such a person may be seen in manynegative lights: as a spy, or an “I-know-better,” or a political commissar.Potentially they can be a real help, butit is all about trust and confidence.When Fujitsu took over ICL it sent onesenior man to act as liaison director.He quickly managed to create a feelingthat his role was primarily to help themanagement team in what theywanted to do and smooth their paththrough the Japanese decision-makingprocesses. He became highly valuedand respected
Many an integration has stalled on thedesire to move to common IT systems.HQ executives become paranoid abouthaving their management informationin the same format, as if they have lostcontrol. Especially if the people whoreally know those systems leave, itmay be too late before the asset lossis realized. An early integration taskmust be to identify where the realknowledge assets are, who owns andmaintains them
The makeup of “tribes” must be under-stood and mapped. Where are the net-works of loyalty in the acquiredorganization?
This will happen if suspicion, distrust,and insecurity prevail. In a positive
262 The Human Value of the Enterprise
DIFFICULTY
The people involved in creating futurevalue stop work until they see what ishappening and the way the future willunfold. As projects are abandoned,disillusion sets in and greener pas-tures rapidly claim the best people
People lack direction, so they do whatthey feel will best enhance their ownposition
POSSIBLE RESPONSE
atmosphere, people are keen to learnfrom each other and exchange formutual benefit. Building this atmos-phere must be a priority for any inte-grating manager
Everybody expects the new man-agement to come round and explain allthe benefits of the merger. But peoplebelieve what they see, not what theyare told
The acquired firm was a going con-cern. It had people working on newproducts or services, marketing cam-paigns, management development,better logistics, new IT systems. Allthese value-creating activities maycome to a halt, pet projects be aban-doned, and people leave.
These are the value-creating peo-ple, for whom we will have paid part ofour intangible asset premium. Hence itis important to identify who and wherethey are as part of the due diligenceexercise.
Attention needs to be given as a pri-ority to the value-creating teams in dif-ferent functions. In the rush to makeshort-term savings from administrationand operations, it may become toolate—exit value
Providing a clear vision of where thenew organization is going is muchmore important than unraveling thedetails of integration. It is particularlyimportant that customers see peoplepulling in the same direction.Vacillation on this leaves people in avacuum. There is often considerableuncertainty as to where accountabili-ties lie—these should be clarified alongwith the direction
A number of targets for managing human capital may need to bereset as a result of the merger. The merger itself is almost certain to leadto a refocusing of the organization’s overall strategy. This may affect thecause-and-effect chains, and therefore the measures we use. We may needto create a new cultural vision and template. Although the more power-ful partner has a natural tendency to dominate, the combination of cul-tures can be used to create something new.
We will give the last word on integration to the Economist (1999):
A whole consulting industry thrives by advising companies on post-merger integration, a salvage operation to recover something from thewreckage of impossible promises and ill-considered goals. Companiesthat agree a clear strategy and management structure before they tiethe knot stand a better chance of living happily ever after.
Stage 6: Review
The success of a merger must be reviewed in the light of its original objec-tives. It is easy for economic analysts to look at results purely in terms ofincreased profitability or share price. To do so, especially in the shortterm, invalidates the whole concept of intellectual capital and the pre-mium paid for it. All evaluations should be done against what we set outto do.
Disciplined review is an essential part of the process. The mergeror acquisition was an exercise in value transfer and value creation. Wemust know whether these happened or not. Therefore we need to review:
❏ What happened to value❏ How our capability to create value has changed❏ What we learned from the processes we employed.
In the areas that are strategic to the goals of the integration, we wouldexpect to see the Human Asset Worth increase. Thus, if higher marketshare was our goal, we would expect the HAW of the teams related to thatmarket to have increased: sales, marketing, or product development. Ifour goal was to improve our technological capability in a particular field,
Mergers, Acquisitions, and Alliances 263
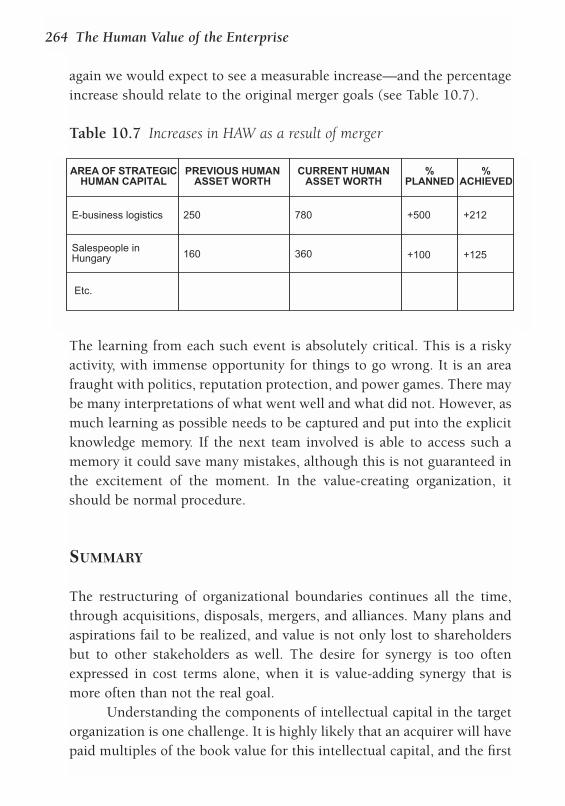
again we would expect to see a measurable increase—and the percentageincrease should relate to the original merger goals (see Table 10.7).
The learning from each such event is absolutely critical. This is a riskyactivity, with immense opportunity for things to go wrong. It is an areafraught with politics, reputation protection, and power games. There maybe many interpretations of what went well and what did not. However, asmuch learning as possible needs to be captured and put into the explicitknowledge memory. If the next team involved is able to access such amemory it could save many mistakes, although this is not guaranteed inthe excitement of the moment. In the value-creating organization, itshould be normal procedure.
SUMMARY
The restructuring of organizational boundaries continues all the time,through acquisitions, disposals, mergers, and alliances. Many plans andaspirations fail to be realized, and value is not only lost to shareholdersbut to other stakeholders as well. The desire for synergy is too oftenexpressed in cost terms alone, when it is value-adding synergy that ismore often than not the real goal.
Understanding the components of intellectual capital in the targetorganization is one challenge. It is highly likely that an acquirer will havepaid multiples of the book value for this intellectual capital, and the first
264 The Human Value of the Enterprise
Table 10.7 Increases in HAW as a result of merger
AREA OF STRATEGICHUMAN CAPITAL
PREVIOUS HUMANASSET WORTH
CURRENT HUMANASSET WORTH
%PLANNED
%ACHIEVED
E-business logistics
Salespeople inHungary
Etc.
250
160
780
360
+500
+100
+212
+125
priority is to retain it. Each strategic goal for the acquisition or allianceneeds to be linked, through cause-and-effect chains, to those aspects ofintellectual capital that are critical to success.
The process follows defined stages, and we have suggested six. Ateach link, the opportunity is there to expand our knowledge and under-standing of the people and their capability, of the culture and knowledgeassets that are to be acquired.
Finally, we will want to see what has happened to our stock ofhuman capital as a result of the merger or acquisition. It is likely that inheadcount terms it will be less than that of the original partners—but itsstrength and quality should have increased in critical areas.
CHALLENGES FOR ACTION
❏ If you have been involved in any mergers, acquisitions, and alliances, what
were their original objectives and to what extent were they achieved, to the
best of your knowledge? List the positive and negative aspects of each.
❏ How would you describe the value added to stakeholders from each event?
❏ In particular, how would you describe any culture clashes? What effects did
they have on the success of the merger?
❏ If people were lost from the new company, who you would regard as real
assets, and what caused them to be so?
Mergers, Acquisitions, and Alliances 265
11Telling the World
AN ANNUAL REPORT IS INTENDED TO PROVIDE SHAREHOLDERS,current and potential, with an accurate picture of a particularcompany. The information given conforms to statutoryrequirements, which vary country by country. A major part
always consists of detailed figures concerning the trading position, andthe assets and liabilities of the company (as at the end of the trading
period). But, as we know, this usually onlyrepresents a minor part of the real value of theorganization.
This final chapter looks at the develop-ments that are happening in statutory require-ments for disclosure, and at some of the waysin which companies are voluntarily disclosinginformation about human capital.
THE GAP THAT NEEDS TO BE FILLED
In the UK alone, more than one billion pounds a year is spent on the pro-duction of annual reports—and this is not counting the time spent com-piling them. Reports are almost entirely retrospective. To find out aboutthe future prospects, we are dependent largely on the narrative thataccompanies the figures, and these are often stale clichés of anodyne opti-mism and selected “good news.”
Amazon.com’s 1999 annual report provided only the followinginformation about its employees:
THERE IS, IN THE ERA WHERE
KNOWLEDGE IS KING, A MAJOR GAP
IN THE PROVISION OF AN ACCURATE
AND HELPFUL GUIDE FOR INVESTORS
AND THE PUBLIC ON HOW VALUE IS
BEING CREATED.
As of December 31, 1999, the Company employed approximately7,600 full-time and part-time employees. The Company also employsindependent contractors and temporary personnel. None of theCompany’s employees is represented by a labor union, and theCompany considers its employee relations to be good. Competition forqualified personnel in the Company’s industry is intense, particularlyfor software development and other technical staff. The Companybelieves that its future success will depend in part on its continued abil-ity to attract, hire and retain qualified personnel.
This comes from a company that knows full well how vital its people areto their success. Investors know this too, but what did they learn fromthis paragraph? They are not alone. Bassi and others studied the reportsof 40 large companies in detail in 1999, and found no disclosures at allof relevant quantitative data about their people, except for the frequentstatement: “Our employees are our most important asset.”
An investor needs confidence that:
❏ There is a coherent strategy to take the company forward❏ Customers have continuing confidence and loyalty❏ New products and services come at a rate at least as good as that of
the competition❏ The quality of people is high❏ The loss of good people is low❏ Employees feel good about the company and their work❏ The level of investment in training and people development is
appropriate ❏ Investment in new systems and processes is continual❏ There are successful business partnerships ❏ There is appropriate care for the environment.
The publication of an annual report itself rarely influences the share val-uation, but announcements about any of the above certainly do. Positivestatements are fine, but what we really need are comparisons that indicateprogress. In what direction is this company moving? Is it getting more orless effective in its use of intellectual and human capital?
Telling the World 267

Steven Wallman, former Commissioner of the US Securities andExchange Commission, makes the case for a new approach:
Some of the most useful information is not necessarily the most reli-able; and some of the most reliable is not necessarily the most useful.A great deal of time is spent aggregating information, according toincreasingly complex rules, and then a great deal of time and money isspent by analysts disaggregating the information to try and understandthe company and what the real strengths are behind it.
And Brian Birkenhead, vice-chairman of the UK’s Hundred Group ofFinance Directors, was quoted in Director magazine as saying:
Annual reports are becoming unreadable. Accounts in their current for-mat are not actually telling people what they want to know.
For newly qualified young people the excitement lies in knowledge-basedindustry. It is hard for firms in traditional industries to compete. Topgraduates seek accounting firms, management consultancies, financialservices, software development, telecommunications, and internet-basedcompanies. In all of these the traditional balance sheet has practically novalue or use. Even Bill Gates said, in a speech at London Business Schoolin 2000, that nobody would find out much about Microsoft from itsannual financial report (the value placed on intellectual capital beingabout 97 percent of the total).
COMPANIES THAT GO BEYOND THE MINIMUM
Some companies provide the absolute minimum required; others havebecome sensitive to their image on some issues and have lengthy sectionson their approach to the environment and the community. DowChemical, for example, states in its 1999 report:
Today, we measure our progress and success by the standards of thenew century—balancing environmental concerns, economic growth
268 The Human Value of the Enterprise
and social responsibility, which is known as the “triple bottom line” ofsustainable development.
Worldwide, we are gaining an industry advantage by deliveringmore of what our customers want. With our accelerated implementa-tion of Six Sigma, customers will realize the difference in Dow as werespond to their needs and deliver on our promises. Our transformationis revealing a new Dow:
❏ Providing innovative products, technologies and solutions that meetour customers’ needs today and tomorrow.
❏ Demonstrating our commitment to making the world a betterplace—balancing environmental integrity, social responsibility andeconomic prosperity.
❏ Elevating the thinking and skills of our employees—making con-nections and sharing ideas worldwide.
❏ Creating long-term shareholder value—differentiating Dow as oneof the best investment values in the chemical industry.
❏ Excellence. Growth. Value. That’s the promise and the power oftransformation.
These fine statements would not be untypical of any major corporation.Several pages emphasize the company’s commitment to innovation andgive examples of success. Specific, quantified goals are published forenvironment, health, and safety. The reader is left feeling very positiveabout the company.
Dow was one of the pioneers in trying to harness intellectual capi-tal in a managed way, but we see very few figures that tell us about this.In 1996 it published Visualising Intellectual Property in Dow, a report onhow the company evaluates and uses all its intellectual property. Thisopenness does not seem to have been continued, however.
In 1999, mobile phone company Nokia built its report around thetheme of “no limits.” This is full of information about the future—andthere was an exciting tale to tell. Some 25 percent of the company’s55,000 employees are involved in R&D in 14 countries, and it reports onthe number of patents and “invention reports” (nearly 3,000 in 1999). Itsfinancial statements are a pullout document separated from the annual
Telling the World 269
report, which concentrates on the future.Internet portal and information services company Yahoo! accom-
panied its 1999 report with a set of artistic postcards on a 1930s theme,each with a fact about the company on the back. Its report gets fairlyclose to an intellectual capital balance sheet, but only with narrative.After a great deal of detail about its services and alliances, it devotes ninepages to no fewer than 24 “risk factors,” analyzing the company’s capa-bility to meet its future strategies. For example, “We will continue toexpand into international markets in which we have limited experience”is one heading, and the factors working for this and against this are dis-cussed. This level of honesty is rarely seen, but is immensely helpful towould-be investors.
Energy company BP, in its annual report for 2000, summarized per-formance highlights on pages 2 and 3. In addition to financial data, fourother charts are set out, for environmental emissions, workforce dayslost, employee satisfaction, and community investment (see Figure 11.1).The small section headed “employees” in the main body of the reportshows a distribution of gender and ethnicity.
LEADERS IN PUBLIC INFORMATION ABOUT HUMANCAPITAL
When it comes to openness, most of the serious attempts to provideinformation and measures of intellectual capital have come fromScandinavia. The world’s first intellectual capital report was produced bySkandia Assurance, the largest insurance and financial services companyin Scandinavia, in 1995 as a supplement to the traditional financialreport. It was called Visualizing Intellectual Capital. This was followedby a series featuring different aspects: Value Creating Processes (1995),Renewal and Development (1996), Customer Value (1996), The Power ofInnovation (1997), Intelligent Enterprising (1997) and Human Capital inTransformation (1998). Leif Edvinsson spent four years setting up andtesting a new measurement structure for the company.
Skandia started its work in 1992 with the evolution of the SkandiaNavigator, and its sister tool called the Dolphin Navigator began in 1998.
270 The Human Value of the Enterprise
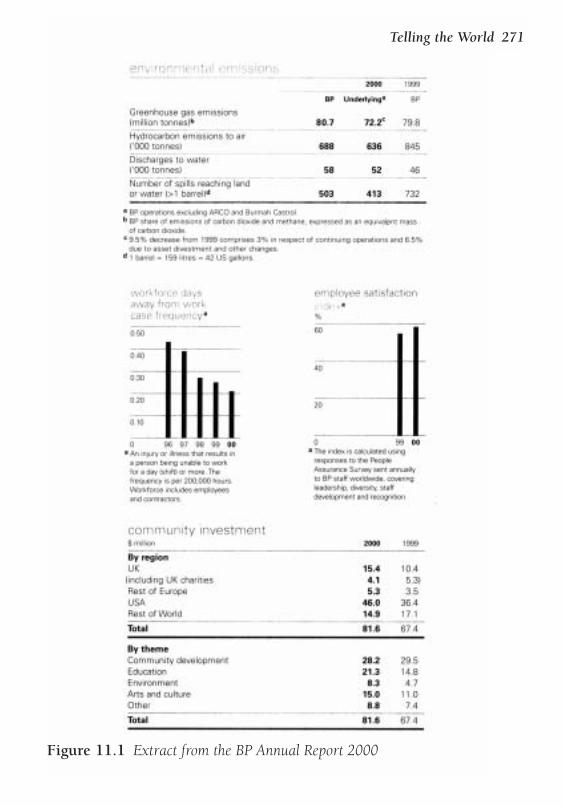
Telling the World 271
Figure 11.1 Extract from the BP Annual Report 2000
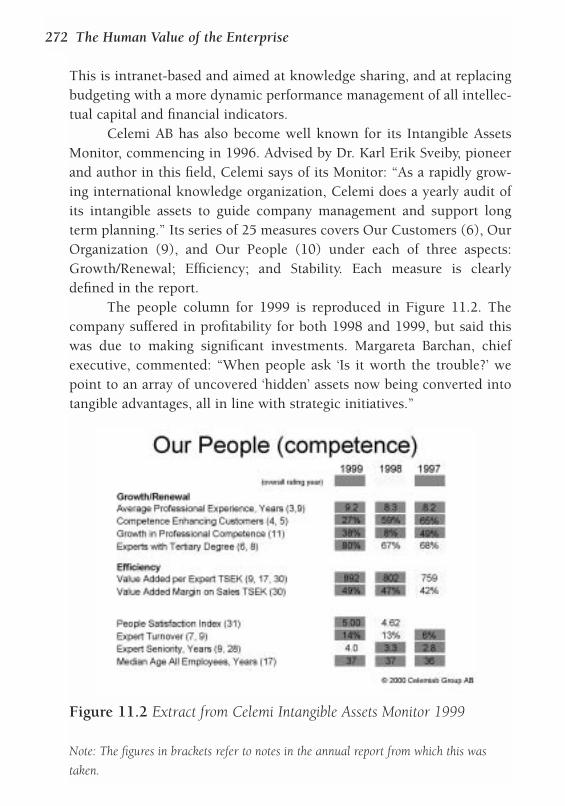
This is intranet-based and aimed at knowledge sharing, and at replacingbudgeting with a more dynamic performance management of all intellec-tual capital and financial indicators.
Celemi AB has also become well known for its Intangible AssetsMonitor, commencing in 1996. Advised by Dr. Karl Erik Sveiby, pioneerand author in this field, Celemi says of its Monitor: “As a rapidly grow-ing international knowledge organization, Celemi does a yearly audit ofits intangible assets to guide company management and support longterm planning.” Its series of 25 measures covers Our Customers (6), OurOrganization (9), and Our People (10) under each of three aspects:Growth/Renewal; Efficiency; and Stability. Each measure is clearlydefined in the report.
The people column for 1999 is reproduced in Figure 11.2. Thecompany suffered in profitability for both 1998 and 1999, but said thiswas due to making significant investments. Margareta Barchan, chiefexecutive, commented: “When people ask ‘Is it worth the trouble?’ wepoint to an array of uncovered ‘hidden’ assets now being converted intotangible advantages, all in line with strategic initiatives.”
272 The Human Value of the Enterprise
Figure 11.2 Extract from Celemi Intangible Assets Monitor 1999
Note: The figures in brackets refer to notes in the annual report from which this was
taken.
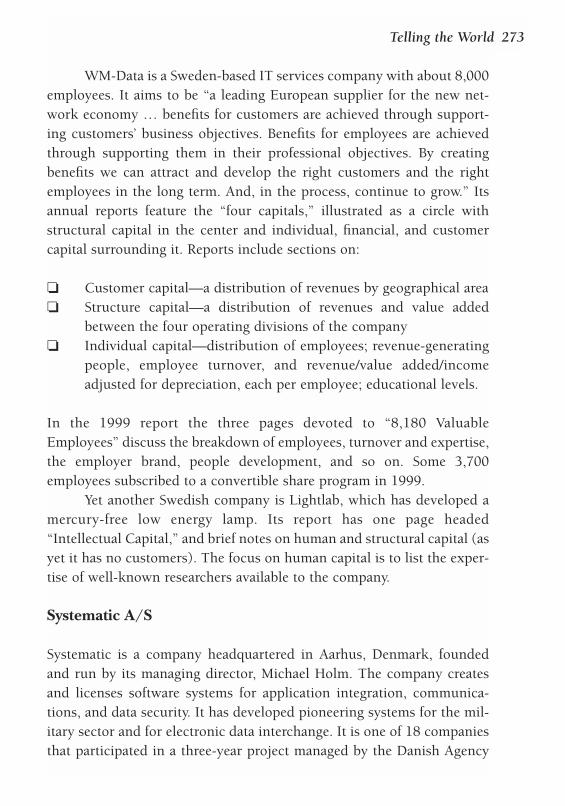
WM-Data is a Sweden-based IT services company with about 8,000employees. It aims to be “a leading European supplier for the new net-work economy … benefits for customers are achieved through support-ing customers’ business objectives. Benefits for employees are achievedthrough supporting them in their professional objectives. By creatingbenefits we can attract and develop the right customers and the rightemployees in the long term. And, in the process, continue to grow.” Itsannual reports feature the “four capitals,” illustrated as a circle withstructural capital in the center and individual, financial, and customercapital surrounding it. Reports include sections on:
❏ Customer capital—a distribution of revenues by geographical area❏ Structure capital—a distribution of revenues and value added
between the four operating divisions of the company❏ Individual capital—distribution of employees; revenue-generating
people, employee turnover, and revenue/value added/incomeadjusted for depreciation, each per employee; educational levels.
In the 1999 report the three pages devoted to “8,180 ValuableEmployees” discuss the breakdown of employees, turnover and expertise,the employer brand, people development, and so on. Some 3,700employees subscribed to a convertible share program in 1999.
Yet another Swedish company is Lightlab, which has developed amercury-free low energy lamp. Its report has one page headed“Intellectual Capital,” and brief notes on human and structural capital (asyet it has no customers). The focus on human capital is to list the exper-tise of well-known researchers available to the company.
Systematic A/S
Systematic is a company headquartered in Aarhus, Denmark, foundedand run by its managing director, Michael Holm. The company createsand licenses software systems for application integration, communica-tions, and data security. It has developed pioneering systems for the mil-itary sector and for electronic data interchange. It is one of 18 companiesthat participated in a three-year project managed by the Danish Agency
Telling the World 273
for Trade and Industry for the development of an Intellectual CapitalReport. Systematic produced its first such report in spring 1999, andbased it on the Business Excellence model popularized by the Foundationfor European Quality Management (see page 50). In the second reportproduced in 2000, Holm says:
We regard this report as a supplement to the financial accounts and avaluable management tool. In the preparation we have achieved higherself-knowledge and consciousness about:
❏ our knowledge and capabilities❏ our shortcomings❏ the correlation between the individual knowledge elements.
This report is a useful communications tool for our stakeholders, i.e. cus-tomers, employees, suppliers, co-operation partners etc., and at the sametime a management tool that facilitates our strategies and objectives.
Systematic’s report features commentary and measures in four areas,described below.
CustomersThe report includes the results of six parameters of customer satisfaction,including “employee competence” that scored 5.4 on a scale of 6. Thereare a number of measures on the customer profile over a three-yearperiod. Among these indicators are the number of active project cus-tomers, new strategic customers, duration of existing customer relation-ships, percentage of customers who would recommend Systematic (88percent) and details of license sales.
Processes and infrastructureIn this section their goals are to be in the top 10 percent of quality soft-ware companies, as externally assessed, and to implement a system ofknowledge management.
Indicators include process improvement, computer capacity, officepremises, and an externally monitored telephone service.
274 The Human Value of the Enterprise
InnovationThe figures shown here include investment in both product developmentand process improvement, and the number of new products.
The report includes special sections on knowledge management(and quotes a “cola index,” which appears to be the number of cokesconsumed per employee); cooperation with clients (with a “pizzaindex”), and competence development (with a “carrot index”). Thesesections describe in detail processes and targets for making the threeareas effective.
EmployeesThe section on employees is reproduced below and in Figure 11.3.
Employee SatisfactionWe attach great importance to employee job satisfaction. We measurethis through staff turnover and specific job satisfaction surveys.
Last year showed an intake of 29 and a reduction of 11 softwareengineers. This staff turnover of approximately 16% may seem high,but the high demand for IT employees—not least for skilled computerscientists and systems engineers—should be taken into consideration.Besides, a job at Systematic is the first after graduation for many ofour employees.
It is our goal to keep the staff turnover down below 15%, whichcorresponds to an average employment period of seven years.
Employee satisfaction surveys are conducted annually. The lat-est survey from September 1999 consisted of 35 questions to beanswered anonymously on a scale from 1 to 5 with a view to bothimportance and satisfaction. The response rate to the questionnairewas 97%.
The survey revealed a high satisfaction level, increasing from 3.47in the first survey in 1997, to 3.61 in 1998 and now to 3.69 in the 1999survey. Areas of improvement were identified though, and initiativeswill be taken to remedy these. The employees are involved in the plan-ning of these activities through department meetings and half-yearlyperformance reviews.
Telling the World 275
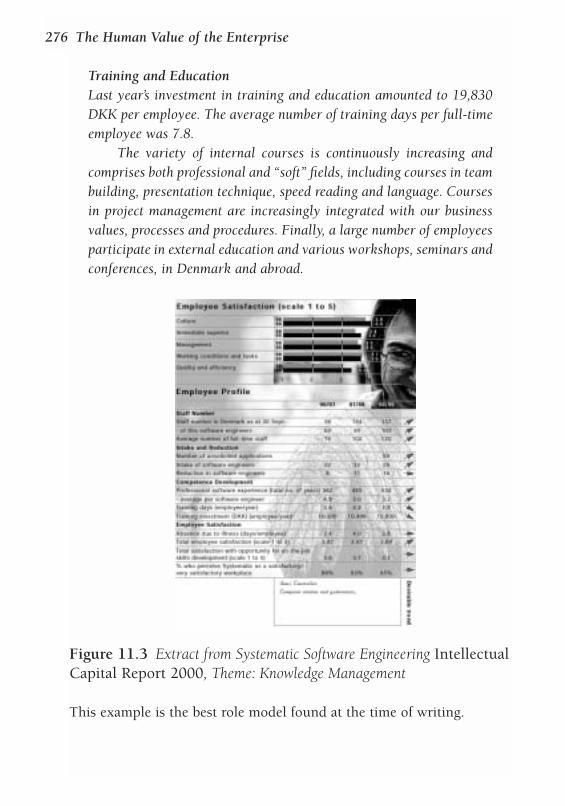
Training and EducationLast year’s investment in training and education amounted to 19,830DKK per employee. The average number of training days per full-timeemployee was 7.8.
The variety of internal courses is continuously increasing andcomprises both professional and “soft” fields, including courses in teambuilding, presentation technique, speed reading and language. Coursesin project management are increasingly integrated with our businessvalues, processes and procedures. Finally, a large number of employeesparticipate in external education and various workshops, seminars andconferences, in Denmark and abroad.
This example is the best role model found at the time of writing.
276 The Human Value of the Enterprise
Figure 11.3 Extract from Systematic Software Engineering IntellectualCapital Report 2000, Theme: Knowledge Management
FUTURE REPORTING FOR INTELLECTUAL CAPITAL
Both Systematic and Celemi are new, young, knowledge-based and rela-tively small companies. They are refreshingly open and reading theirreports gives a comprehensive visualization of what each company is like.The value to potential recruits is enormous. They also, of course, havepositive messages to share—there are not too many intellectual “liabili-ties” to be talked about. Large, complex companies are likely to be moreselective in what they reveal on a voluntary basis.
It is much harder to show continual improvement, as is expectedwith financial figures such as growth and profitability. Improvement isnaturally desirable, but to maintain a target level on many parameters willstill give good signals. Also, the return on intellectual capital will gener-ally be a lower figure than the traditional “return on capital employed,”although it is arguably more relevant, especially for low capital-intensivecompanies.
We can predict with some confidence that during the first decadeof the twenty-first century, firms will be required statutorily to report ontheir intangible assets. However, this may come in stages. Accountingbodies will focus first on their own definition of intangible assets, whichexcludes people and many other aspects such as brands.
Unless forced to do so, we may expect companies to stay withtelling the world what they want them to know, that is, about their reallypositive assets. This could be a misleading presentation of the truth.
In the UK, a body called the Centre for Tomorrow’s Company, withover 50 member companies, was set up “with a vision of a world in whichbusiness success is spoken about and measured in inclusive terms.” Itseeks to influence business, investors, educators, and public policy mak-ers. One thrust of its work is to emphasize the need for an annual reportthat communicates to all stakeholders what they want to know. The per-fect report, they argue, describes “how the company has generated—andwill continue to generate—value for its shareholders while at the sametime identifying and measuring the party played by customers, employ-ees, suppliers and the community in creating and sustaining value.”Sebastian Berry, in the Centre’s publication The Future of BusinessReporting, argues that reports should contain:
Telling the World 277
❏ Benchmarks on environmental and social performance againstother companies
❏ Rolling five-year emissions reports❏ Ethical and reputations issues and policies❏ Reports on annual consultations with stakeholders❏ Secondary environmental impacts, such as sites and community
affairs❏ Staff surveys and detailed comparative information on diversity.
He also maintains that websites should be interactive. While this is allbeneficial, the importance of human capital is nevertheless understated.
Chris Swinson, President of the UK’s Accounting Standards Board,wrote the following:
Many people are beginning to talk about the efficiency and the effec-tiveness of corporate reporting. It is easy at times not to think aboutwhat other people are saying about us accountants and to shut our eyesto the siren voices, some of which may lead us on the rocks, but someof which would improve what we are actually doing.
The long and the short of this is that accountants have longknown that historical cost financial reports do not attempt to meet theinformation needs of all users of accounts. Yet, for all this, the market-place has gone on using those financial reports.
We ought to ask how we can encourage financial reporting tomeet the changing information needs of business and society. It is notthat we should reject historical cost financial reporting but that we arenot serving anyone if we do not pay attention to calls for change. Thereis no point in accountants working overtime to produce more and moreaccounting standards which serve simply to over-specify an old tech-nology. The time is ripe for issues of corporate reporting to be the sub-ject of a formal and broad review. We ought to be hard-nosed andcalculating about what are the real permanent sustainable needs whichrequire a real permanent sustainable answer on the form of the corpo-rate reporting system in this country. I would suggest that we learnfrom experience of the past.
278 The Human Value of the Enterprise
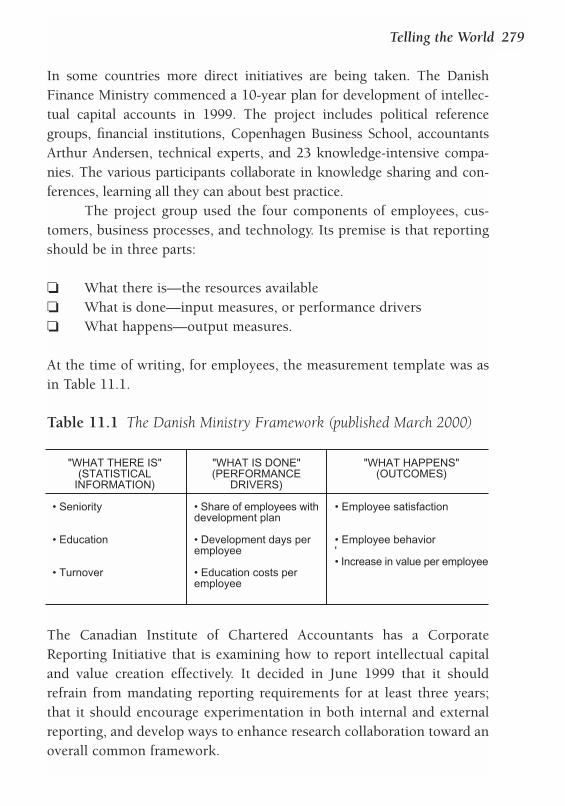
In some countries more direct initiatives are being taken. The DanishFinance Ministry commenced a 10-year plan for development of intellec-tual capital accounts in 1999. The project includes political referencegroups, financial institutions, Copenhagen Business School, accountantsArthur Andersen, technical experts, and 23 knowledge-intensive compa-nies. The various participants collaborate in knowledge sharing and con-ferences, learning all they can about best practice.
The project group used the four components of employees, cus-tomers, business processes, and technology. Its premise is that reportingshould be in three parts:
❏ What there is—the resources available❏ What is done—input measures, or performance drivers❏ What happens—output measures.
At the time of writing, for employees, the measurement template was asin Table 11.1.
The Canadian Institute of Chartered Accountants has a CorporateReporting Initiative that is examining how to report intellectual capitaland value creation effectively. It decided in June 1999 that it shouldrefrain from mandating reporting requirements for at least three years;that it should encourage experimentation in both internal and externalreporting, and develop ways to enhance research collaboration toward anoverall common framework.
Telling the World 279
Table 11.1 The Danish Ministry Framework (published March 2000)
"WHAT THERE IS"(STATISTICAL
INFORMATION)
• Seniority
• Education
• Turnover
"WHAT IS DONE"(PERFORMANCE
DRIVERS)
• Share of employees withdevelopment plan
• Development days peremployee
• Education costs peremployee
"WHAT HAPPENS"(OUTCOMES)
• Employee satisfaction
• Employee behavior'• Increase in value per employee
WHAT SHOULD WE DO?
If we are convinced that the value-creating organization is the route tosuccess and we want to be ahead of the game, what stages should we gothrough in moving toward external visibility?
❏ First, we should decide on the information that it would be strate-gically advantageous for us to publish, and consider what mediumto use
❏ Then we should keep an eye on the recommendations of accoun-tancy bodies and other relevant institutions, and what other coun-tries are doing
❏ We might want to see how others in our industry sector were look-ing at the question and what plans they had, and even agree somemutual reporting
❏ Last, we need to decide whether we want to be leading or laggingin disclosure.
The Canadian Institute of Chartered Accountants has developed someself-assessment tests that can be undertaken to evaluate readiness forintellectual capital management. These can be found on their website(see References).
SUMMARY
It is rare to find a public annual report that tells readers what they reallywant to know about how value is being created. We cannot expect com-panies to disclose all their weaknesses voluntarily, but many could domore to emphasize the strengths of their intangible assets.
Some large companies have started to do this, particularly whereareas of activity are sensitive, such as those affecting the environment.Information regarding human capital is rare. The leaders in this area arefrom Sweden and Denmark, and in some cases they have now been ableto compare year-on-year data. With the exception of Skandia, these com-panies are generally small and highly knowledge based.
280 The Human Value of the Enterprise
A number of bodies in Europe and the US are exploring someguidelines for human capital reporting. It is fairly certain that somerequirements will emerge over the next 10 years. Therefore it makessense for companies to set up internal measures and reporting as soon aspossible and to prepare themselves for the future.
CHALLENGES FOR ACTION
❏ How do you currently tell others outside the company about your intellec-
tual capital and its progress? If you have competitors, what do they do in this
regard?
❏ Has your board ever discussed the future disclosure of key data about human
capital?
❏ Where would you find it difficult to do so due to the lack of a workable inter-
nal system?
Telling the World 281
Appendix:The Development andMeasurement ofIntellectual Capital
The first thinkers to apprehend the importance of intellectual capital andthe need for a new business model came from Sweden.
Björn Wolrath, CEO of Sweden-based financial services companySkandia Assurance, realized in the late 1980s that a better guide to grow-ing a services organization was required than that provided by traditionalmeasures. In 1991, Skandia was the first organization in the world toappoint a director of intellectual capital, Leif Edvinsson. He was given thetask of finding a way to monitor the intangible assets of the company. Hisintellectual capital mission was defined as follows:
❏ To identify and to enhance the visibility and measurability of intan-gible and soft assets
❏ To capture and support packaging and accessibility by knowledgetransparency and knowledge technologies
❏ To cultivate and channel intellectual capital through professionaldevelopment, training and IT networking
❏ To capitalize and leverage by adding value through faster recyclingof knowledge and increased commercialized transfer of skills andapplied experience.
The company’s first internal “balanced” annual report was produced in1995. It was based on a measurement system that Edvinsson derived fromthe Balanced Scorecard (see Chapter 3) to form the Skandia Navigator.Both Edvinsson and Skandia became evangelists for the importance ofintellectual capital, and “went public” in 1995 by producing a supple-ment to the official annual report.
Dr. Karl-Erik Sveiby was executive chairman of one of Sweden’smost successful publishing companies. He later became an author andconsultant specializing in knowledge and intangible revenue genera-tion. He first published proposals for a different annual report in 1988,and some six years later the Swedish Council of Service recommendedthat its members adopt his ideas. In 1989 he published the results of aworking group study in The Invisible Balance Sheet, and introduced thenow widely accepted trio of intellectual capital categories. In 1990 hepublished (in Swedish) his book Knowledge Management and was thefirst to bring out the importance of this in a systematized way. He com-piled the Intangible Assets Monitor that has been in use for some yearsby the consulting company Celemi. He continues to study the area ofmeasurement.
Sveiby also invented several simulations. One, called Tango!, ismarketed by Celemi, and explores the challenges of knowledge-intensivecompanies through managing projects over several time periods.Decisions about staff and customer choices demonstrate the tensionbetween generating money today and developing know-how that enablesbigger projects in the future. Every decision has cash implications and inthe long term the goal is to build up maximum cash, or wealth availablefor distribution. It shows how people and their capabilities link ulti-mately to creating financial value.
Göran and Johan Roos are brothers, one a consultant and the othera professor at IMD in Lausanne. They have worked extensively in advis-ing companies on intellectual capital management and developed a mea-suring tool called the IC-index. They distinguish between differentgenerations of intellectual capital thinking:
❏ First generation: concerned with awareness, identifying indicatorsand developing some kind of report
Appendix: Development and Measurement of Intellectual Capital 283
❏ Second generation: concerned with a focus on changes and flowsbetween different kinds of intellectual capital; develops indices andcompares them with market value.
In the US, Thomas Stewart, a journalist with Fortune magazine, power-fully highlighted the dilemmas of the knowledge age in a 1994 article,since followed up by his book Intellectual Capital. Others in NorthAmerica who have been protagonists include the following:
❏ Gordon Petrash of Dow Chemical was another early appointee as adirector of intellectual capital. He started by examining the pro-tected intellectual assets of the company. He developed value mea-sures in terms of the percentage of current and new business salesthat were protected
❏ Patrick Sullivan is a founding partner of the ICM group, aCalifornia-based company focused on maximizing the benefitsfrom intellectual capital. He has done much to bring togetherthinkers and practitioners under the aegis of The ICM Gathering,and has also published books of his own. His focus is on the extrac-tion of financial value from intellectual capital
❏ Hubert St Onge has been particularly active in developing linksbetween knowledge management and intellectual capital, while atthe Canadian International Bank of Commerce. He also emphasizesthe primacy of customer capital.
TERMS IN USE
There have been many works on the subject of intellectual capital inrecent years, many of which are included in the References. As thinkershave sought to categorize the components of intellectual capital, manyterms have emerged. Table A.1 is a short summary of some of the termsin use and where they fit together.
284 The Human Value of the Enterprise
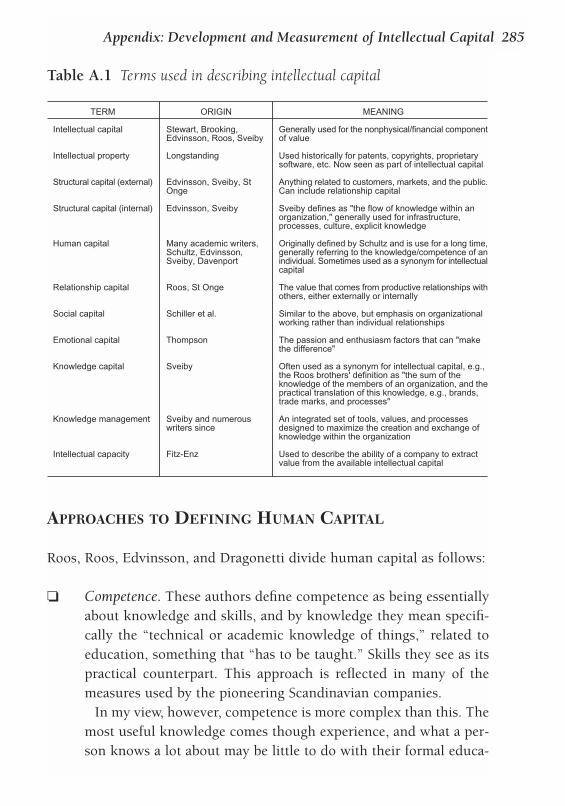
APPROACHES TO DEFINING HUMAN CAPITAL
Roos, Roos, Edvinsson, and Dragonetti divide human capital as follows:
❏ Competence. These authors define competence as being essentiallyabout knowledge and skills, and by knowledge they mean specifi-cally the “technical or academic knowledge of things,” related toeducation, something that “has to be taught.” Skills they see as itspractical counterpart. This approach is reflected in many of themeasures used by the pioneering Scandinavian companies.
In my view, however, competence is more complex than this. Themost useful knowledge comes though experience, and what a per-son knows a lot about may be little to do with their formal educa-
Appendix: Development and Measurement of Intellectual Capital 285
Table A.1 Terms used in describing intellectual capital
TERM
Intellectual capital
Intellectual property
Structural capital (external)
Structural capital (internal)
Human capital
Relationship capital
Social capital
Emotional capital
Knowledge capital
Knowledge management
Intellectual capacity
ORIGIN
Stewart, Brooking,Edvinsson, Roos, Sveiby
Longstanding
Edvinsson, Sveiby, StOnge
Edvinsson, Sveiby
Many academic writers,Schultz, Edvinsson,Sveiby, Davenport
Roos, St Onge
Schiller et al.
Thompson
Sveiby
Sveiby and numerouswriters since
Fitz-Enz
MEANING
Generally used for the nonphysical/financial componentof value
Used historically for patents, copyrights, proprietarysoftware, etc. Now seen as part of intellectual capital
Anything related to customers, markets, and the public.Can include relationship capital
Sveiby defines as "the flow of knowledge within anorganization," generally used for infrastructure,processes, culture, explicit knowledge
Originally defined by Schultz and is use for a long time,generally referring to the knowledge/competence of anindividual. Sometimes used as a synonym for intellectualcapital
The value that comes from productive relationships withothers, either externally or internally
Similar to the above, but emphasis on organizationalworking rather than individual relationships
The passion and enthusiasm factors that can "makethe difference"
Often used as a synonym for intellectual capital, e.g.,the Roos brothers' definition as "the sum of theknowledge of the members of an organization, and thepractical translation of this knowledge, e.g., brands,trade marks, and processes"
An integrated set of tools, values, and processesdesigned to maximize the creation and exchange ofknowledge within the organization
Used to describe the ability of a company to extractvalue from the available intellectual capital
tion. For example, I have a degree in chemical engineering, buthow much I could tell you about it decades later is sadly only afraction of what I once learned.
❏ Attitude. This, say Roos et al., depends mostly on personality traitsand can be changed very little. It is influenced by “motivation,behavior and conduct.” The Human Capital Monitor argues thatthese are strongly dependent on the environment in which peoplework.
❏ Intellectual agility. This is used to cover innovation, flexibility, andadaptability—traits seen at a group or organizational level as muchas in individuals.
Sveiby uses the heading “professional competence” for human capital.This he defines as a combination of educational attainment levels andyears of experience. He then breaks it down, as for the other componentsof intellectual capital, into aspects of growth/renewal, efficiency, and sta-bility, defining his overall framework for measuring intellectual capitalcomponents.
Thomas O Davenport, in his book Human Capital, sees humancapital as owned and invested by the individual, and the task of the orga-nization as to harness it, keep it, and grow it while it is available.Davenport builds his approach on the increased level of control that peo-ple have taken of their own lives, and the norm of people staying with anemployer only for as long as their conditions are satisfied. Europeans mayquestion this very US attitude to employment, but it does not invalidatethe basic concepts.
Davenport breaks human capital down into three elements:
❏ Ability. This is subdivided into knowledge—“the intellectual con-text in which a person performs”; skill—“the means of performingtasks”; and talent. By the latter he means a specific aptitude, suchas being a very good surgeon or a teacher
❏ Behavior. This is the way in which the task is performed, andembraces attitudes and personal traits
❏ Effort. By this is meant application of the ability. It relates to moti-vation and commitment, but has overtones of productivity.
286 The Human Value of the Enterprise
These categories concern the individual’s human capital. An organizationbrings individuals together, however, and makes something greater thantheir own independent contribution. The way in which people collabo-rate toward common goals is also part of human capital.
APPROACHES TO VALUING INTELLECTUAL CAPITAL
Here are some of the ways that have been proposed in the last few yearsfor measuring intellectual capital.
Tobin’s “q”
The Nobel prize-winning economist James Tobin developed a theory thatfirms will continue to invest as long as their market value exceeds thetotal replacement value of their tangible assets. He was the first to recog-nize the changing relationship between tangible assets and market value.His “q” is the ratio of these two numbers. If “q” is 1, this is a signal forexpansion; if less than 1, a pointer toward divestment.
The problem with this ratio is that it does not work well as aninvestment guide for knowledge-intensive companies. However, it is oneway to describe and compare the differences between market and bookvalue, especially over a long period, and it neutralizes the effect of differ-ent asset replacement policies.
The Calculated Intangible Value (CIV)
NCI Research in the US, an affiliate of the Kellogg School of Business atNorthwestern University, set up a project group to find a way of measur-ing intangibles. It defined the value of intangible assets as the company’sability to outperform an average competitor that has similar tangibleassets. The method calculates first the return on assets for a particularcompany over a three-year period. The average for the industry is thenascertained. Based on the assets of the company in question, the excess(or deficit) of earnings is calculated, and compared with what would beproduced by the average company. Tax is deducted and the outcome is
Appendix: Development and Measurement of Intellectual Capital 287
the premium of earnings attributable to the company’s intangible assets.That premium is then resolved to its net present value to give a capitalvalue.
This is not the market value, of course. However, it is a useful fig-ure for judging whether the market price is reflecting the “hidden value,”or indeed is excessive
People Value Added (PVA)
This ratio is defined as the Economic Value Added (EVA) divided by thecapitalized value of employee costs. It recognizes that financial value isultimately dependent on human capital. PVA is used by AT&T NetworkSystems, which conducts regular employee surveys under the samename.
Management Value Added and Information Productivity Index
Paul Strassmann, previously chief information officer at Xerox, has stud-ied the productivity and value of intellectual assets for many years. He seesEVA as a measure of the return on intellectual capital, and ManagementValue Added (MVA) as equivalent to its capital value. Strassmann assertsthat the cost of managing knowledge is—in nearly every case today—greater than the cost of managing capital. He suggests that a relevant ratiois Management Value Added, “what is left over after absolutely all costs arefully accounted for.” The methods suggested for calculation are onerous,however, and a more accessible ratio suggested by him is:
Information Return on intellectual assets (profits after tax less cost of capital)Productivity =Index Management costs (sales and general administration + R&D)
This estimates how much of management costs has been converted intointellectual assets. Strassmann has made a number of calculations for spe-cific companies, and also analyzed 7,224 companies worldwide to give aweighted average IP Index by country. Sweden and Finland came top;countries, as it happens, where interest in intellectual capital monitoringhas been pioneered.
288 The Human Value of the Enterprise
Organizational Intellectual Capital
Leif Edvinsson, while at Skandia, studied the problem of measuring intel-lectual capital in great depth. He has used some 170 indicators todescribe it in detail, but as a summary introduced the OrganizationalIntellectual Capital (OIC) indicator. This is calculated as:
Organizational Intellectual Capital (OIC) = i x C
Where i = intellectual capital coefficient of efficiency and C = the intellectual capital absolute measure
C is not in this case the difference between market value and tan-gible assets. It is derived by Edvinsson adding up the 20 or so of his mea-sures that have a calculable monetary value.
i is the average of the indices in his set that are ratios of efficiencyexpressed as percentages. Edvinsson has nine of these.
There are many objections to this approach, particularly theassumption that each ratio has the same importance. Thus, the nineindices include “market share” and the “training hours index,” useful intheir own right although it would be hard to demonstrate their equalcontribution.
Value Added Intellectual Coefficient
Ante Pulic of the Austrian Intellectual Capital Research Centre arguesthat to create value added, we must effectively utilize the physical capitalwe have, as well as the intellectual potential. This concept narrows downintellectual capital to the employees only, i.e., not including structuralcapital. His expression of value for intellectual potential is the sum ofexpenditure for employees’ salaries. His argument is that this is definedby the market and therefore has validity as an expression of value. As aresult, he developed the formula:
VAIC™ (Value Added Intellectual Coefficient) is the sum ofVACA = the value added from one unit of physical capital andVAIP = the value added from each $ (for example) spent on employees
Appendix: Development and Measurement of Intellectual Capital 289
The author of this method is unashamedly enthusiastic for his approach,as it is based on published monetary measures and therefore enablescomparisons between companies and within one company over time. Itis also not subject to the vagaries of stock market gyration, but worksessentially from the value that is added.
Because the key divider is the total costs that are spent on employ-ees, the VAIC is increased as the costs of employees fall. As an overallcompany success measure it has the same dangers as profitability targets,focusing on the short term. It also does not tell us the proportion of valuethat has come from the physical or the human assets, and therefore doesnot make the task of managing intellectual capital any easier.
IC Multiplier and IC Rating
These factors have been developed by Leif Edvinsson under the auspicesof his company Intellectual Capital Sweden AB. The IC Rating™ is basedon data collected through comprehensive interviews with employees andother stakeholders and a rating is applied to each element of intellectualcapital. The IC Multiplier is the ratio of structural capital to human cap-ital. Where this is below 1.0 a high risk is implied, in the sense that moreof the intellectual capital can “walk away” than is embedded in the infra-structure of the organization.
In a paper presented in May 2001, a study of 43 companies inSweden (mostly in IT) compared the IC Multiplier with business ratiossuch as net sales per employee and profit per employee, finding some sig-nificant correlations. The average Multiplier found was 0.93, in a rangefrom 1.05 to 0.79.
IC-Index
We referred earlier to Johan and Göran Roos and their first and secondgenerations of intellectual capital. They concluded that because it was sodifficult to measure intellectual capital itself, the focus should be on mea-suring changes. To this end they developed a tool called the IC-Index.
Their distinguishing concept is that it is the flows between compo-nents of intellectual capital and financial capital that matter. As they put
290 The Human Value of the Enterprise
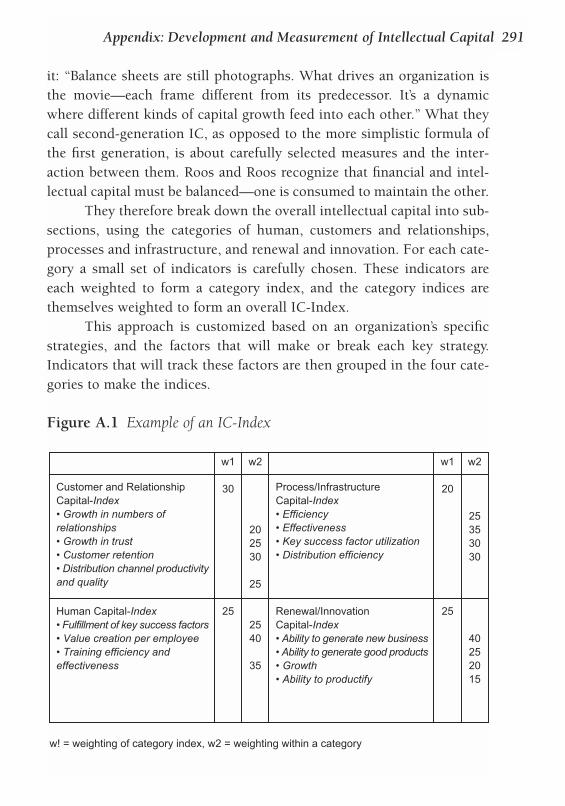
it: “Balance sheets are still photographs. What drives an organization isthe movie—each frame different from its predecessor. It’s a dynamicwhere different kinds of capital growth feed into each other.” What theycall second-generation IC, as opposed to the more simplistic formula ofthe first generation, is about carefully selected measures and the inter-action between them. Roos and Roos recognize that financial and intel-lectual capital must be balanced—one is consumed to maintain the other.
They therefore break down the overall intellectual capital into sub-sections, using the categories of human, customers and relationships,processes and infrastructure, and renewal and innovation. For each cate-gory a small set of indicators is carefully chosen. These indicators areeach weighted to form a category index, and the category indices arethemselves weighted to form an overall IC-Index.
This approach is customized based on an organization’s specificstrategies, and the factors that will make or break each key strategy.Indicators that will track these factors are then grouped in the four cate-gories to make the indices.
Appendix: Development and Measurement of Intellectual Capital 291
Customer and RelationshipCapital-Index• Growth in numbers ofrelationships• Growth in trust• Customer retention• Distribution channel productivityand quality
Process/InfrastructureCapital-Index• Efficiency• Effectiveness• Key success factor utilization• Distribution efficiency
Human Capital-Index• Fulfillment of key success factors• Value creation per employee• Training efficiency andeffectiveness
Renewal/InnovationCapital-Index• Ability to generate new business• Ability to generate good products• Growth• Ability to productify
w1
30
25
w2
202530
25
2540
35
w1
20
25
w2
25353030
40252015
w! = weighting of category index, w2 = weighting within a category
Figure A.1 Example of an IC-Index
The knowledge bank
The late Alan Benjamin, former director of SEMA group and ICL, devel-oped a measure for the Tomorrow’s Company initiative under the aus-pices of the Royal Society for the Encouragement of Arts, Manufacturesand Commerce, a UK “club” of intellectually minded people from all pro-fessions. His premise was that investors had no interest in the physicalasset side of a company; only in the capability of the people in it.
Benjamin treated all traditional capital spending as an expense. Hethen evaluated that part of salaries that was dedicated to the future ratherthan maintaining the present. For a few people this may be all their time;for most it would be a proportion. This part of employee costs Benjamincapitalized, using standard accounting valuation techniques. He thengave a special value to the replacement costs of highly skilled technicalpeople, and also estimated the net present value of future products fromR&D. Without going into all the fine detail, the net result of the sum ofcapitalized pay and R&D value added is termed the knowledge bank.
Valuing knowledge
Knowledge takes many forms. There are technically generated patents,copyrights and formulae, some of which may be directly associated withdiscrete future revenue streams, as for example in a drug patent or inlicensing agreements. Others provide commercial advantage in systems,processes, and methodologies. Another form of knowledge is the creationof databases such as customer details. There is a market in mailing lists,but most companies would not want to share such information.
There are two questions in this regard:
❏ Is the knowledge of such a nature that other people would pay forit if they could?
❏ Is the knowledge of unique value to us, in that it would be hard toreplicate, but nevertheless gives us commercial advantage?
One approach is to look at the replacement cost of reproducing theknowledge. However, this may not reflect its real contribution to value.
292 The Human Value of the Enterprise
What matters is not the absolute monetary value—which will always besubject to assumptions—but the nature of the asset and how it is harnessed.We would therefore look for measures that tell us the extent to which it isuseful in improving productivity; whether strategic knowledge assets areincreasing; and any benchmarks that we could have against competition.
Baruch Lev has suggested a way of calculating knowledge capital.Taking an average of past earnings over, say, three years, and an averageof expected future earnings over a similar period, he calculated a “nor-malized earnings” figure. Subtract the return on physical assets and thereturn on financial assets and the surplus is that earned as a result of“knowledge,” which can then be capitalized as “knowledge capital.”
In a study of the US pharmaceutical industry, Merck had the high-est figure, with a ratio to book value of 4.8 (where the ratio of overallmarket value to book value was 12.1), and knowledge-related earnings /sales being 22 percent. This compares with an average figure for theindustry of 17.7 percent. Studying the chemical industry showed a muchlower average, at 6.8 percent.
Intangible Assets Monitor
Karl Erik Sveiby developed the Intangible Assets Monitor, which we illus-trated in Figures 3.6 and 3.7. Against the three main categories of intel-lectual capital—external structure, internal structure, andcompetence—he chose indicators that illustrated growth/renewal, effi-ciency, and stability. An extract from Celemi, one of his user companies,was shown in Chapter 11 for the competence dimension.
ACCOUNTANTS’ VALUATION OF INTANGIBLE ASSETS
“Intellectual capital has been considered by many, defined by some,understood by a select few, and valued by practically no one,” says NickBontis of the National Centre for Management Research andDevelopment in Canada.
The debate on valuing intangible assets goes back many years. Itwas highlighted in early 1988 when food group Nestlé bid for confec-
Appendix: Development and Measurement of Intellectual Capital 293
tionery company Rowntree, offering twice its pre-bid market capitaliza-tion to reflect the value of the brands that it was purchasing. Later thatyear Grand Metropolitan announced that it had decided to capitalize thebrands it had purchased since 1986. All of this led to an accounting stan-dard in 1990 that purchased “goodwill” should be capitalized and depre-ciated systematically, normally over 20 years. There are two main issueshere: this figure can be enormous (IBM paid seven times the book valueof Lotus); and the policy of depreciating intangibles is often contrary tothe reality of what actually happens in terms of market valuation.
Partly as a result of these dilemmas, 11 major companies sponsoreda significant study by Arthur Andersen in 1992 into the valuation ofintangibles. This comprehensive report considered several different valu-ation methodologies, and focused particularly on brands, publishingrights, intellectual property, and licenses.
Professional accountancy bodies have not been idle, albeit theirdeliberations move slowly. Standard 38 of the International AccountingStandards Committee was the result of more than 10 years’ struggle toaccount for the measurement and amortization of intangible assets andpurchased goodwill.
According to this standard, an intangible asset is defined as “anidentifiable non-monetary asset without substance held for use in theproduction or supply of goods and services, for rental to others, or foradministrative purposes.” The fair value of an asset is the amount forwhich that asset could be exchanged between knowledgeable willing par-ties in an arm’s-length transaction.
IAS 38 was published in 1998 to be applied from 1 July 1999. Theareas covered are advertising, training, startup, and R&D.
The “asset” has to be identifiable and controlled; its cost has to bemeasured reliably, and it has to be one that is expected to generate futureeconomic benefits to the organization. Otherwise it must be treated as anexpense. The standard prohibits internally generated goodwill, brands,publishing titles, customer lists, and similar items. The standard insiststhat the asset should normally be amortized over the best estimate of theuseful life, with a maximum of 20 years.
Anthony Carey, UK staff adviser to the Accounting StandardsCommittee, recognized in the Financial Times that “many enterprises’
294 The Human Value of the Enterprise
most valuable assets, their people and the corporate culture, will rarelyqualify for inclusion on the balance sheet yet will have a far greater influ-ence on results than many that are recorded.”
A comprehensive report was commissioned by the Dutch Ministryof Economic Affairs called Balancing Accounts with Knowledge, pre-sented in 1999. In it four consultancies—PricewaterhouseCoopers,KPMG, Ernst and Young, and Walgemoed—studied several companiesand drew conclusions regarding the valuation of intangible assets. Onlythe last one tackled human resources, mentioned in Chapter 4.
Valuing Intangible Liabilities
There are many examples of firms who have gone bankrupt or been sub-ject to other ignominious deaths due to their failure to recognize or dealwith intangible liabilities. It is possible to have a negative intangible val-uation where the tangible exceeds the market valuation. The Finnishchemicals and energy company Fortum, in late 1999, was showing sucha negativity. It was formed of two state enterprises, Neste and Ivo, both ofwhich had undoubted intellectual assets, and yet the market valuationdid not reflect them positively at all. What the market was showing wasa lack of confidence in their ability to compete in a privatized world andto survive internationally.
Just as we saw the difficulties of valuing assets in absolute mone-tary terms, so we may expect the same problem with liabilities. However,sometimes it is easier to evaluate what we do not want, rather than whatwe have. Many “liabilities” actually cost money and this can becalculated.
Harvey and Lusch of the University of Oklahoma attempted to cat-egorize such liabilities and argued rightly that any statement of intangi-ble assets on a balance sheet must be derived from offsetting thenegatives. They distinguish between internal and external factors, andwithin these have four categories for balancing:
❏ Process issues—systems and methodologies❏ Human issues—people and organization; externally they include
customer behaviors
Appendix: Development and Measurement of Intellectual Capital 295
❏ Informational issues—internally this is about knowledge; exter-nally about brand and reputation
❏ Configuration issues—organizational structure, locations, distribu-tion channels.
Theoretically, every liability should be valued at the present value of theservices of assets that must be given up to settle the obligation. However,this will be a very difficult task in most cases.
SUMMARY
Which of the methodologies described above are in regular use? BaruchLev commented in 2000 that his ideas had not generally been taken up,except by one or two Indian companies (Infosys, for example). The IC-Index is being applied through the Roos Brothers in their consultancywork. Celemi is the most consistent user of the Intellectual CapitalMonitor, although other firms in Scandinavia have developed their ownapproaches along similar lines. Although not featured in this Appendix,we must note that the Balanced Scorecard in practice provides significantfocus on intellectual capital, and this has been the most popular approachof all.
Until the regulatory bodies exert some muscle, it is unlikely thatmany organizations outside the open cultures of Scandinavia will volun-tarily disclose data on intellectual capital. There is no doubt that method-ologies for measuring many aspects of intellectual capital will becomestandardized in the next 10 years. Meanwhile, we would recommend acombination of a market-based overview model, which highlights themonetary value of intellectual capital as a whole, combined with a score-card approach that tracks a set of indicators driving the organization’sperformance in adding value. Of the scorecard approaches, we believethat those derived from the intellectual capital approach represent bestthe knowledge era that is replacing the industrial business model.
The Human Capital Monitor is a comprehensive way forward, andthe only one that links the intrinsic worth of people with the value thatthey produce.
296 The Human Value of the Enterprise
References
Ansoff, HI (1986) Corporate Strategy, McGraw-Hill, New York.
Arthur Andersen (1992) The Valuation of Intangible Assets, Special Report no P254,
January.
Bartram, P (1998) “Are you being read?,” Director, November.
Bassi, L (1999) “Measuring corporate investment in human capital,” in M Blair & T
Kochan (eds), The New Relationship, Brookings Institution.
Becker, BE, Huselid, MA, & Ulrich, D (2001) The HR Scorecard: Linking People, Strategy,
and Performance, Harvard Business School Press, Boston.
Bedingham, K (1999) “The measurement of organisational culture,” Journal of Human
Resource Management, January.
Bontis, N (1998) “Intellectual capital: An exploratory study that develops measures and
models,” Management Decision, 36(2): 63–76.
Brand, A, VanderMerwe, A, & Boshoff, A (1974) “The measurement of investment in
human resources,” Personnel Review, 3(2, Spring).
Brooking, A (1996) Intellectual Capital, Thomson Business Press, London.
Brouthers, KD, van Hastenburg, P, & van den Ven, J (1998) “If most mergers fail, why are
they so popular?,” Long Range Planning, 31(3): 347–53.
Brown, T (1996) “Value migration: The key to tomorrow?,” Management Review, March.
Buckingham, M & Coffman, C (1999) First Break All the Rules, Simon and Schuster, New
York.
Bühner, R (1997) “Increasing shareholder value through human asset management,” Long
Range Planning, 30(October).
Bukowitz, WR & Petrash, GP (1997) “Visualising, Measuring and Managing Knowledge,”
Research and Technology Management, July/August.
Bukowitz, WR & Williams, RL (1997) “New metrics for hidden assets,” Journal of
Strategic Measurement (Arthur Andersen), February/March.
Capron, L (1999) “Horizontal acquisitions: The benefits and risks to long term perfor-
mance, Financial Times, “Mastering Strategy,” Part 7, November.
Carey, A (1997) “The real value of hidden assets,” Financial Times, 6 November.
Case, J (1998) The Open Book Management Experience, Nicholas Brealey Publishing,
London.
Chambers, E (1998) “Winning the war for talent,” McKinsey Quarterly, 3.
Cohen, DJ & Prusak, L (2001) In Good Company: How Social Capital Makes Organizations
Work, Harvard Business School Press, Boston.
Cooper, C (2000) “In for the count,” People Management, 12 October: 28–34.
Cope, M (2000) Know Your Value?, Financial Times/Prentice Hall, London.
Cunningham, I (1993) The Wisdom of Strategic Learning, McGraw-Hill Maidenhead.
Danish Ministry of Finance (2000) Knowledge Management and Intellectual Capital:
Statement within the State.
Davenport, TO (1999) Human Capital, Jossey Bass, San Francisco.
De Bono, E (1971) Lateral Thinking for Management, McGraw-Hill, Maidenhead.
DiFrancesco, JM & Berman, SJ (2000) “Human productivity: The new American frontier,”
National Productivity Review, Summer.
Dixon, N (2000) Common Knowledge: How Companies Thrive by Sharing What They Know,
Harvard Business School Press, Boston.
Dobson, P (1996) “The dark side of competence: Building cultures in the air,” Journal of
Professional HRM, April: 3–9.
Drucker, P (1992) Managing for the Future, Butterworth Heinemann, Oxford.
Dunn, A (1995) “The poverty of accountancy,” Transformation (Gemini Consulting),
Winter.
Eccles, RG, Herz, R, Keegan, EM & Phillips, DMH (2001) The Value Reporting Revolution,
John Wiley, New York.
Economist (1997) “Valuing companies,” Economist, 2 August: 61–3.
Economist (1999) “How to merge,” Economist, 9 January: 15–23.
Economist (1999) “A price on the priceless, Economist, 12 June: 94–8.
Edvinsson, L (1997) “Developing intellectual capital at Skandia,” Long Range Planning,
30(June): 366–73.
Edvinsson, L & Malone, MS (1997) Intellectual Capital, Piatkus, London.
Edvinsson, L & Øberg, D (2001) “The IC Multiplier and the importance of structural cap-
ital,” paper presented at the 4th Intangibles Conference on Measurement of Intellectual
Capital, New York, May, available at www.intellectualcapital.se.
Epstein, M & Manzoni, J-F (1998) “Implementing corporate strategy: From tableaux de
bord to balanced scorecards,” European Management Journal, 16(2, April).
Fitz-Enz, J (1995) How to Measure Human Resource Management, 2nd edn, McGraw-Hill,
New York.
Fitz-Enz, J (2000) The ROI of Human Capital, Amacom, New York.
Flamholz, EG (1999) Human Resource Accounting: Advances in Concepts, Methods and
Applications, 3rd edn, Kluwer, Amsterdam.
Friedman, B, Hatch, J, & Walker, D (1998) Delivering on the Promise: How to Attract,
Manage and Retain Human Capital, Free Press, New York.
Giles, WJ & Robinson, DF (1972) Human Asset Accounting, IPM/ICMA, London.
Goffee, R & Jones, G (1999) The Character of the Corporation, HarperCollins, London.
Goffee, R & Jones, G (2000) “Why should anyone be led by you?,” Harvard Business
Review, September–October.
Goold, M, Campbell, A, & Alexander, M (1993) Corporate Level Strategy: Creating Value
in Multibusiness Companies, John Wiley, Chichester.
Gratton, L (2000) Living Strategy, FT-Prentice Hall, London.
298 The Human Value of the Enterprise
Hamel, G & Prahalad, CK (1994) Competing for the Future, Harvard Business School
Press, Cambridge, MA.
Hammer, M & Champy, J (1993) Reengineering the Corporation: A Manifesto for Business
Revolution, Nicholas Brealey Publishing, London.
Harman, C & Brelade, S (2000) Knowledge Management and the Role of HR, FT Prentice
Hall, London.
Haspeslagh, PC & Jemison, DB (1991) Managing Acquisitions: Creating Value Through
Corporate Renewal, Free Press, New York.
Her Majesty’s Stationery Office (1977) The Future of Company Reports, HMSO,
London.
Heskett, JL, Sasser, WE, Jr, & Schlesinger, LA (1997) The Service Profit Chain, Free Press,
New York.
Honey, P & Mumford, A (1995) Using Your Learning Styles, 3rd edn, Peter Honey
Publications, Maidenhead.
Hope, J & Hope, T (1995) Transforming the Bottom Line, Nicholas Brealey Publishing,
London.
Huselid, M (1995) “The impact of human resource management practices on turnover,
productivity and corporate financial performance,” Academy of Management Journal,
38: 635–72.
Huselid, M, Becker, B, & Ulrich, D (2001) The HR Scorecard: Linking People, Strategy, and
Performance, Harvard Business School Press, Boston, MA.
Institute of Personnel and Development (1997) The Impact of People Management Practices
on Business Performance, IPD Research Report, London.
Jackson, T (1997) “Winning minds not hearts,” Financial Times, 27 October.
Jackson, T (1998) “The art of taking the unknown into account,” Financial Times, 3
December.
Johnson, HT & Bröms, A (2000) Profit Beyond Measure, Free Press, New York.
Johnson, HT & Kaplan, RS (1987) Relevance Lost: The Rise and Fall of Management
Accounting, Harvard Business School Press, Boston.
Kaplan, RS & Norton, DP (1996) The Balanced Scorecard, Harvard Business School Press,
Boston.
Kaplan, RS & Norton, DP (2000) The Strategy-Focused Organization, Harvard Business
School Press, Boston.
Katzenbach, J & Smith, D (1993) The Wisdom of Teams, Harvard Business School Press,
Boston.
Kearns, P (1995) Measuring Human Resources and the Impact on Bottom Line Improvements,
Technical Communications, Hitchin.
Kennedy, A (2000) The End of Shareholder Value, Orion, London.
Lank, E (1997) “Leveraging invisible assets: The human factor,” Long Range Planning,
June: 406–12.
Lester, T (1996) “Accounting for knowledge assets,” Financial Times, 20 February.
Lester, T (1996) “Measuring human capital,” Human Resources, May/June.
References 299
Lev, B (2000) “Intangibles, management, measurement and reporting,” Stern School of
Business, December.
Lev, B & Schwartz, A (1971) “On the use of the economic concept of human capital in
financial statements,” The Accounting Review, January.
Likert, RM & Bowers, DG (1973) “Improving the accuracy of P&L reports by estimating
the changes in dollar value of the human organization,” Michigan Business Review,
25(3): 15–24.
Markides, C & Oyon, D (1998) “International acquisitions: Do they create value for
shareholders?,” European Management Journal, 16(2, April).
Mathur, S & Kenyon, A (1997) Creating Value, Butterworth Heinemann, Oxford.
Mayo, AJ & Hadaway, AJ (1994) “Cultural adaptation from an Anglo-Nordic merger,”
Journal of Management Development, 13(2, June).
Mayo, AJ & Lank, E (1994) The Power of Learning, Institute of Personnel and
Development, London.
McGregor, D (1960) The Human Side of Enterprise, McGraw-Hill, New York.
Ministry of Economic Affairs in cooperation with Bak, GGM (1999) Balancing Accounts
with Knowledge, The Hague, October, available from www.minez.nl.
Monnery, N & Malchione, R (2000) “Seven deadly sins of mergers,” Financial Times, 2
March.
Monti-Belkaoui, J & Riahi-Belkaoui, M (1995) Human Resource Valuation: A Guide to
Strategies and Techniques, Quorum Books, Westport, CT.
Mooraj, S, Oyon, D, & Hostettler, D (1999) “The balanced scorecard: A necessary good
or an unnecessary evil?,” European Management Journal, 17(5, October).
Nahapiet, J & Ghoshal, S (1999) “Social capital, intellectual capital, and the organiza-
tional advantage,” Academy of Management Review, 23(3): 242–66.
Olve, N-G, Roy, J, & Wetter, M (1997) Performance Drivers: A Practical Guide to Using the
Balanced Scorecard, John Wiley, Chichester.
Patterson, F (2000) “Maximising innovation in the workplace,” Training Journal,
August.
Peters, T (1987) Thriving on Chaos, Macmillan, New York.
Peters, T (1992) Liberation Management, Knopf, New York.
Pfeffer, J (1997) “Pitfalls on the road to measurement: The dangerous liaison of human
resources with the ideas of accounting and finance,” Human Resource Management,
36(Fall): 357–65.
Pfeffer, J (1998) The Human Equation, Harvard Business School Press, Boston.
Porras, JI & Collins, JC (1994) Built to Last, Harper Business, New York.
Pulic, A (1998) “Measuring the performance of intellectual potential in the knowledge
economy,” paper from the Austrian Intellectual Capital Research Centre.
Quinn, JB, Anderson, P, & Finkelstein, S (1996) “Making the most of the best,” Harvard
Business Review, March–April.
Rajan, A, Lank, E, & Chapple, K (1999) Good Practices in Knowledge Creation and
Exchange, CREATE, Tunbridge Wells.
300 The Human Value of the Enterprise

Roos, J (1998) “Exploring the concept of intellectual capital,” Long Range Planning, 31(1):
150–3.
Roos, J & Roos, G (1997) “Intellectual capital: The next generation,” Financial Times,
“Mastering Management,” May.
Roos, J & Roos, G (1997) “Measuring your company’s intellectual performance,” Long
Range Planning, June.
Roos, J, Roos, G, Edvinsson, L, & Dragonetti, NC (1997) Intellectual Capital, Macmillan,
Basingstoke.
Roy, S (1999) “Managing intellectual capital: The work with the Navigator in the Skandia
Group,” Journal of Human Resource Costing and Accounting, 4(1, Spring).
Sadler, P (1993) Managing Talent, Economist Books, London.
Schuller, T (1996) “Social and human capital: Twins, siblings or rivals?,” paper submitted
as part of ESRC/EU Conference on Lifelong Learning, Newcastle, November.
Senge, P (1990) The Fifth Discipline, Doubleday, New York.
Steffy, B & Maurer, S (1988) “Conceptualizing and measuring the economic effectiveness
of human resource activities,” Academy of Management Review, April: 271–86.
Stewart, T (1997) Intellectual Capital, Nicholas Brealey Publishing, London.
Strassmann, P (1996) “The value of computers, information and knowledge,” January,
www.strassmann.com.
Sullivan, P (2000) Value Driven Intellectual Capital, John Wiley, New York.
Sveiby, KE (1997) The New Organizational Wealth, Berrett-Koehler, San Francisco.
Thatcher, M (1998) “All about EVA,” People Management, October.
Thomson, K (1998) Emotional Capital, Capstone, Oxford.
Ulrich, D (1997) Human Resource Champions, Harvard Business School Press, Boston.
Ulrich, D (1997) “Measuring human resources: An overview of practice and a prescrip-
tion for results,” Human Resources Management, 36(3, Fall): 303–20.
Whiteley, P (2001) “Is an employee an asset or a liability?,” Times, 8 February.
Williams, M (2000) The War for Talent, Chartered Institute of Personnel and
Development, London.
Wilson, B (1979) “Creating and sharing wealth,” Employee Relations, 1(1 & 2).
Yeung, AK & Berman, B (1997) “Adding value through human resources: Reorientating
resource measurement to drive business performance,” Human Resource Management,
36(3, Fall): 321–35.
Websites
www.cam-i.org/bb Beyond Budgeting Round Table, a consortium
dedicated to an alternative to budgeting
www.celemi.se Celemi AB
www.cpri.matrixlinks.ca Canadian Institute of Chartered Accountants
Performance and Reporting Initiative
www.efqm.org European Foundation for Quality Management
www.fm.dk Danish Ministry of Finance (for publications)
References 301
www.iasb.org.uk International Accounting Standards Board
www.intellectualcapital.se For details of the IC Multiplier
www.lewisham.gov.uk Lewisham Council
www.mliltd.com Mayo Learning International, the author’s site
www.measuring-ip.at Austrian Intellectual Capital Research Center
www.quality.nist.gov Baldrige National Quality Program
www.skandia.se Skandia Assurance
www.strassmann.com Paul Strassmann
www.sveiby.com.au The very informative website of Karl Erik Sveiby
www.systematic.dk Systematic A/S
www.tomorrowscompany.com Centre for Tomorrow’s Company
www.unic.net Universal Networking Intellectual Capital, the site
of Leif Edvinsson
www.watsonwyatt.com For the Human Capital Index
302 The Human Value of the Enterprise
Index
360° feedback 49, 66, 95, 107, 162, 1823M 30, 181, 192, 232
absenteeism 151, 156, 160, 163, 228accountancy 21–2, 29, 37, 41, 64, 136, 172,
211, 221Accounting Standards Board 22, 278, 294activity based management 224amazon.com 266Anglian Water 206appraisal of performance 89, 105–6Armistead, Colin 204Armstrong, Geoff 26Arthur Andersen 36, 52, 55, 56, 279, 294Arthur D Little 223assessment centers 44, 108asset value 19, 71, 75, 76, 78, 81, 84, 97, 183,
260assets
intangible 2, 8, 9, 19, 28–30, 40–41, 62,272, 282–3, 293–5people as 2, 3, 71–86tangible 28–32
AT&T Network Systems 288attitudes 77, 90, 104, 286attrition 10, 45, 53, 125, 128, 137, 151, 156
reasons for leaving 124–5automation 224Ayling, Robert 73
B&Q 156BAE Systems 206balance sheet 12, 19, 28, 29, 77, 136, 268, 270,
295balanced scorecard 10, 58–60, 64, 283Barchan, Margareta 272BAT 136, 137behaviors see personal behaviorsBelbin, Meredith 166benchmarking 15, 42, 45, 124, 154, 156, 177,
198benefits 182Benjamin, Alan 292
“Best Value Initiative” 230Beyond Budgeting Round Table 23Birkenhead, Brian 268Bontis, Nick 293Boston Consulting Group 258, 239Bowman, Archibold 1BP 30, 200, 270brands 19, 22, 29, 31, 123–4, 294British Airways 164, 173British Telecom 203, 206Brooking, Annie 33, 285Buckingham, Marcus 157, 158, 174
Cable and Wireless 170Cadbury 3Calculated Intangible Value 287Canadian Institute of Chartered Accountants
136, 279, 280Cap Gemini Ernst & Young 21capability 13, 59, 80, 88–110, 177capital
customer 31, 32, 273emotional 33, 285human 2, 5, 19, 31–7, 251, 285–7intellectual 28–33, 209–13, 277–80, 282–96knowledge 35–7, 201, 285, 293physical and financial 28–32relationship 34–5 285structural 31–2, 62, 273, 285, 290
Capron, Laurence 242, 243, 246career building blocks 172career management 145, 169–71Carey, Anthony 294cause-and-effect staircases 15–16, 65–7, 116,
146, 231Celemi AB 62, 135, 272, 277, 283, 293, 296Centre for Tomorrow's Company 277, 292Centrefile 206Champy, James 26Chartered Institute of Personnel and
Development 26, 48Chrysler 24, 242
CityGroup 241climate 158–61Coffman, Curt 157–8Collins, James C 27, 142commitment of employees 13, 48, 126,
150–61, 269competence-enhancing customers 135contingent employees 85continuity management 80, 142–8contribution, employee 13, 81, 215–37Corporate Leadership Council 48, 56corporate universities 206creativity 193–4CSC Index 239cultural measurement 184–7, 204cultural polarization 256culture 158–60, 131, 202, 252, 256, 263Cunningham, Ian 167customer capital 31, 32, 273customer satisfaction 153Cypress Consulting 157
Daimler 242Danish Ministry of Finance 279Davenport, Thomas 124, 151, 157, 183, 285,
286Dell 206Directorate of Intellectual Capital 208–13Dobson, Paul 90Dow Chemical 9, 33, 268, 284Dragonetti, NC 285Drucker, Peter 191, 222due diligence 257Dunn, Alan 21Dutch Ministry of Economic Affairs 295
Economic Value Added (EVA) 54, 180, 288educational levels 98, 285Edvinsson, Leif 28, 60, 163, 270, 282, 285,
289, 290Eli Lilly 181emotional capital 33, 285employee satisfaction 45, 52, 129, 153, 155,
270, 275employer brand 119, 123, 124, 273empowerment 60, 140, 151
index 163environment, work 12, 164–5Ericsson 284Ernst & Young 206, 295European Business Excellence Model 50, 274experience 99–102, 197
building blocks 171–2
ExxonMobil 146, 179, 246
Finegold, David 130Fit-Cost-Value™ 52, 53Fitz-Enz, Jac 53–6, 136, 138, 285Flamholz, Eric 73, 76Fujitsu 57, 261future-oriented resources 193
Gates, Bill 28, 268General Motors 203Giles, WJ 77Glaxo 248grading 175–6, 182Grand Metropolitan 294Gratton, Lynda 48growth of human assets 88, 133–47, 157growth, personal 107, 145, 152, 171Guest, David 3
Hamel, Gary 221Hammer, Michael 26Haspeslagh, Philippe 244, 259headcount 43, 127–8Herzberg, Frederick 152Heskett, Sasser, & Schlesinger 128Hewlett-Packard 198, 223–4Honey, Peter 168Hope, Jeremy and Tony 22, 221, 223–4HR management 207–8HR practices and the bottom line 3, 47–51HR professionals 10, 41, 53, 240HR Scorecard 10, 61–2human asset accounting 47, 73–8Human Asset Multiplier 77Human Asset Register 121, 122, 139, 208, 257Human Asset Worth (HAW) 12, 65, 78–85,
119, 122, 128–9, 139, 144, 175, 263–4human assets
acquisition 122–6growth 88, 133–7 retention 84, 91, 120–1, 126–3, 201
human capital 2, 5, 19, 31–7, 251balance sheet 12, 136budgeting and planning 146–7categorizing 118–21, 285–6maximizing 118–49monitoring movements 138–9, 143–5profit and loss account 14, 137–8replacing 120–1reviews 143–4
Human Capital Appraisal™ 52Human Capital Index (HCI) 49
304 The Human Value of the Enterprise
human capital investment 151Human Capital Monitor 11–16, 64–9, 90, 111,
119, 151, 204, 216, 226–30, 233, 296Human capital potential value 219Human capital wheel 51Human contribution management 56human resources accounting see human asset
accountingHunt, John 130Huselid, Mark 48
IBM 33, 142, 241IC Index 283, 290–2IC Multiplier 290IC Rating™ 290ICL 57, 132, 142, 178, 203IDEO 192Individual Asset Multiplier (IAM) 12, 79–82,
122, 133, 177Information productivity index 288Infosys 75innovation 189–95, 198, 231–3, 255, 275
measures 194, 195, 231–2Intangible Assets Monitor 62–4, 272, 293intangible assets 2, 8, 9, 19, 28–30, 40–1, 62,
272, 282–3, 293–5intangible liabilities 19, 45–7, 277, 295intellectual capital 28–33, 209–13, 277–80,
282–96intellectual property 285International Accounting Standard Co 294International Survey Research (ISR) 155International Accounting Standard 41, 294investment in training 134IPC 131
J P Morgan 239job evaluation 175–7job families 91–2, 95Johnson & Johnson 3
Kaplan, Robert 10, 58–60Kearns, Paul 56Kennedy, Alan 27know-how 89, 90, 95–7knowledge
bank 292capital 35–7, 201, 285, 293explicit 36, 204, 261management 36, 198–207, 253, 276, 285sharing 36–7, 198–202tacit 36–7, 199valuing 292–3
know-who 89, 90, 102–4KPMG 8, 239, 285
Lackie, Gordon 37Lank, Elizabeth 196, 199, 202leadership 160–4learning
cycle 168–9environment 135–6, 195–8four modes of 196individual 167–74measures of 174organization 191, 195–8organizational 198–207
Learning Organization Index 196Lev, Baruch 75, 293, 296leverage effect 63Lewisham Council 230Lightlab 273Lufthansa 159, 206Lutz, Bob 24
Management Value Added (MVA) 288managers' role in development 173Marks & Spencer 34, 103McCann Margerison 166McGregor, Douglas 1, 152McKinsey 36, 132, 201measurement 9–12, 40–68measures
cultural 184–7, 204innovation 194, 195, 231–2learning 174levels of 14, 54–6, 65
Merck 122, 293merger integration 258–63mergers and acquisitions 125, 199, 238–64Microsoft 28, 268mobilizing collective intelligence 37morale 26, 154motivation 12–13, 60, 65–7, 150–88Motorola 154, 206Mumford, Alan 168Myers Briggs Type Indicator 130
National Semiconductor 201NatWest Bank 246NatWest Markets 199Nestlé 224, 293networks 102–4, 261Nokia 269Norton, David 10, 58–60
Index 305
opinion surveys 15, 50, 66, 67, 128, 151, 154,155, 174, 184, 195, 228, 275, 278, 288
organization design 208–14, 225, 253organizational culture inventory 185organizational intellectual capital 289
Pacioli 19pay
base 79, 176–9benefits 182variable 180–2
people management 208, 214People Value Added (PVA) 288performance 7, 58–9, 81, 105–8, 178–9, 212,
253performance drivers 8personal behaviors 90–5, 107personal capability profile 108, 133personal development plans 168–71Peters, Tom 36, 191Petrash, Gordon 9, 33, 284Pfeffer, Jeffrey 41, 48Pfizer 241–2Philips 96Platt, Lew 198Porras, J 27, 142Post Office Consulting 203potential 80, 111–16, 169
judgments 115–16language 112–15transparency 113–14
Prahalad, CK 221PriceWaterhouse Coopers 3, 23, 295Procter & Gamble 6, 34, 164productivity 45, 54–5, 220–1, 288professional qualifications 98, 110profit and loss account 77, 136–8Purcell, John 3
recognition 183relationship capital 34–5, 285replacement
cost of people 74, 75difficulty 119–21ratio 46
reporting intellectual capital 8–9, 247, 266–79restructuring 34, 104, 140–2, 182, 225return on investment 55, 56–8rewards 174–84Robinson, DF 77role profiling 140–1Rolls-Royce 124
Roos, Göran and Johan 283, 285, 291Saratoga Institute 53–5, 156Schein, Ed 170self-assessment 51, 107, 116, 168, 280Senge, Peter 195service profit chain 128, 153shareholder value 3, 4, 26–8, 49, 239Siemens 134Skandia 28, 32, 60–1, 75, 163, 218–19, 270,
282–3, 289Smith, Chris 170SmithKline Beecham 248social capital 33, 285Southwest Airlines 159St Onge, Hubert 35, 284, 285stability index 128–9, 163–4stakeholders 3–4, 6, 81, 85, 225–31Stewart, Thomas 28, 284, 285Strassmann, Paul 224, 288structural capital 31, 62, 273, 285, 290succession planning 142–3suggestions 154, 160Sullivan, Patrick 284Sun Microsystems 170surveys, employee satisfaction 15, 50, 66, 67,
128, 151, 154, 155, 174, 184, 195, 228, 275,278, 288
Sveiby, Karl Erik 28, 36, 62–4, 272, 283, 285,286, 293
Swinson, Chris 278synergy 240–4, 250, 259–60Systematic A/S 273–6
talent, managing 72, 143–5tangible assets 28–32Theories X and Y 1, 152Thomas, Kevin 33Thompson, Dennis 285Tobin's q 287transferability of skills 110, 169tribes in organizations 261
Ulrich, Dave 10, 41, 61, 207Unisys 113, 170Universum 124US Postal Service 180value 18–37, 110, 215–36, 238value added intellectual coefficient 289value added work 221–5, 234–6value added work index 221–3value added
financial 5, 6, 54–5, 215–20
306 The Human Value of the Enterprise

nonfinancial 5, 6, 225–31to community 229to customers 31, 32, 273to employees 20–21, 51, 105, 218to government 229to public 229to suppliers 228
Value Based Management (VBM) 180, 288value capture 244value-creating organization 17, 24, 52, 84, 118,
121, 125–6, 131, 133, 143–47, 162, 169,175, 181, 183, 207, 211, 256, 280
value subtraction 19, 45–7values alignment 82–4, 119
Walgemoed 77, 295Wallman, Steven 268Watson Wyatt 3, 49–50Welch, Jack 2, 24William Mercer 3, 51WM-Data 273Wolrath, Björn 282work
challenging 228nonvalue-added 221–5qualifying 154value-added 221–5, 234–6
workgroup 165–6work interests schedule 130
Index 307
The author is grateful to the following for permission to reproducecopyright materials:
Figure 2.3 on page 30, © The Economist Newspaper Limited, London(June 6th 1998).
Figure 3.3 on page 50, ©EFQM. The EFQM Excellence Model is aregistered trademark.
Figure 3.4 on page 53, reprinted with the permission of The Free Press,a Division of Simon & Schuster, Inc., from DELIVERING ON THE
PROMISE: How to Attract, Manage and Retain Human Capital by BrianFriedman, James Hatch, David M. Walker. Copyright ©1998 by Arthur
Andersen LLP.
Figure 6.6 on page 138, reprinted from THE ROI OF HUMANCAPITAL. Copyright ©2000 Jac Fitz-Enz. Used with permission of thepublisher, AMACOM, a division of American Management Association
International, New York, NY. All rights reserved.http://www.amacombooks.org.