Embed Size (px)
Citation preview
The Face of the New EnterpriseMarket Overview and Proprietary Financial Intelligence
2
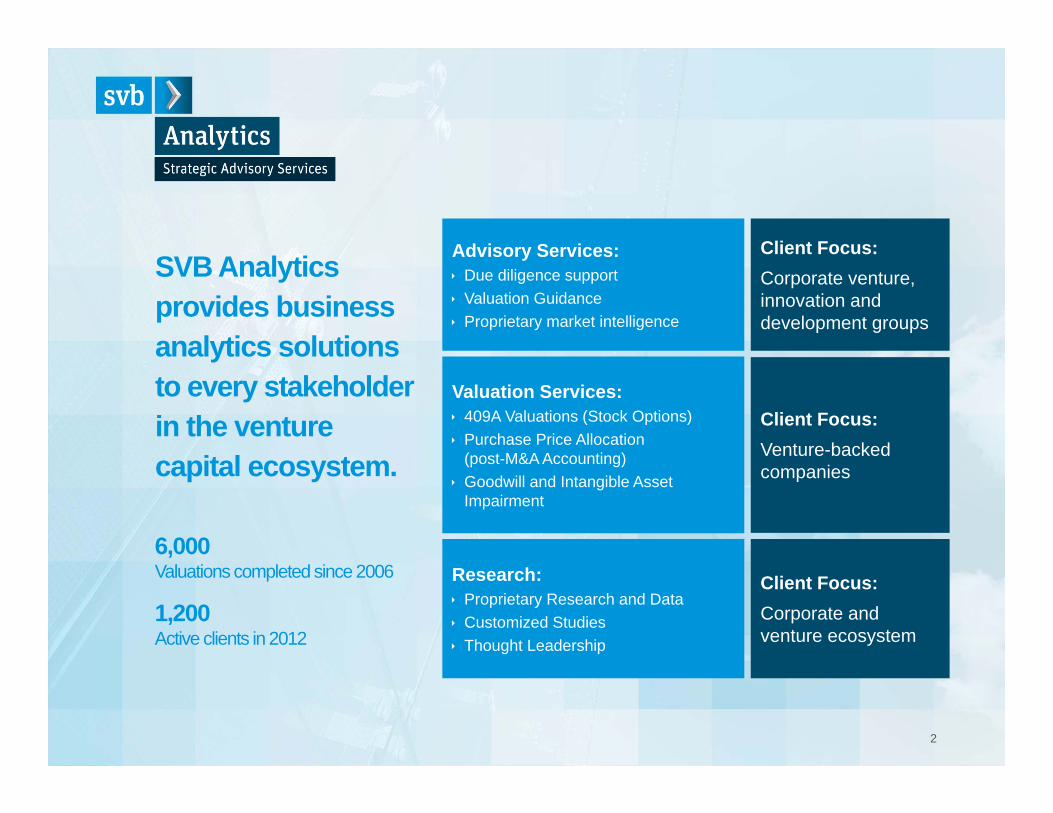
Advisory Services: Due diligence support Valuation Guidance Proprietary market intelligence
Valuation Services: 409A Valuations (Stock Options) Purchase Price Allocation
(post-M&A Accounting) Goodwill and Intangible Asset
Impairment
Research: Proprietary Research and Data Customized Studies Thought Leadership
Client Focus:Corporate venture, innovation and development groups
Client Focus:Venture-backedcompanies
Client Focus:Corporate and venture ecosystem
SVB Analytics provides business analytics solutions to every stakeholder in the venture capital ecosystem.
6,000 Valuations completed since 2006
1,200 Active clients in 2012
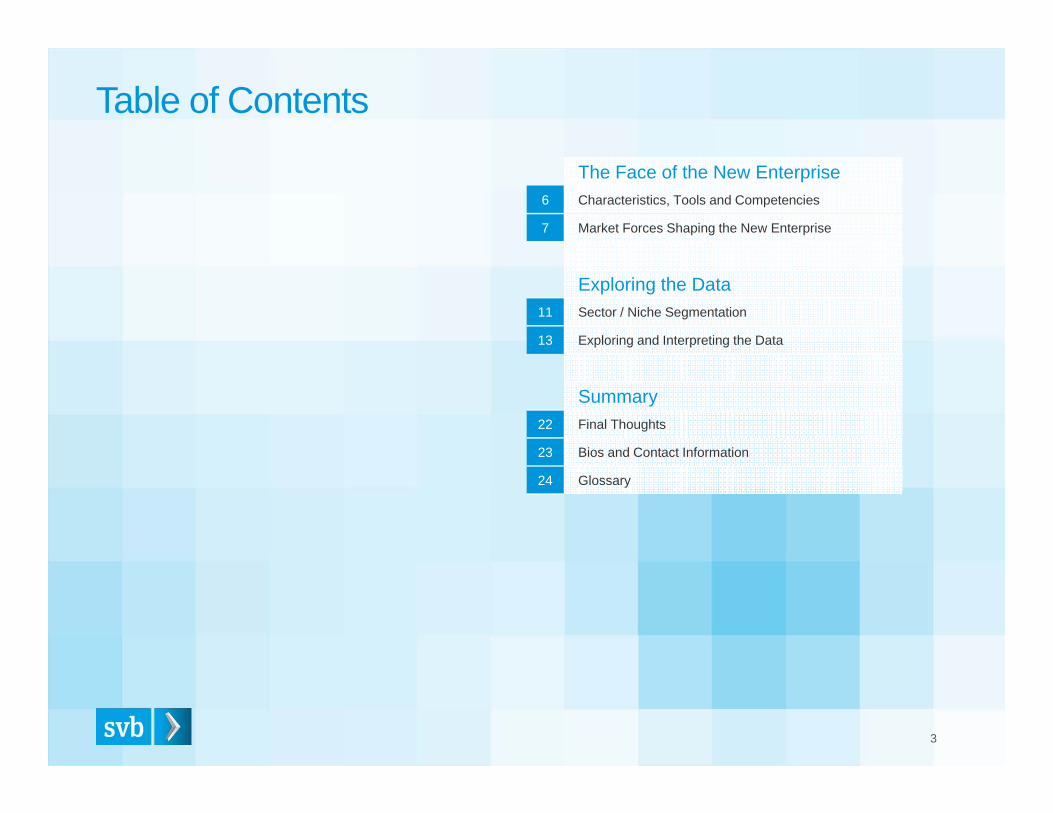
The Face of the New Enterprise6 Characteristics, Tools and Competencies
7 Market Forces Shaping the New Enterprise
Exploring the Data11 Sector / Niche Segmentation
13 Exploring and Interpreting the Data
Summary22 Final Thoughts
23 Bios and Contact Information
24 Glossary
Table of Contents
3
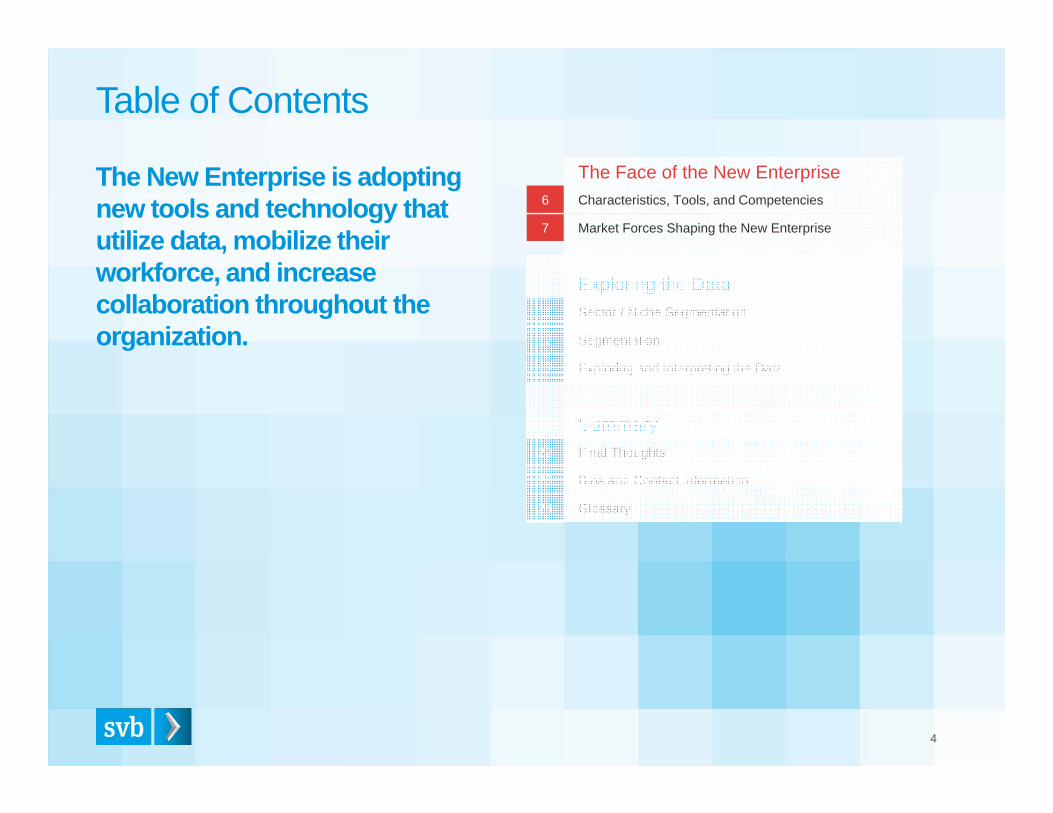
The Face of the New Enterprise6 Characteristics, Tools, and Competencies
7 Market Forces Shaping the New Enterprise
Exploring the Data11 Sector / Niche Segmentation
12 Segmentation
13 Exploring and Interpreting the Data
Summary22 Final Thoughts
23 Bios and Contact Information
24 Glossary
Table of Contents
4
The New Enterprise is adopting new tools and technology that utilize data, mobilize their workforce, and increase collaboration throughout the organization.
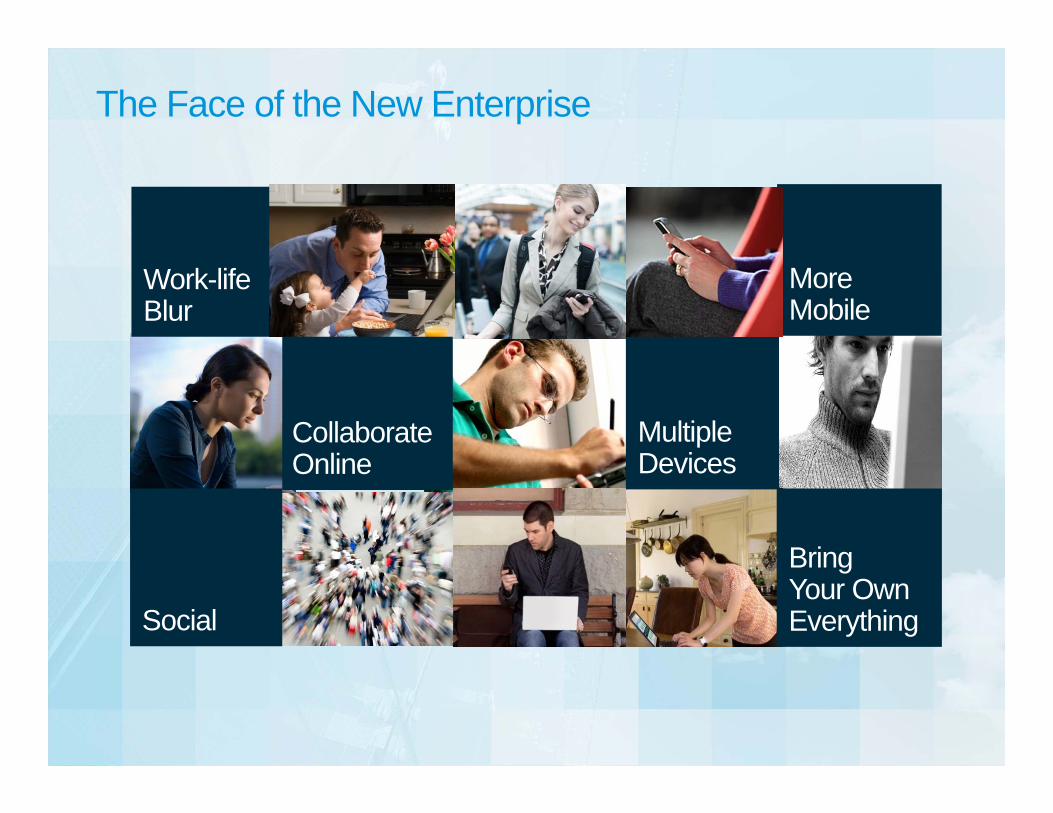
Bring Your Own Everything
Work-lifeBlur
Social
Collaborate Online
Multiple Devices
More Mobile
The Face of the New Enterprise
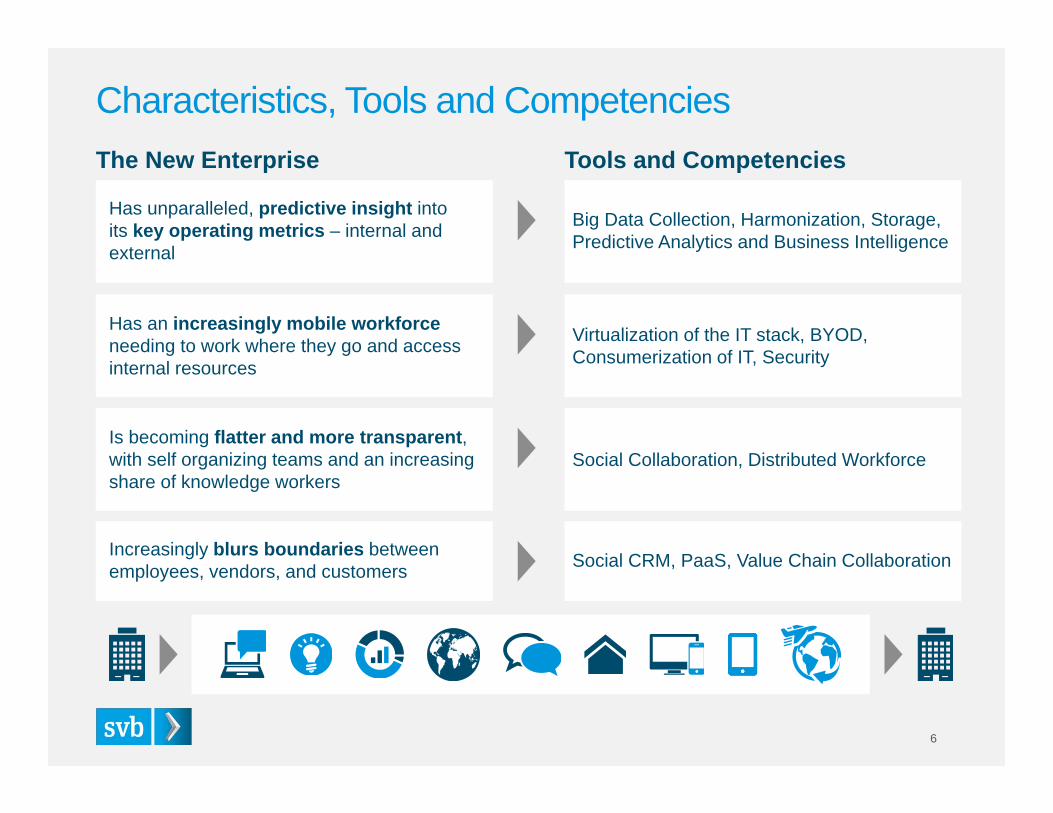
Characteristics, Tools and Competencies
6
Has unparalleled, predictive insight into its key operating metrics – internal and external
Big Data Collection, Harmonization, Storage, Predictive Analytics and Business Intelligence
The New Enterprise Tools and Competencies
Has an increasingly mobile workforce needing to work where they go and access internal resources
Virtualization of the IT stack, BYOD, Consumerization of IT, Security
Is becoming flatter and more transparent, with self organizing teams and an increasing share of knowledge workers
Social Collaboration, Distributed Workforce
Increasingly blurs boundaries between employees, vendors, and customers Social CRM, PaaS, Value Chain Collaboration
Missed opportunities to not only know why it happened, but predict what will happen
Significant early-stage investment happening in this space
Market Forces Shaping the New Enterprise
1 IBM Research 7
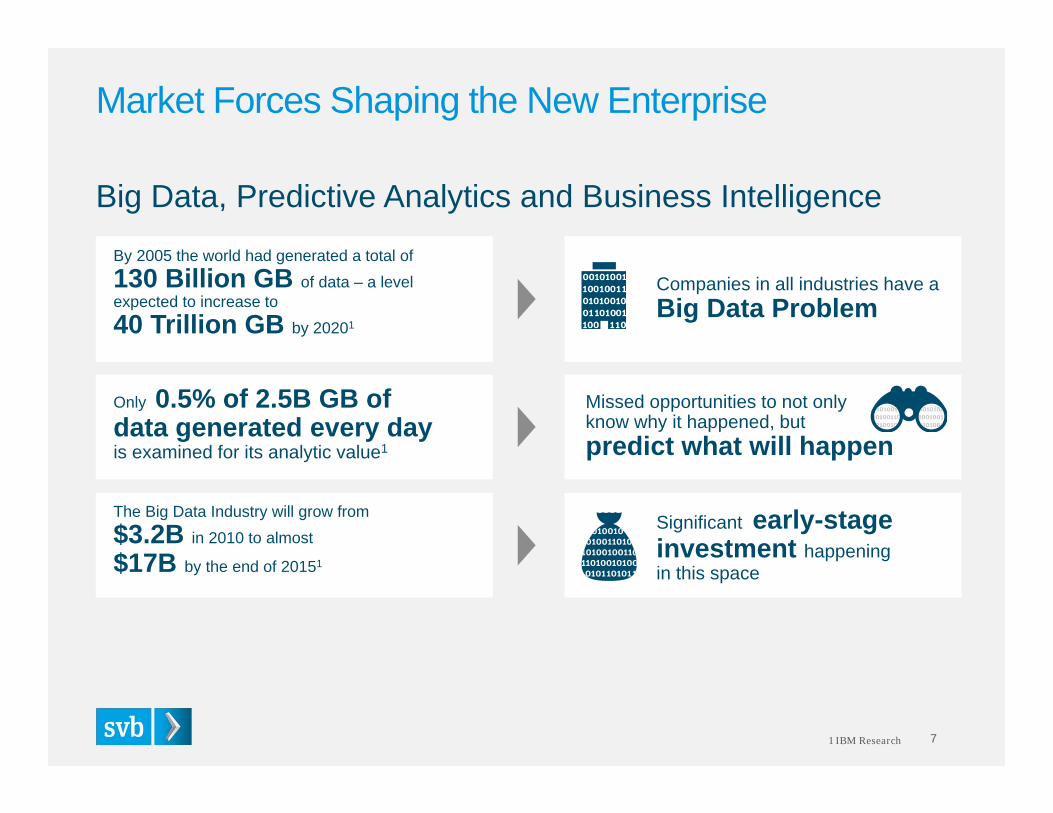
Big Data, Predictive Analytics and Business Intelligence
By 2005 the world had generated a total of130 Billion GB of data – a level expected to increase to40 Trillion GB by 20201
Companies in all industries have a Big Data Problem
The Big Data Industry will grow from$3.2B in 2010 to almost
$17B by the end of 20151
Only 0.5% of 2.5B GB of data generated every dayis examined for its analytic value1
Market Forces Shaping the New Enterprise
1 Strategy Analytics, 20132 iPass Mobile Workforce Report 2013
3 Regus/Mindmetre 2012 8
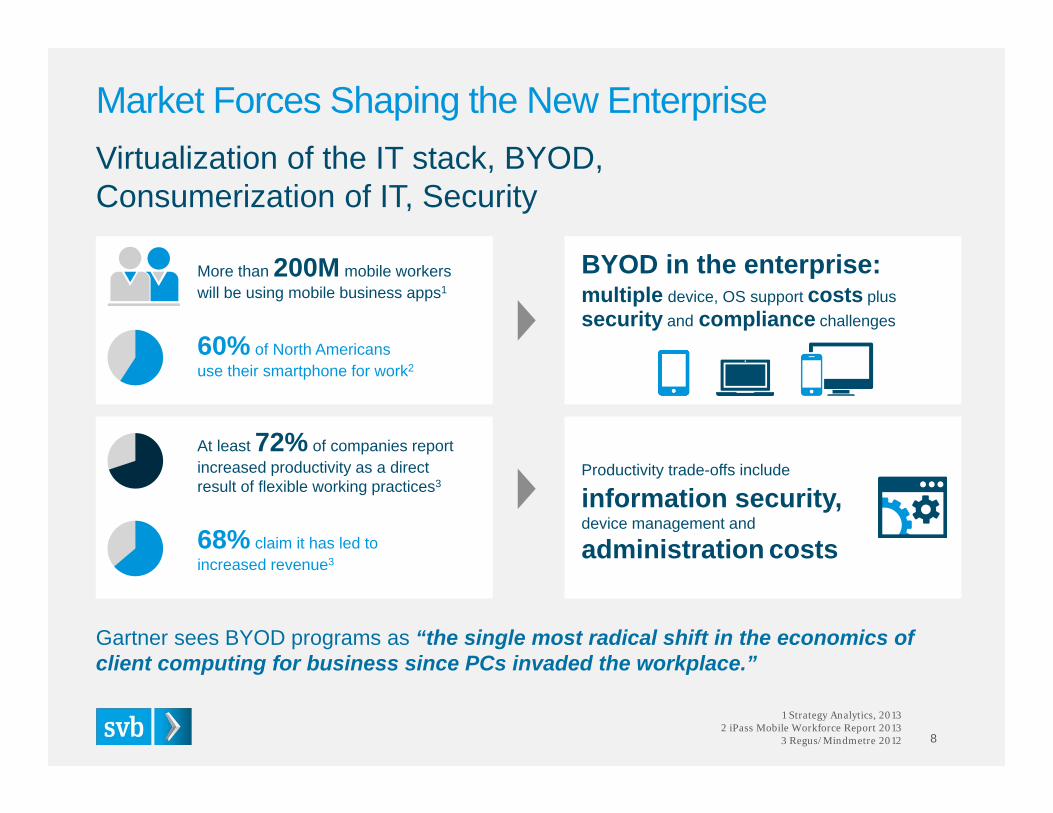
Gartner sees BYOD programs as “the single most radical shift in the economics of client computing for business since PCs invaded the workplace.”
Virtualization of the IT stack, BYOD, Consumerization of IT, Security
More than 200M mobile workers will be using mobile business apps1
BYOD in the enterprise:multiple device, OS support costs plussecurity and compliance challenges
60% of North Americansuse their smartphone for work2
At least 72% of companies report increased productivity as a direct result of flexible working practices3
Productivity trade-offs include
information security,device management and
administration costs68% claim it has led to increased revenue3
Market Forces Shaping the New Enterprise
1 MarketResearchReports.biz2 “Evolution of the Global Enterprise”, McKinsey Global Survey 9
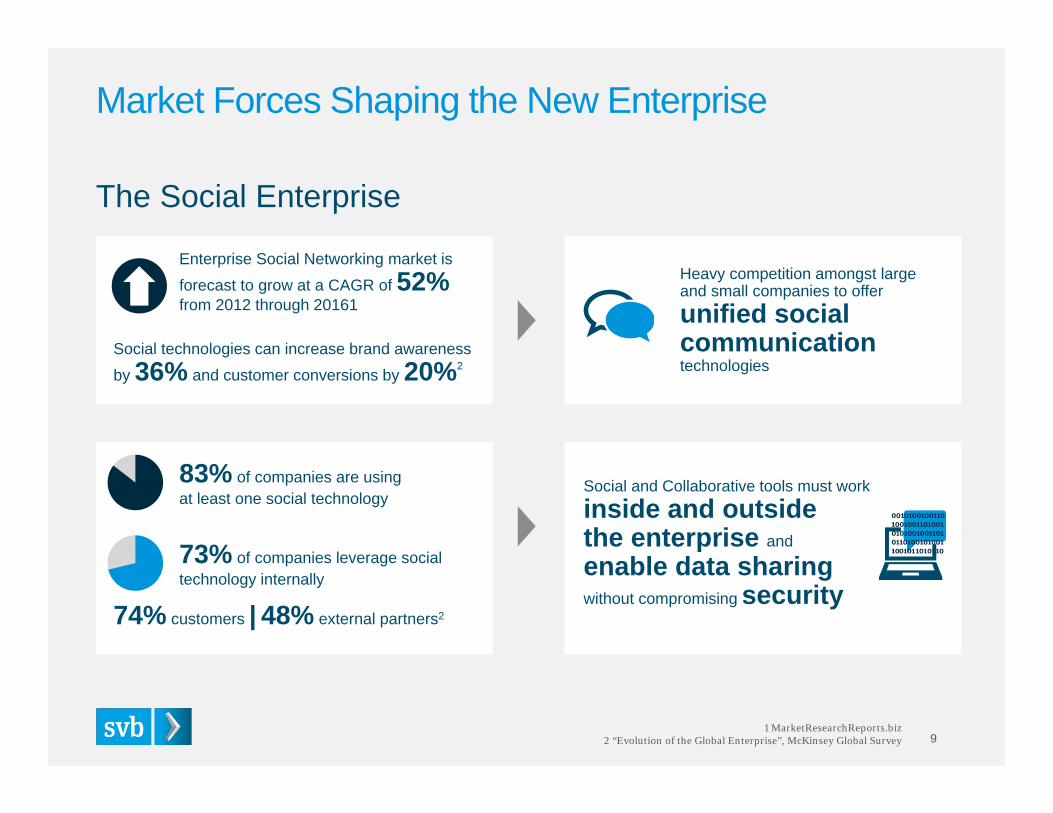
The Social Enterprise
Enterprise Social Networking market is forecast to grow at a CAGR of 52%from 2012 through 20161
Heavy competition amongst large and small companies to offer unified social communicationtechnologies
Social technologies can increase brand awareness by 36% and customer conversions by 20%2
83% of companies are using at least one social technology
Social and Collaborative tools must work inside and outside the enterprise and
enable data sharing without compromising security
74% customers | 48% external partners2
73% of companies leverage social technology internally
The Face of the New Enterprise6 Characteristics, Tools, and Competencies
7 Market Forces Shaping the New Enterprise
Exploring the Data11 Sector / Niche Segmentation
13 Exploring and Interpreting the Data
Summary22 Final Thoughts
23 Bios and Contact Information
24 Glossary
Table of Contents
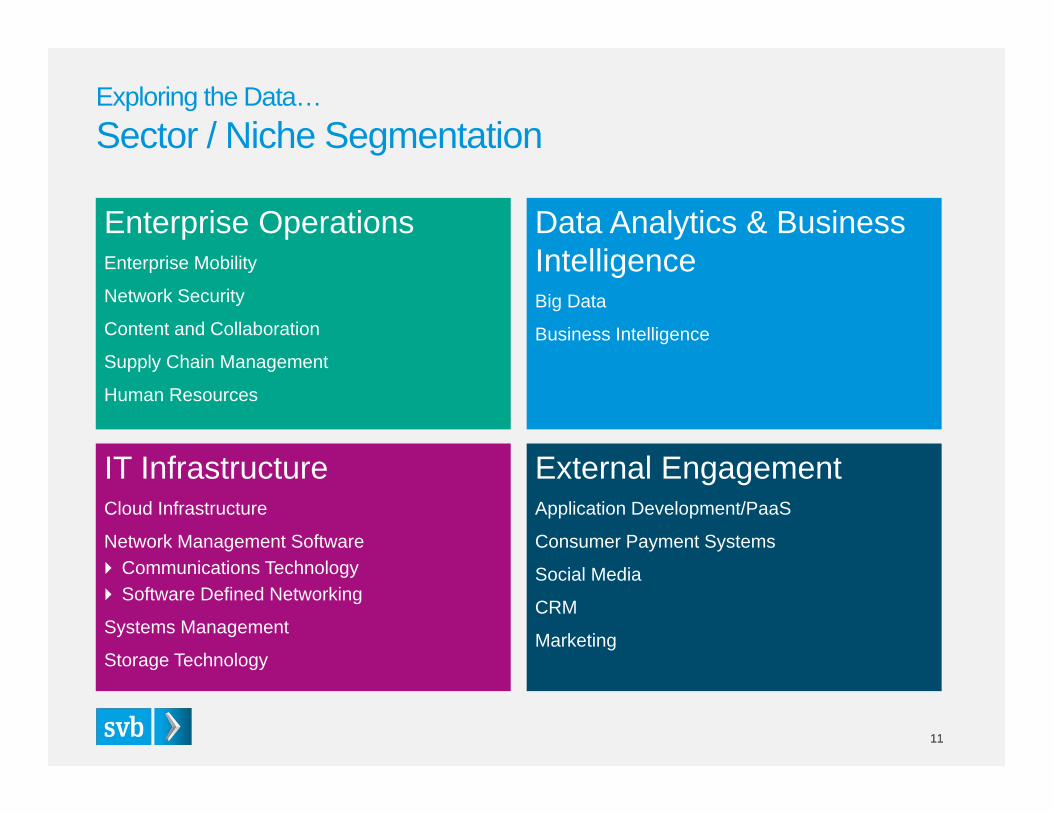
We took a bottom-up approach when segmenting the underlying industry sectors supporting the Face of the New Enterprise.
We examined the business models of the companies in our data set, and characterized them by granular focus (“Niche”), which were then organized into four primary business functions (“Sector”).
10
11
Exploring the Data…Sector / Niche Segmentation
11
Enterprise OperationsEnterprise Mobility
Network Security
Content and Collaboration
Supply Chain Management
Human Resources
Data Analytics & Business IntelligenceBig Data
Business Intelligence
IT InfrastructureCloud Infrastructure
Network Management Software Communications Technology Software Defined Networking
Systems Management
Storage Technology
External EngagementApplication Development/PaaS
Consumer Payment Systems
Social Media
CRM
Marketing
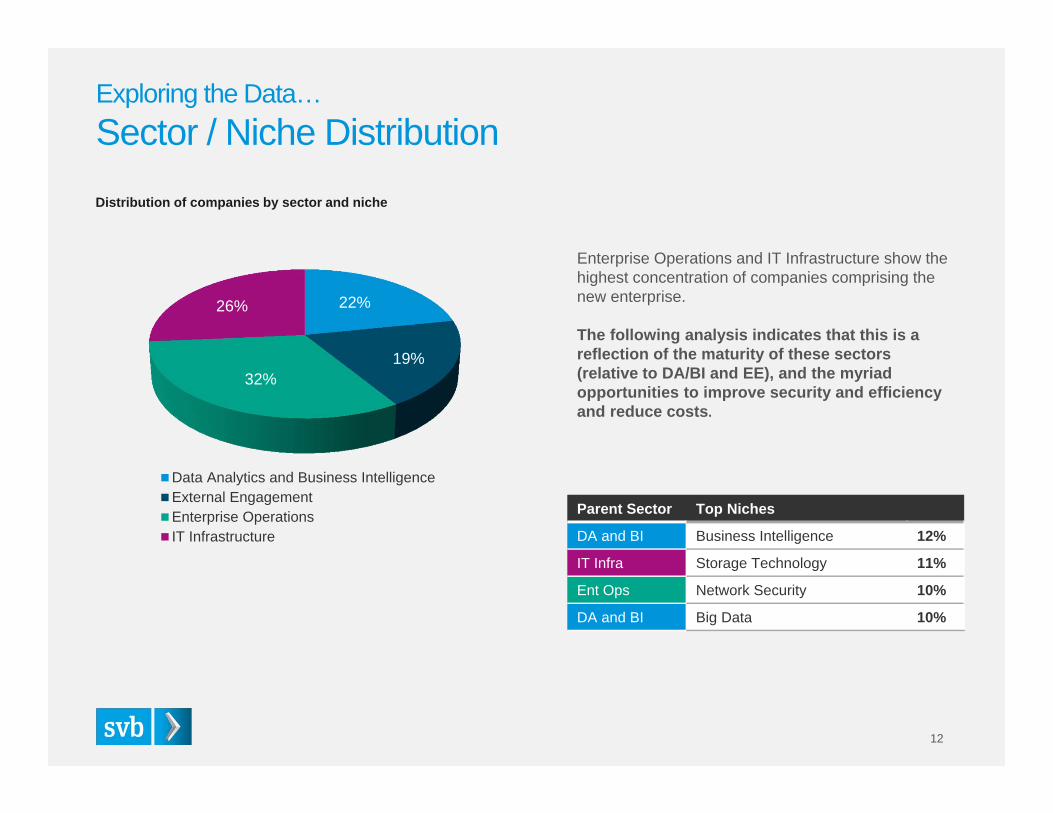
Exploring the Data…Sector / Niche Distribution
12
22%
19%32%
26%
Data Analytics and Business IntelligenceExternal EngagementEnterprise OperationsIT Infrastructure
Parent Sector Top Niches
DA and BI Business Intelligence 12%
IT Infra Storage Technology 11%
Ent Ops Network Security 10%
DA and BI Big Data 10%
Enterprise Operations and IT Infrastructure show the highest concentration of companies comprising the new enterprise.
The following analysis indicates that this is a reflection of the maturity of these sectors (relative to DA/BI and EE), and the myriad opportunities to improve security and efficiency and reduce costs.
Distribution of companies by sector and niche
DataAnalytics and
BusinessIntelligence
ExternalEngagement
EnterpriseOperations
ITInfrastructure
41% 45%
30%42%
32%
42%
32%
33%
22%
9%
28%
18%
5% 3%9% 7%
Series DSeries CSeries BSeries A
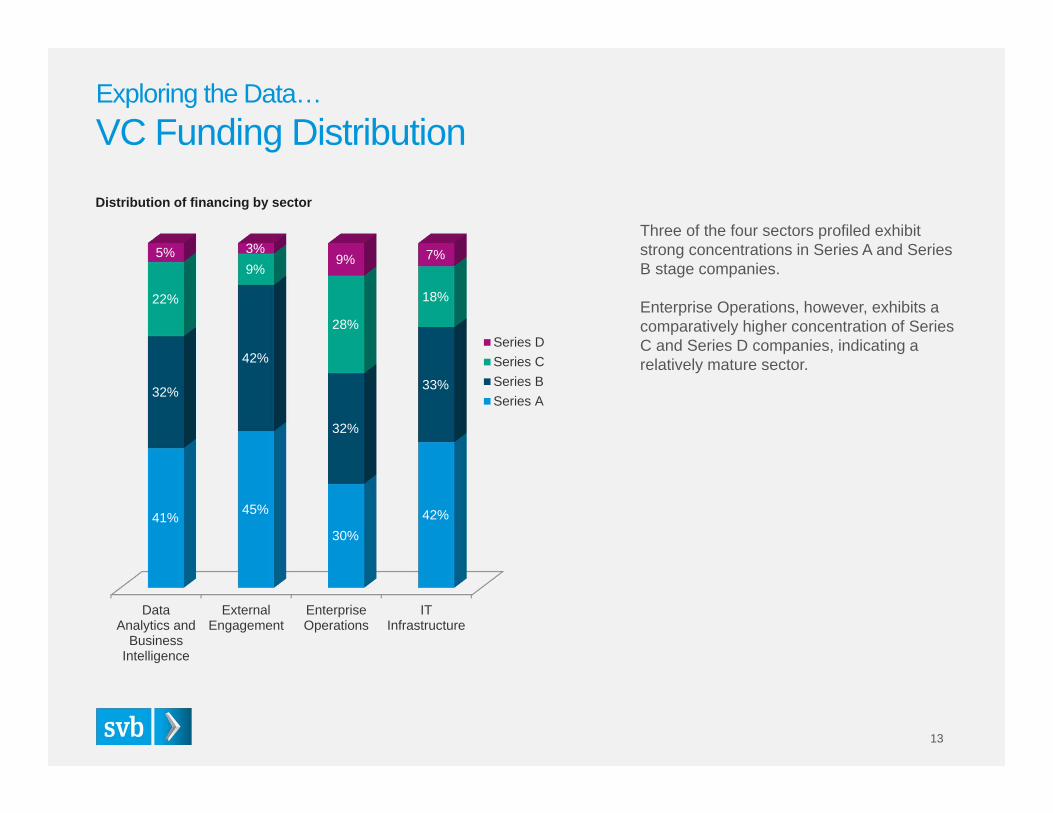
Exploring the Data…VC Funding Distribution
13
Three of the four sectors profiled exhibit strong concentrations in Series A and Series B stage companies.
Enterprise Operations, however, exhibits a comparatively higher concentration of Series C and Series D companies, indicating a relatively mature sector.
Distribution of financing by sector
DataAnalytics and
BusinessIntelligence
ExternalEngagement
EnterpriseOperations
ITInfrastructure
5% 8%
23%12%
23% 19%
37%
27%
42%50%
32%
47%
30%22%
9%14%
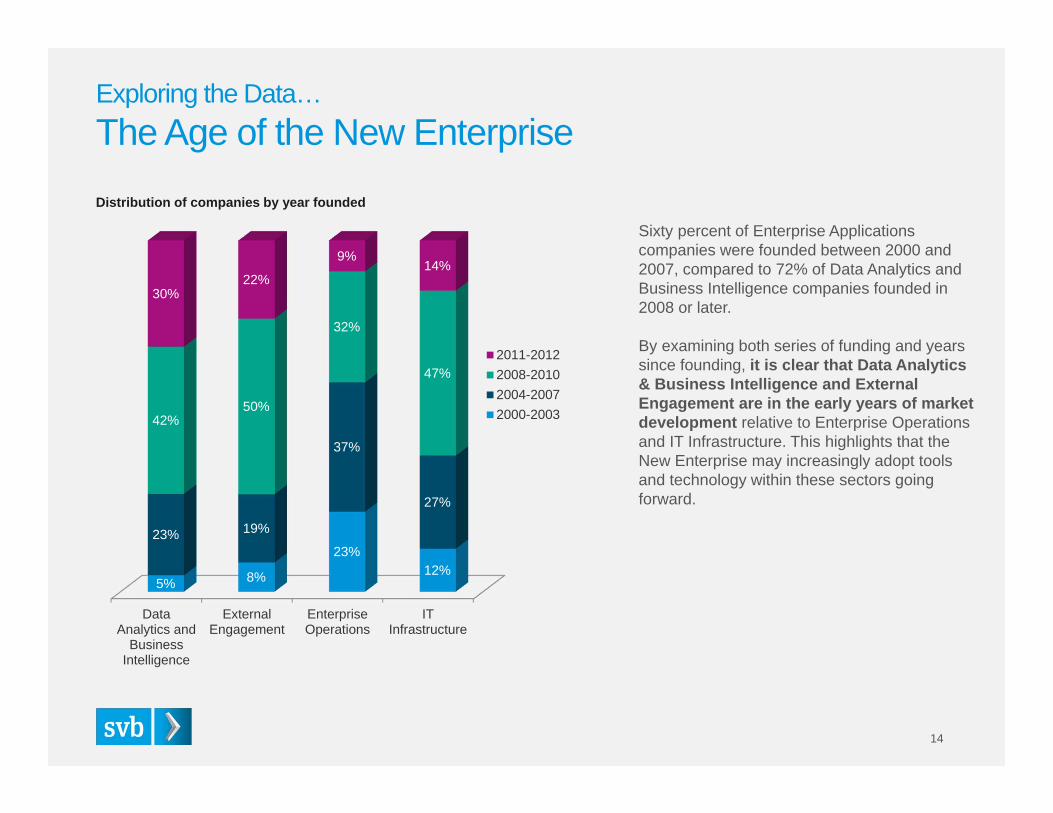
2011-20122008-20102004-20072000-2003
Sixty percent of Enterprise Applications companies were founded between 2000 and 2007, compared to 72% of Data Analytics and Business Intelligence companies founded in 2008 or later.
By examining both series of funding and years since founding, it is clear that Data Analytics & Business Intelligence and External Engagement are in the early years of market development relative to Enterprise Operations and IT Infrastructure. This highlights that the New Enterprise may increasingly adopt tools and technology within these sectors going forward.
Exploring the Data…The Age of the New Enterprise
14
Distribution of companies by year founded
DataAnalytics and
BusinessIntelligence
ExternalEngagement
EnterpriseOperations
ITInfrastructure
63%57%
33% 36%
18%
14%
22%
30%
11%
11%
12%
9%
14%
8%
17%
8% 3%
25%
9%
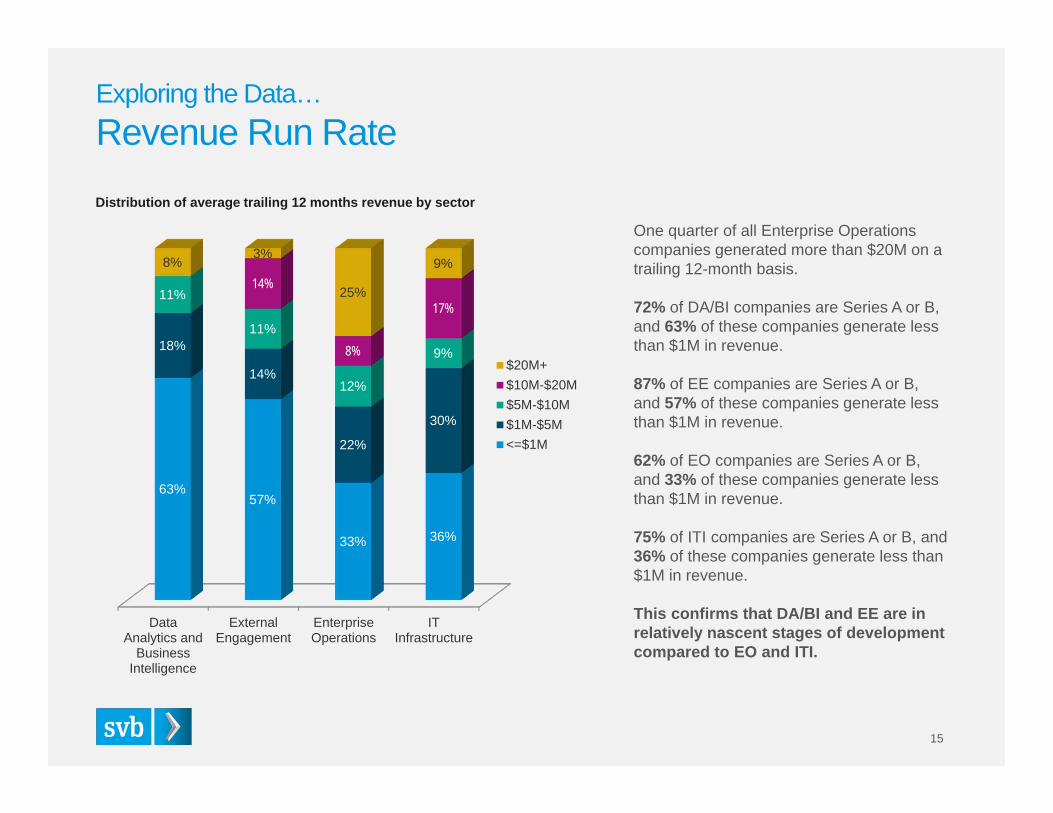
$20M+$10M-$20M$5M-$10M$1M-$5M<=$1M
Exploring the Data…Revenue Run Rate
15
One quarter of all Enterprise Operations companies generated more than $20M on a trailing 12-month basis.
72% of DA/BI companies are Series A or B, and 63% of these companies generate less than $1M in revenue.
87% of EE companies are Series A or B, and 57% of these companies generate less than $1M in revenue.
62% of EO companies are Series A or B, and 33% of these companies generate less than $1M in revenue.
75% of ITI companies are Series A or B, and 36% of these companies generate less than $1M in revenue.
This confirms that DA/BI and EE are in relatively nascent stages of development compared to EO and ITI.
Distribution of average trailing 12 months revenue by sector
DataAnalytics and
BusinessIntelligence
ExternalEngagement
EnterpriseOperations
ITInfrastructure
$0.2 $0.6 $0.8$0.1
$0.4$1.0 $1.0
$1.4
$1.9
$3.7
$6.9
$9.6
Series CSeries BSeries A
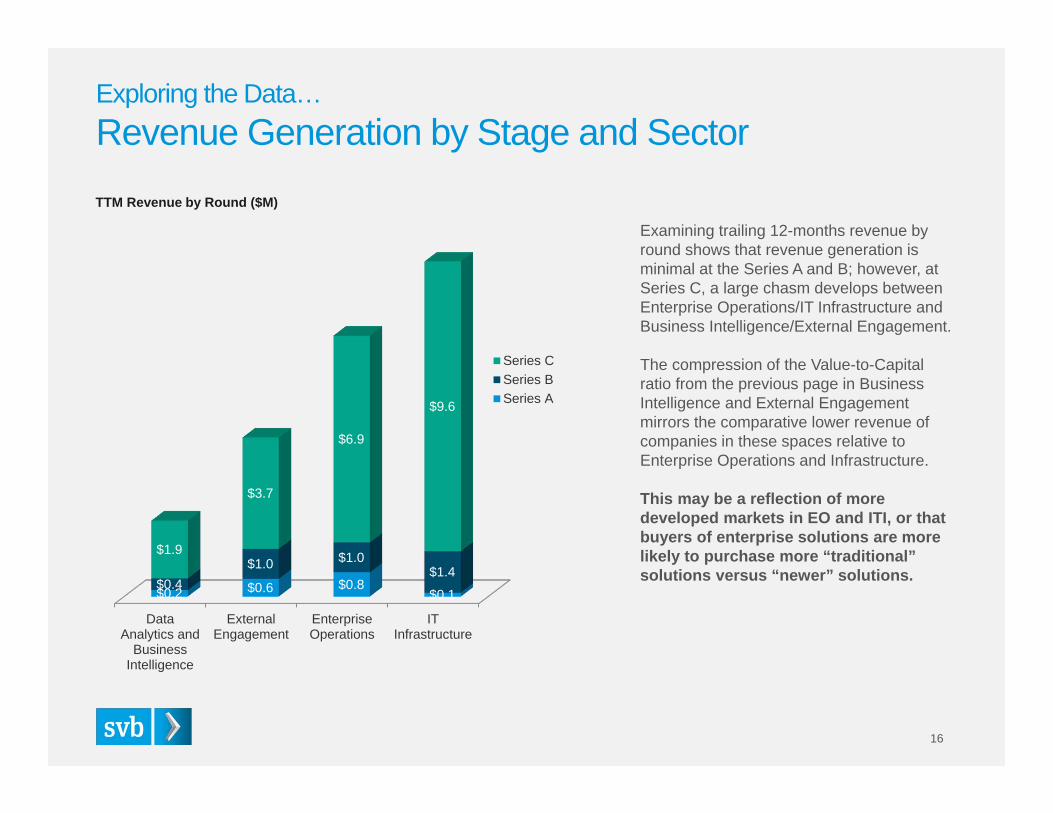
Examining trailing 12-months revenue by round shows that revenue generation is minimal at the Series A and B; however, at Series C, a large chasm develops between Enterprise Operations/IT Infrastructure and Business Intelligence/External Engagement.
The compression of the Value-to-Capital ratio from the previous page in Business Intelligence and External Engagement mirrors the comparative lower revenue of companies in these spaces relative to Enterprise Operations and Infrastructure.
This may be a reflection of more developed markets in EO and ITI, or that buyers of enterprise solutions are more likely to purchase more “traditional” solutions versus “newer” solutions.
Exploring the Data…Revenue Generation by Stage and Sector
16
TTM Revenue by Round ($M)
17
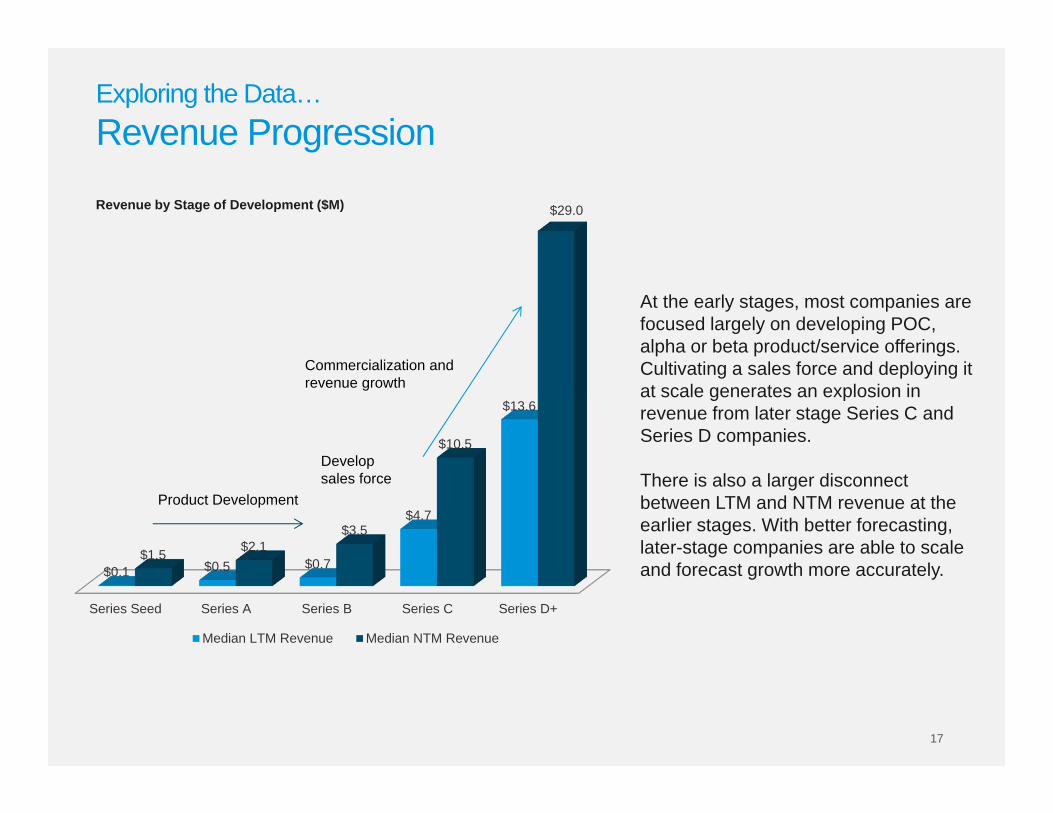
At the early stages, most companies are focused largely on developing POC, alpha or beta product/service offerings. Cultivating a sales force and deploying it at scale generates an explosion in revenue from later stage Series C and Series D companies.
There is also a larger disconnect between LTM and NTM revenue at the earlier stages. With better forecasting, later-stage companies are able to scale and forecast growth more accurately.
Series Seed Series A Series B Series C Series D+
$0.1 $0.5 $0.7
$4.7
$13.6
$1.5 $2.1$3.5
$10.5
$29.0
Median LTM Revenue Median NTM Revenue
Product Development
Commercialization and revenue growth
Develop sales force
Exploring the Data…Revenue Progression
Revenue by Stage of Development ($M)
18
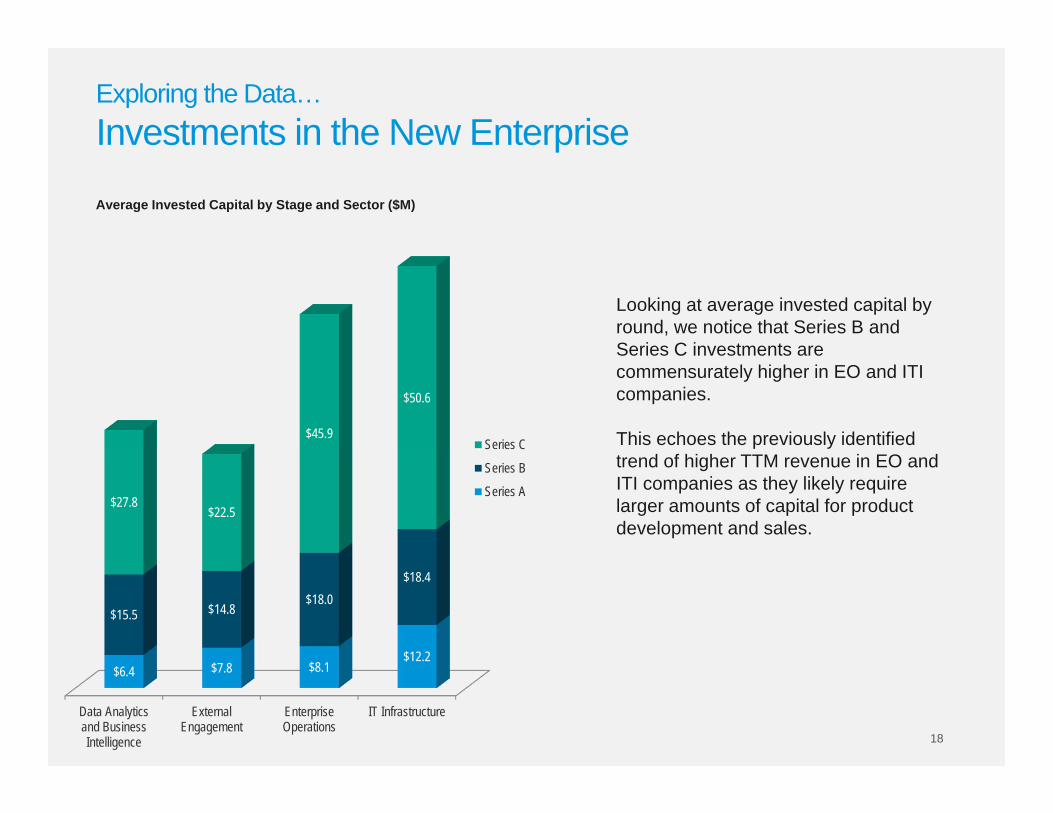
Looking at average invested capital by round, we notice that Series B and Series C investments are commensurately higher in EO and ITI companies.
This echoes the previously identified trend of higher TTM revenue in EO and ITI companies as they likely require larger amounts of capital for product development and sales.
Data Analyticsand BusinessIntelligence
ExternalEngagement
EnterpriseOperations
IT Infrastructure
$6.4 $7.8 $8.1$12.2
$15.5 $14.8$18.0
$18.4
$27.8$22.5
$45.9
$50.6
Series C
Series B
Series A
Exploring the Data…Investments in the New Enterprise
Average Invested Capital by Stage and Sector ($M)
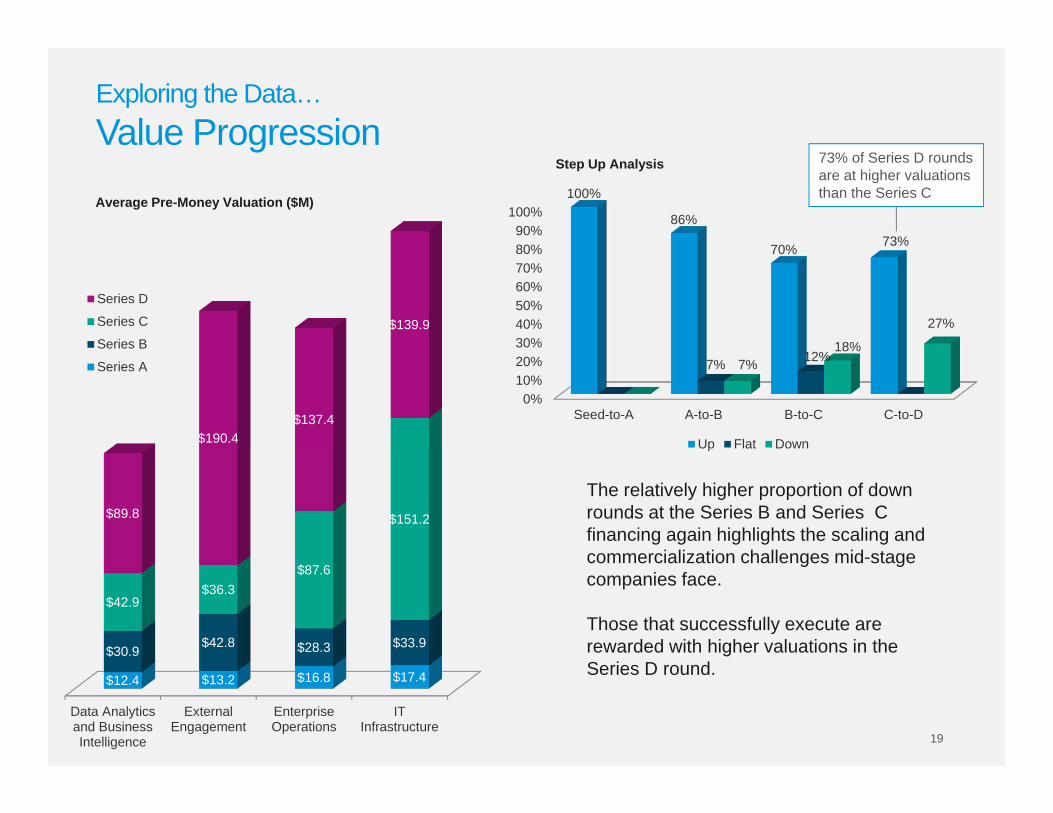
19
Data Analyticsand BusinessIntelligence
ExternalEngagement
EnterpriseOperations
ITInfrastructure
$12.4 $13.2 $16.8 $17.4
$30.9$42.8 $28.3 $33.9
$42.9$36.3
$87.6
$151.2$89.8
$190.4$137.4
$139.9
Series D
Series C
Series B
Series A
0%10%20%30%40%50%60%70%80%90%
100%
Seed-to-A A-to-B B-to-C C-to-D
100%
86%
70% 73%
7% 12%7%18%
27%
Up Flat Down
The relatively higher proportion of down rounds at the Series B and Series C financing again highlights the scaling and commercialization challenges mid-stage companies face.
Those that successfully execute are rewarded with higher valuations in the Series D round.
Exploring the Data…Value Progression
Average Pre-Money Valuation ($M)
Step Up Analysis 73% of Series D rounds are at higher valuations than the Series C
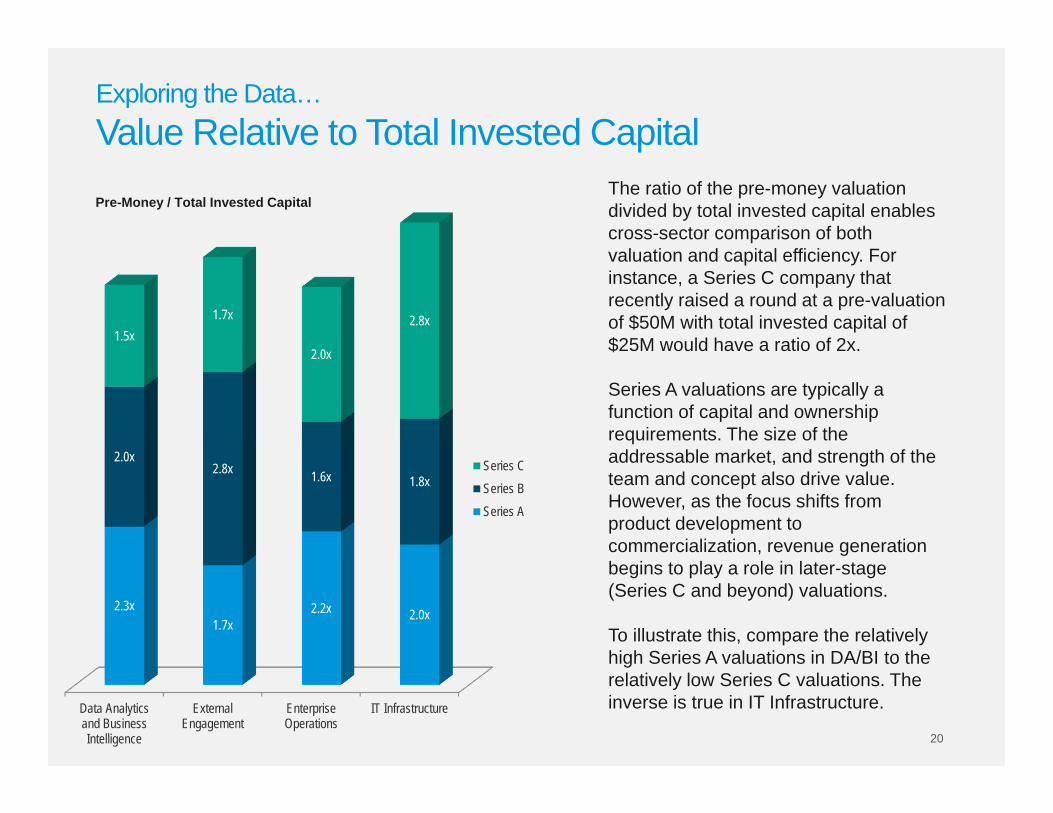
20
The ratio of the pre-money valuation divided by total invested capital enables cross-sector comparison of both valuation and capital efficiency. For instance, a Series C company that recently raised a round at a pre-valuation of $50M with total invested capital of $25M would have a ratio of 2x.
Series A valuations are typically a function of capital and ownership requirements. The size of the addressable market, and strength of the team and concept also drive value. However, as the focus shifts from product development to commercialization, revenue generation begins to play a role in later-stage (Series C and beyond) valuations.
To illustrate this, compare the relatively high Series A valuations in DA/BI to the relatively low Series C valuations. The inverse is true in IT Infrastructure. Data Analytics
and BusinessIntelligence
ExternalEngagement
EnterpriseOperations
IT Infrastructure
2.3x1.7x
2.2x 2.0x
2.0x2.8x 1.6x 1.8x
1.5x1.7x
2.0x
2.8x
Series CSeries BSeries A
Exploring the Data…Value Relative to Total Invested Capital
Pre-Money / Total Invested Capital
The Face of the New Enterprise6 Characteristics, Tools, and Competencies
7 Market Forces Shaping the New Enterprise
Exploring the Data11 Sector / Niche Segmentation
13 Exploring and Interpreting the Data
Summary22 Final Thoughts
23 Bios and Contact Information
24 Glossary
Table of Contents
21
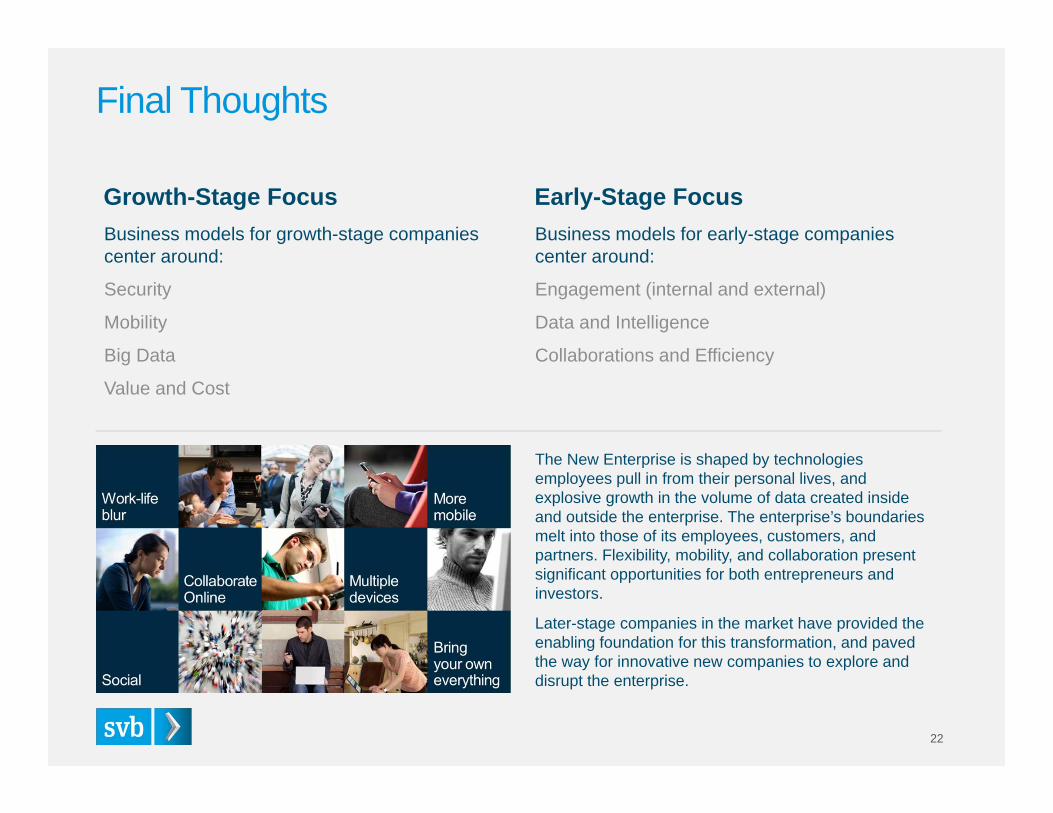
Business models for growth-stage companies center around:
Security
Mobility
Big Data
Value and Cost
Final Thoughts
22
Growth-Stage Focus Early-Stage FocusBusiness models for early-stage companies center around:
Engagement (internal and external)
Data and Intelligence
Collaborations and Efficiency
The New Enterprise is shaped by technologies employees pull in from their personal lives, and explosive growth in the volume of data created inside and outside the enterprise. The enterprise’s boundaries melt into those of its employees, customers, and partners. Flexibility, mobility, and collaboration present significant opportunities for both entrepreneurs and investors.
Later-stage companies in the market have provided the enabling foundation for this transformation, and paved the way for innovative new companies to explore and disrupt the enterprise.
SVB Analytics Contacts
23
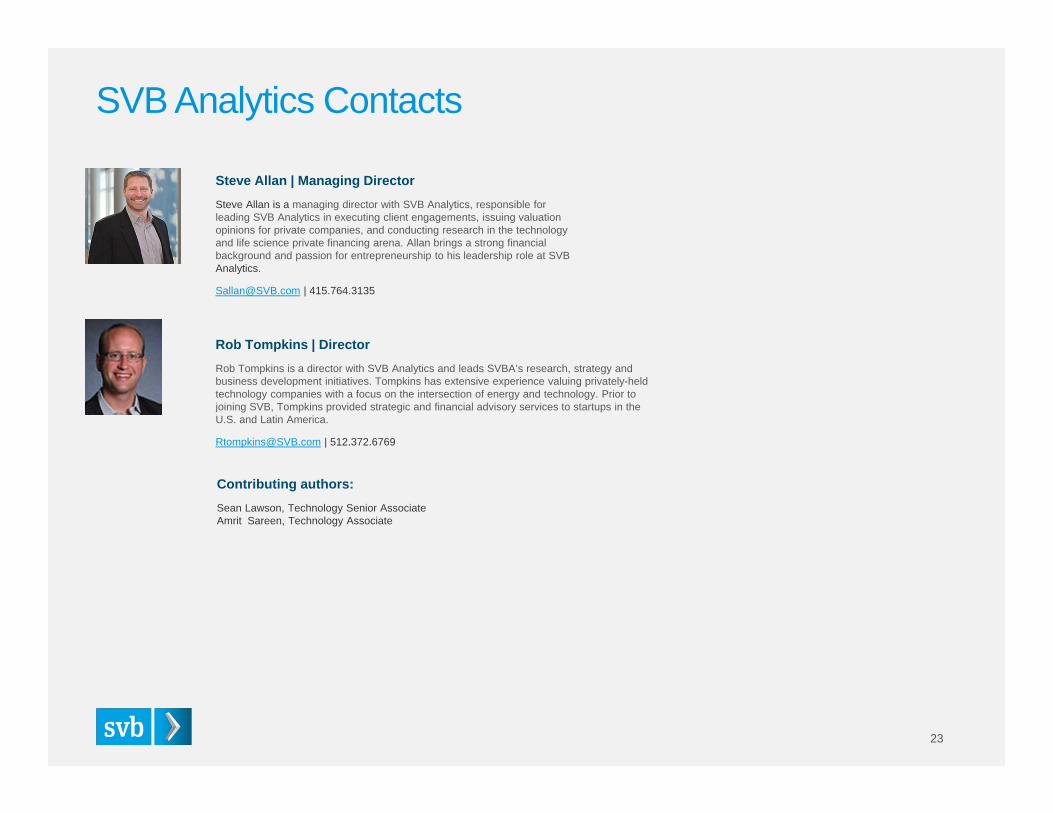
Steve Allan | Managing DirectorSteve Allan is a managing director with SVB Analytics, responsible for leading SVB Analytics in executing client engagements, issuing valuation opinions for private companies, and conducting research in the technology and life science private financing arena. Allan brings a strong financial background and passion for entrepreneurship to his leadership role at SVB Analytics.
[email protected] | 415.764.3135
Contributing authors:Sean Lawson, Technology Senior AssociateAmrit Sareen, Technology Associate
Rob Tompkins | DirectorRob Tompkins is a director with SVB Analytics and leads SVBA’s research, strategy and business development initiatives. Tompkins has extensive experience valuing privately-held technology companies with a focus on the intersection of energy and technology. Prior to joining SVB, Tompkins provided strategic and financial advisory services to startups in the U.S. and Latin America.
[email protected] | 512.372.6769

GlossaryTerm Definition
API Application Programming Interface
CES Consumer Electronics Show
COGS Cost of Goods Sold
IoT Internet of Things
M2M Machine-to-machine
MDM Mobile Device Management
Metcalfe's Law The value of a network is equal to the square of the number of devices connected to it
Moore's Law The number of transistors on integrated circuits doubles approximately every two years
Organic Sales Growth that comes from existing customers, word of mouth, and viral sources, versus from increased sales and marketing efforts
RFID Radio-frequency identification
ROI Return on Investment
SaaS Software-as-a-Service
Step-up Refers to the percentage increase in the original issuance price of the preferred securities between two rounds of financing
SVB Silicon Valley Bank
WSN Wireless Sensor Network
24
SVB Financial Group3003 Tasman DriveSanta Clara, California 95054408.654.7400svb.com
This material, including without limitation the statistical information herein, is provided for informational purposes only. Thematerial is based in part upon information from third-party sources that we believe to be reliable, but which has not beenindependently verified by SVB Financial Group and, as such, we do not represent that the information is accurate or complete.The information should not be viewed as tax, investment, legal or other advice nor is it to be relied on in making an investment orother decisions. You should obtain relevant and specific professional advice before making any investment decision. Nothingrelating to the material should be construed as a solicitation or offer to acquire or dispose of any investment or transaction.
©2013 SVB Financial Group. All rights reserved. Member Federal Reserve System. SVB>, SVB>Find a way, SVB FinancialGroup, and Silicon Valley Bank are registered trademarks. SVB Analytics is a member of SVB Financial Group and a non-bankaffiliate of Silicon Valley Bank. Products and services offered by SVB Analytics are not FDIC insured and are not deposits or otherobligations of Silicon Valley Bank. SVB Analytics does not provide tax or legal advice. Please consult your tax or legal advisors forsuch guidance. Rev. 06-17-13
SVB Analytics555 Mission Street, Suite 900San Francisco, California 94105800.760.9644 svb.com


![ENTERPRISE SURVEYS/media/GIAWB/...The Enterprise Surveys collect a wide array of qualitative and quantitative information through face to face ... [fin3] Proportion of](https://img.pdfslide.us/doc/110x75/5aea49ec7f8b9a45568b9b52/enterprise-mediagiawbthe-enterprise-surveys-collect-a-wide-array-of-qualitative.jpg)