Embed Size (px)
Citation preview

3 Metrics that Matter New Model, New Metrics
Tyler Sloat, CFO

At the core of Subscription Model is the customer
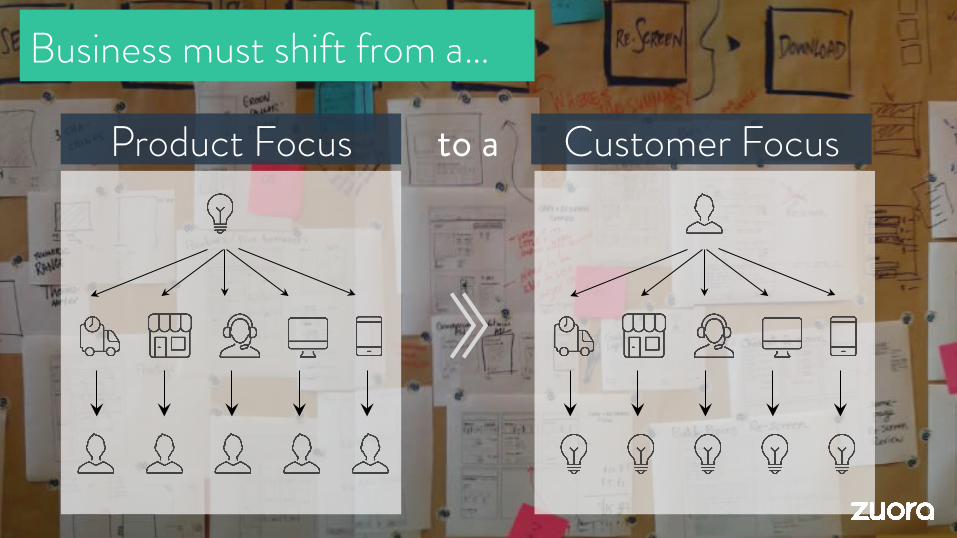
Business must shift from a…
Product Focus Customer Focus to a
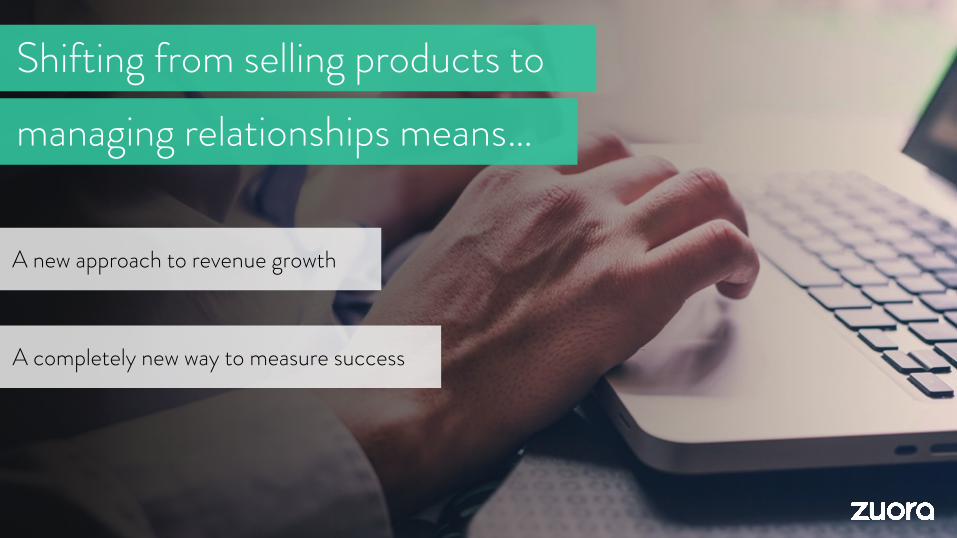
A new approach to revenue growth
A completely new way to measure success
Shifting from selling products to managing relationships means…

The unique business model

Let me sketch it out…
ARR n

ARR n ACV +
Let me sketch it out…

ARR n ACV + Churn -
Let me sketch it out…

ARR n ACV + Churn - ARR = n+1
Let me sketch it out…
Annual Recurring Reven
forward looking ARR is the amount of revenue you expect to repeat. This is different than revenue. Revenue is backwards looking while ARR is forward looking.
Annual Recurring Revenue

New Revenue ACV is your new revenue brought in by new customers or customers upgrading or renewing their existing contract. Ultimately, this drives your ARR. And we like this.
Annual Contract Value

Churn
When Customers Leave You Even if you have the hottest service offering out there, you’ll still have customers leave you. This is important to subtract from your ARR.
Customer downsells… Competitive loss… Business failure…
Churn
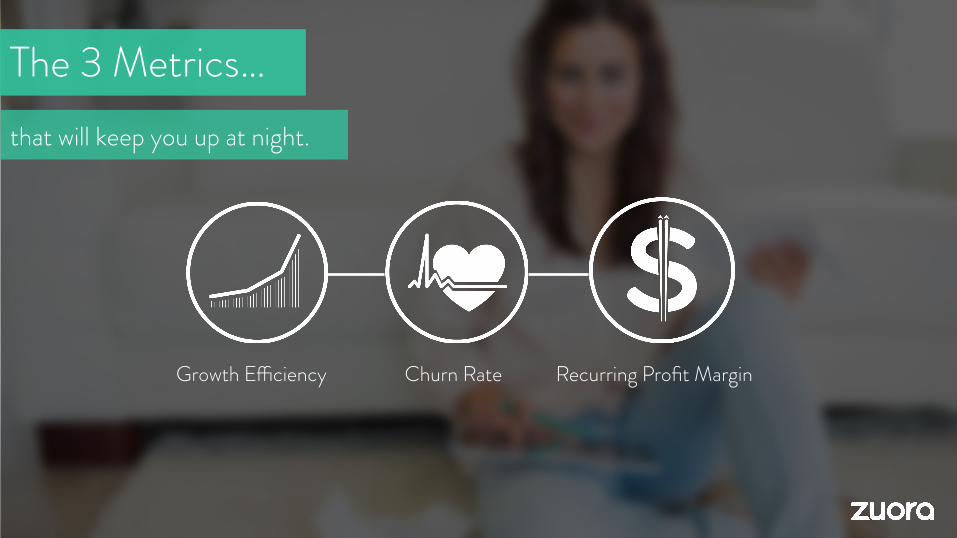
The 3 Metrics… that will keep you up at night.
Growth Efficiency Churn Rate Recurring Profit Margin

Annual Recurring Revenue Churn Net ARR COGS G&A R&D Recurring Profit Growth Net New ARR Net Income Ending ARR
$100 ($10)
$90
($20) ($10) ($20)
$40
($40) $40
$0
$130
Retention Rate Recurring Profit Margin
Growth Efficiency Index
The 3 Metrics…
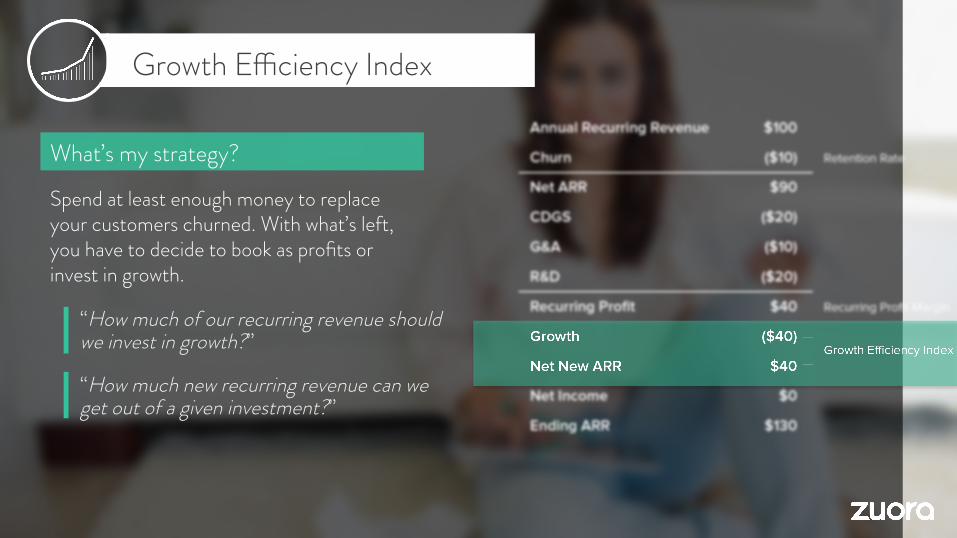
“How much new recurring revenue can we get out of a given investment?”
What’s my strategy?
Spend at least enough money to replace your customers churned. With what’s left, you have to decide to book as profits or invest in growth.
“How much of our recurring revenue should we invest in growth?”
Growth Efficiency Index
Churn Rate
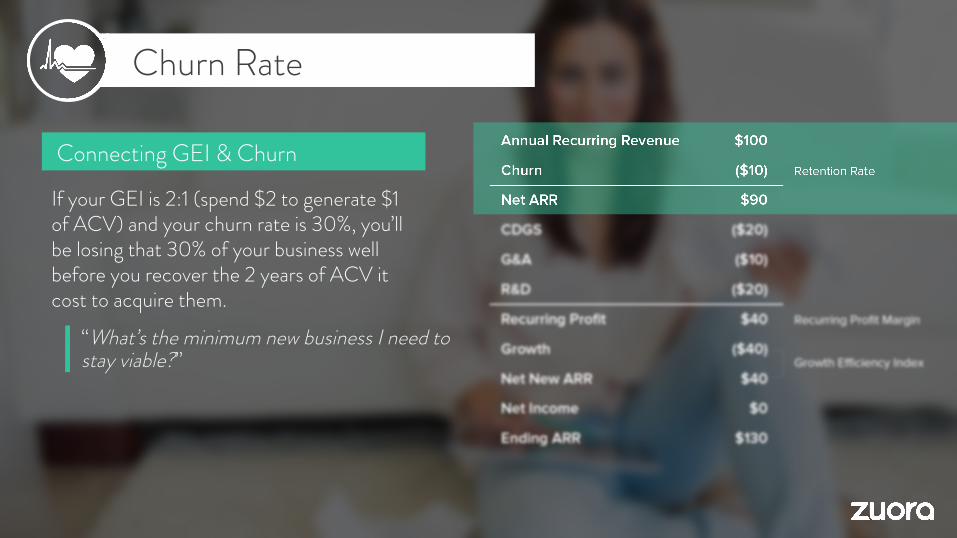
“What’s the minimum new business I need to stay viable?”
Connecting GEI & Churn
If your GEI is 2:1 (spend $2 to generate $1 of ACV) and your churn rate is 30%, you’ll be losing that 30% of your business well before you recover the 2 years of ACV it cost to acquire them.

Recurring Profit Margins
“What’s left to invest in growth after COGs are taken care of?”
Your strategy…
The lower the recurring costs, the more money you have to play with – book as profit or invest back in growth.

Let’s apply this to the real world with some good old fashion benchmarking.

Growth Efficiency Index
Retention Rate
Recurring Profit Margin
Growth Expense as of % of ARR
0.80 83% 28% 66%
1.08 83% 37% 70%
1.68 94% 56% 61%
1.66 82% 18% 115%

0%
10%
20%
30%
40%
50%
60%
70%
80%
-
20,000
40,000
60,000
80,000
100,000
120,000
140,000
160,000
180,000
200,000
4/30/2012 7/30/2012 10/31/2012 1/31/2013 4/30/2013 7/30/2013 10/31/2013 1/31/2014 4/30/2014 Entering ARR 50,632 59,341 73,161 89,812 105,623 126,450 147,945 171,942 189,548 Growth Exp Annualized 15,083 16,660 21,128 24,645 29,916 36,967 43,916 48,077 48,152 Non-Growth Expense Annualized 32,623 36,438 43,532 53,347 62,940 72,303 81,112 98,263 102,168 Growth % ARR 30% 28% 29% 27% 28% 29% 30% 28% 25% Non-Growth % ARR 64% 61% 60% 59% 60% 57% 55% 57% 54% % ARR Growth 17% 23% 23% 18% 20% 17% 16% 10% 11% GEI on ARR 0.43 0.30 0.32 0.39 0.36 0.43 0.46 0.68 0.59 Gross Profit Margin % 54% 56% 56% 58% 59% 61% 61% 61% 61% Recurring Profit Margin % 45% 50% 52% 49% 50% 51% 53% 48% 51%
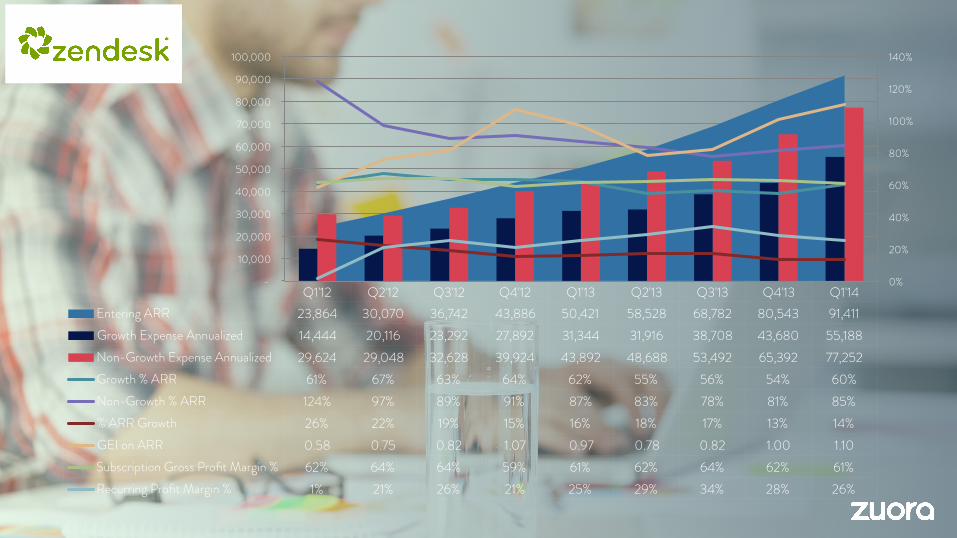
Q1'12 Q2'12 Q3'12 Q4'12 Q1'13 Q2'13 Q3'13 Q4'13 Q1'14 Entering ARR 23,864 30,070 36,742 43,886 50,421 58,528 68,782 80,543 91,411 Growth Expense Annualized 14,444 20,116 23,292 27,892 31,344 31,916 38,708 43,680 55,188 Non-Growth Expense Annualized 29,624 29,048 32,628 39,924 43,892 48,688 53,492 65,392 77,252 Growth % ARR 61% 67% 63% 64% 62% 55% 56% 54% 60% Non-Growth % ARR 124% 97% 89% 91% 87% 83% 78% 81% 85% % ARR Growth 26% 22% 19% 15% 16% 18% 17% 13% 14% GEI on ARR 0.58 0.75 0.82 1.07 0.97 0.78 0.82 1.00 1.10 Subscription Gross Profit Margin % 62% 64% 64% 59% 61% 62% 64% 62% 61% Recurring Profit Margin % 1% 21% 26% 21% 25% 29% 34% 28% 26%
0%
20%
40%
60%
80%
100%
120%
140%
-
10,000
20,000
30,000
40,000
50,000
60,000
70,000
80,000
90,000
100,000

Q3'10
Q4'10 Q1'11 Q2'1
1 Q3'1
1 Q4'1
1 Q1'1
2 Q2'1
2 Q3'1
2 Q4'1
2 Q1'1
3 Q2'1
3 Q3'1
3 Q4'1
3 Q1'1
4 Q2'1
4 Entering ARR $55 $68 $80 $93 $112 $131 $150 $176 $208 $239 $272 $307 $352 $400 $450 $506 Growth Expense Annualized 25 28 33 47 53 72 71 98 101 105 137 190 166 202 241 318 Non-Growth Expense Annualized 20 26 34 39 48 67 85 107 140 150 158 178 199 222 265 286 Growth % ARR 46% 42% 41% 51% 47% 55% 48% 56% 49% 44% 50% 62% 47% 50% 54% 63% Non-Growth % ARR 37% 39% 43% 41% 43% 51% 57% 61% 68% 63% 58% 58% 57% 55% 59% 57% % ARR Growth 24% 18% 16% 20% 17% 14% 17% 18% 15% 14% 13% 14% 14% 12% 13% 13% GEI on ARR 0.48 0.56 0.62 0.62 0.69 0.97 0.70 0.76 0.79 0.79 0.98 1.07 0.85 1.03 1.06 1.21 Gross Profit Margin % 68% 65% 63% 68% 65% 59% 55% 60% 57% 57% 62% 65% 63% 64% 62% 65% Recurring Profit Margin % 70% 67% 63% 66% 63% 56% 52% 49% 41% 45% 49% 49% 50% 51% 48% 50%
0%
20%
40%
60%
80%
100%
120%
140%
$-
$100
$200
$300
$400
$500
$600

Summary
1 The new economy focuses on relationships, not products
2 Efficient acquisition and retention of those relationships is critical to success
3 Running a disciplined business model based on the three metrics will generate long-term shareholder value

thank you. check us out at zuora.com

We build modern, flexible and easy to use enterprise software that enables companies to manage all aspects of their
relationship with their subscribers.
25

Offices: Silicon Valley, Boston, Atlanta, London, Paris, Munich, Sydney, Beijing
95% Customer Sat
Awards
500 Employees
Founded 2007
$132.5M Funding
70+ Monthly Product
Releases
$100M+ Approaching
Run Rate
500+ Customers
80 Public Companies
ALWAYSON Company of the Year
STEVIE (GOLD) Customer Service Excellence
CODiE Best Subscription Management Solution
$1.7B In Quarterly
Transaction Volume
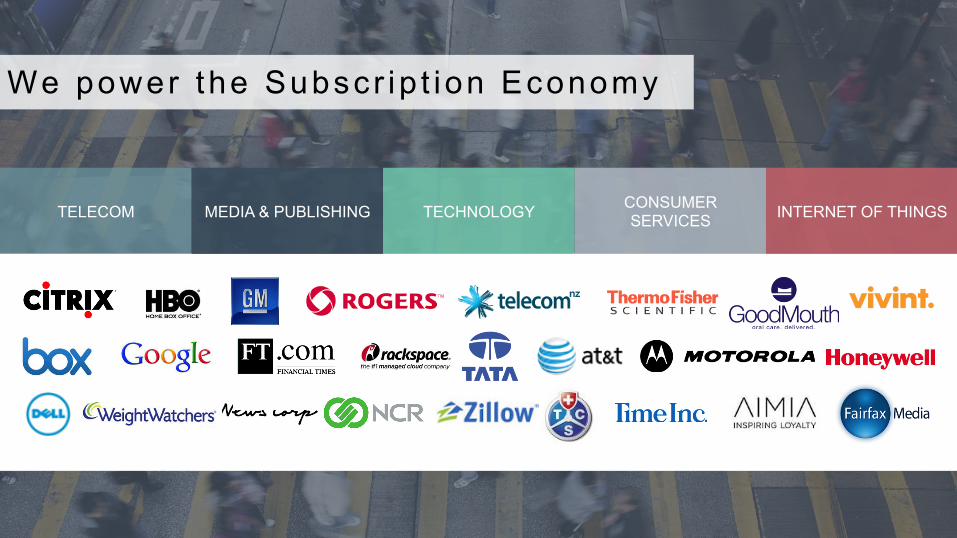
TELECOM MEDIA & PUBLISHING TECHNOLOGY CONSUMER SERVICES INTERNET OF THINGS
We power the Subscr ip t ion Economy

tailored pricing subscription journey
multi-channel
revenue recognition subscription metrics
smart accounting
branded touch points global payments
scale & automation
COMMERCE BILLING FINANCE
Z-BUSINESS Relationship Business Management Solution
Mission Critical System of Record
SCALE RELIABILITY TRANSPARENCY SECURITY CONTROL COEXISTENCE
BUILT ON THE Z-BUSINESS PLATFORM

the end.