Embed Size (px)
Citation preview
Supply Chain Index Part IIITechnology & Apparel
June 27, 2013
#sciwebinar

Supply Chain Insights LLC Copyright © 2013, p. 2
Supply Chain Insights is focused on delivering independent, actionable and objective advice for
supply chain leaders. A company dedicated to research, turn to us when you want the latest
insights on supply chain trends, technologies to know and metrics that matter.
About Us
#sciwebinar

Supply Chain Insights LLC Copyright © 2013, p. 3
Presenters
Abby MayerResearch Associate
Lora CecereFounder and CEO
#sciwebinar

Supply Chain Insights LLC Copyright © 2013, p. 4
This is the new bible for all supply chain executives. It provides an insider’s perspective that will prove incredibly valuable to even the most grizzled supply chain veteran. This is the next must-have business book.
--Bruce Richardson, Chief Enterprise Strategist, Salesforce.com
Today, the worlds of social business and supply chain management have many degrees of separation. I enjoyed working with Lora to understand what the future transformation of digital marketing to digital business could look like.
--Jeremiah Owyang, Research Director, Altimeter
Second Printing of Bricks Matter: 16 Five-Star Reviews on Amazon
#sciwebinar
Available at http://www.amazon.com/Bricks-Matter-Building-Market-Driven-Differentiation/dp/1118218310/ref=sr_1_1?ie=UTF8&qid=1369245253&sr=8-1&keywords=bricks+matter

Supply Chain Insights LLC Copyright © 2013, p. 5
Publishing Two eBooks in 2013 on Supply Chain Metrics That Matter
2013 Publications
#sciwebinar

Supply Chain Insights LLC Copyright © 2013, p. 6
18 Reports in 2012
#sciwebinar
Supply Chain Insights LLC Copyright © 2013, p. 7
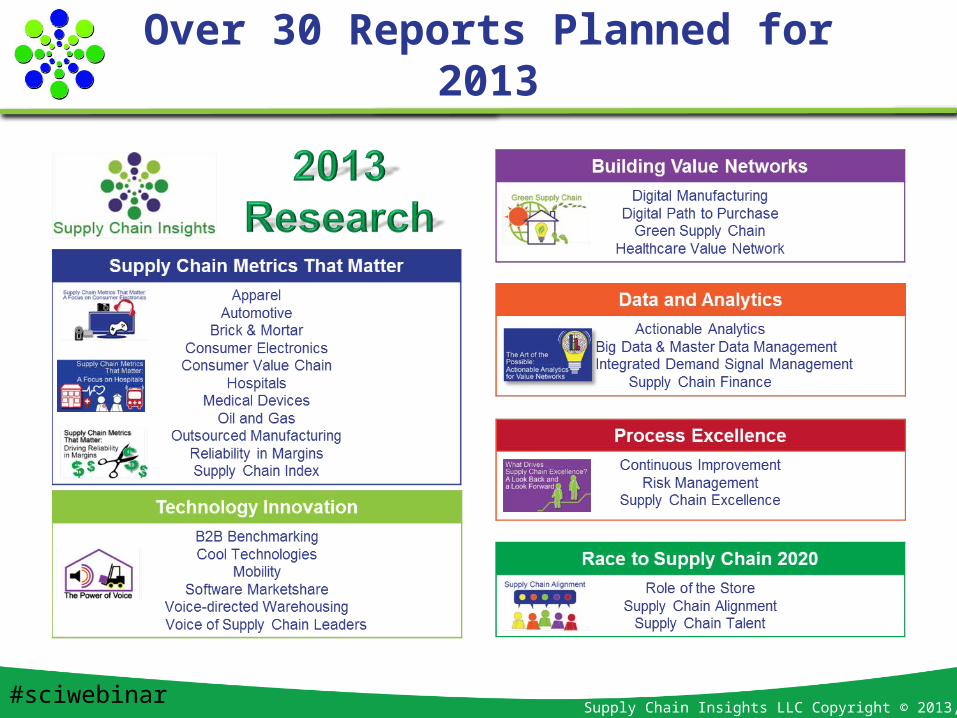
Over 30 Reports Planned for 2013
#sciwebinar
Supply Chain Insights LLC Copyright © 2013, p. 8
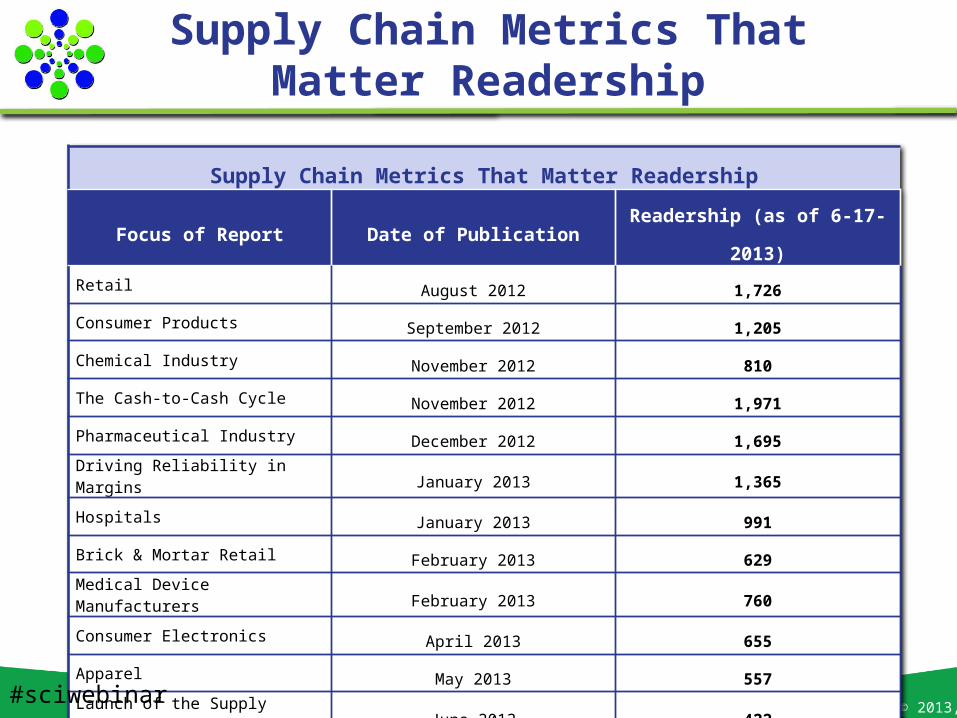
Supply Chain Metrics That Matter Readership
Focus of Report Date of Publication Readership (as of 6-17-2013)
Retail August 2012 1,726
Consumer Products September 2012 1,205
Chemical Industry November 2012 810
The Cash-to-Cash Cycle November 2012 1,971
Pharmaceutical Industry December 2012 1,695
Driving Reliability in Margins January 2013 1,365
Hospitals January 2013 991
Brick & Mortar Retail February 2013 629
Medical Device Manufacturers February 2013 760
Consumer Electronics April 2013 655
Apparel May 2013 557
Launch of the Supply Chain Index June 2013 422
Supply Chain Metrics That Matter Readership
#sciwebinar
Supply Chain Insights LLC Copyright © 2013, p. 9
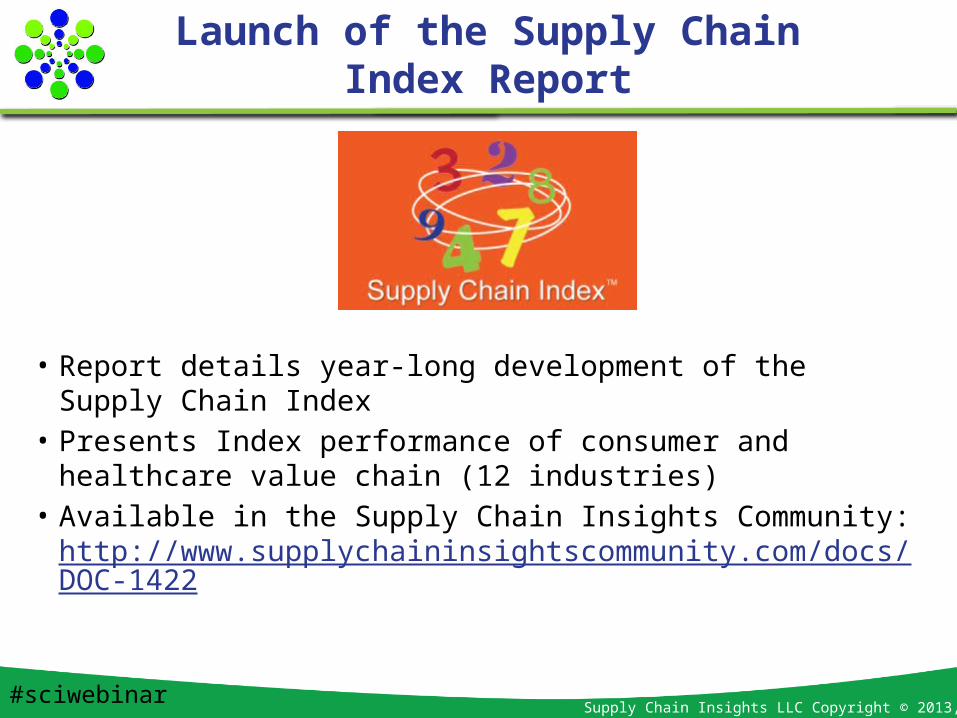
• Report details year-long development of the Supply Chain Index
• Presents Index performance of consumer and healthcare value chain (12 industries)
• Available in the Supply Chain Insights Community: http://www.supplychaininsightscommunity.com/docs/DOC-1422
Launch of the Supply Chain Index Report
#sciwebinar
Supply Chain Insights LLC Copyright © 2013, p. 10
What Is Best in Class?
Understanding the Supply Chain as a Complex System
Which Companies Have Maximized Market Valuation Through Supply Chain Excellence?
Using the Insights
Agenda
#sciwebinar
Supply Chain Insights LLC Copyright © 2013, p. 11
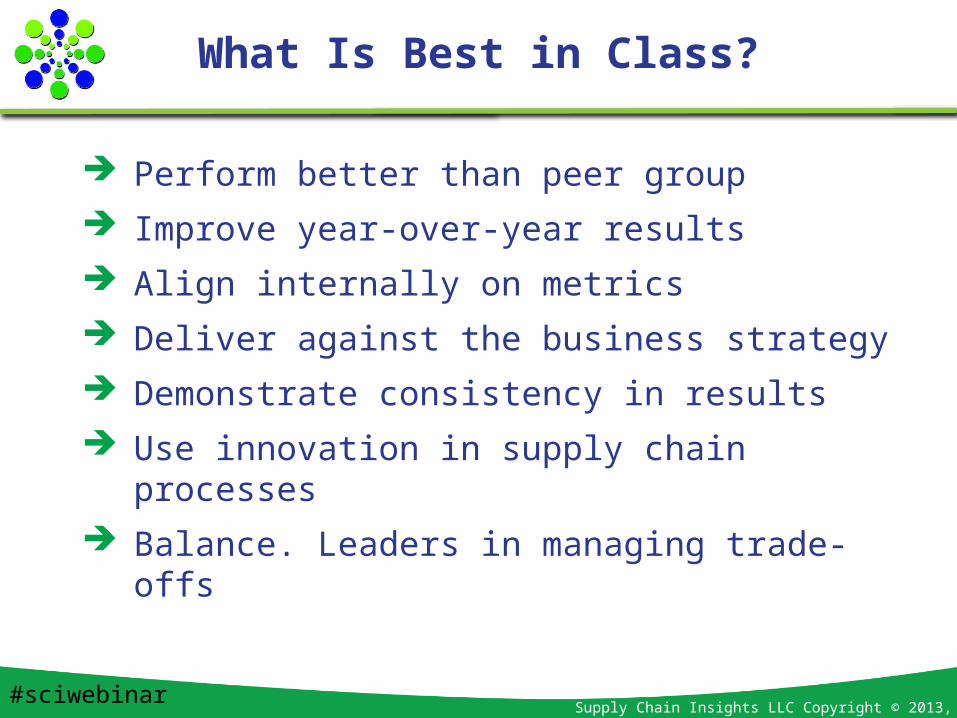
Perform better than peer group
Improve year-over-year results
Align internally on metrics
Deliver against the business strategy
Demonstrate consistency in results
Use innovation in supply chain processes
Balance. Leaders in managing trade-offs
What Is Best in Class?
#sciwebinar
Supply Chain Insights LLC Copyright © 2013, p. 12
What Is Best in Class?
Understanding the Supply Chain as a Complex System
Which Companies Have Maximized Market Valuation Through Supply Chain Excellence?
Using the Insights
Agenda
#sciwebinar

Supply Chain Insights LLC Copyright © 2013, p. 13
What Is A Supply Chain?
A Supply Chain is a Complex System
with Complex Processes
with Increasing Complexity
#sciwebinar

Supply Chain Insights LLC Copyright © 2013, p. 14
The Supply Chain Effective Frontier:First Representation
#sciwebinar

Supply Chain Insights LLC Copyright © 2013, p. 15
Mining 20 Years of Financial Data
Financial Metrics
Growth Profitability Cycle ComplexityCommon Shares Cash Cash-to-Cash Cycle Altman Z
Employee Growth Cash Change in Period Days of Finished Goods Capital Turnover
Employees Cash on Hand Days of Inventory Current Ratio
Market Capitalization Cash Ratio TTM Days of Payables Outstanding Quick Ratio
R&D Margin Cash Ratio Quarter Days of Raw Materials Return on Assets
R&D Ratio Cash Ratio Year Days of Sales Outstanding Return on Equity
R&D to COGS Ratio Cost of Goods Sold Days of Work in Progress Return on Invested Capital
Revenue EBITDA DPO/DSO Return on Net Assets
Revenue Growth Free Cash Flow Ratio Finished Goods Inventory Revenue per Employee
Revenue Growth TTM Gross Margin Inventory Working Capital Ratio
Revenue TTM Gross Profit Inventory Turns
SG&A Margin Net Profit Margin Receivables Turns
SG&A Ratio Operating Cash Flow Ratio Raw Materials Inventory
SG&A to COGS Ratio Operating Margin Work in Progress Inventory
OPEX Ratio
Pretax Margin
#sciwebinar

Supply Chain Insights LLC Copyright © 2013, p. 16
The Supply Chain Effective Frontier: Second Representation
#sciwebinar

Supply Chain Insights LLC Copyright © 2013, p. 17
• Supply Chain Index: A formulaic representation of supply chain financial ratios correlated to stock market capitalization valuation.
• Supply Chain Effective Frontier: The balance of growth, profitability, cycle and complexity metrics to deliver the supply chain strategy. It may or may not maximize the company’s market valuation.
• Supply Chain Excellence: The behavior of companies working to maximize value through the setting of targets for supply chain financial ratios and aligning metrics that matter (tied to value chain strategy).
Definitions
#sciwebinar

Supply Chain Insights LLC Copyright © 2013, p. 18
A Look at History: Progress in Productivity
#sciwebinar
Supply Chain Insights LLC Copyright © 2013, p. 19
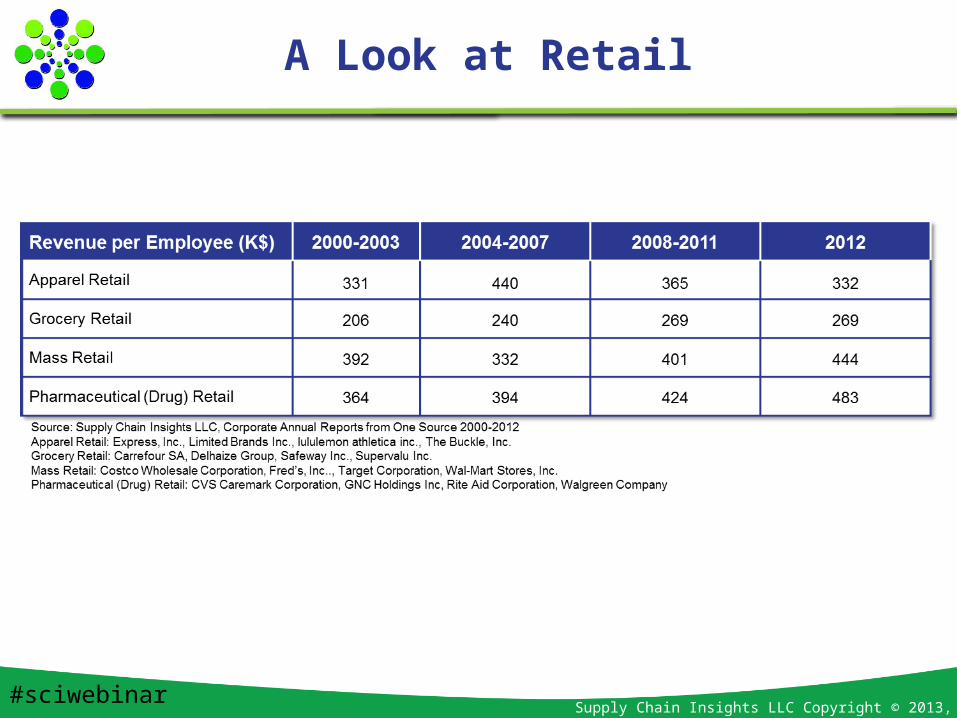
A Look at Retail
#sciwebinar
Supply Chain Insights LLC Copyright © 2013, p. 20
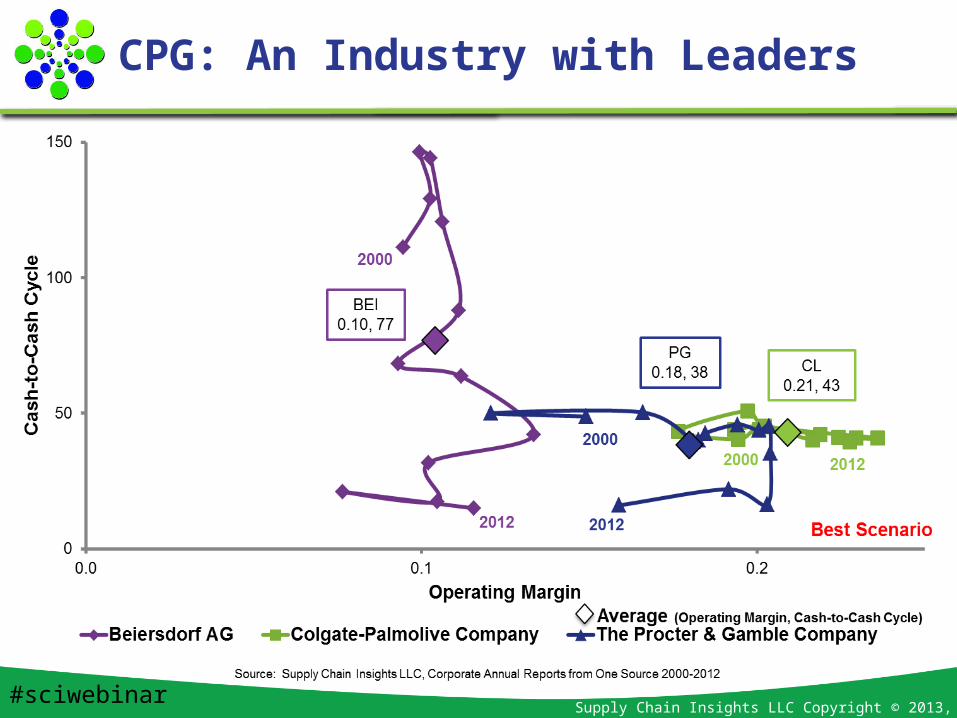
CPG: An Industry with Leaders
#sciwebinar

Supply Chain Insights LLC Copyright © 2013, p. 21
CPG: An Industry with Leaders
#sciwebinar
Supply Chain Insights LLC Copyright © 2013, p. 22
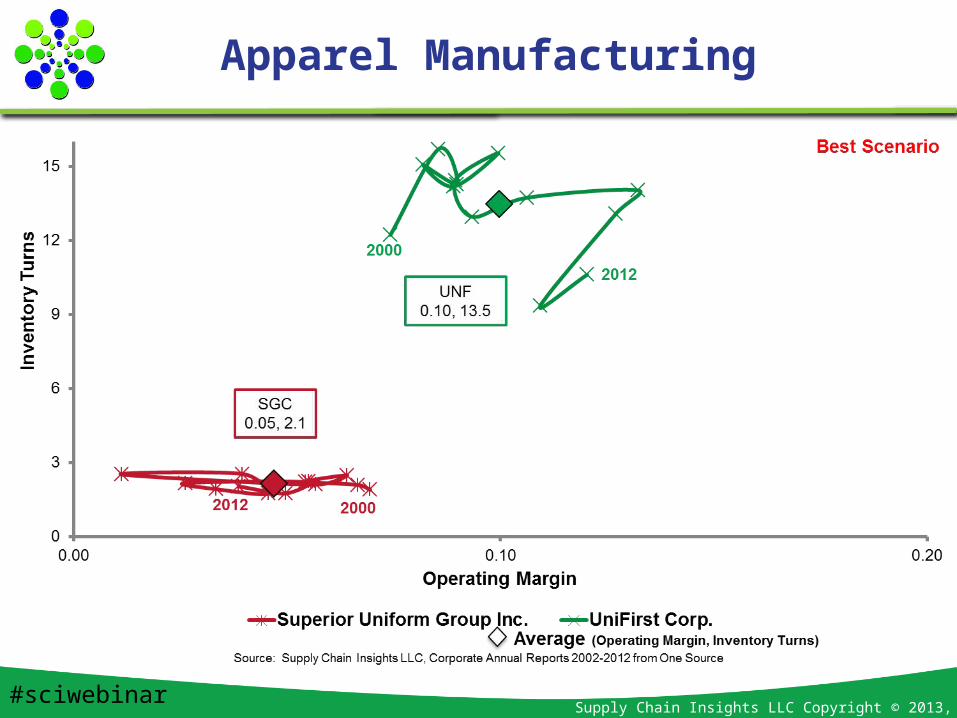
Apparel Manufacturing
#sciwebinar

Supply Chain Insights LLC Copyright © 2013, p. 23
Apparel Manufacturing
#sciwebinar

Supply Chain Insights LLC Copyright © 2013, p. 24
Apparel Manufacturing
#sciwebinar

Supply Chain Insights LLC Copyright © 2013, p. 25
Apparel Manufacturing
#sciwebinar

Supply Chain Insights LLC Copyright © 2013, p. 26
Apparel Stores
#sciwebinar

Supply Chain Insights LLC Copyright © 2013, p. 27
Apparel Stores
#sciwebinar
Supply Chain Insights LLC Copyright © 2013, p. 28
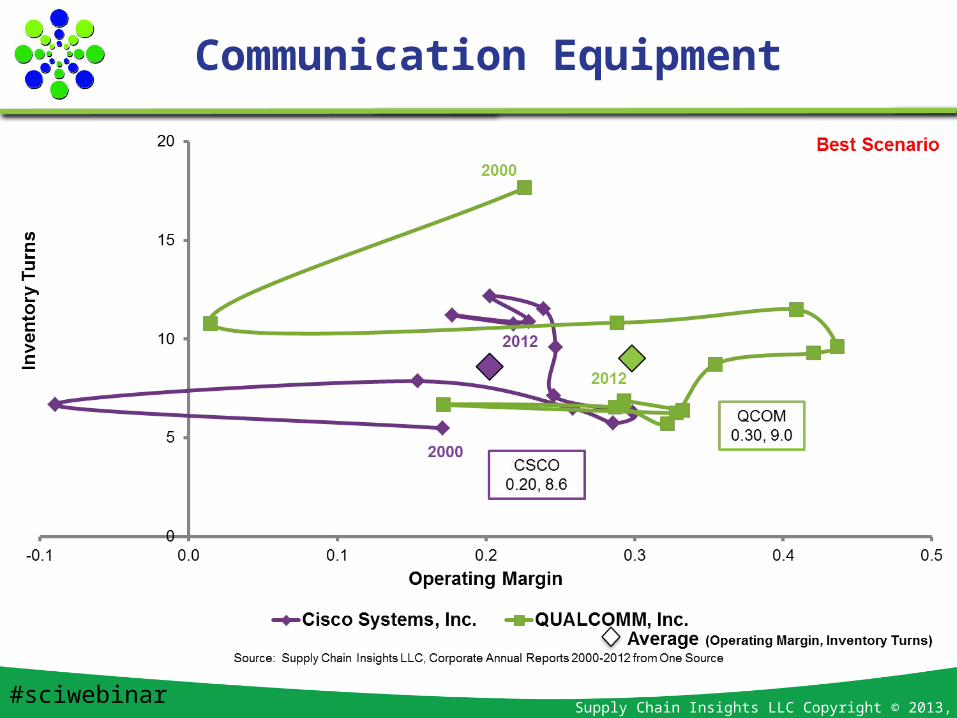
Communication Equipment
#sciwebinar

Supply Chain Insights LLC Copyright © 2013, p. 29
Communication Equipment
#sciwebinar

Supply Chain Insights LLC Copyright © 2013, p. 30
What Is Best in Class?
Understanding the Supply Chain as a Complex System
Which Companies Have Maximized Market Valuation Through Supply Chain Excellence?
Using the Insights
Agenda
#sciwebinar

Supply Chain Insights LLC Copyright © 2013, p. 31
Introducing the Supply Chain Index
A formulaic representation of how companies are trading off growth, profitability, cycle and
complexity performance on selected supply chain financial
metrics against market valuation.
#sciwebinar
Supply Chain Insights LLC Copyright © 2013, p. 32
1. To better understand which supply chain metrics matter to corporate balance sheet performance in public markets. We want to help leaders better align supply chain and financial performance.
2. To create an objective system for evaluating and ranking supply chains by industry peer group.
3. To connect financial performance with supply chain excellence as measured through quantitative surveys in an effort to better identify and define best practices across industry groups.
Why Did We Do This?
#sciwebinar

Supply Chain Insights LLC Copyright © 2013, p. 33
• What it is: A way to understand the impact of companies’ supply chain (relative to peers within an industry sector) to market capitalization based a set of preselected supply chain ratio metrics.
• What it is NOT: A way to evaluate overall company performance or compare the model results to actual market capitalization.
What It Is. What It Is Not.
#sciwebinar

Supply Chain Insights LLC Copyright © 2013, p. 34
• July, August: release of results for additional industries and discussion in Supply Chain Insights Community
• Monthly Webinars (August 29)
• Monthly Reports (July 9, August 13)
• September 11-12th: 1st annual Global Summit with speakers selected based on Index performance
What to Look Forward to?
#sciwebinar

Supply Chain Insights LLC Copyright © 2013, p. 35
Selected 13 Core Supply Chain Ratios to Study
Financial Metrics
Growth Profitability Cycle ComplexityCommon Shares Cash Cash-to-Cash Cycle Altman Z
Employee Growth Cash Change in Period Days of Finished Goods Capital Turnover
Employees Cash on Hand Days of Inventory Current Ratio
Market Capitalization Cash Ratio TTM Days of Payables Outstanding Quick Ratio
R&D Margin Cash Ratio Quarter Days of Raw Materials Return on Assets
R&D Ratio Cash Ratio Year Days of Sales Outstanding Return on Equity
R&D to COGS Ratio Cost of Goods Sold Days of Work in Progress Return on Invested Capital
Revenue EBITDA DPO/DSO Return on Net Assets
Revenue Growth Free Cash Flow Ratio Finished Goods Inventory Revenue per Employee
Revenue Growth TTM Gross Margin Inventory Working Capital Ratio
Revenue TTM Gross Profit Inventory Turns
SG&A Margin Net Profit Margin Receivables Turns
SG&A Ratio Operating Cash Flow Ratio Raw Materials Inventory
SG&A to COGS Ratio Operating Margin Work in Progress Inventory
OPEX Ratio
Pretax Margin
Source: Supply Chain Insights LLC
#sciwebinar
Selected Ratios

Supply Chain Insights LLC Copyright © 2013, p. 36
Summary of Progress
#sciwebinar

Supply Chain Insights LLC Copyright © 2013, p. 37
0.2 0.3 0.4 0.5 0.6 0.7 0.8 0.9 10
2
4
6
8
10
12
Luxury Goods
Discount Stores
Medical Distribution
Medical Care
Household & Personal Products
Chemical
Drug Manufacturers- Major
Medical Instruments & Supplies
Medical Devices
Computer SystemsApparel Manufacturing
Apparel Stores
Packaged Food
Drug Manufacturers- Specialty & Generic
Communication Equipment
R^2 Value
Y-I
nte
rcep
t
Y-Intercept & Value
Source: Supply Chain Insights LLC
#sciwebinar
Supply Chain Insights LLC Copyright © 2013, p. 38
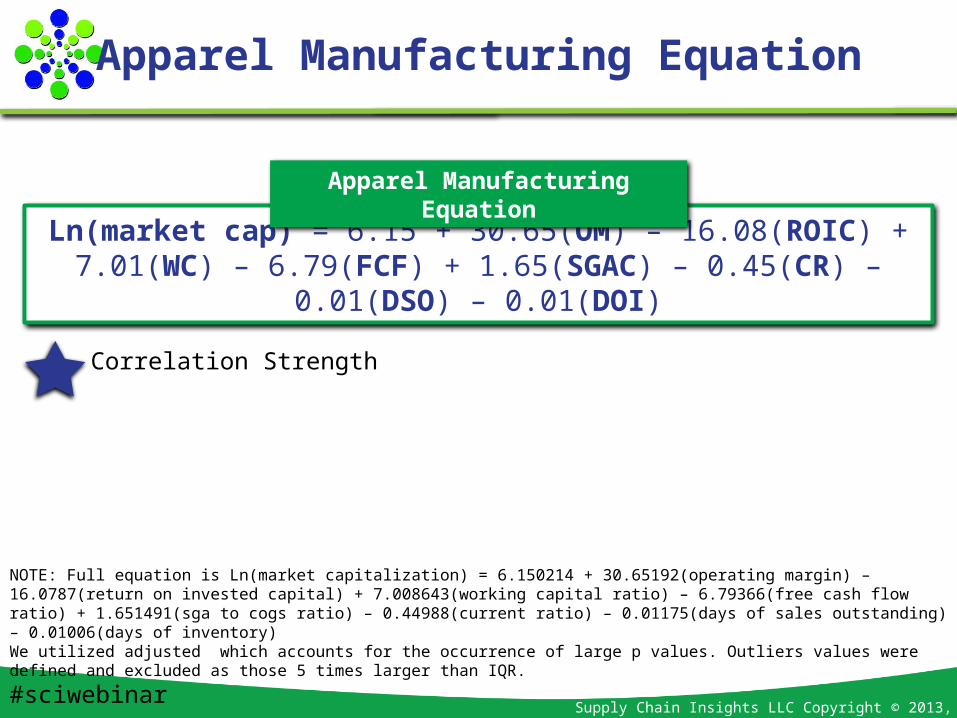
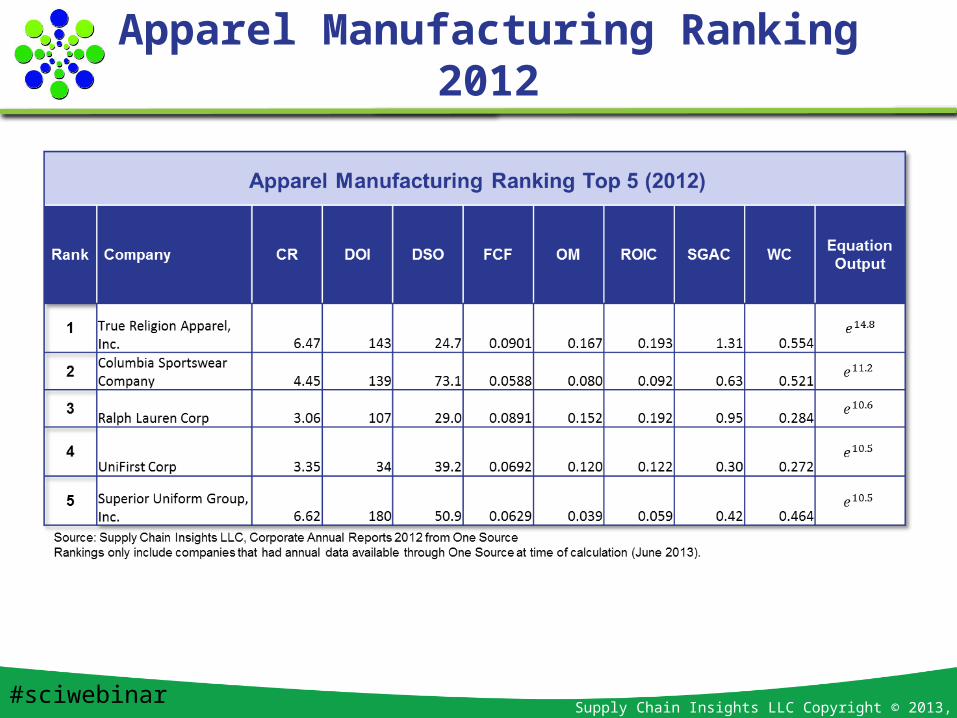
Apparel Manufacturing Equation
Ln(market cap) = 6.15 + 30.65(OM) – 16.08(ROIC) + 7.01(WC) – 6.79(FCF) + 1.65(SGAC) – 0.45(CR) – 0.01(DSO) – 0.01(DOI)
Correlation Strength
NOTE: Full equation is Ln(market capitalization) = 6.150214 + 30.65192(operating margin) – 16.0787(return on invested capital) + 7.008643(working capital ratio) – 6.79366(free cash flow ratio) + 1.651491(sga to cogs ratio) – 0.44988(current ratio) – 0.01175(days of sales outstanding) – 0.01006(days of inventory)We utilized adjusted which accounts for the occurrence of large p values. Outliers values were defined and excluded as those 5 times larger than IQR.
Apparel Manufacturing Equation
#sciwebinar
Supply Chain Insights LLC Copyright © 2013, p. 39
Apparel Manufacturing Ranking 2012
#sciwebinar

Supply Chain Insights LLC Copyright © 2013, p. 40
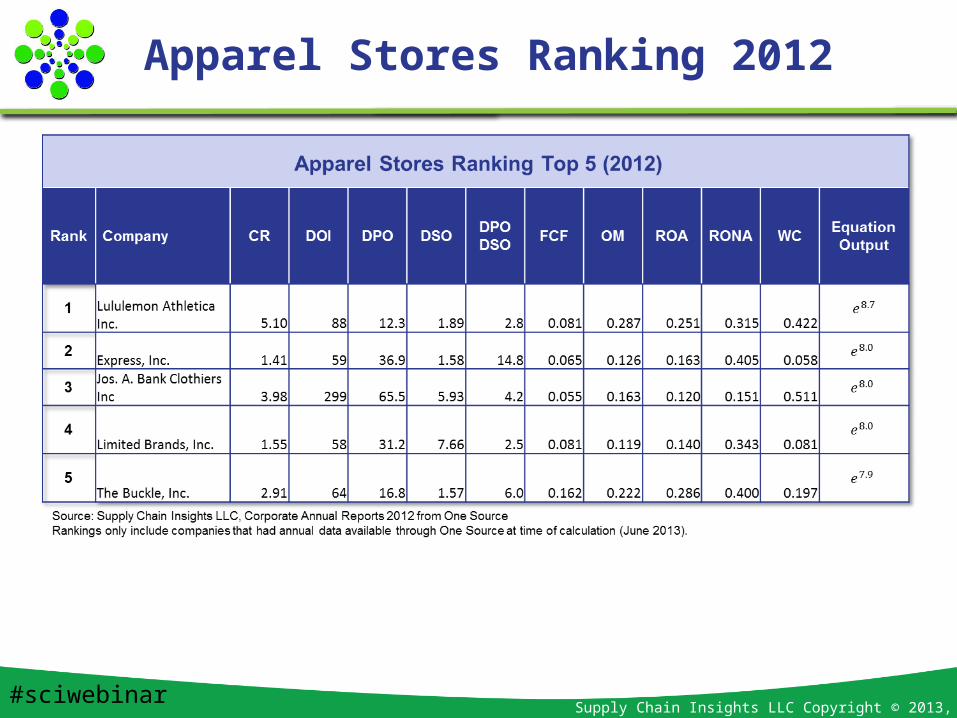
Apparel Stores Equation
Ln(market cap) = 6.98 + 11.49(OM) – 7.19(ROA) + 4.77(WC) + 3.96(RONA) – 2.87(FCF) – 0.44(CR) -0.04(DSO) – 0.04(DPODSO)
+ 0.02(DPO) – 0.01(DOI)
Correlation Strength
NOTE: Full equation is Ln(market capitalization) = 6.983261 + 11.49445(operating margin) – 7.19005(return on assets) + 4.774818(working capital ratio) + 3.956711(return on net assets) – 2.86895(free cash flow ratio) – 0.44084(current ratio) -0.0425(days of sales outstanding) – 0.03859(dpo/dso) + 0.018544(days of payables outstanding) – 0.00652(days of inventory) We utilized adjusted which accounts for the occurrence of large p values. Outliers values were defined and excluded as those 5 times larger than IQR.
Apparel Stores Equation
#sciwebinar
Supply Chain Insights LLC Copyright © 2013, p. 41
Apparel Stores Ranking 2012
#sciwebinar

Supply Chain Insights LLC Copyright © 2013, p. 42
Computer Systems Equation
Ln(market cap) = 6.59 – 4.54(ROA) + 3.82(OM) + 3.08(FCF) + 2.19(RONA) + 2.05(WC) + 1.67(DPODSO) – 0.45(CR) – 0.01(DOI)
– 0.01(DPO)
Correlation Strength
NOTE: Full equation is Ln(market capitalization) = 6.594429 – 4.540524 (Return on Assets) + 3.821219 (Operating Margin) + 3.082302 (Free Cash Flow Ratio) + 2.188873 (Return on Net Assets) + 2.050960 (Working Capital Ratio) + 1.672430 (DPO/DSO Ratio) – 0.449033 (Current Ratio) – 0.011581 (Days of Inventory) – 0.010802 (Days of Payables Outstanding)We utilized adjusted which accounts for the occurrence of large p values. Outliers values were defined and excluded as those 5 times larger than IQR.
Computer Systems Equation
#sciwebinar

Supply Chain Insights LLC Copyright © 2013, p. 43
Computer Systems Ranking 2012
#sciwebinar

Supply Chain Insights LLC Copyright © 2013, p. 44
Communication Equipment Equation
Ln(market cap) = 9.32 – 0.38(CR) – 0.01(DOI) + 0.03(DPO) – 0.04(DSO) – 3.10(DPODSO) + 3.79(OM) – 1.04(SGAC) + 3.09(WC)
Correlation Strength
NOTE: Full equation is Ln(market capitalization) = 9.3169024 – 0.3787264 (Current Ratio) – 0.0099324 (Days of Inventory) + 0.0340425 (Days of Payables Outstanding) – 0.0405110 (Days of Sales Outstanding) – 3.0954322 (DPO/DSO Ratio) + 3.7885751 (Operating Margin) – 1.0383185 (SG&A to COGS Ratio) + 3.0910721 (Working Capital Ratio)We utilized adjusted which accounts for the occurrence of large p values. Outliers values were defined and excluded as those 5 times larger than IQR.
Communication Equipment Equation
#sciwebinar

Supply Chain Insights LLC Copyright © 2013, p. 45
Communication Equipment Ranking 2012
#sciwebinar
Supply Chain Insights LLC Copyright © 2013, p. 46
What Is Best in Class?
Understanding Supply Chain as a Complex System
Which Companies Have Maximized Market Valuation Through Supply Chain Excellence?
Using the Insights
Agenda
#sciwebinar

Supply Chain Insights LLC Copyright © 2013, p. 47
Apparel Value Chain
Apparel StoresApparel
Manufacturing
Equations:Ln(market cap) =
6.98 + 11.49(OM)
– 7.19(ROA) + 4.77(WC)
+ 3.96(RONA) – 2.87(FCF) – 0.44(CR)
– 0.04(DSO) – .039(DPODSO)
+ 0.02(DPO) – 0.01(DOI)
6.15 + 30.65(OM)
– 16.08(ROIC) + 7.01(WC) – 6.79(FCF)
+ 1.65(SGAC) – 0.45(CR) – 0.01(DSO) – 0.01(DOI)
True collaboration only happens when there is a sustaining win-win value proposition.
#sciwebinar

Supply Chain Insights LLC Copyright © 2013, p. 48
Step 1: Located data sources
Step 2: Selected core supply chain ratios from over 50 financial metrics
Step 3: Identified meaningful metrics per industry using regression analysis among selected ratios
Step 4: Constructed industry equation based on correlation of industry metrics to market capitalization values
Step 5: Determined company rankings within industry by applying 2012 company results to industry equation
Step 6: Analyze peer group companies over the last decade
Step 7: Correlate Supply Chain Index findings to supply chain practices, technologies and organizational design
Our Next Steps: Supply Chain Index Methodology
#sciwebinar

Supply Chain Insights LLC Copyright © 2013, p. 49
• What drives value in each industry is different.
• Financial markets reward supply chain balance and alignment.
• The supply chain is a complex system. Supply chain excellence must be carefully defined.
• Relationships should be built upon cross-industry definitions of value to create win-win relationships.
• There is no substitute for leadership.
• Supply chain excellence matters.
Summary
#sciwebinar

Supply Chain Insights LLC Copyright © 2013, p. 50
1. Join the Supply Chain Index Group in the Supply Chain Insights Community for Peer Review and Discussion: www.scicommunity.com
2. Gain Insights from Supply Chain Leaders at the Global Summit www.supplychaininsightsglobalsummit.com
3. Build the Next Generation of Supply Chain Research Using the Index
4. Leverage the Index to Connect Supply Chain Processes, People and Technology Decisions to Balance Sheet Results
What You Can Do
#sciwebinar

Supply Chain Insights LLC Copyright © 2013, p. 51
Join Us!
www.supplychaininsightsglobalsummit.com
#sciwebinar
Supply Chain Insights LLC Copyright © 2013, p. 52
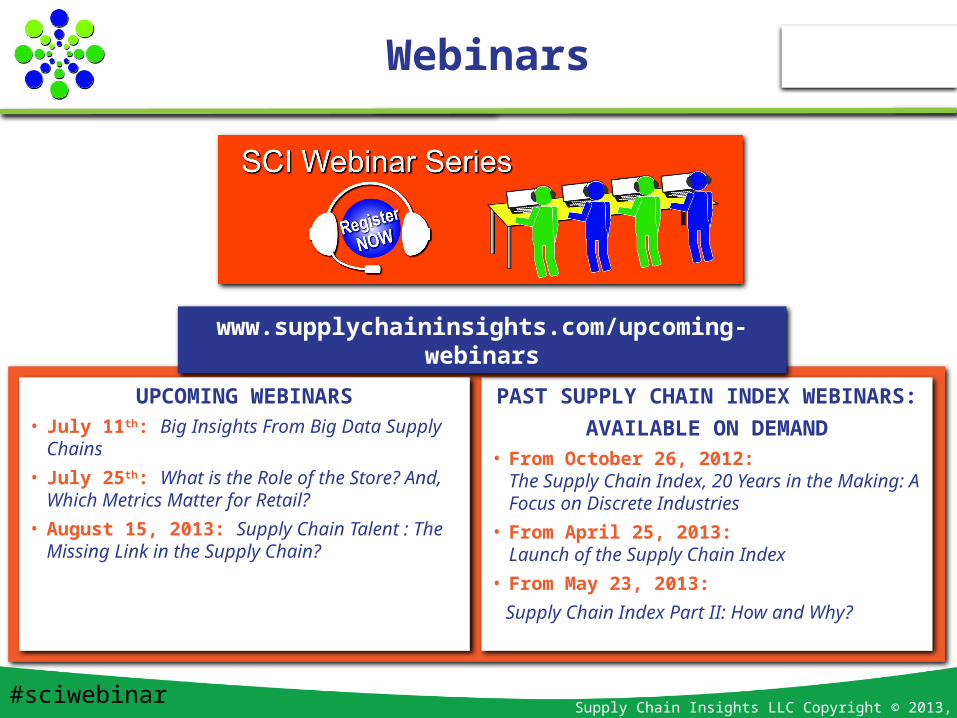
PAST SUPPLY CHAIN INDEX WEBINARS:
AVAILABLE ON DEMAND• From October 26, 2012:
The Supply Chain Index, 20 Years in the Making: A Focus on Discrete Industries
• From April 25, 2013: Launch of the Supply Chain Index
• From May 23, 2013:
Supply Chain Index Part II: How and Why?
Webinars
www.supplychaininsights.com/upcoming-webinars
#sciwebinar
UPCOMING WEBINARS• July 11th: Big Insights From Big Data Supply
Chains
• July 25th: What is the Role of the Store? And, Which Metrics Matter for Retail?
• August 15, 2013: Supply Chain Talent : The Missing Link in the Supply Chain?

Supply Chain Insights LLC Copyright © 2013, p. 53
Supply Chain Insights Community
#sciwebinar

Supply Chain Insights LLC Copyright © 2013, p. 54
Who Is Lora?
• Founder of Supply Chain Insights
• Partner at Altimeter Group (leader in open research)
• 7 years of Management Experience leading Analyst Teams at Gartner and AMR Research
• 8 years Experience in Marketing and Selling Supply Chain Software at Descartes Systems Group and Manugistics (now JDA)
• 15 Years Leading teams in Manufacturing and Distribution operations for Clorox, Kraft/General Foods, Nestle/Dreyers Grand Ice Cream and Procter & Gamble. #sciwebinar
Supply Chain Insights LLC Copyright © 2013, p. 55
Where Do You Find Lora?
Contact Information: [email protected]
Blog: www.supplychainshaman.com (4000 pageviews/month)
Twitter: lcecere 3850 followers. Rated as a top rated supply chain social network user.
LinkedIn: linkedin.com/pub/lora-cecere/0/196/573 (3750 in the network)
#sciwebinar
Supply Chain Insights LLC Copyright © 2013, p. 56
Where Do You Find Abby?
#sciwebinar
Contact Information: [email protected]
Blog: www.supplychainindex.com (2600 pageviews/month)
Twitter: @indexgirl
LinkedIn: www.linkedin.com/pub/abby-mayer/40/941/972