Embed Size (px)
DESCRIPTION
If you’re being methodical about growth, analytics matters. For startups, analytics is about measuring the right metric, in the right way, to produce the change the business needs most at that point in time. That’s harder than it sounds: you need a solid understanding of your business model; an awareness of what’s most at risk; and a clear idea of where to draw the line between success and failure. Metrics measure not only the health of your business, but also your journey to product/market fit; the value of your company; and the reliability of your underlying infrastructure. Join Lean Analytics co-author Alistair Croll for an all-day, in-depth look at analytics, measurement, and working with data. We’ll cover: The five stages of growth every company goes through, and how they guide your choice of metrics Six business-model archetypes and their unique measurement challenges What “good enough” looks like for fundamental metrics How to think about cohorts, segments, percentiles, and histograms Measuring and aggregating infrastructure KPIs such as latency and availability Using the Lean Analytics cycle to improve through experimentation This workshop is relevant for people working in standalone startups and for corporate entrepreneurs. It will combine presentations, case studies, and interactive discussion of the audience’s specific measurement challenges. Attendees need not be technical but should come armed with a basic understanding of web analytics, business metrics, and their current business model, plus a willingness to share with one another.
Citation preview
Lean Analytics
Lean Startup Conference December, 2015
@acroll

Some housekeeping.
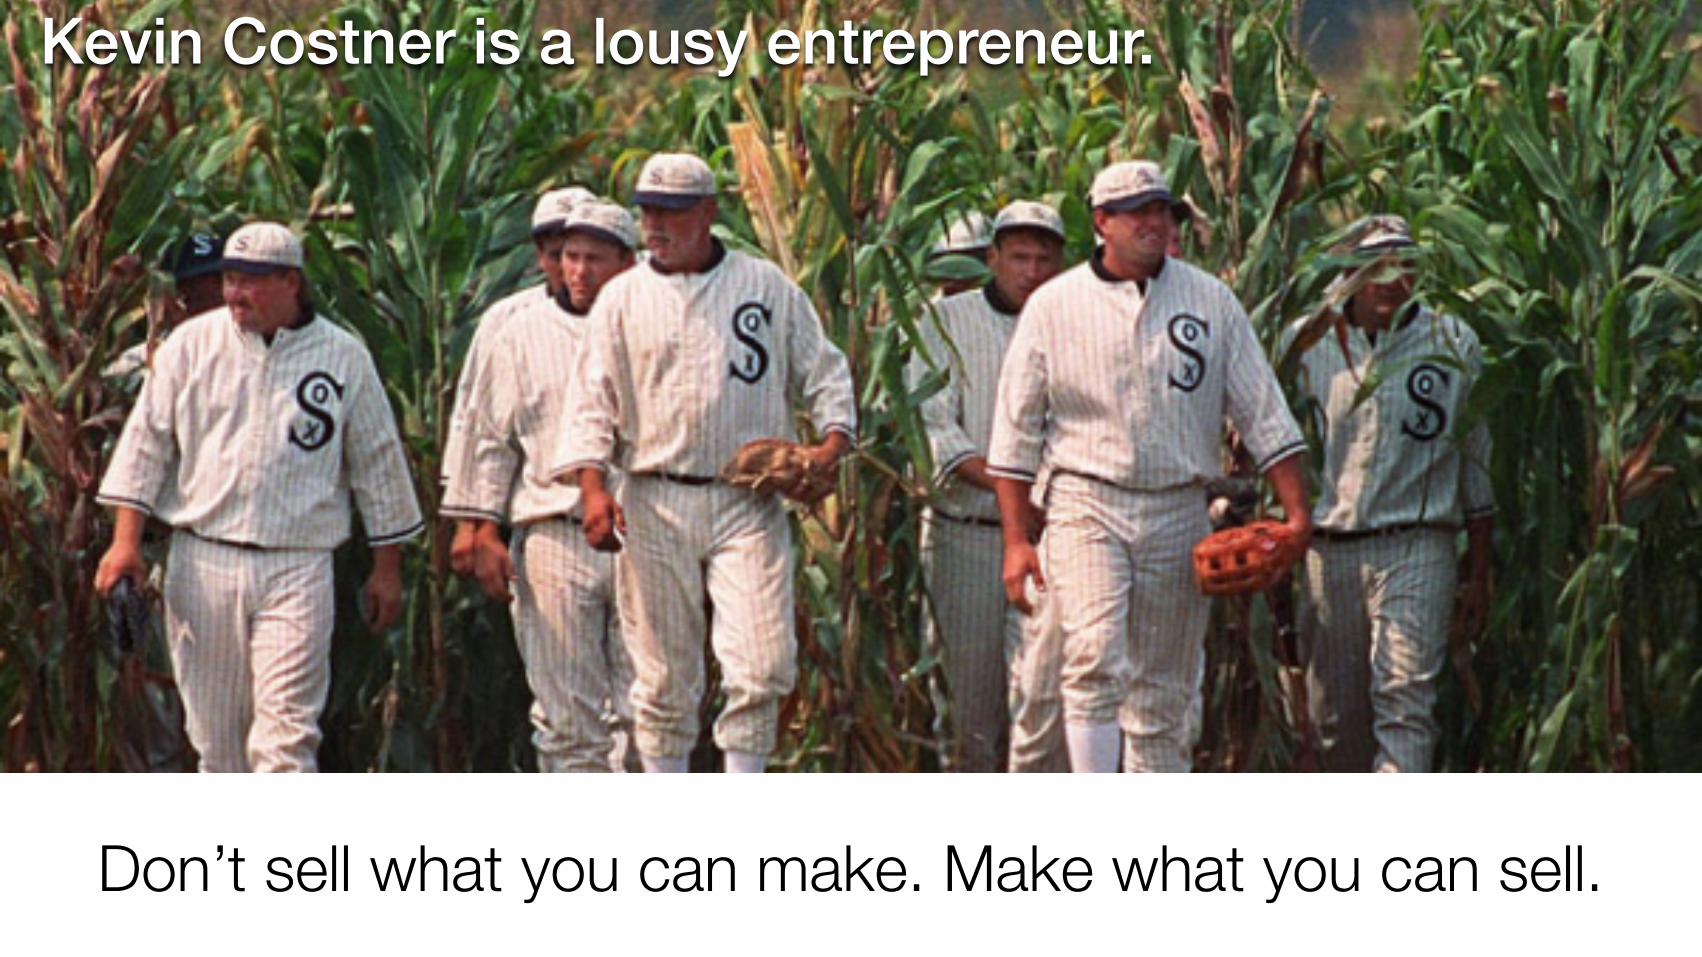
Don’t sell what you can make. Make what you can sell.
Kevin Costner is a lousy entrepreneur.
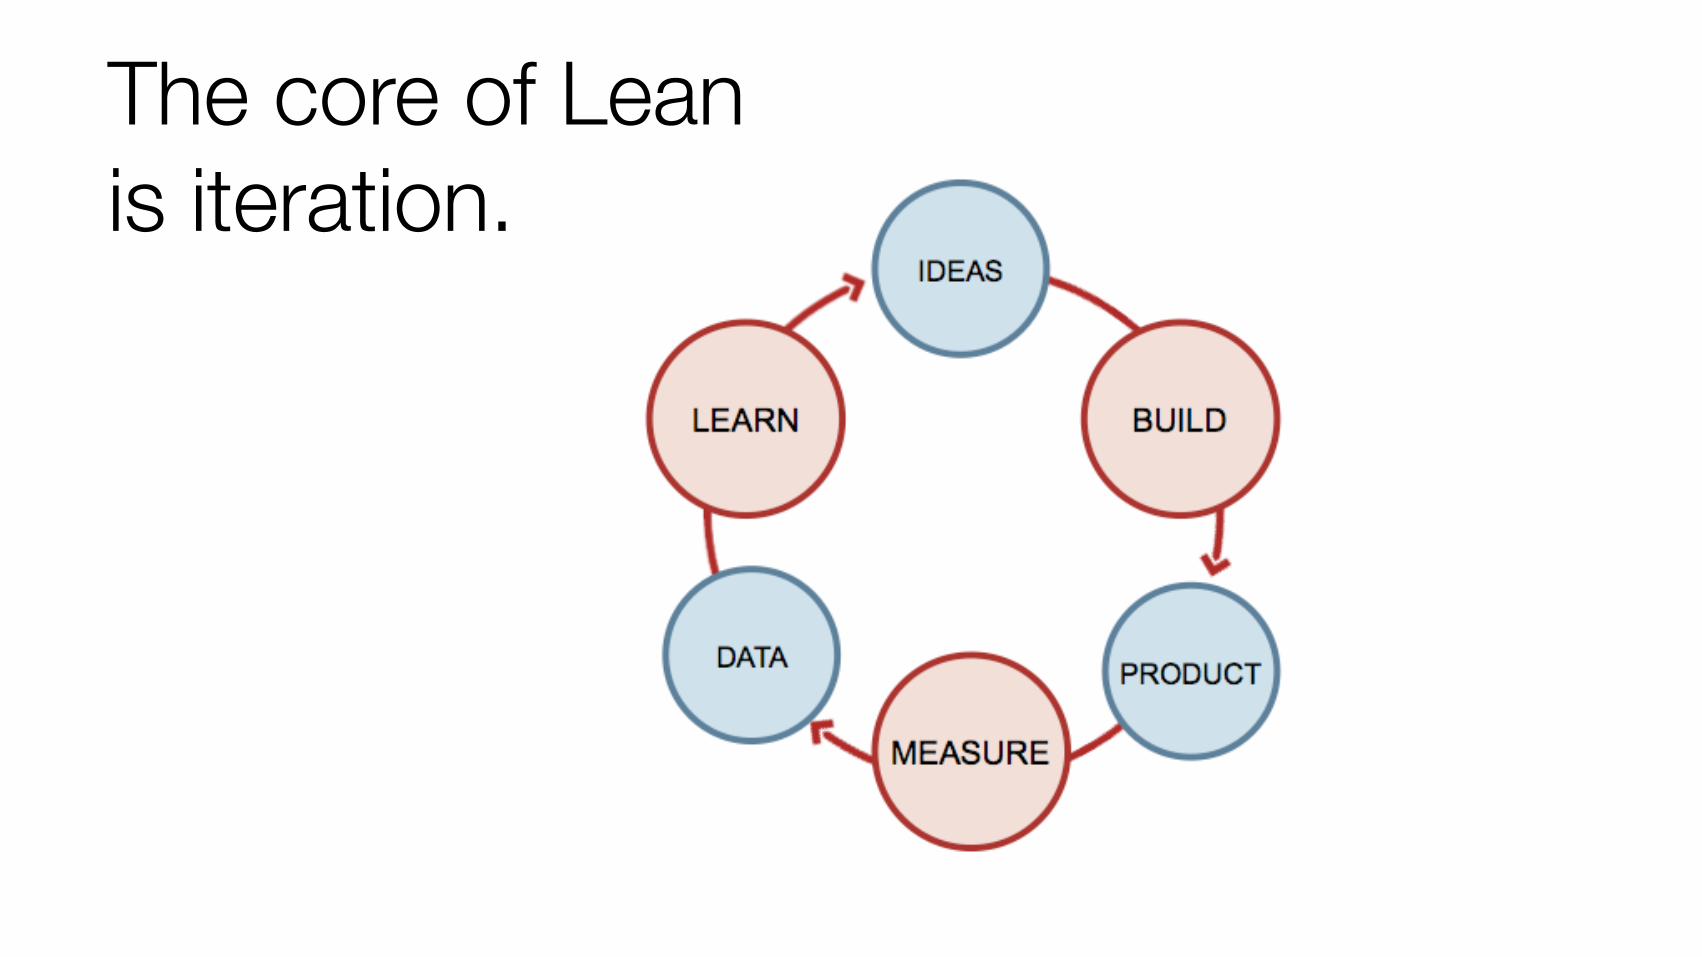
The core of Lean is iteration.
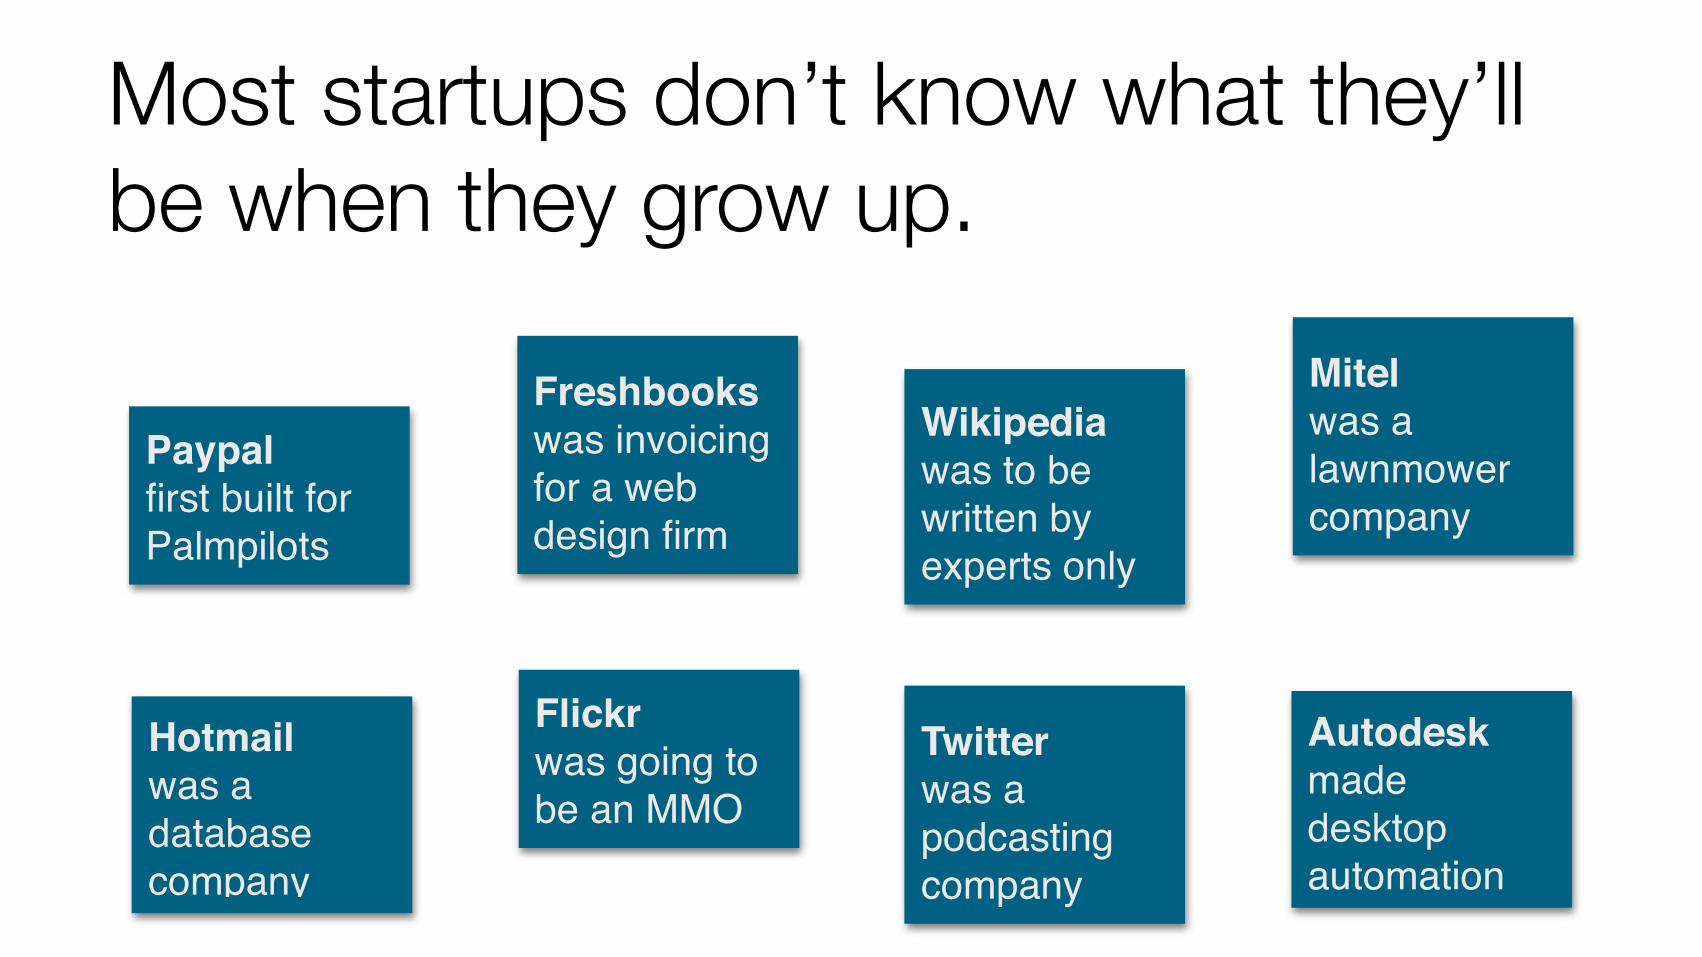
Most startups don’t know what they’ll be when they grow up.
Hotmailwas a database company
Flickrwas going to be an MMO
Twitter was a podcasting company
Autodesk made desktop automation
Paypalfirst built for Palmpilots
Freshbookswas invoicing for a web design firm
Wikipedia was to be written by experts only
Mitelwas a lawnmower company
Waterfall, agile, and lean(Why the old ways don’t work.)
Waterfall approachYou know the problem and the solution.
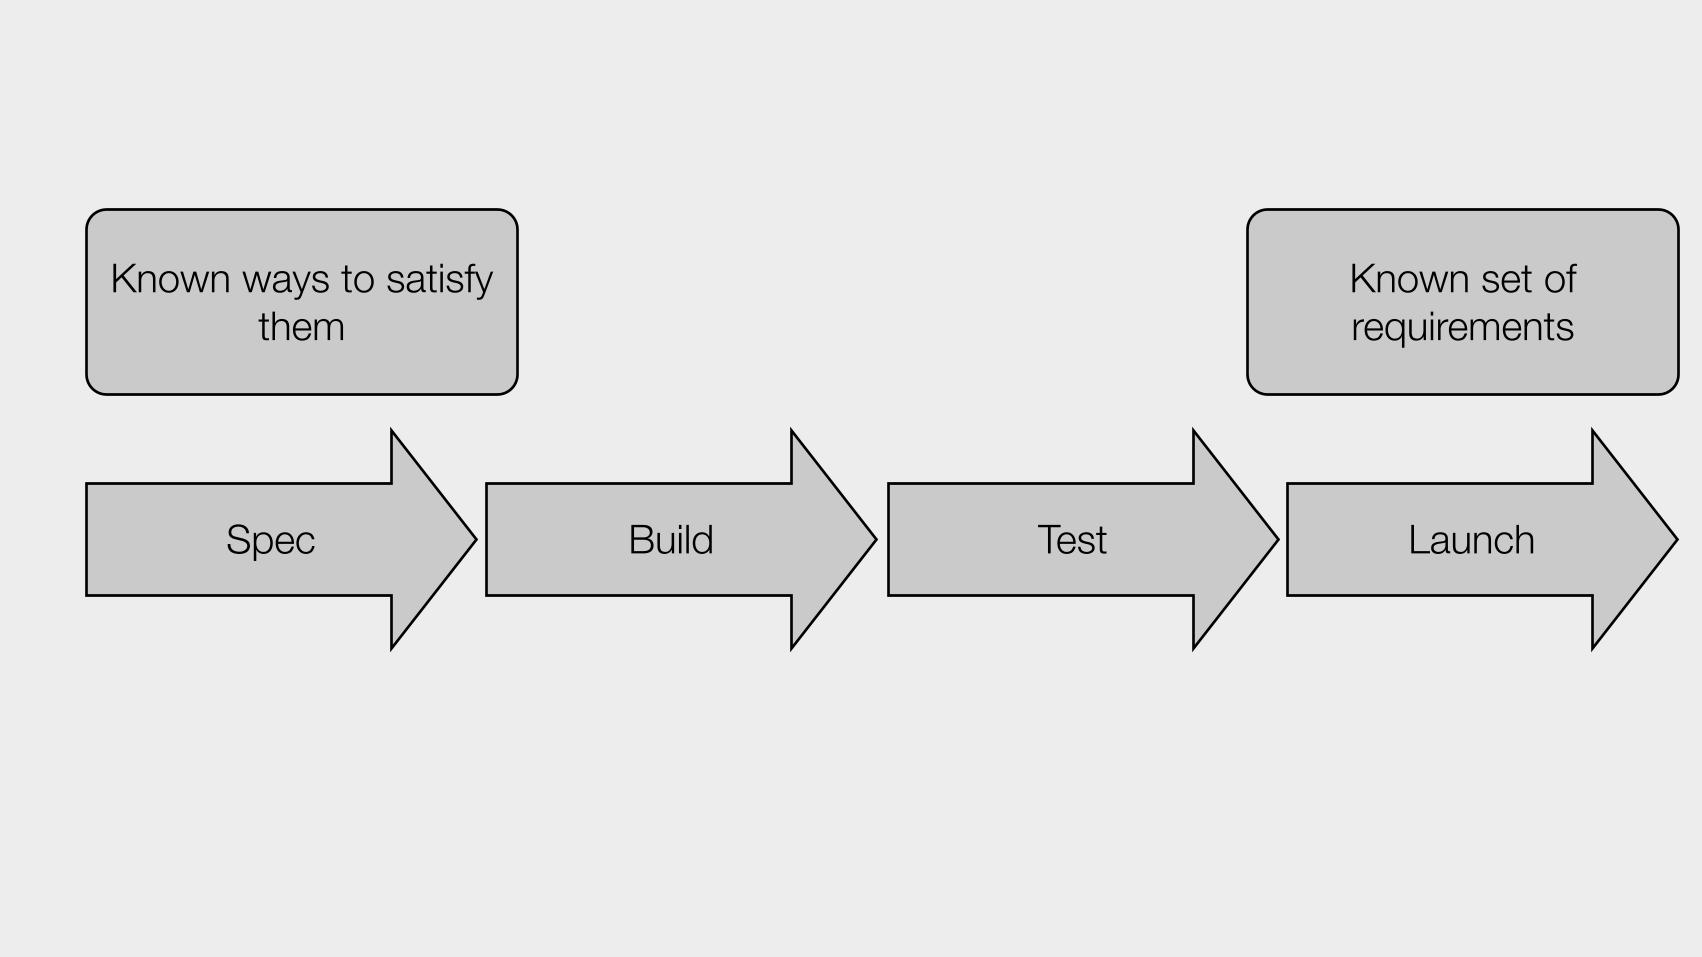
Known set of requirements
Known ways to satisfy them
Spec Build Test Launch
Agile methodologies
Know the problem, find the solution

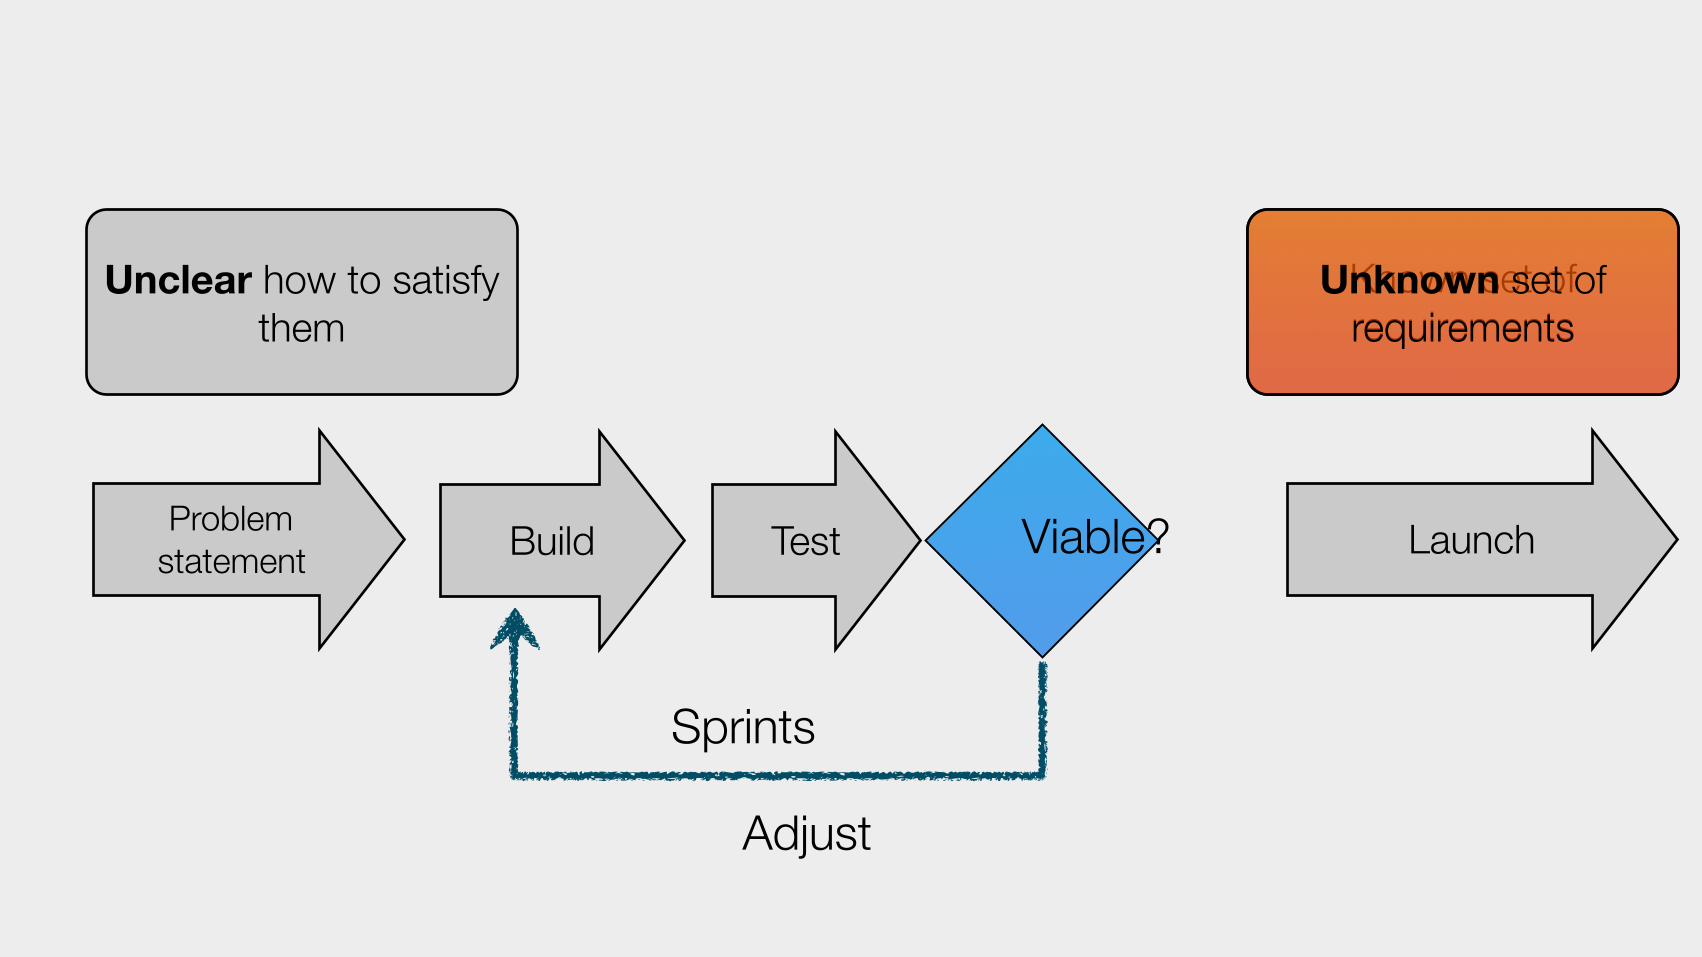
Known set of requirements
Unclear how to satisfy them
Build Test LaunchViable?Problemstatement
Adjust
Sprints
Unknown set of requirements
Lean approach
First, know that you don’t know.
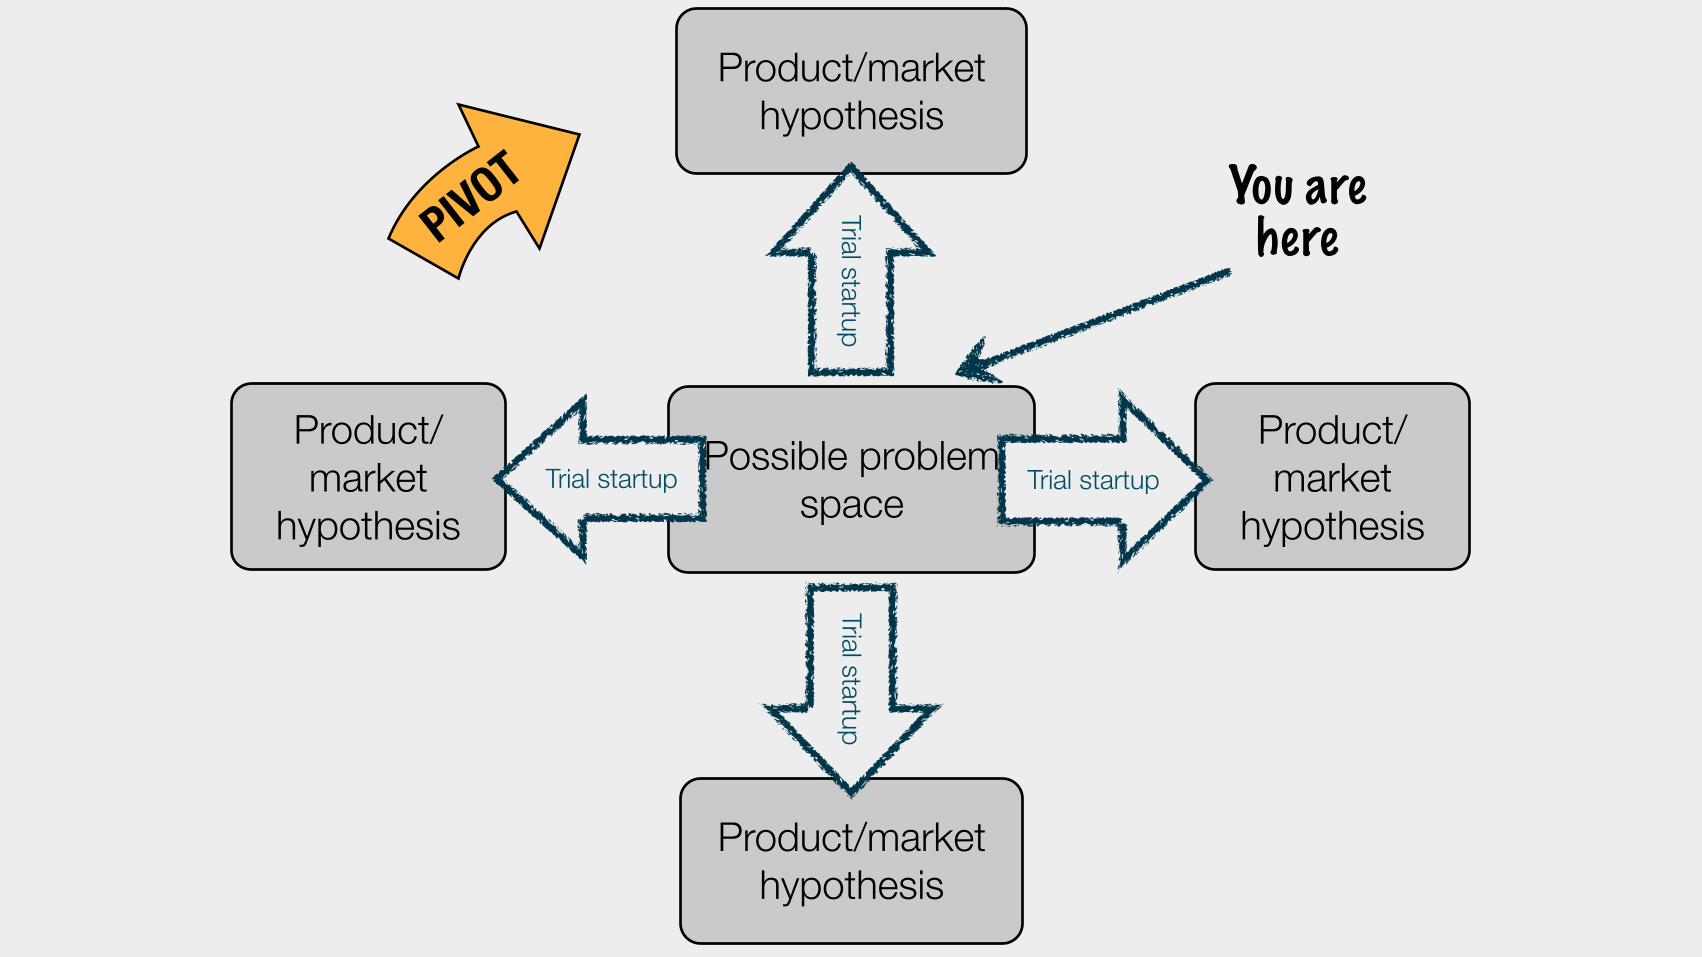
Possible problem space
Product/market
hypothesisTrial startup
Product/market
hypothesisTrial startup
Product/market hypothesis
Trial startup
Product/market hypothesis
Trial startup
You are herePIVOT
Why now?
First: High rate of change of digital technologies & channels.
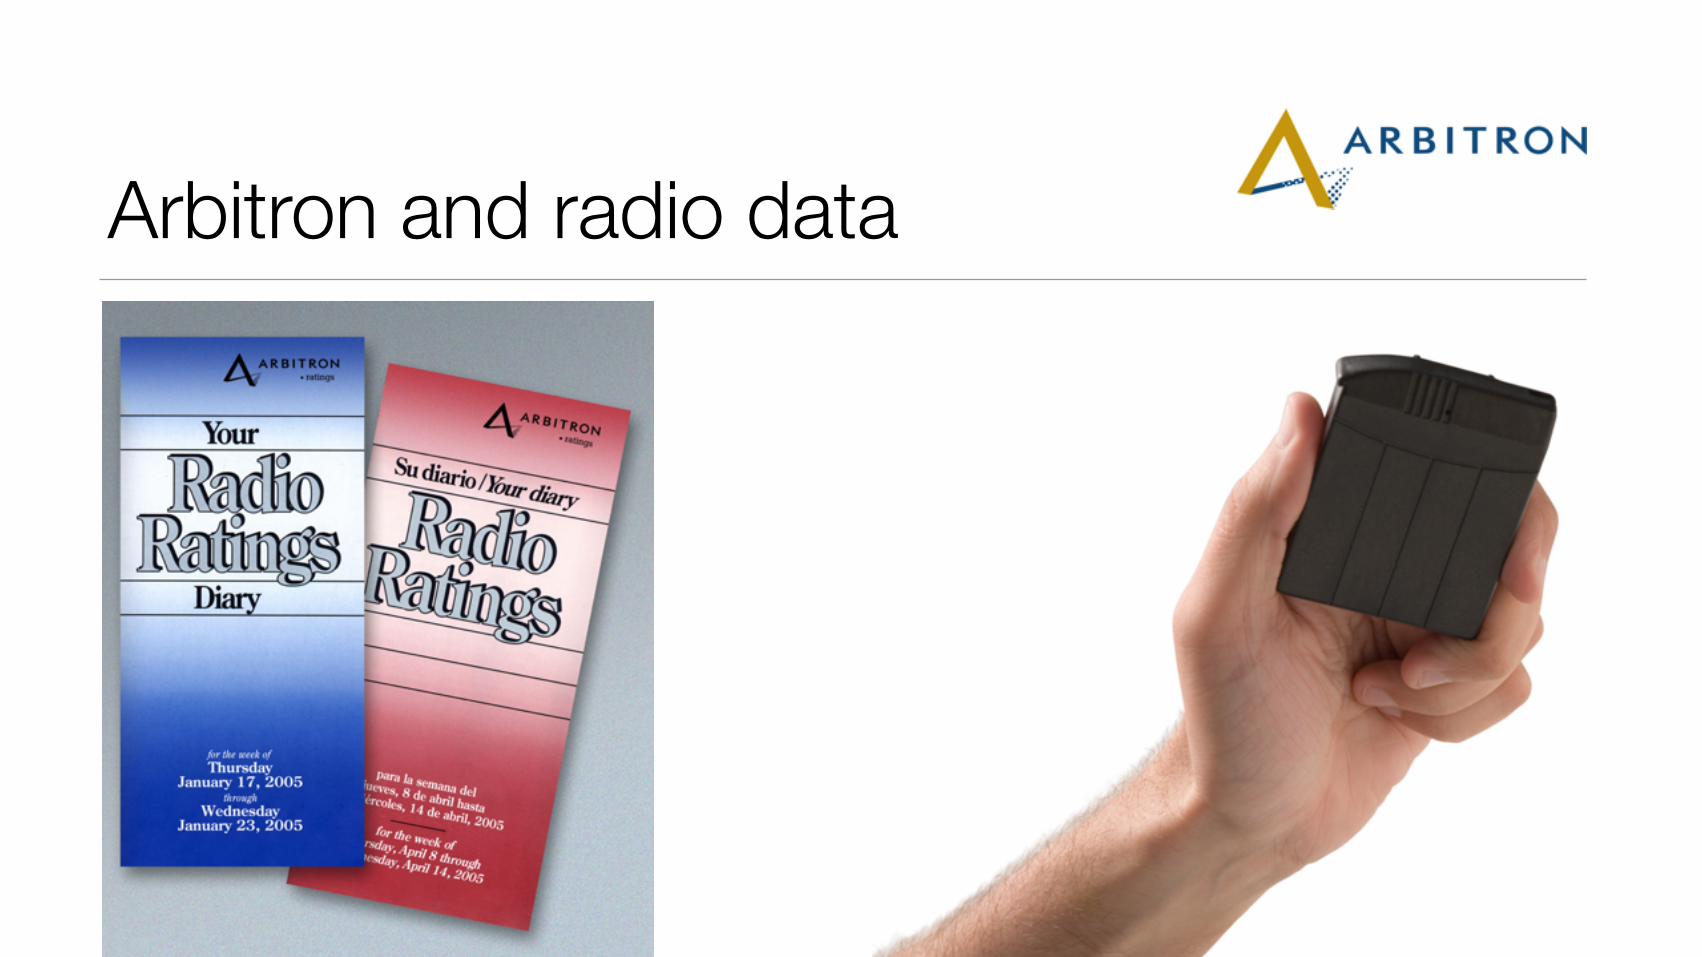
Arbitron and radio data
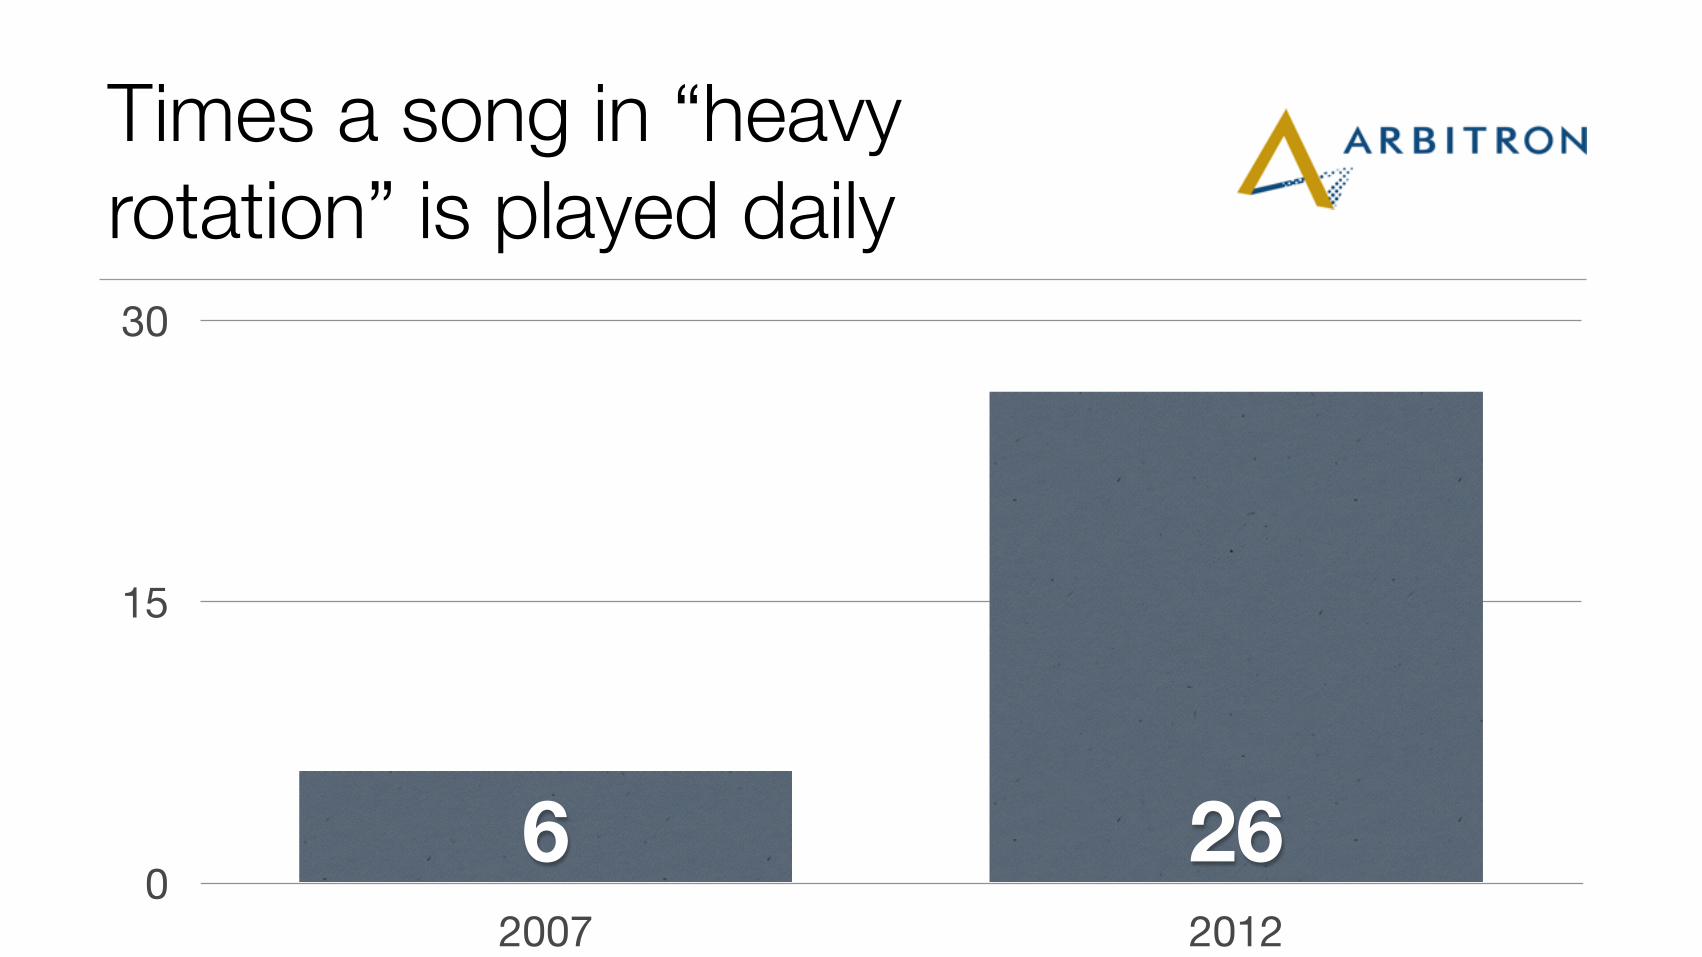
Times a song in “heavy rotation” is played daily
0
15
30
2007 2012
266
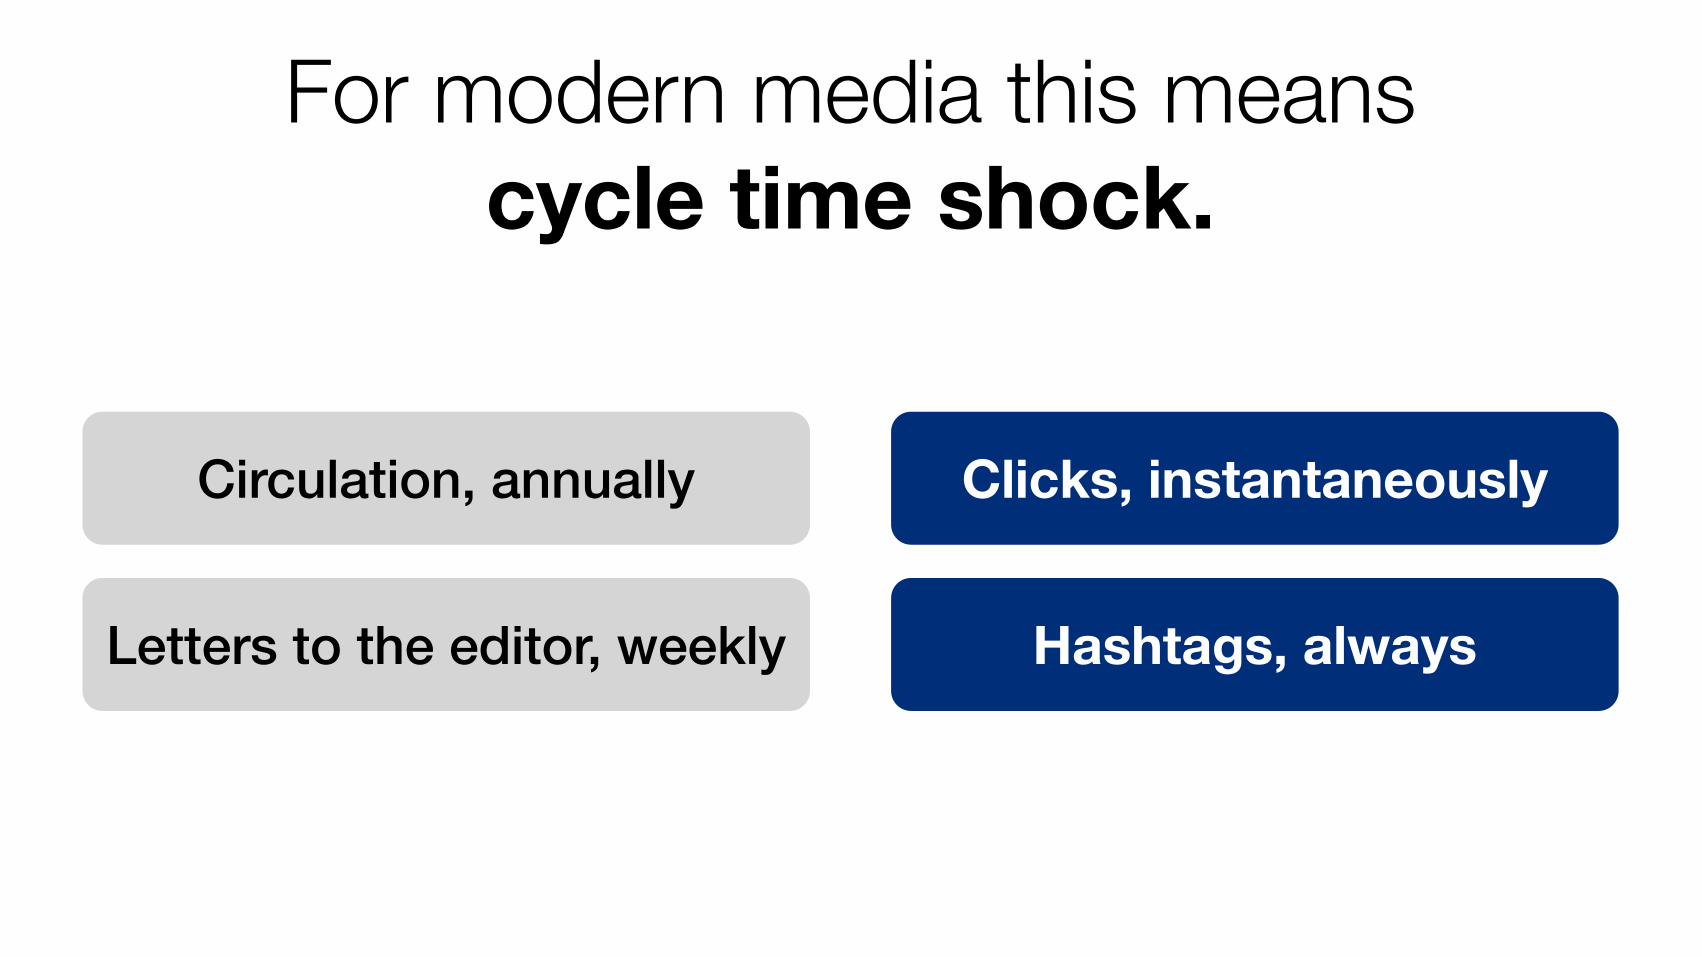
For modern media this means cycle time shock.
Circulation, annually Clicks, instantaneously
Letters to the editor, weekly Hashtags, always
Why now?
Second: It’s no longer about whether you can build it—it’s about whether
anyone will care.
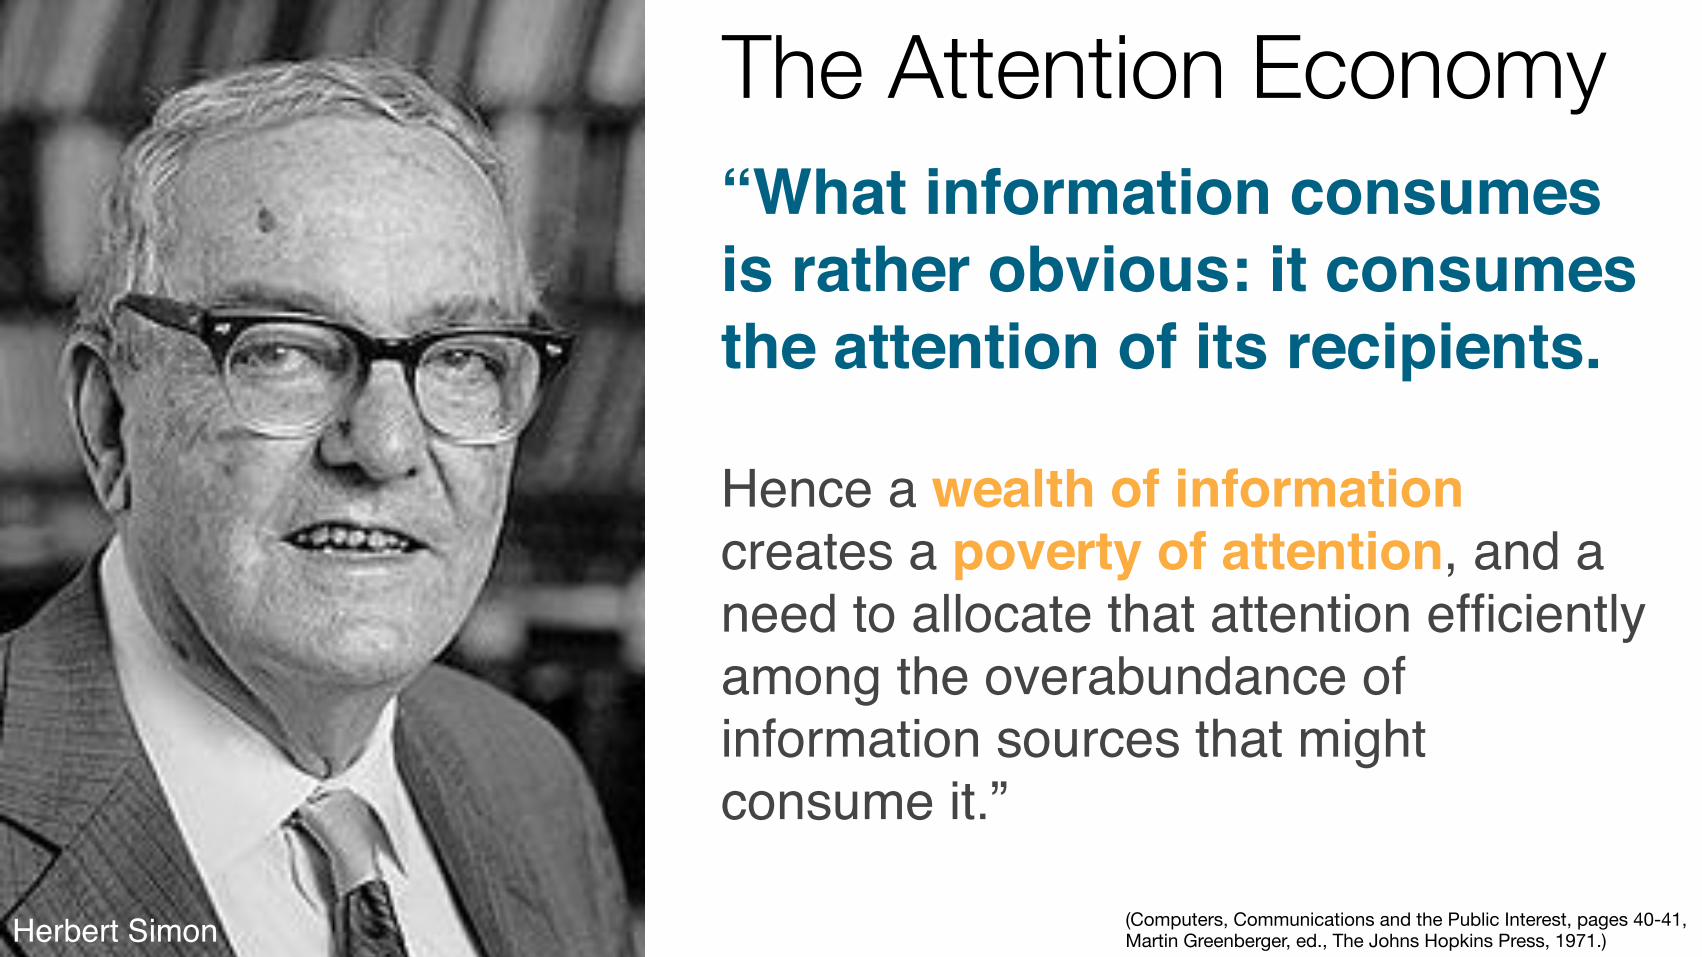
The Attention Economy“What information consumes is rather obvious: it consumes the attention of its recipients.
Hence a wealth of information creates a poverty of attention, and a need to allocate that attention efficiently among the overabundance of information sources that might consume it.”
(Computers, Communications and the Public Interest, pages 40-41, Martin Greenberger, ed., The Johns Hopkins Press, 1971.)Herbert Simon

Lit motors tests the risky part

Unfortunately, we’re all liars.
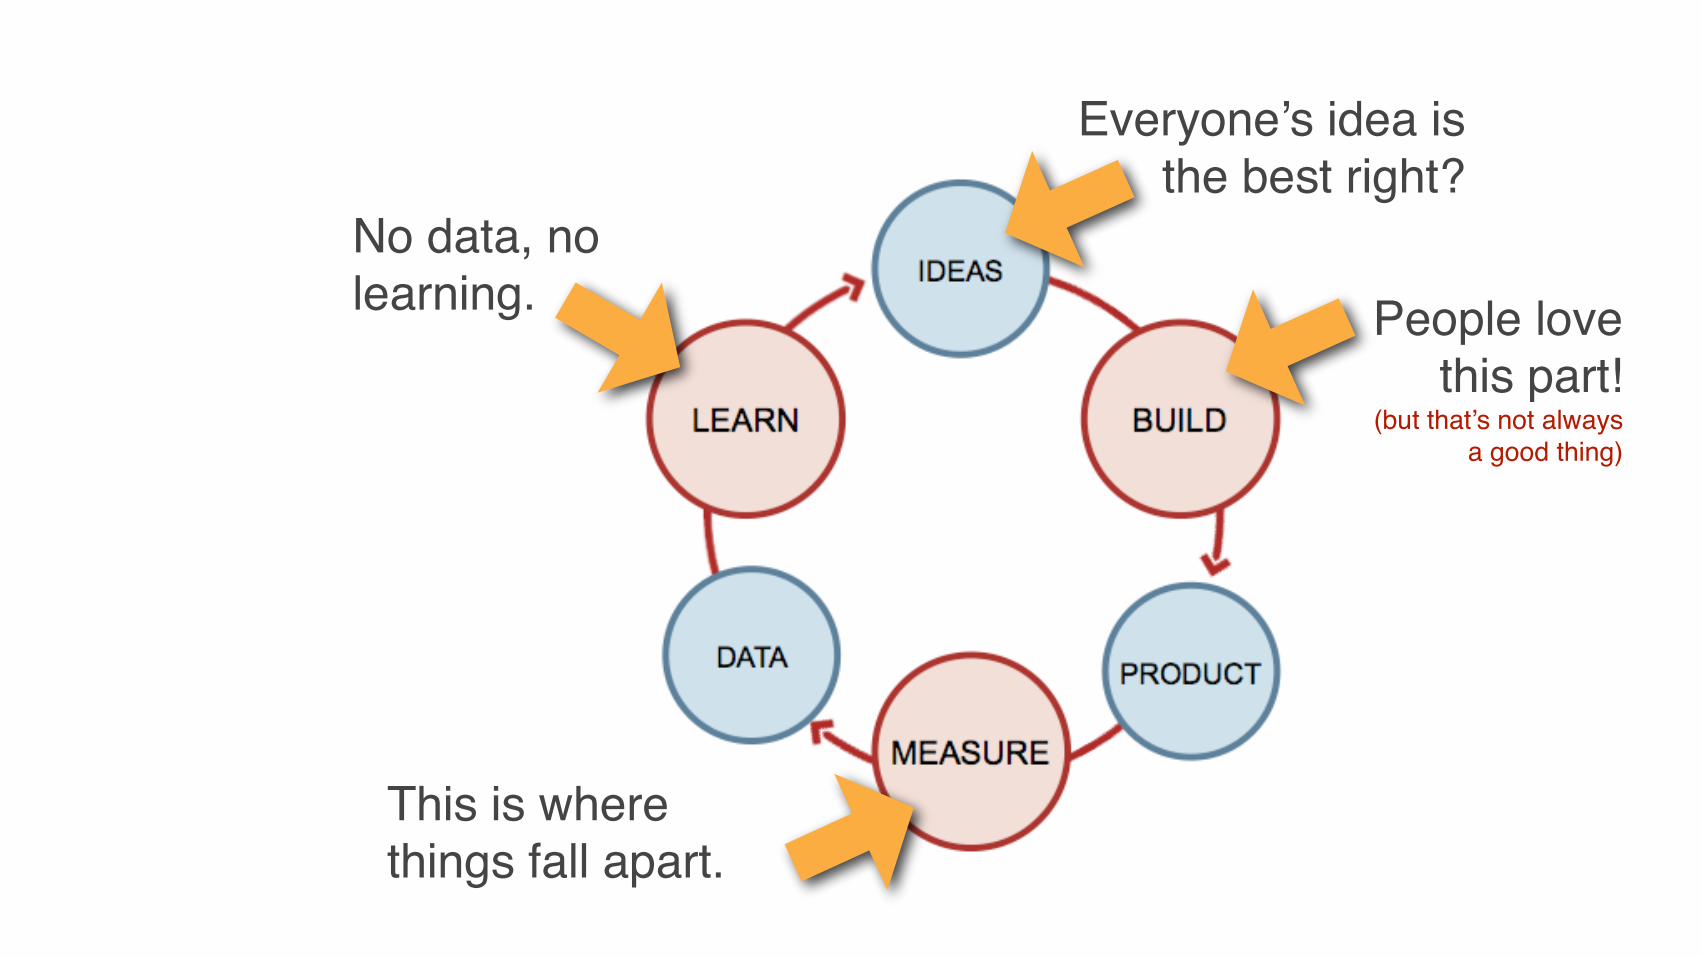
Everyone’s idea is the best right?
People love this part!
(but that’s not always a good thing)
This is where things fall apart.
No data, no learning.

Analytics can help.
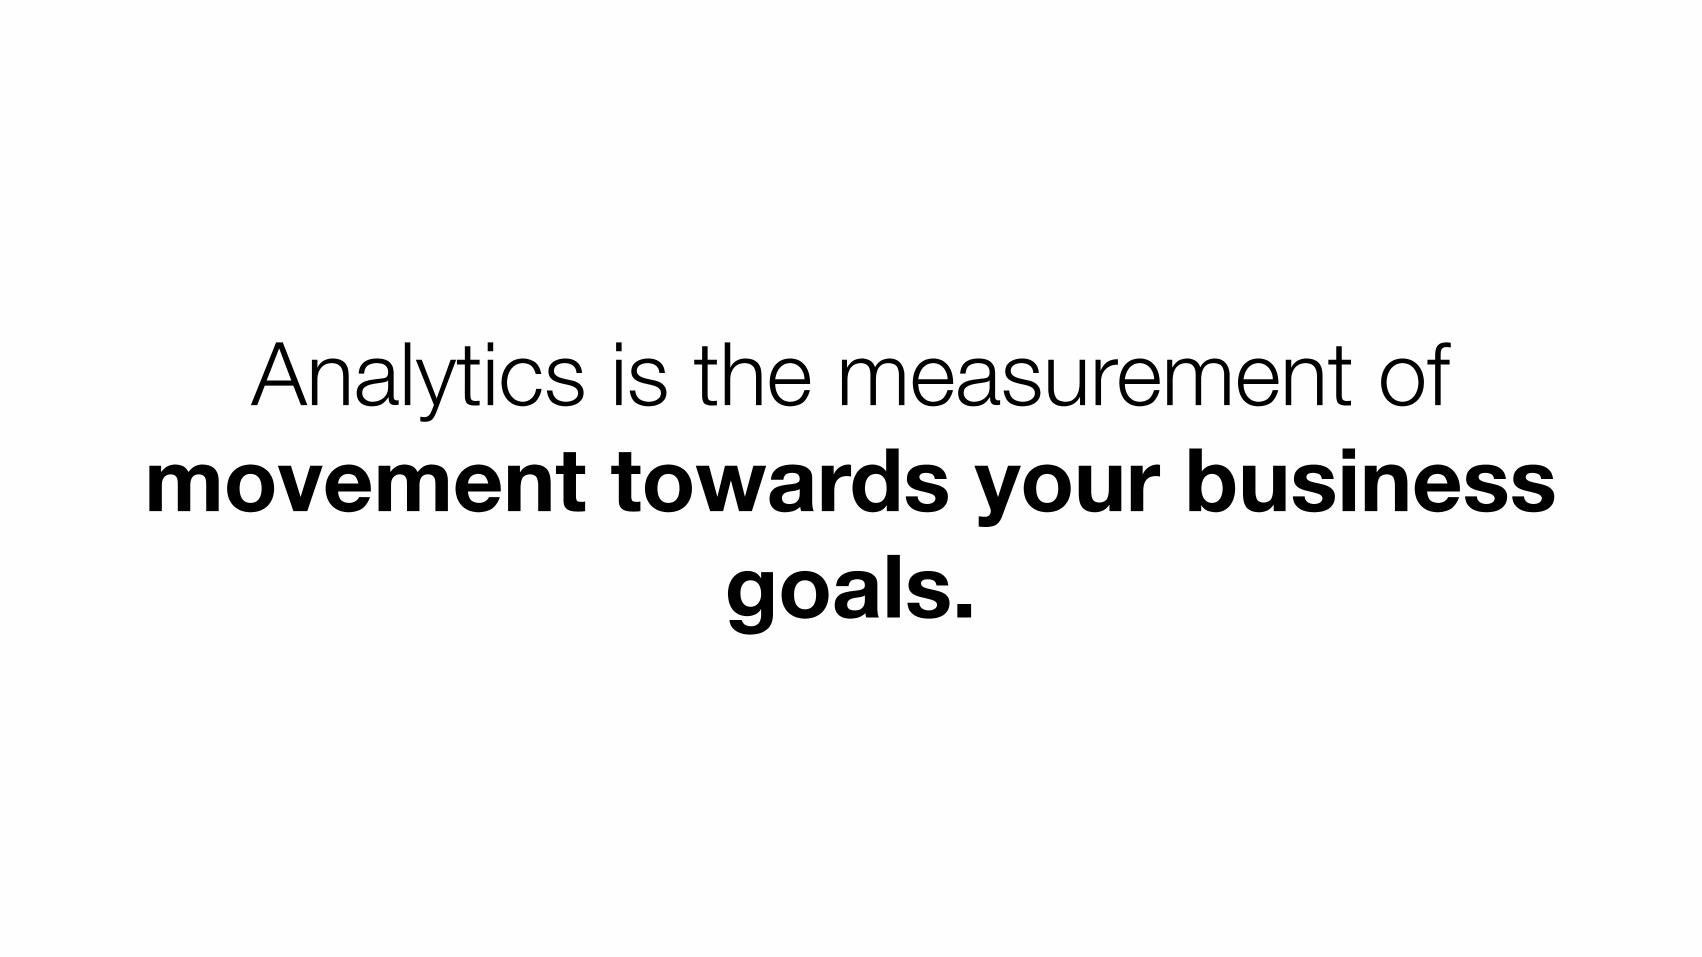
Analytics is the measurement of movement towards your business
goals.

In a startup, the purpose of analytics is to iterate to product/market fit
before the money runs out.

I have two kids. At least one of them is a girl.
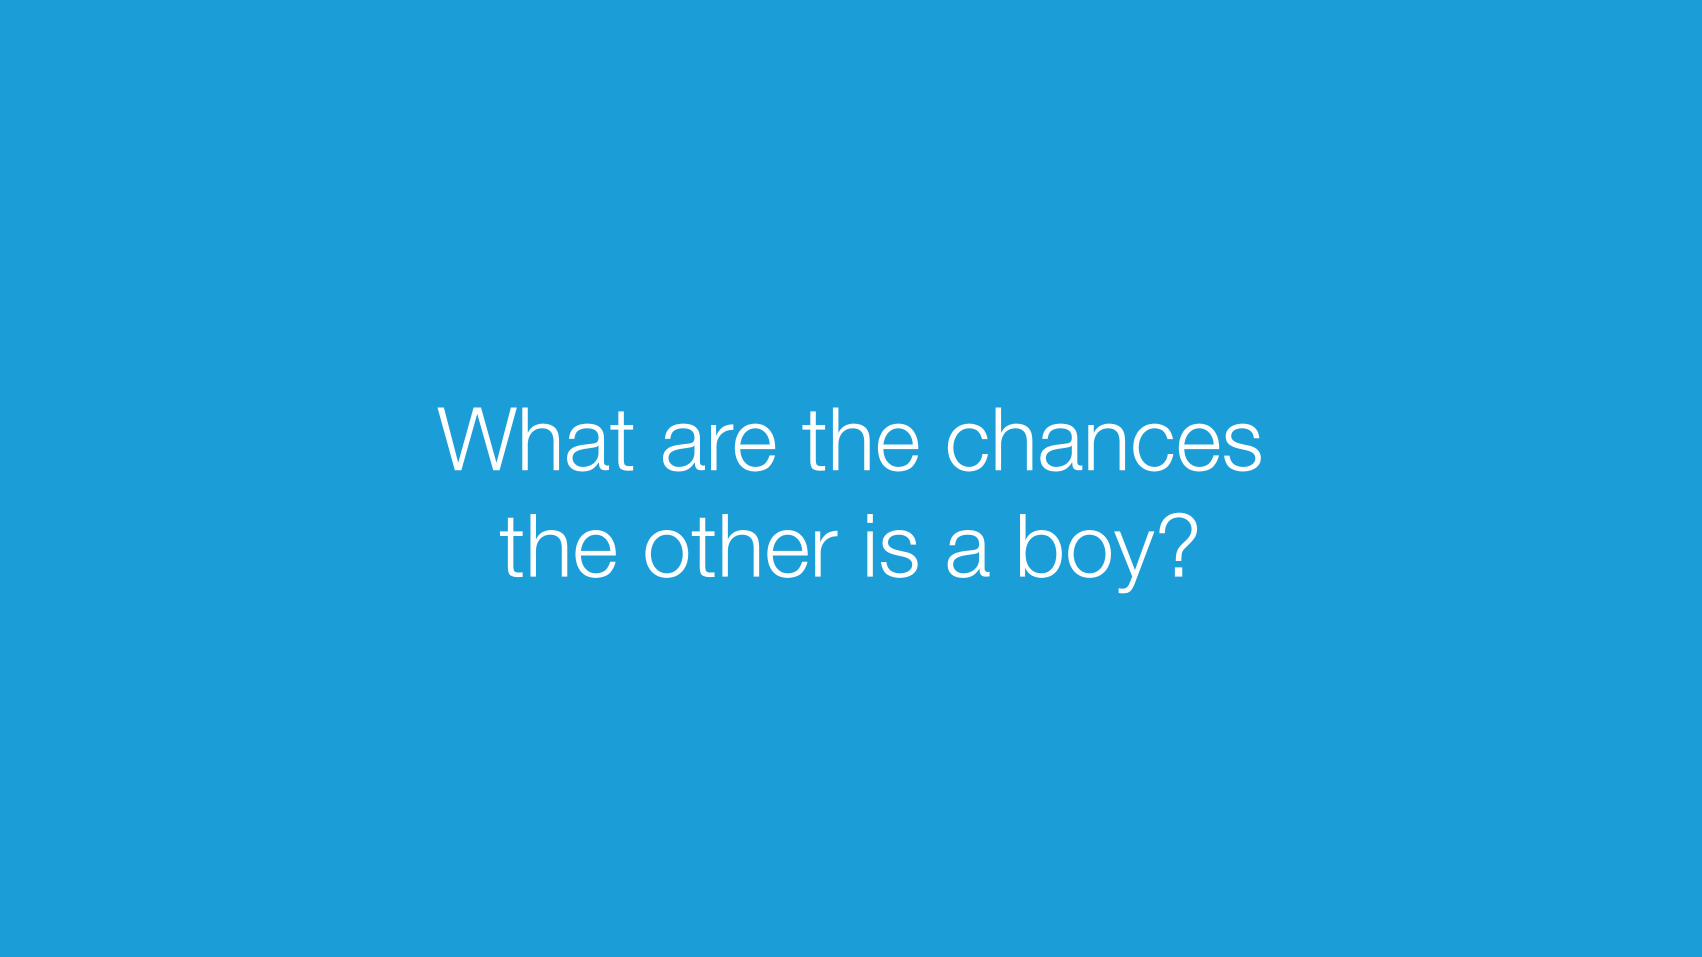
What are the chances the other is a boy?

BB BG
GB GG
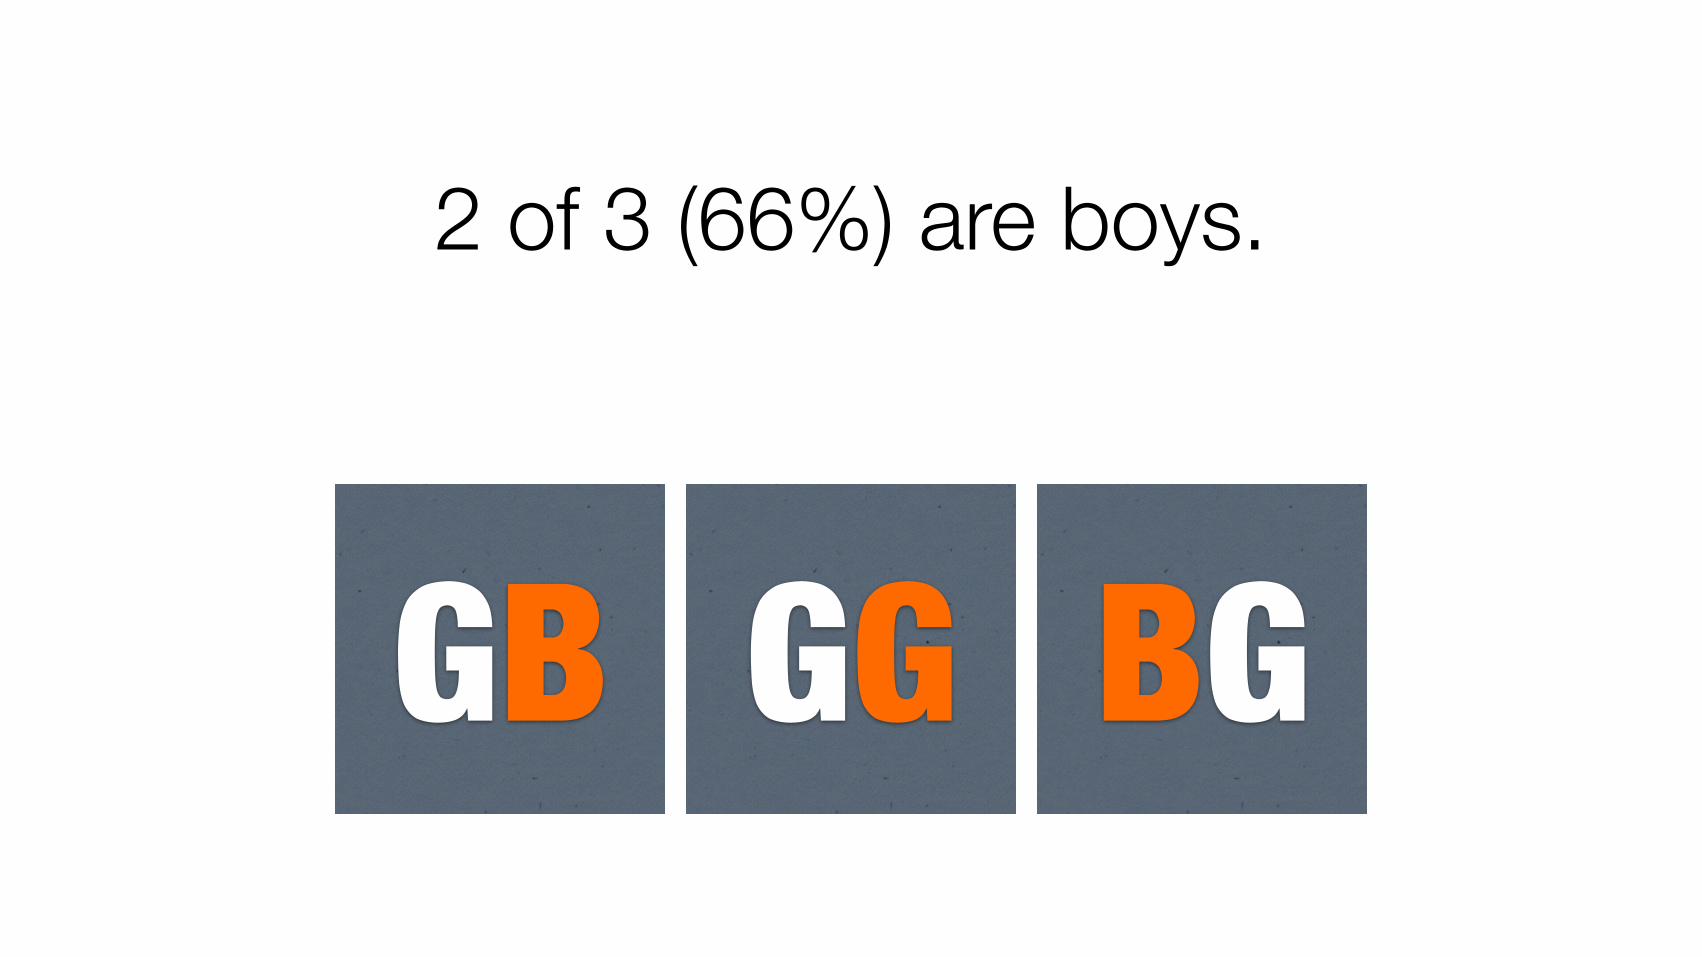
2 of 3 (66%) are boys.
GB GG BG
Some fundamentals.
Analytics, performance, aggregation, and the right metrics
Fundamental: Web analytics and the long funnel.
(This is not a web analytics workshop.)
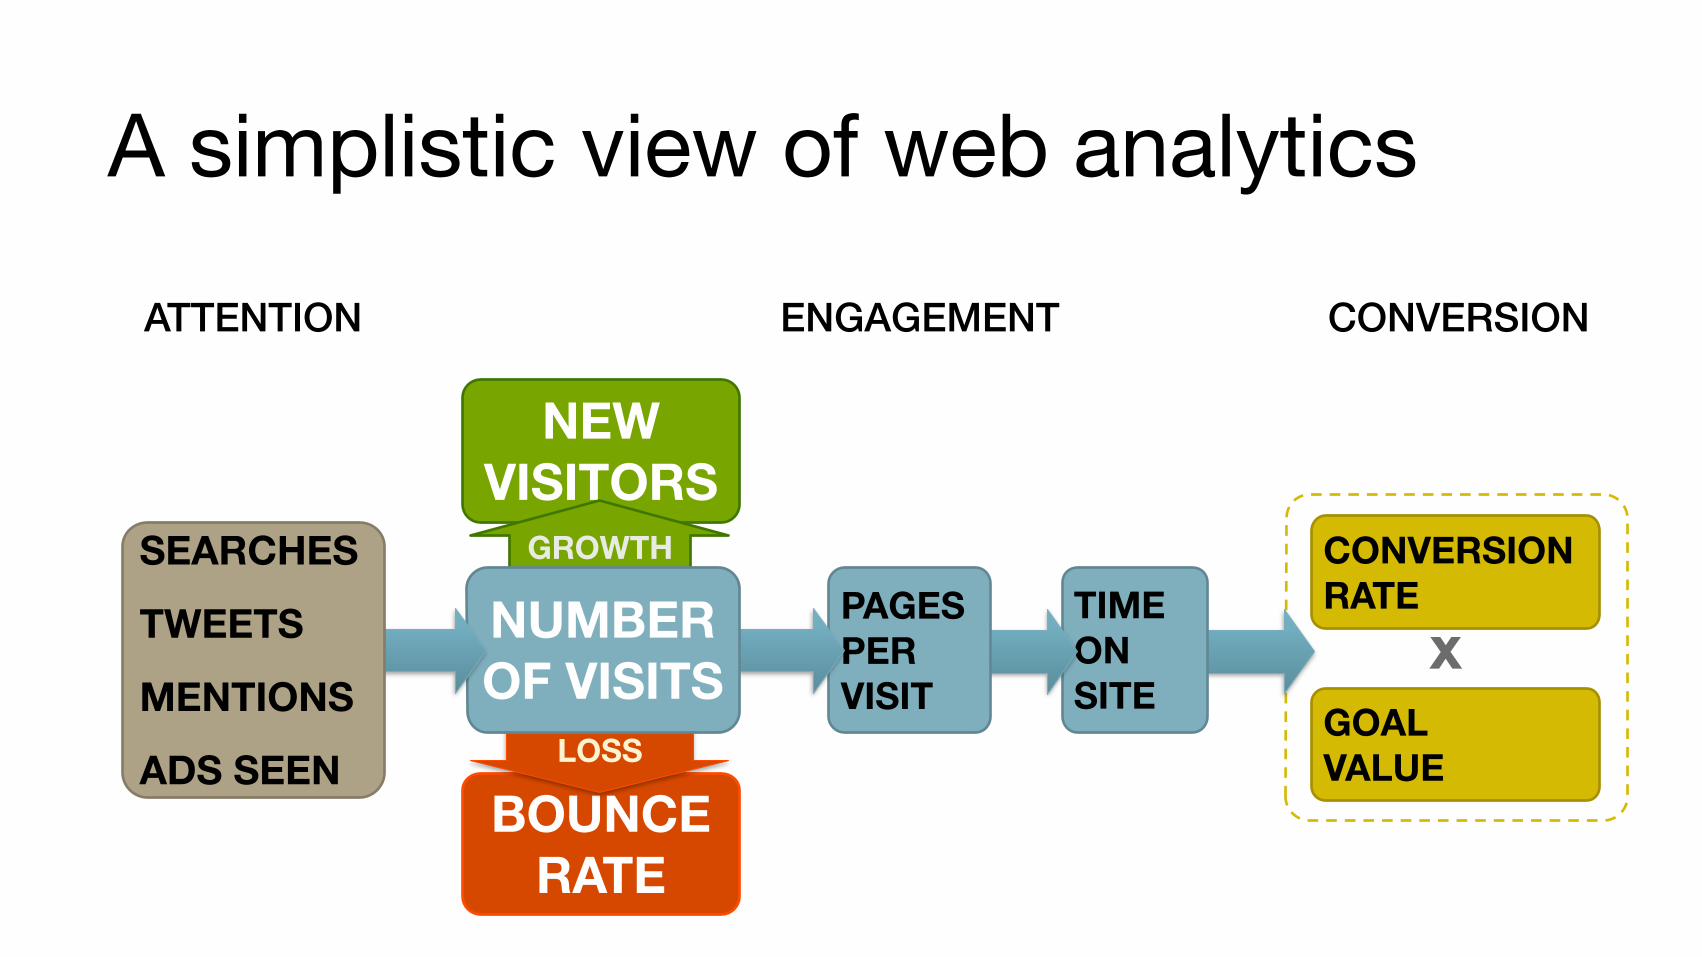
NEWVISITORS
GROWTH
BOUNCERATE
LOSS
CONVERSIONRATE
GOALVALUE
xTIMEONSITE
PAGESPERVISIT
NUMBEROF VISITS
SEARCHESTWEETSMENTIONSADS SEEN
ATTENTION ENGAGEMENT CONVERSION
A simplistic view of web analytics
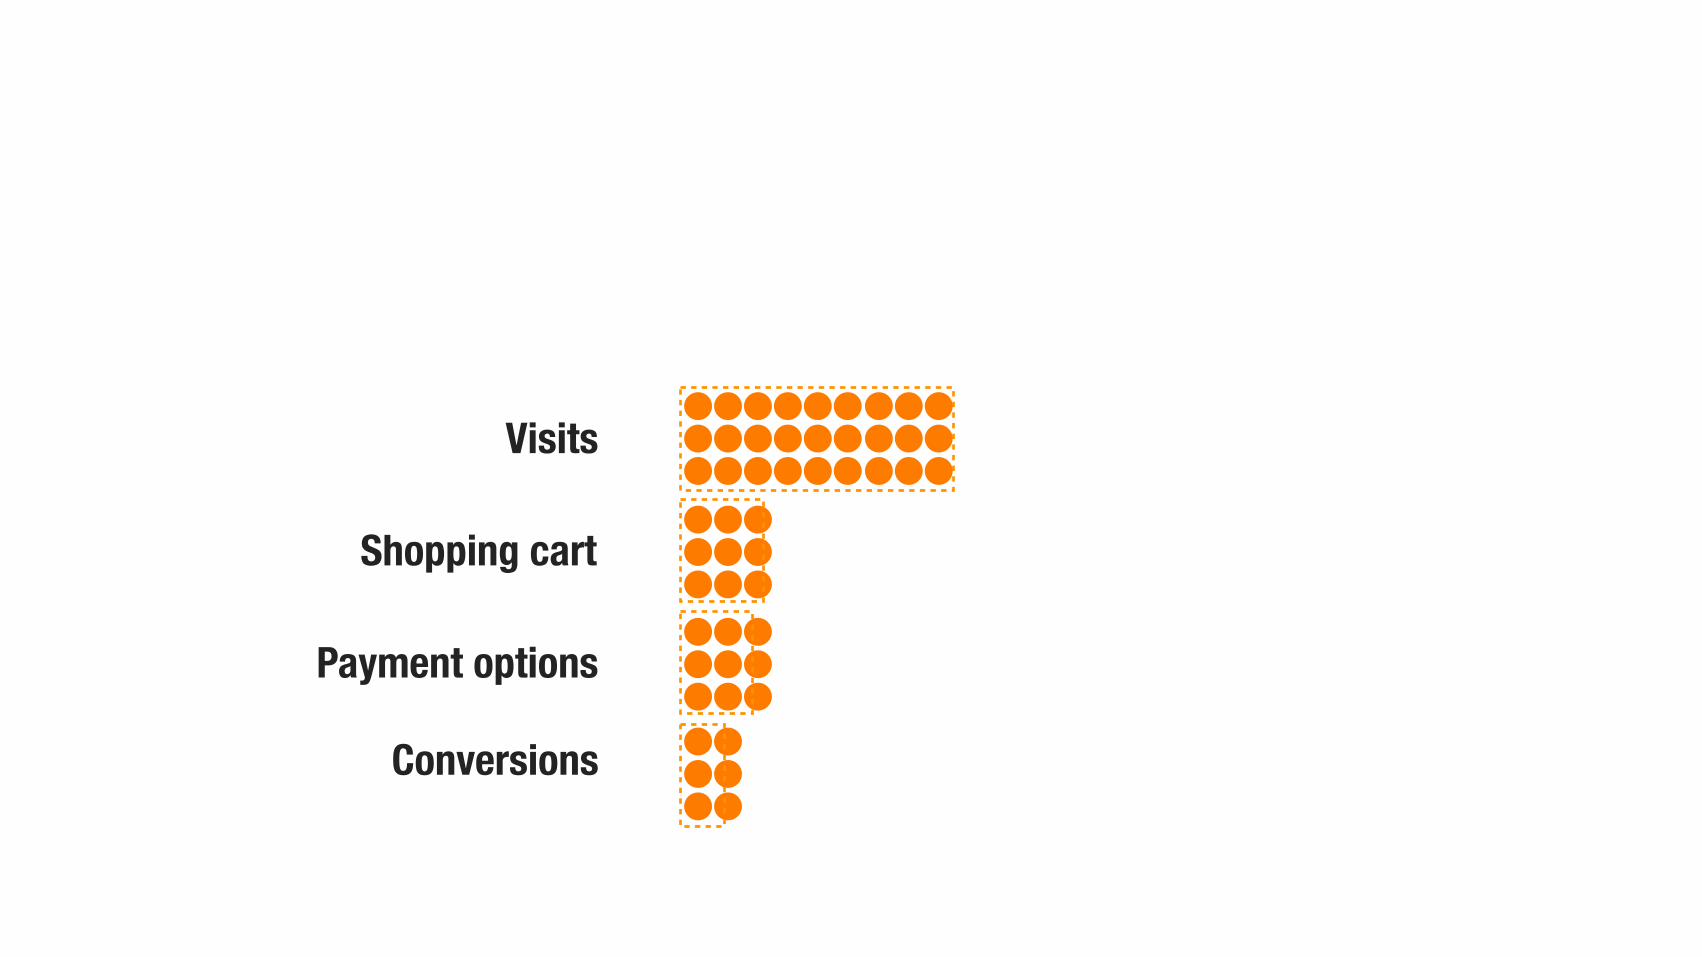
Conversions
Visits
Shopping cart
Payment options
Conversions
Visits
Shopping cart
Payment options
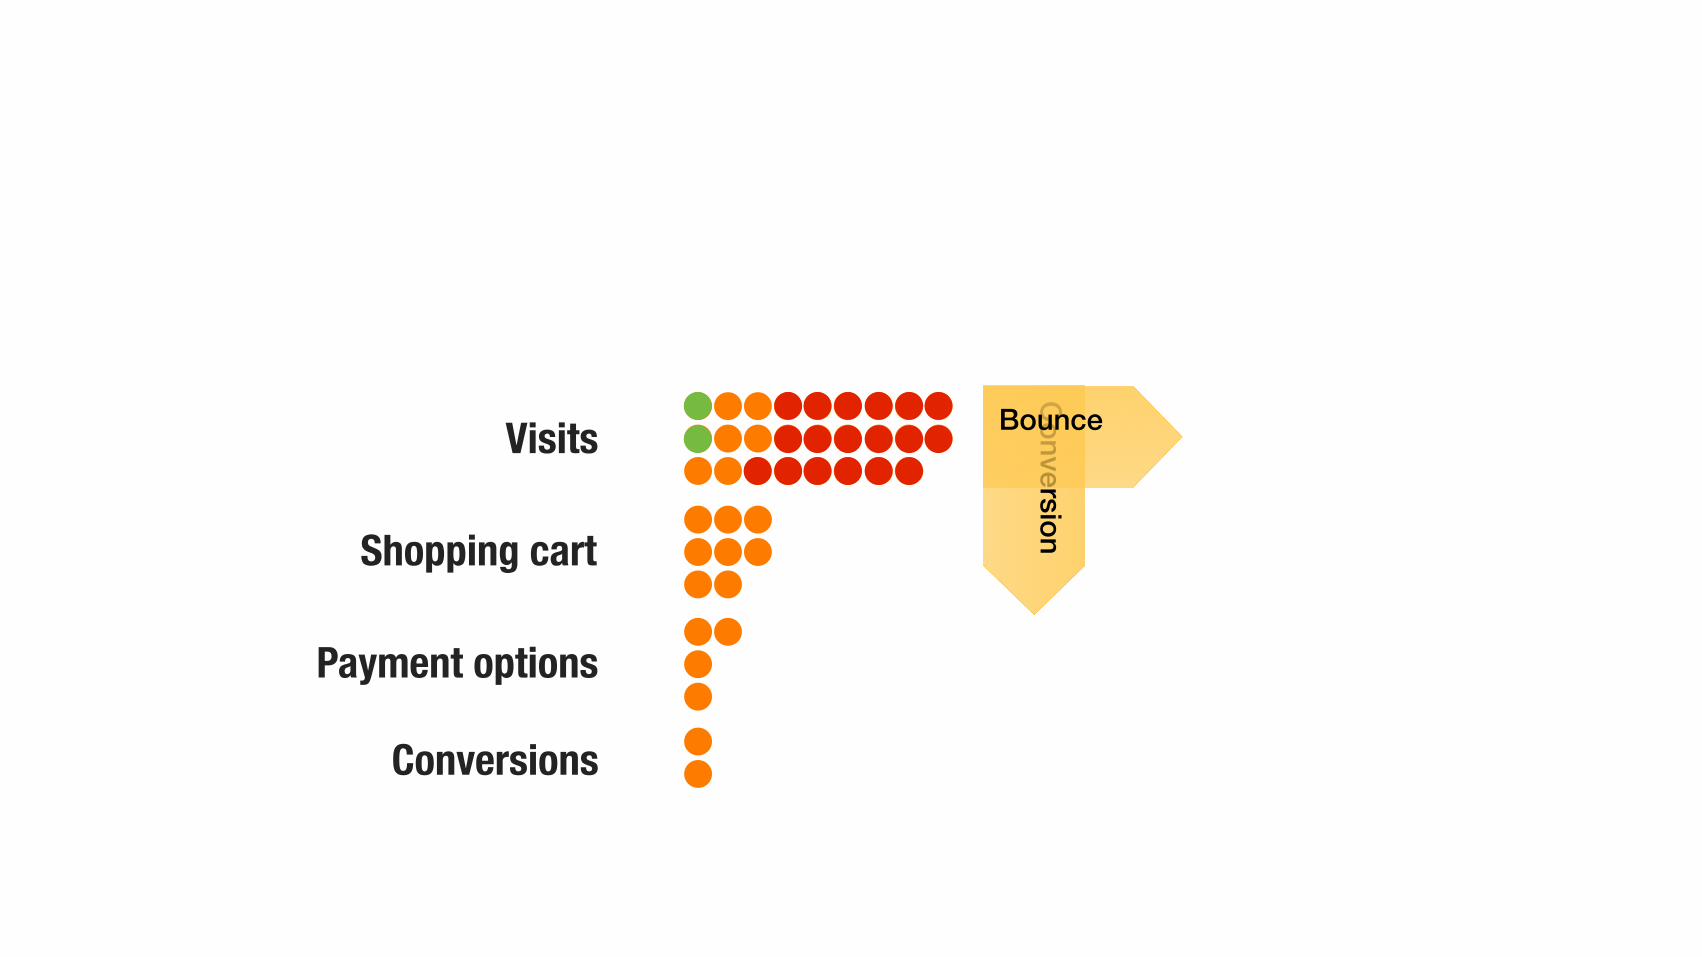
KPIs
Conversion
Bounce
Conversions
Visits
Shopping cart
Payment options
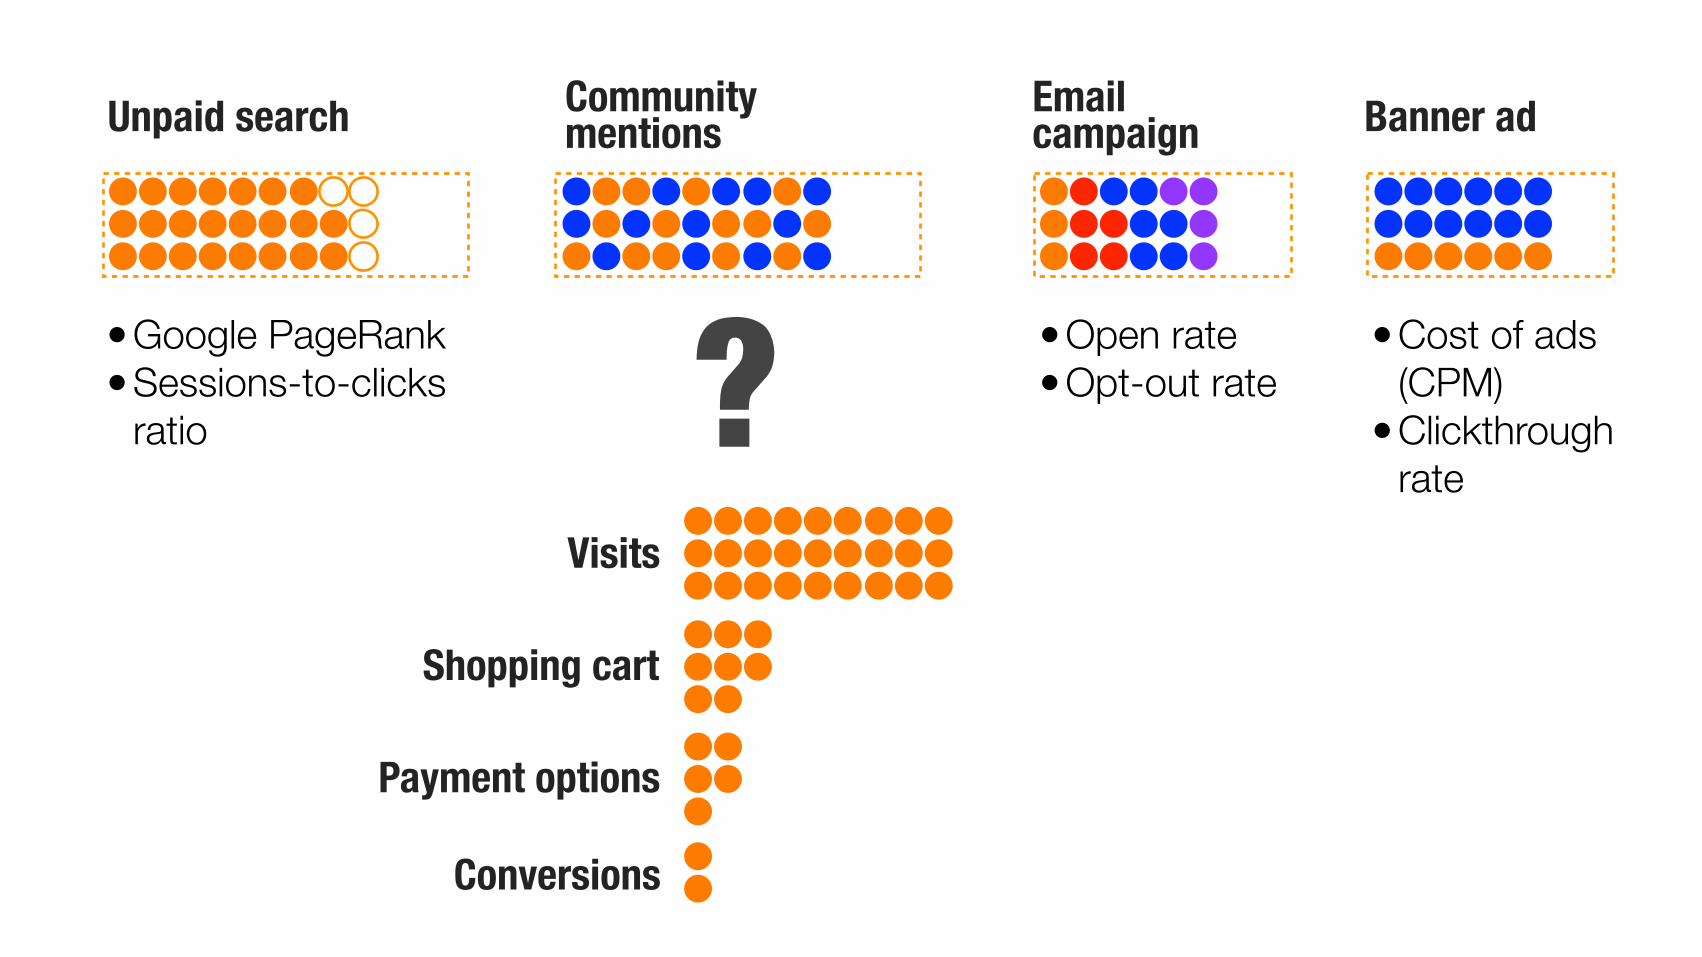
Unpaid search Communitymentions
Emailcampaign Banner ad
•Google PageRank •Sessions-to-clicks
ratio
•Cost of ads(CPM)
•Clickthroughrate
•Open rate •Opt-out rate ?
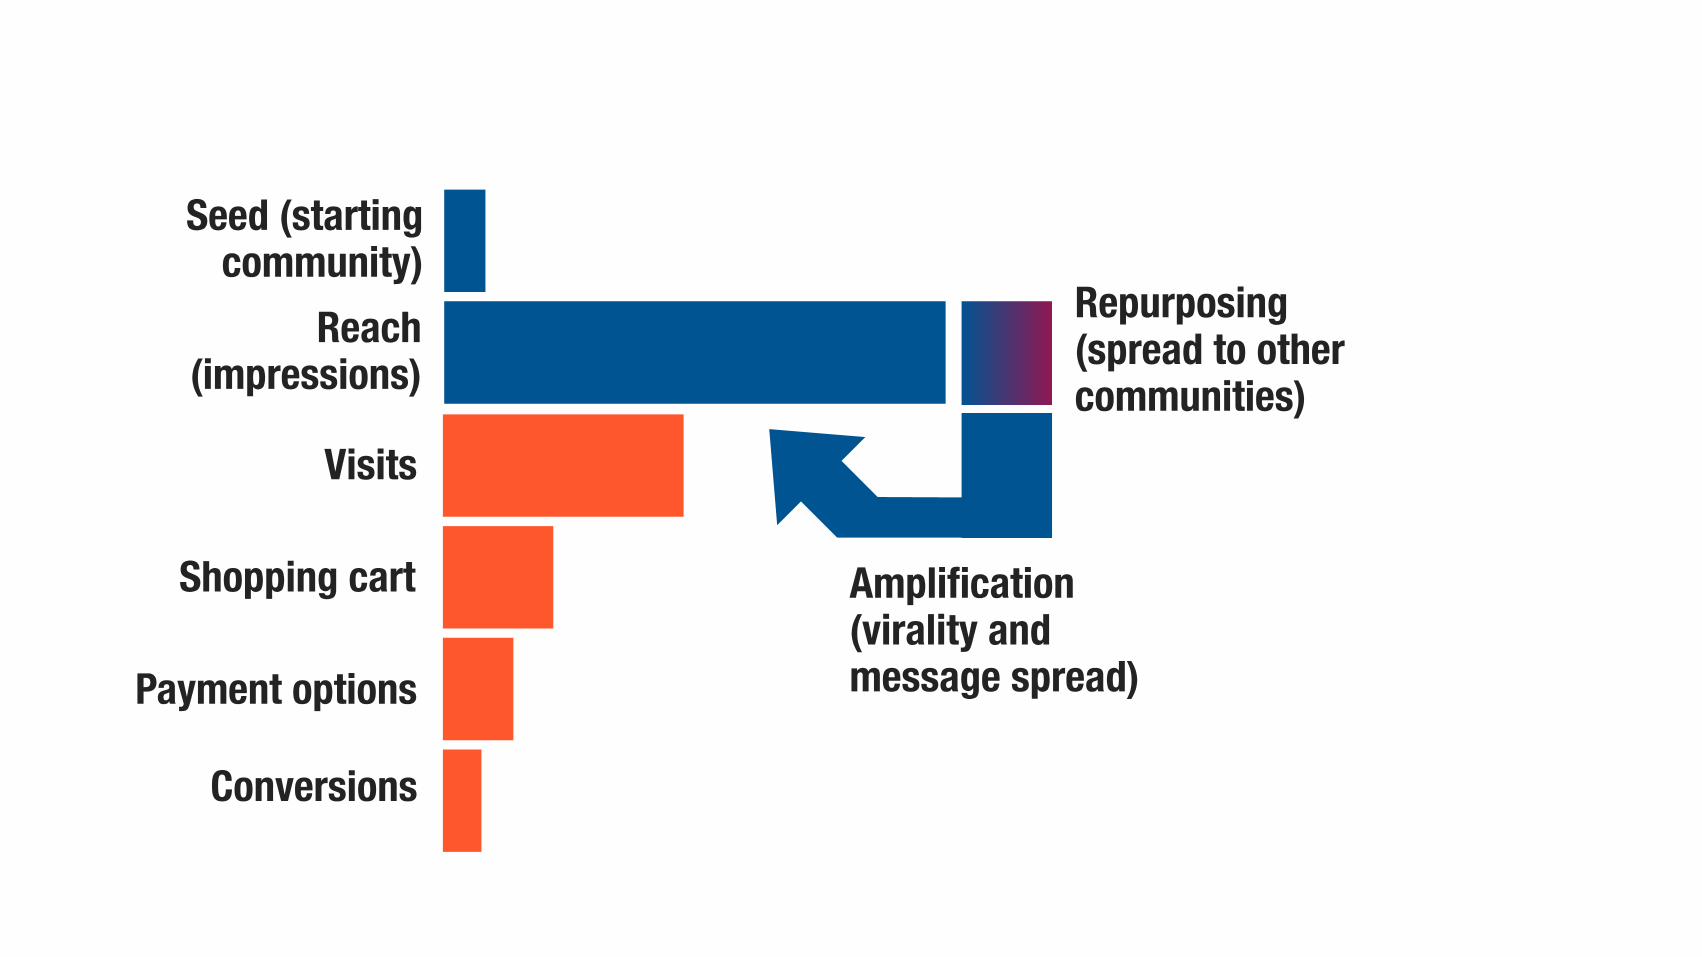
Repurposing(spread to othercommunities)
Amplification(virality andmessage spread)
Conversions
Visits
Shopping cart
Payment options
Seed (starting community)
Reach (impressions)
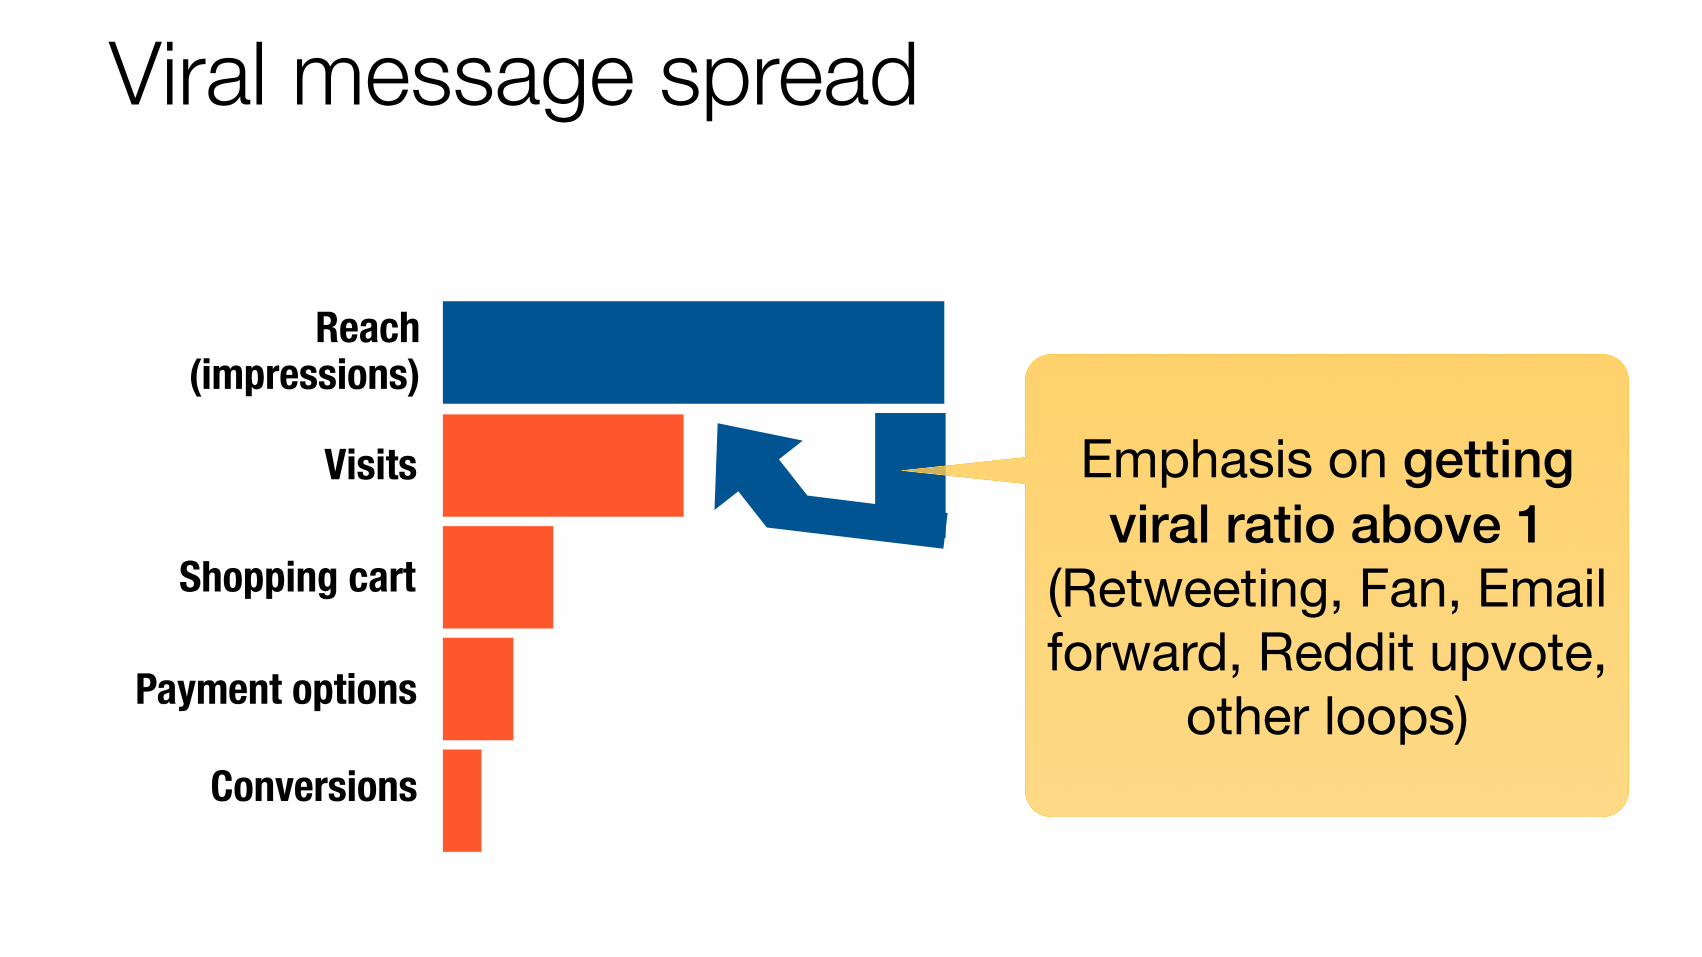
Viral message spread
Conversions
Visits
Shopping cart
Payment options
Reach (impressions)
Emphasis on getting viral ratio above 1
(Retweeting, Fan, Email forward, Reddit upvote,
other loops)
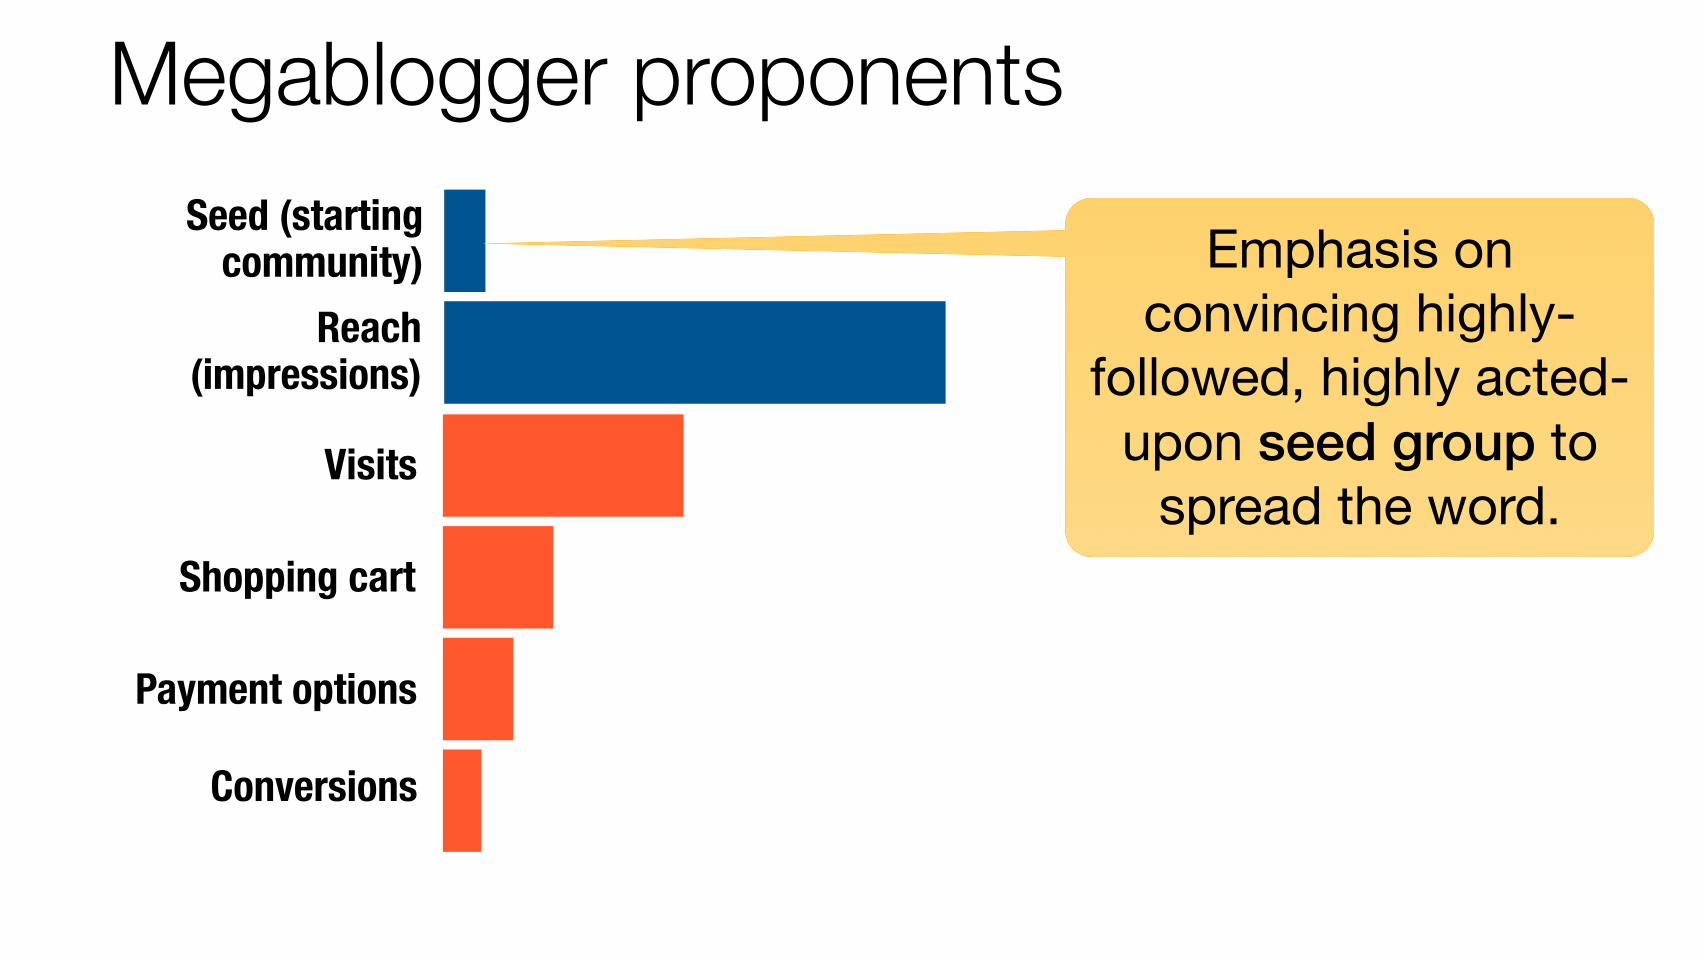
Megablogger proponents
Conversions
Visits
Shopping cart
Payment options
Seed (starting community)
Reach (impressions)
Emphasis on convincing highly-
followed, highly acted-upon seed group to
spread the word.
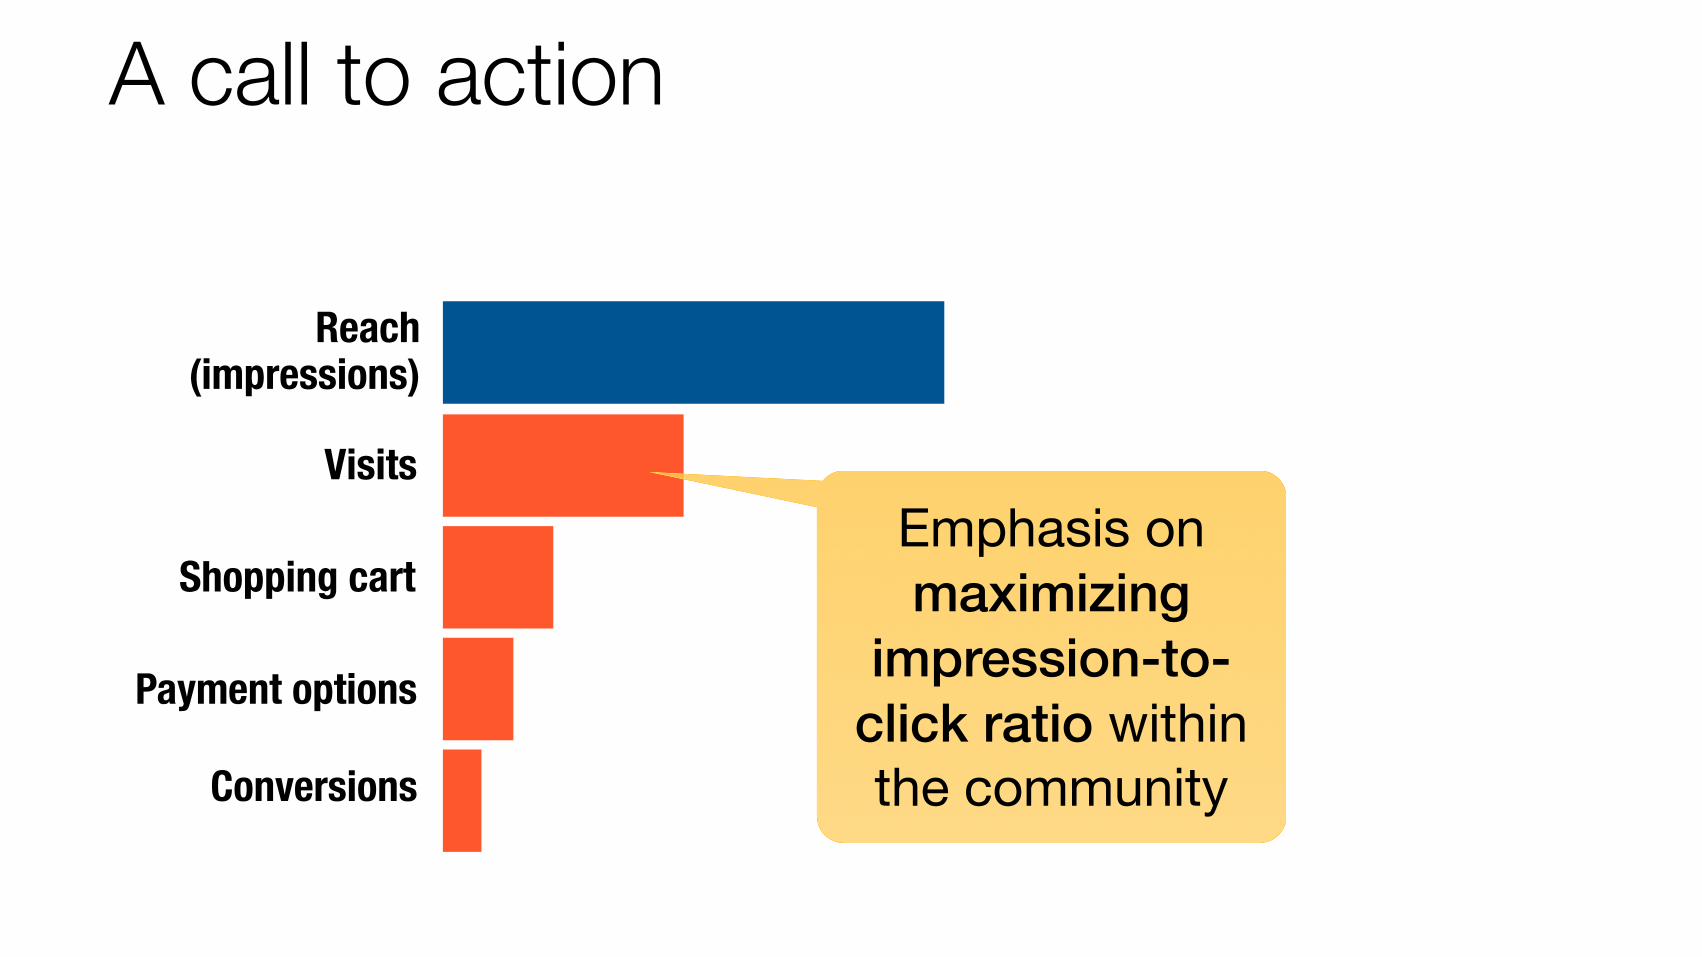
A call to action
Conversions
Visits
Shopping cart
Payment options
Reach (impressions)
Emphasis on maximizing
impression-to-click ratio within the community
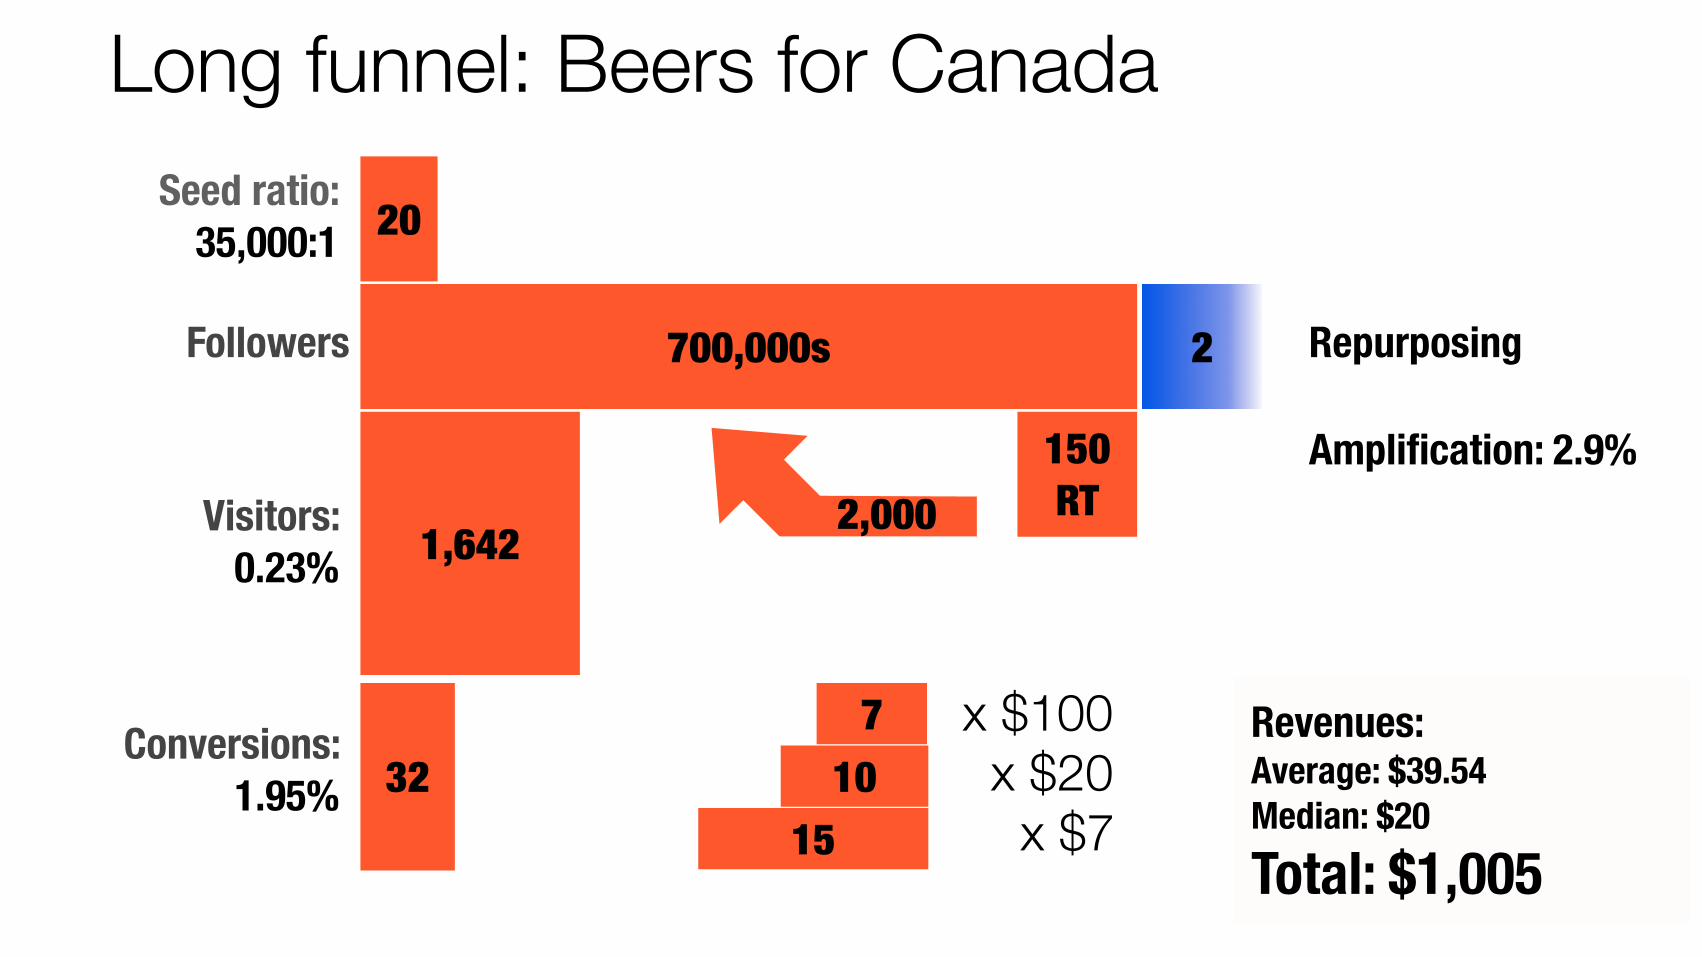
Long funnel: Beers for Canada
700,000s
1,642
150 RT
327
1015
x $100x $20
x $7
20Seed ratio: 35,000:1
Followers
Visitors: 0.23%
Conversions: 1.95%
Revenues:Average: $39.54 Median: $20 Total: $1,005
Amplification: 2.9%
2 Repurposing
2,000
Fundamental: You should care about performance.
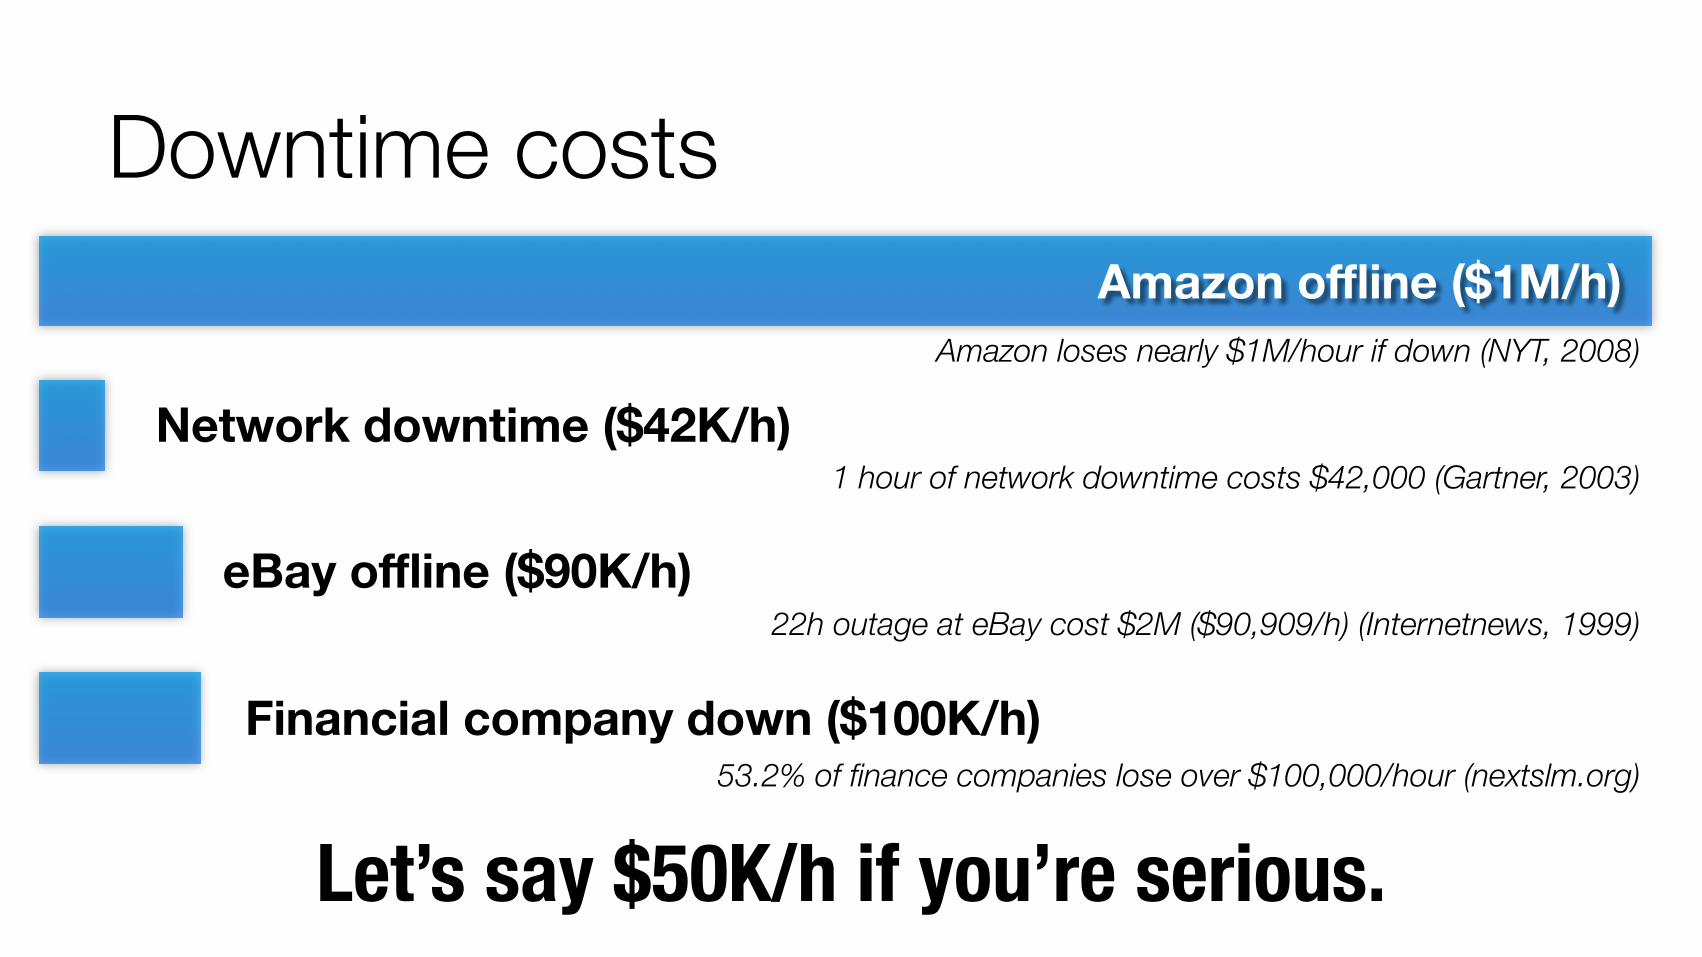
Downtime costs
1 hour of network downtime costs $42,000 (Gartner, 2003)Network downtime ($42K/h)
22h outage at eBay cost $2M ($90,909/h) (Internetnews, 1999)eBay offline ($90K/h)
53.2% of finance companies lose over $100,000/hour (nextslm.org)Financial company down ($100K/h)
Amazon loses nearly $1M/hour if down (NYT, 2008)
Amazon offline ($1M/h)
Let’s say $50K/h if you’re serious.
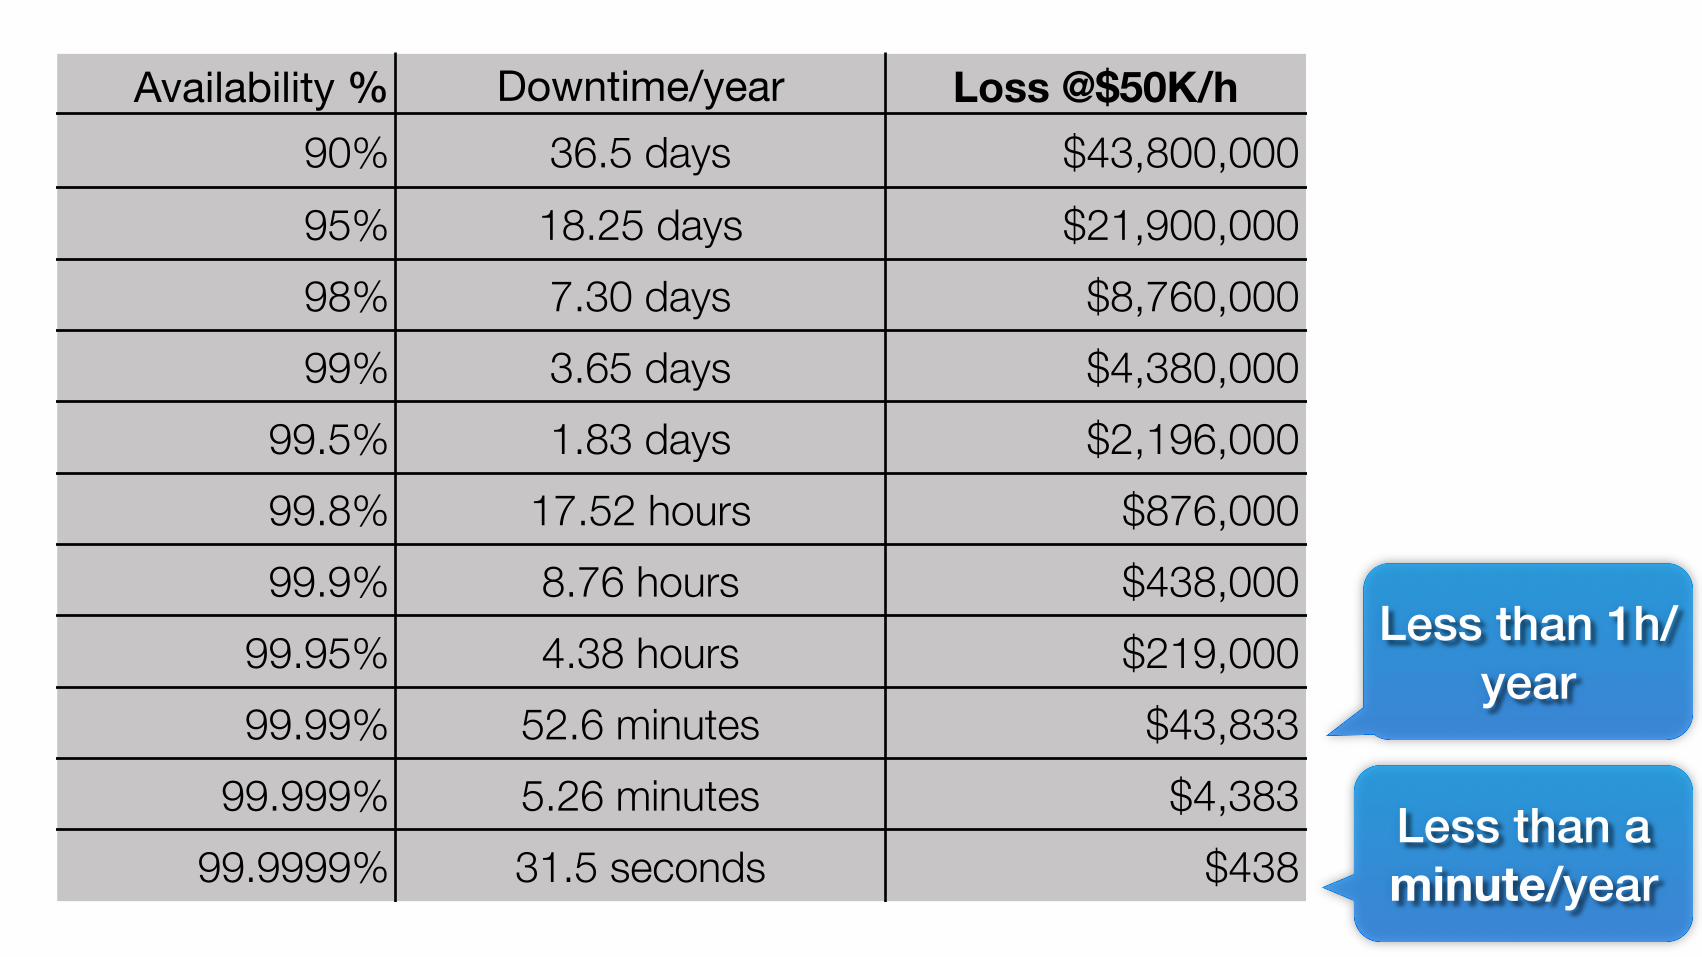
Availability % Downtime/year Loss @$50K/h90% 36.5 days $43,800,00095% 18.25 days $21,900,00098% 7.30 days $8,760,00099% 3.65 days $4,380,000
99.5% 1.83 days $2,196,00099.8% 17.52 hours $876,00099.9% 8.76 hours $438,000
99.95% 4.38 hours $219,00099.99% 52.6 minutes $43,833
99.999% 5.26 minutes $4,38399.9999% 31.5 seconds $438
Less than 1h/ year
Less than a minute/year
US$0
US$2
US$5
US$7
US$10
US$12
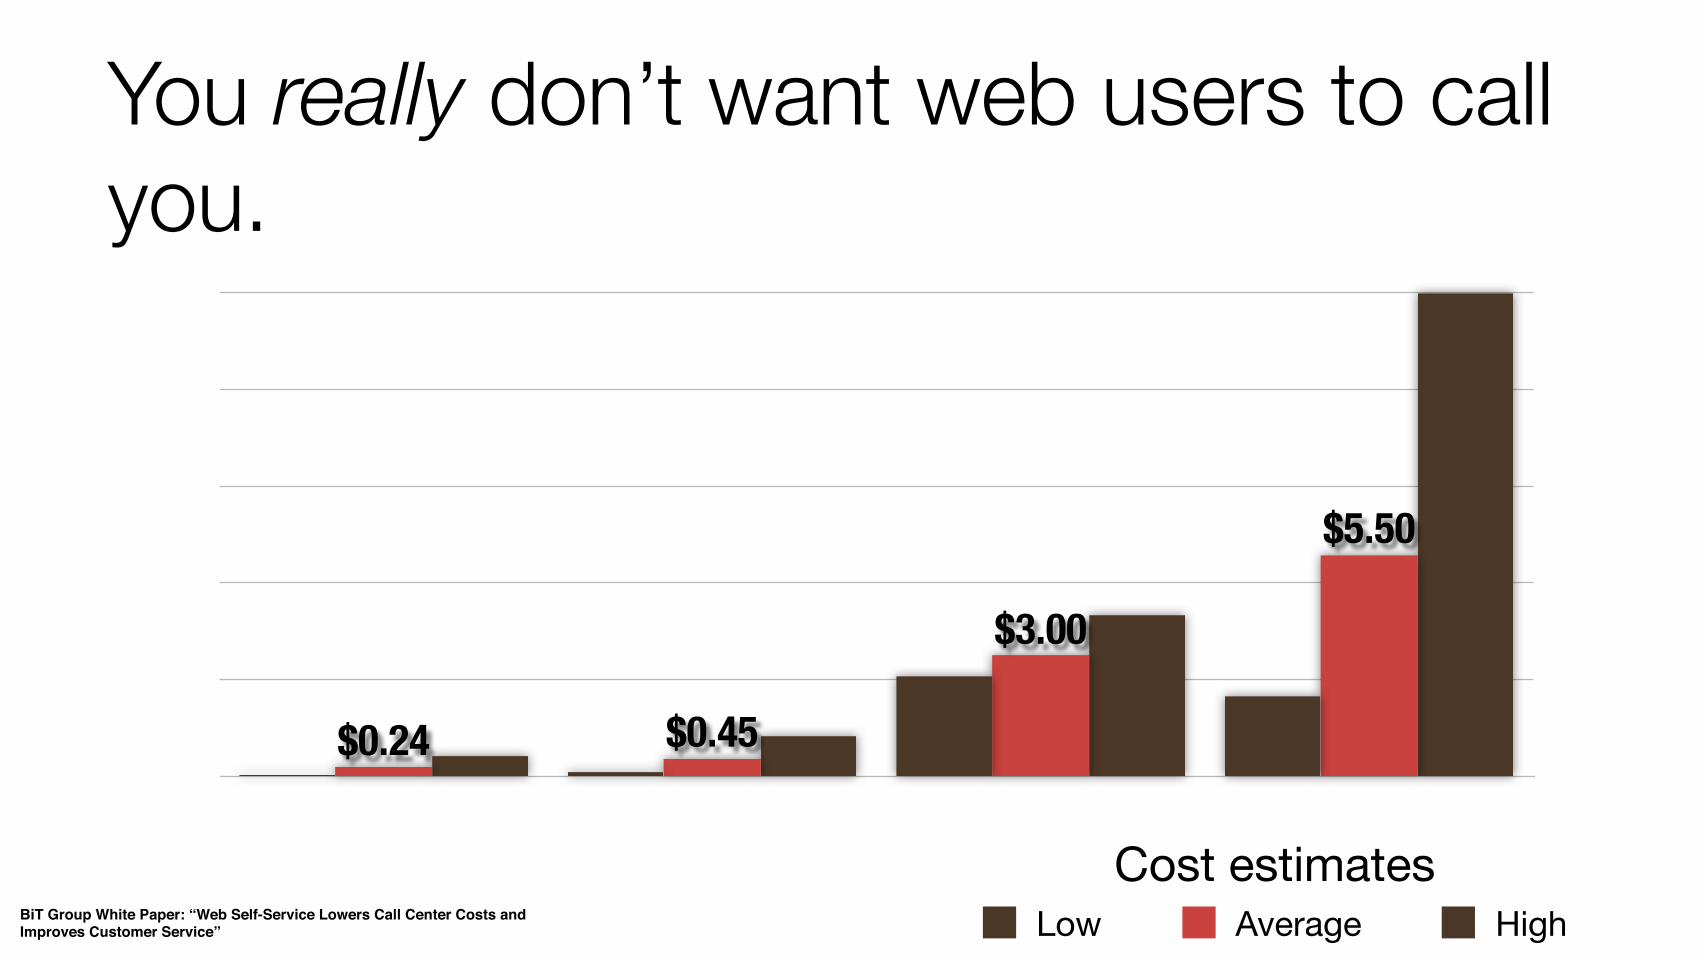
Web self-service IVR Email Live phone
$5.50
$3.00
$0.45$0.24
Low Average High
You really don’t want web users to call you.
BiT Group White Paper: “Web Self-Service Lowers Call Center Costs and Improves Customer Service”
Cost estimates
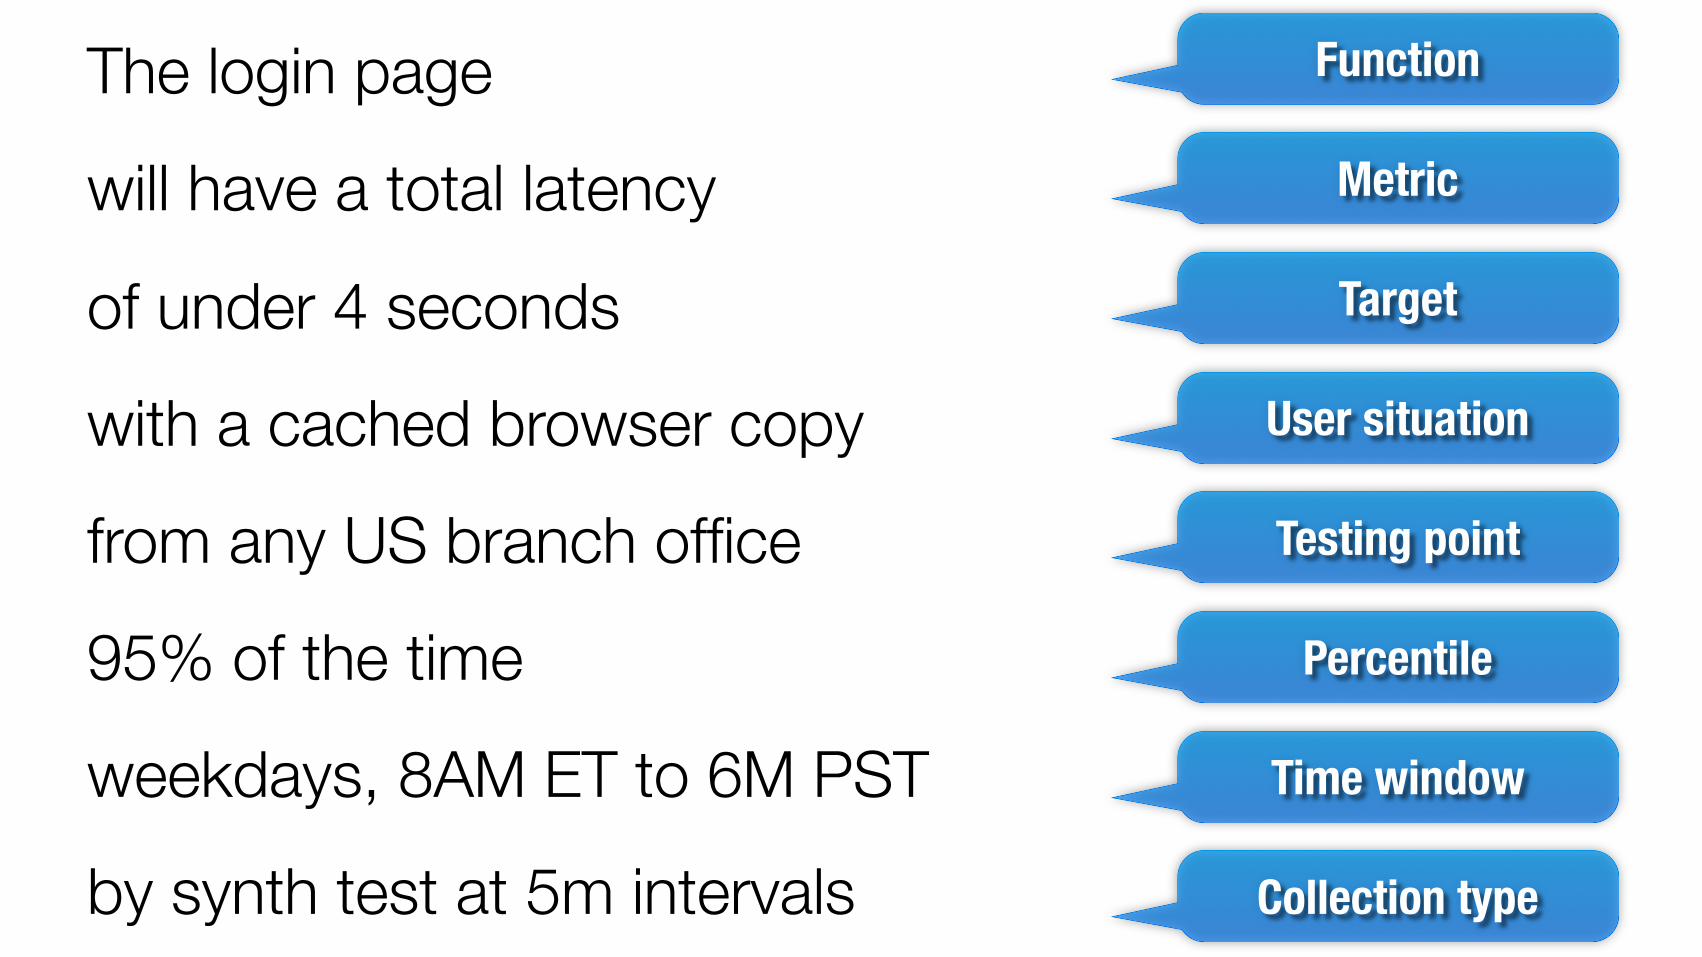
The login page Function
will have a total latency Metric
of under 4 seconds Target
with a cached browser copy User situation
from any US branch office Testing point
95% of the time Percentile
weekdays, 8AM ET to 6M PST Time window
by synth test at 5m intervals Collection type
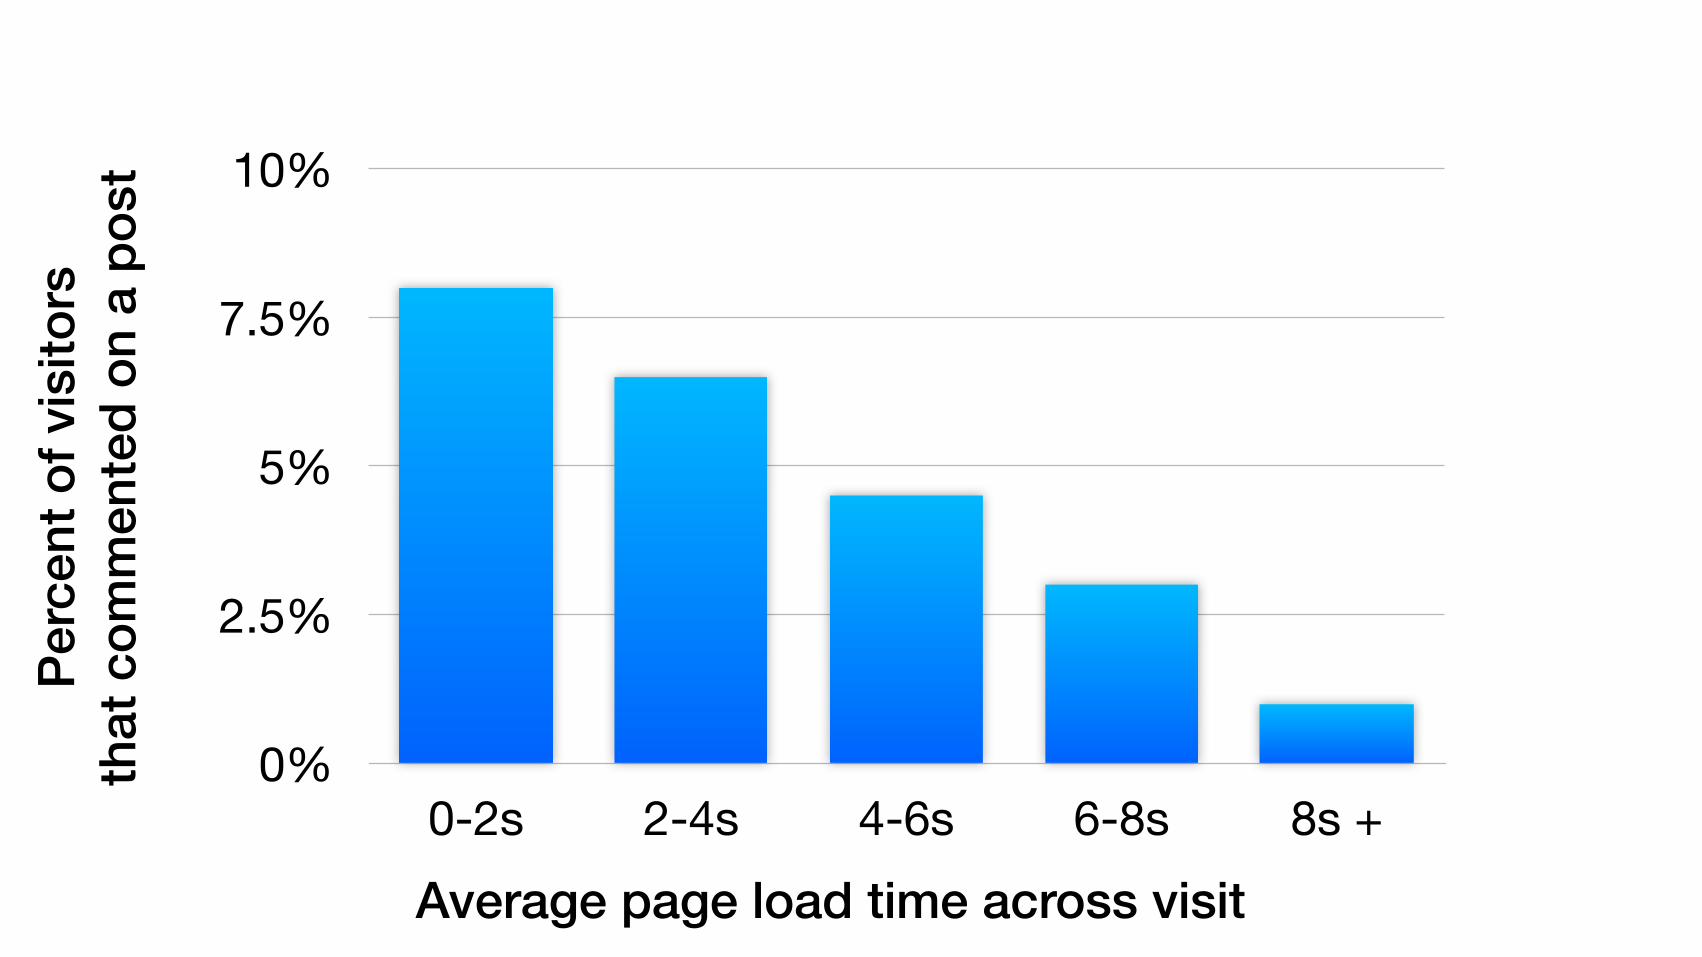
0%
2.5%
5%
7.5%
10%
0-2s 2-4s 4-6s 6-8s 8s +Average page load time across visit
Perc
ent o
f vis
itors
th
at c
omm
ente
d on
a p
ost
Fundamental:What makes a good metric?
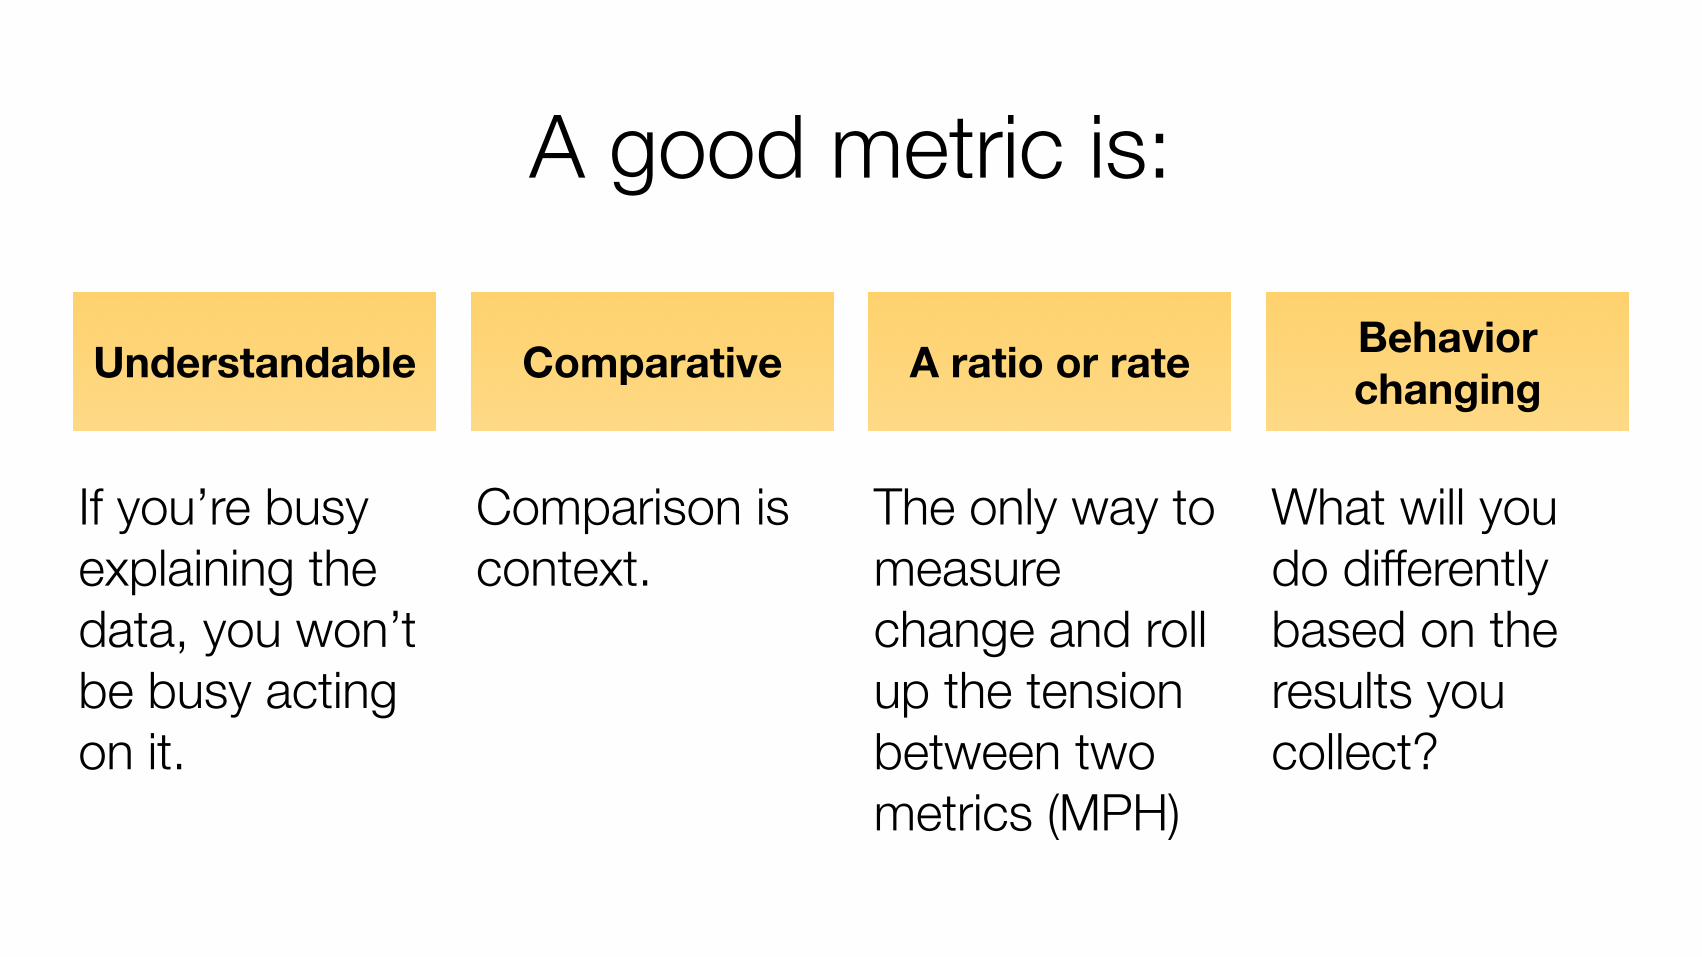
A good metric is:
Understandable
If you’re busy explaining the data, you won’t be busy acting on it.
Comparative
Comparison is context.
A ratio or rate
The only way to measure change and roll up the tension between two metrics (MPH)
Behaviorchanging
What will you do differently based on the results you collect?
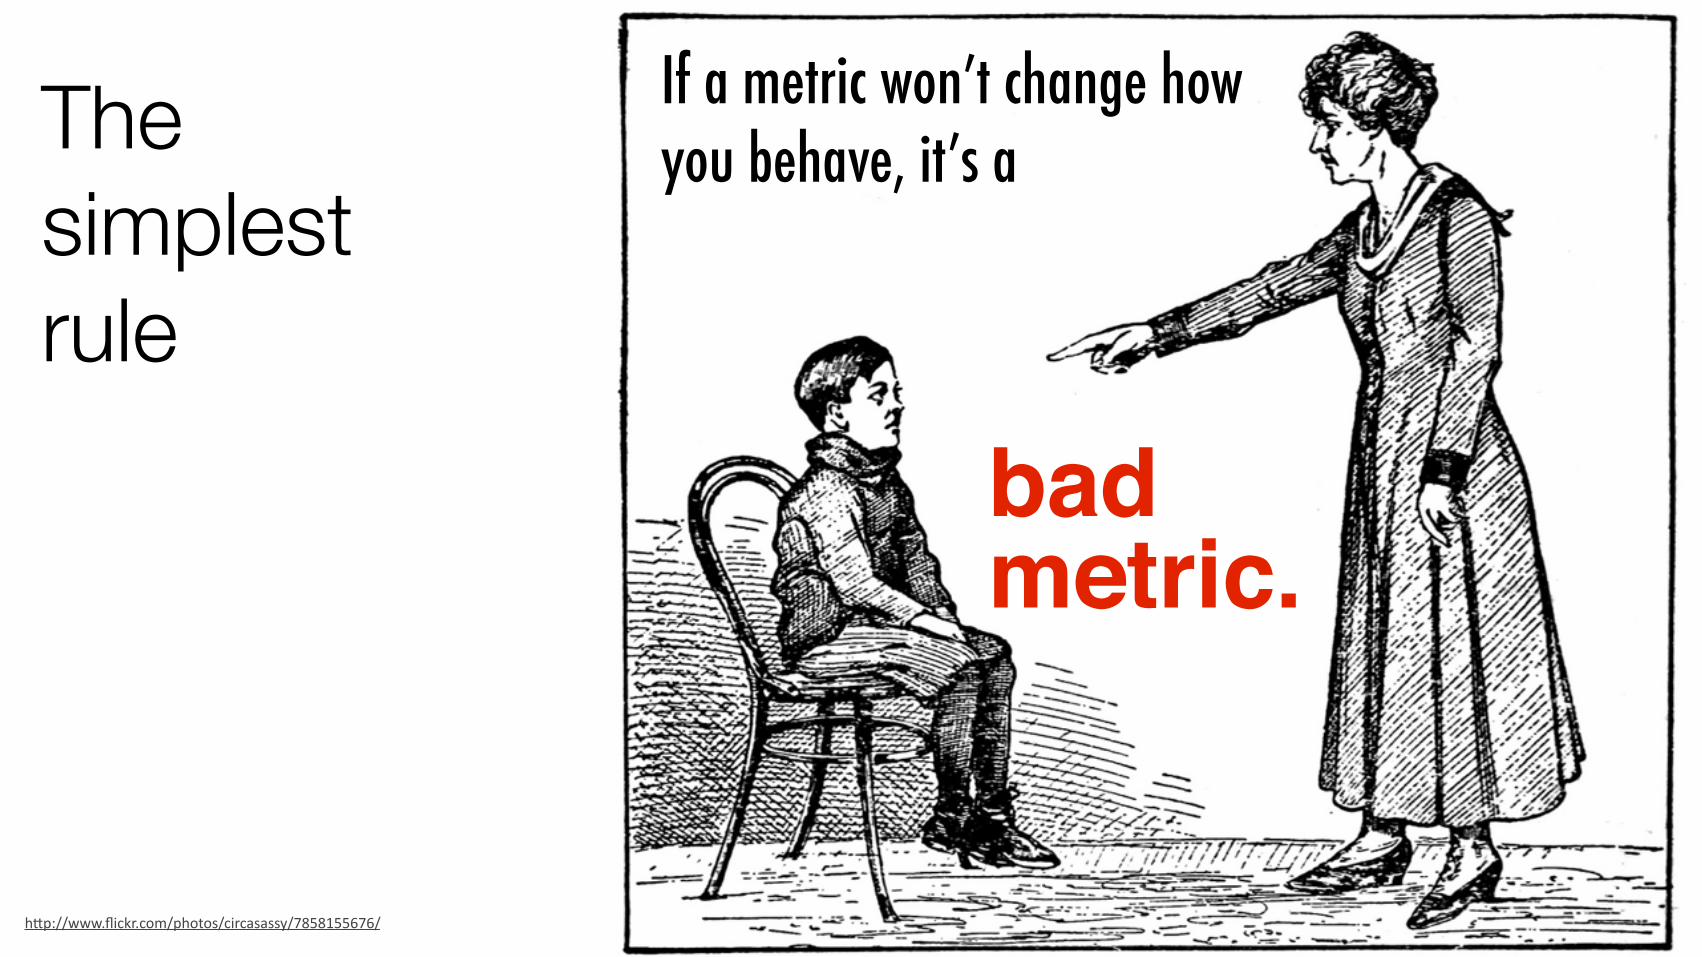
The simplest rule
badmetric.
If a metric won’t change how you behave, it’s a
h"p://www.flickr.com/photos/circasassy/7858155676/
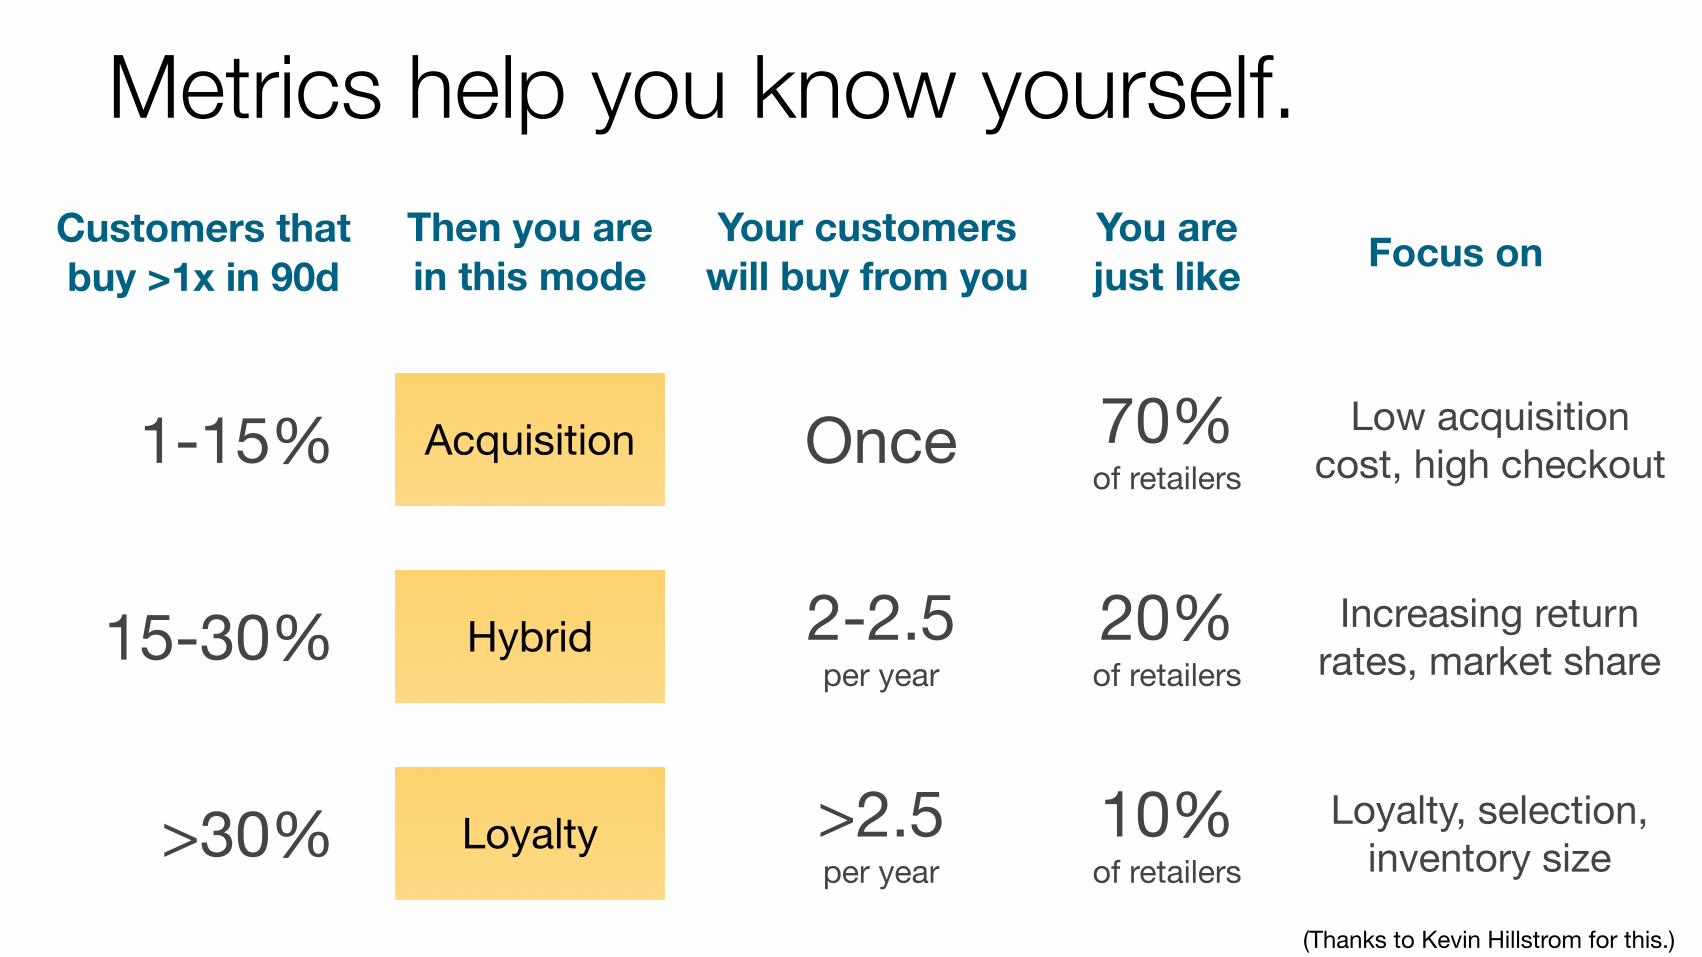
Metrics help you know yourself.
Acquisition
Hybrid
Loyalty
70%of retailers
20%of retailers
10%of retailers
You are just like
Customers that buy >1x in 90d
Once
2-2.5per year
>2.5per year
Your customers will buy from you
Then you are in this mode
1-15%
15-30%
>30%
Low acquisition cost, high checkout
Increasing return rates, market share
Loyalty, selection, inventory size
Focus on
(Thanks to Kevin Hillstrom for this.)
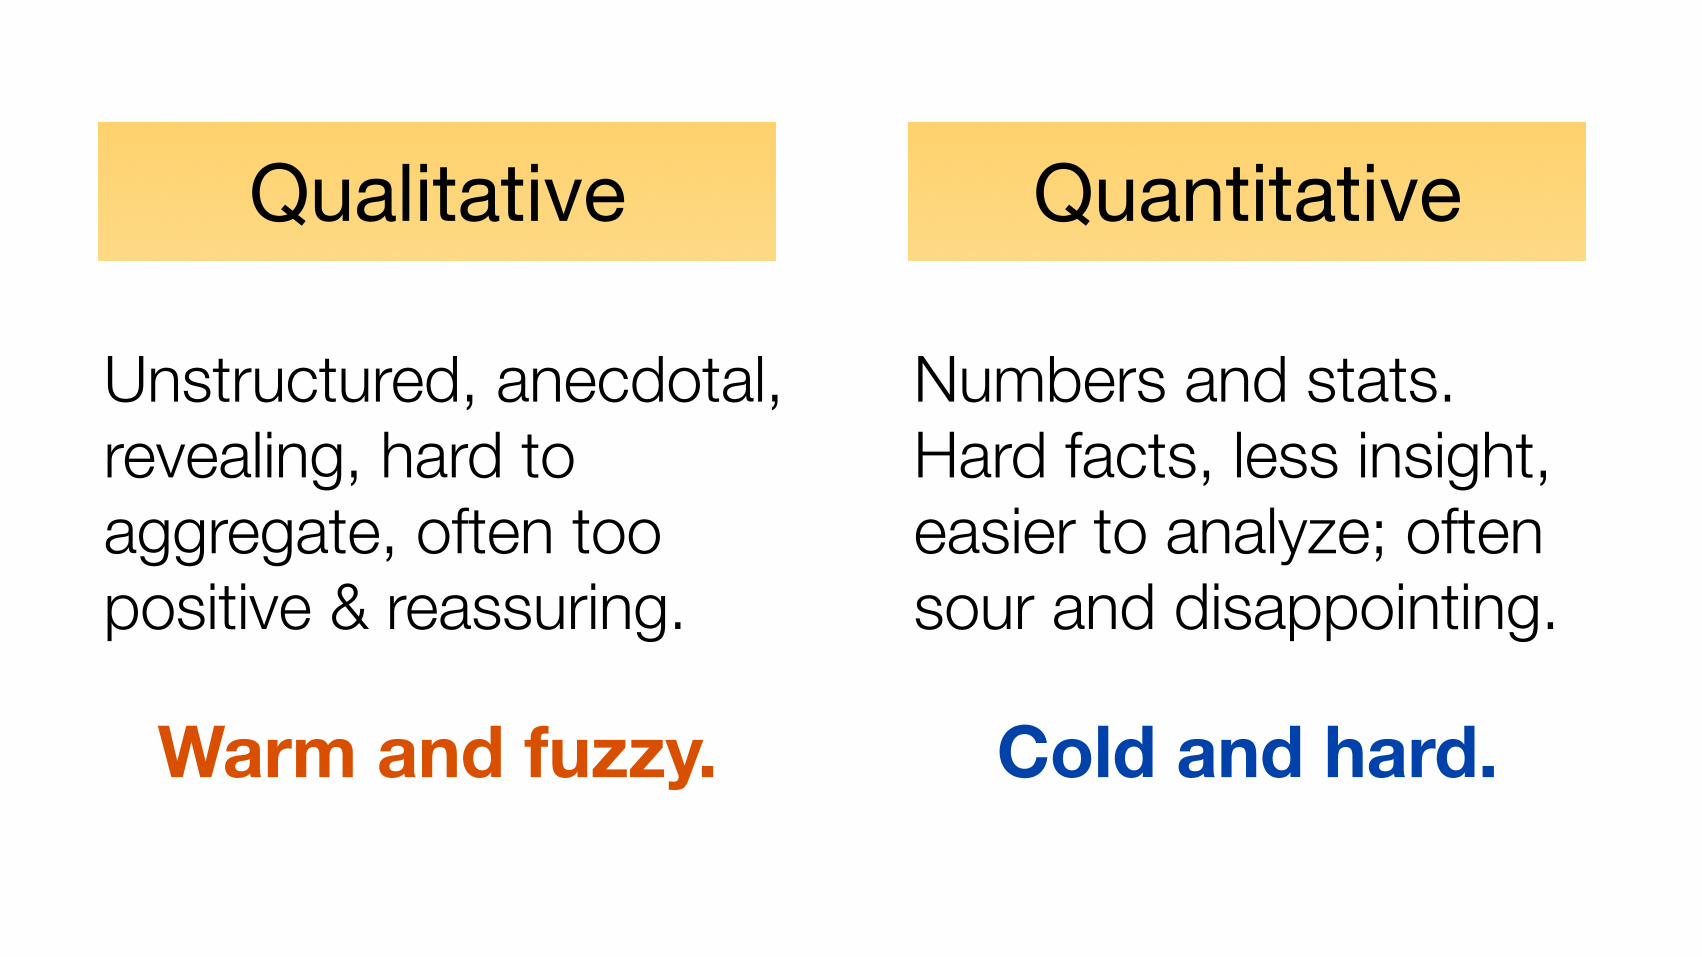
Qualitative
Unstructured, anecdotal, revealing, hard to aggregate, often too positive & reassuring.
Warm and fuzzy.
Quantitative
Numbers and stats. Hard facts, less insight, easier to analyze; often sour and disappointing.
Cold and hard.
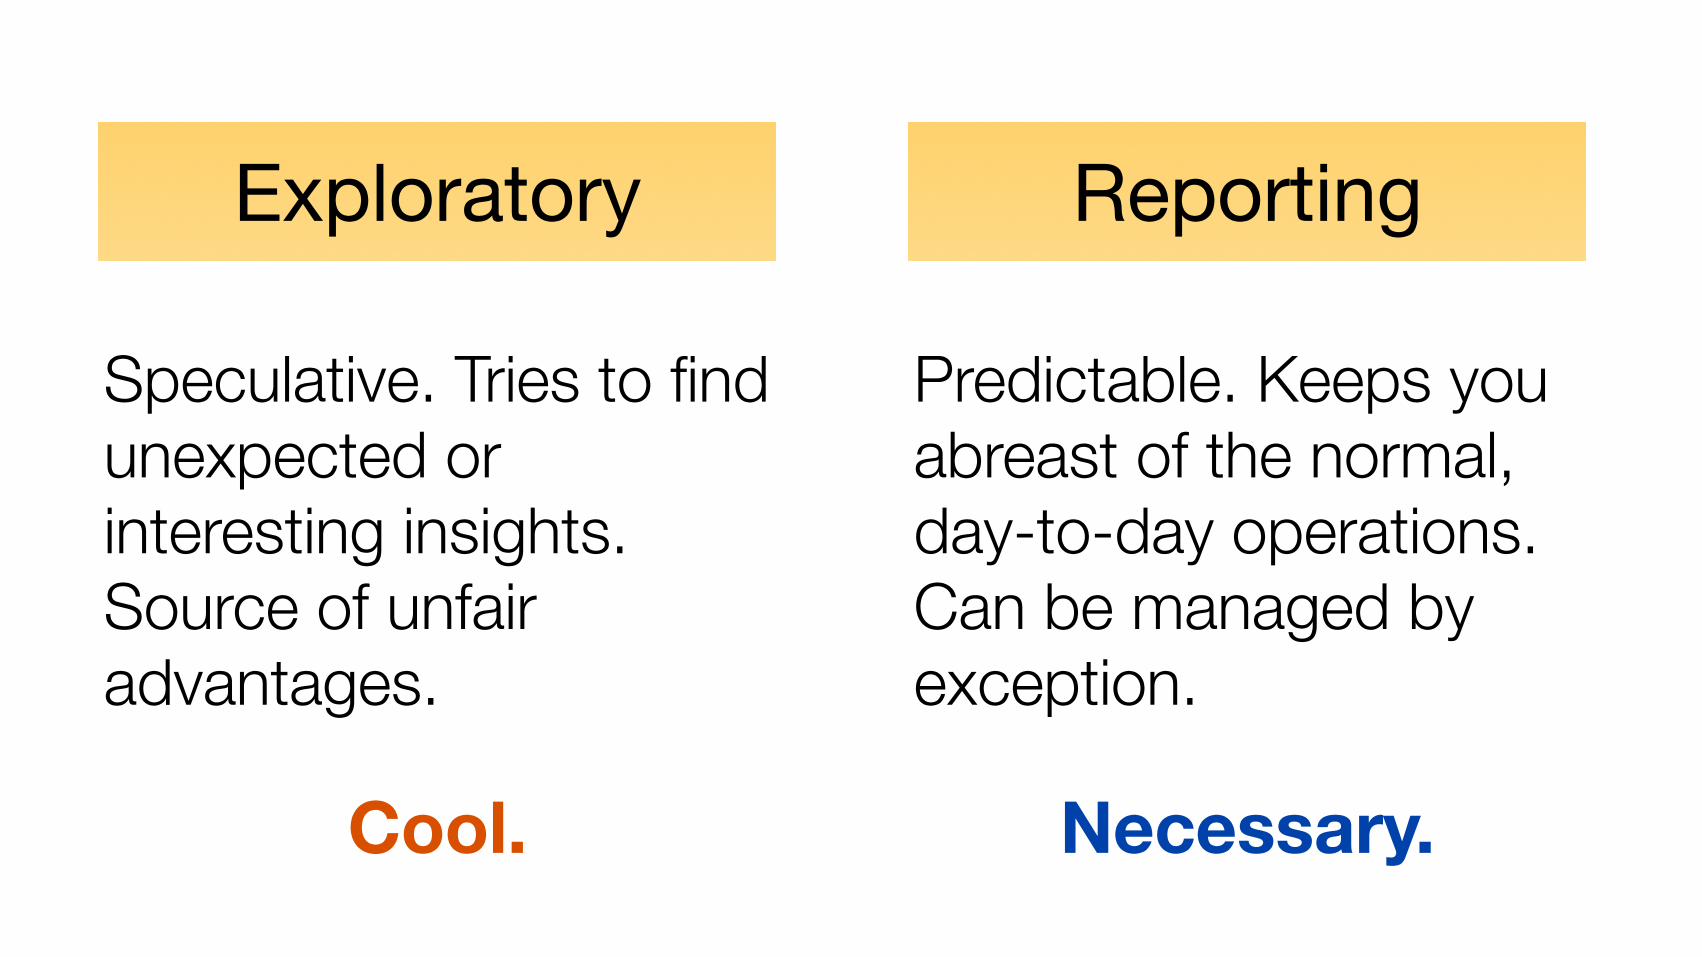
Exploratory
Speculative. Tries to find unexpected or interesting insights. Source of unfair advantages.
Cool.
Reporting
Predictable. Keeps you abreast of the normal, day-to-day operations. Can be managed by exception.
Necessary.
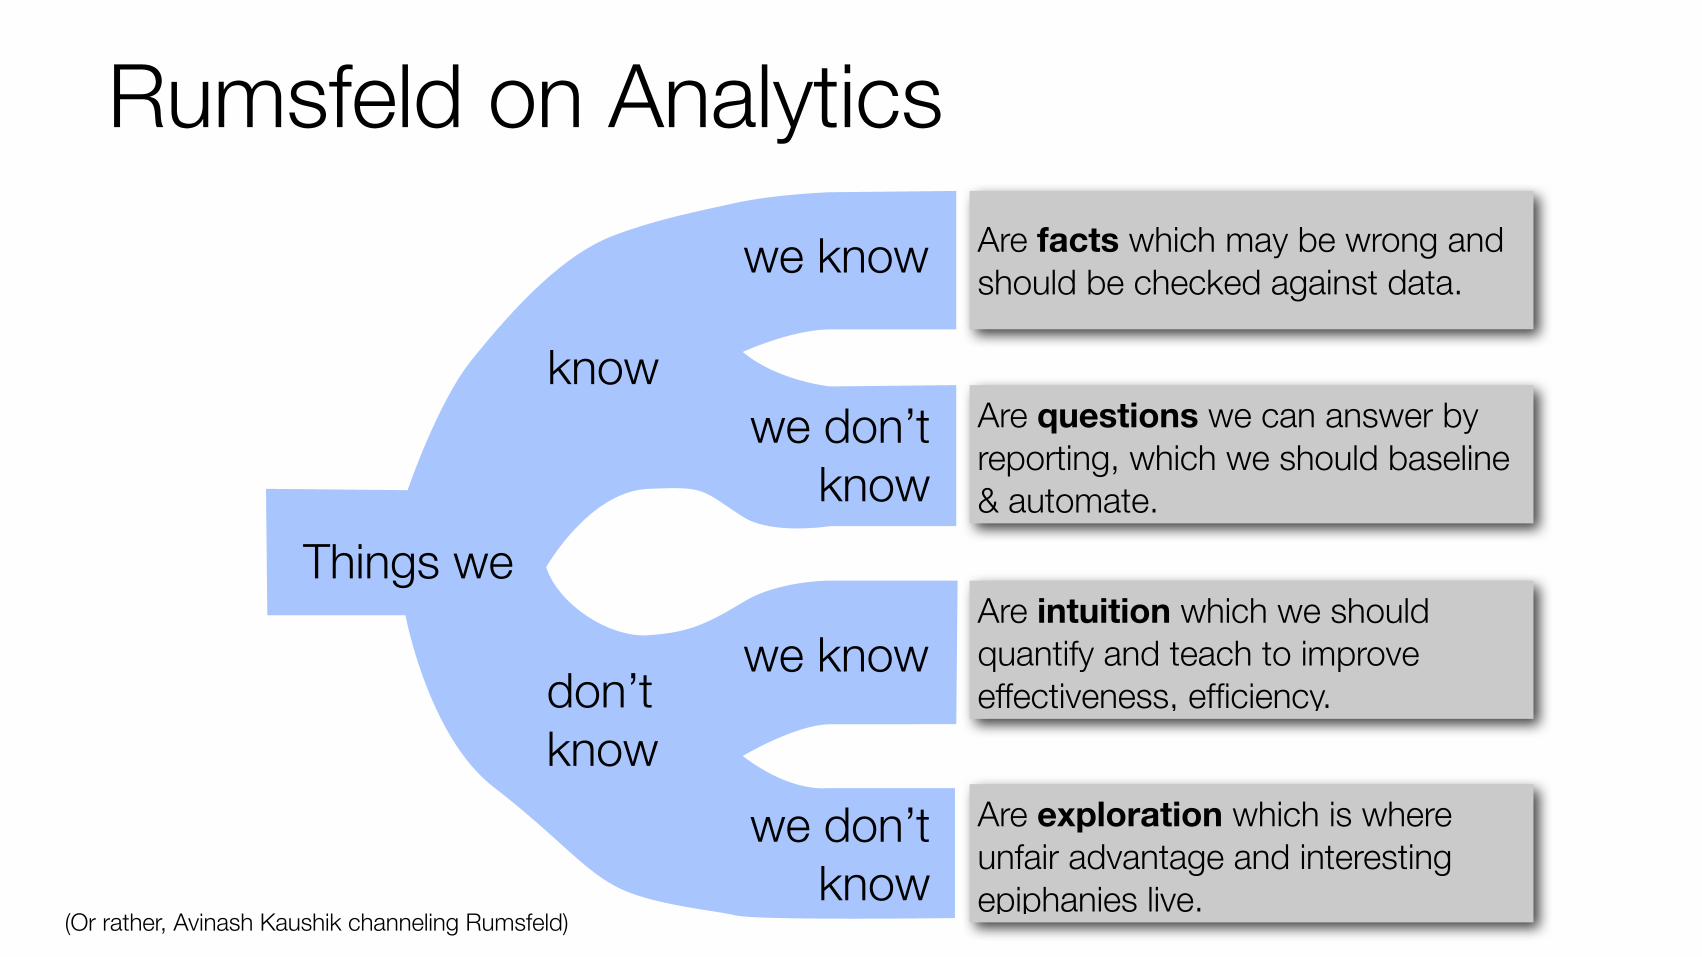
Rumsfeld on Analytics
(Or rather, Avinash Kaushik channeling Rumsfeld)
Things we
know
don’tknow
we know Are facts which may be wrong and should be checked against data.
we don’tknow
Are questions we can answer by reporting, which we should baseline & automate.
we knowAre intuition which we should quantify and teach to improve effectiveness, efficiency.
we don’tknow
Are exploration which is where unfair advantage and interesting epiphanies live.
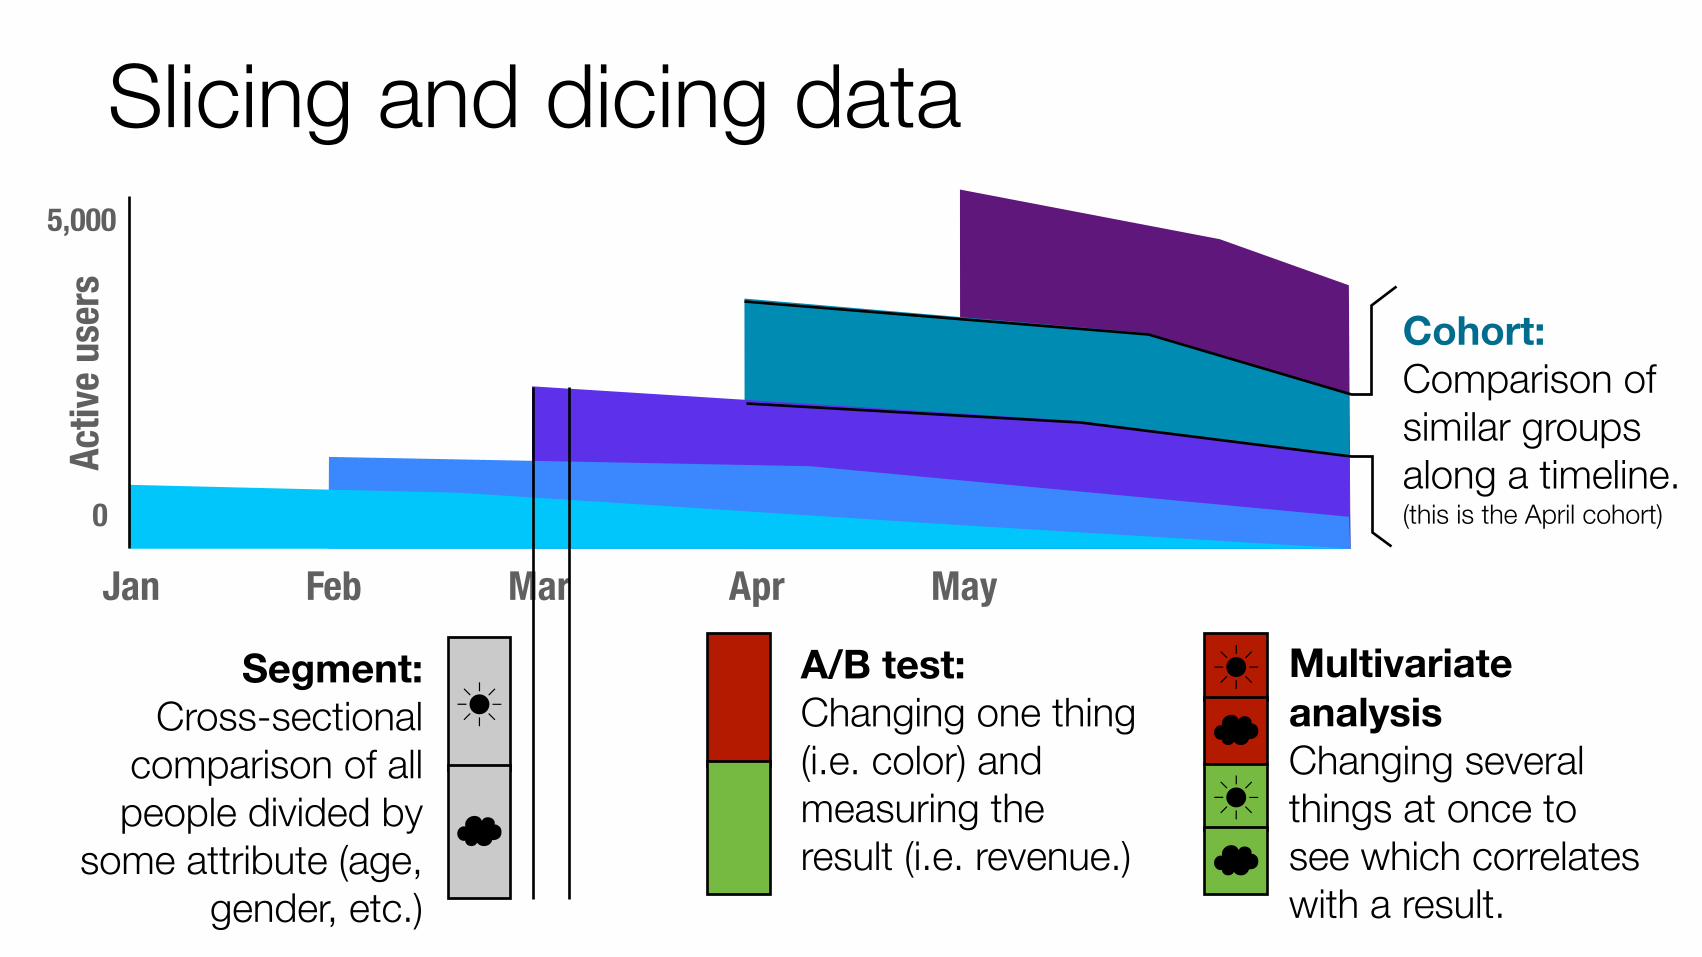
MayAprMarFeb
Slicing and dicing data
Jan
0
5,000
Activ
e use
rs
Cohort: Comparison of similar groups along a timeline. (this is the April cohort)
A/B test: Changing one thing (i.e. color) and measuring the result (i.e. revenue.)
Multivariateanalysis Changing several things at once to see which correlates with a result.
☀☁☀☁
Segment: Cross-sectional
comparison of all people divided by
some attribute (age, gender, etc.)
☀
☁
Which of these two companies is doing better?
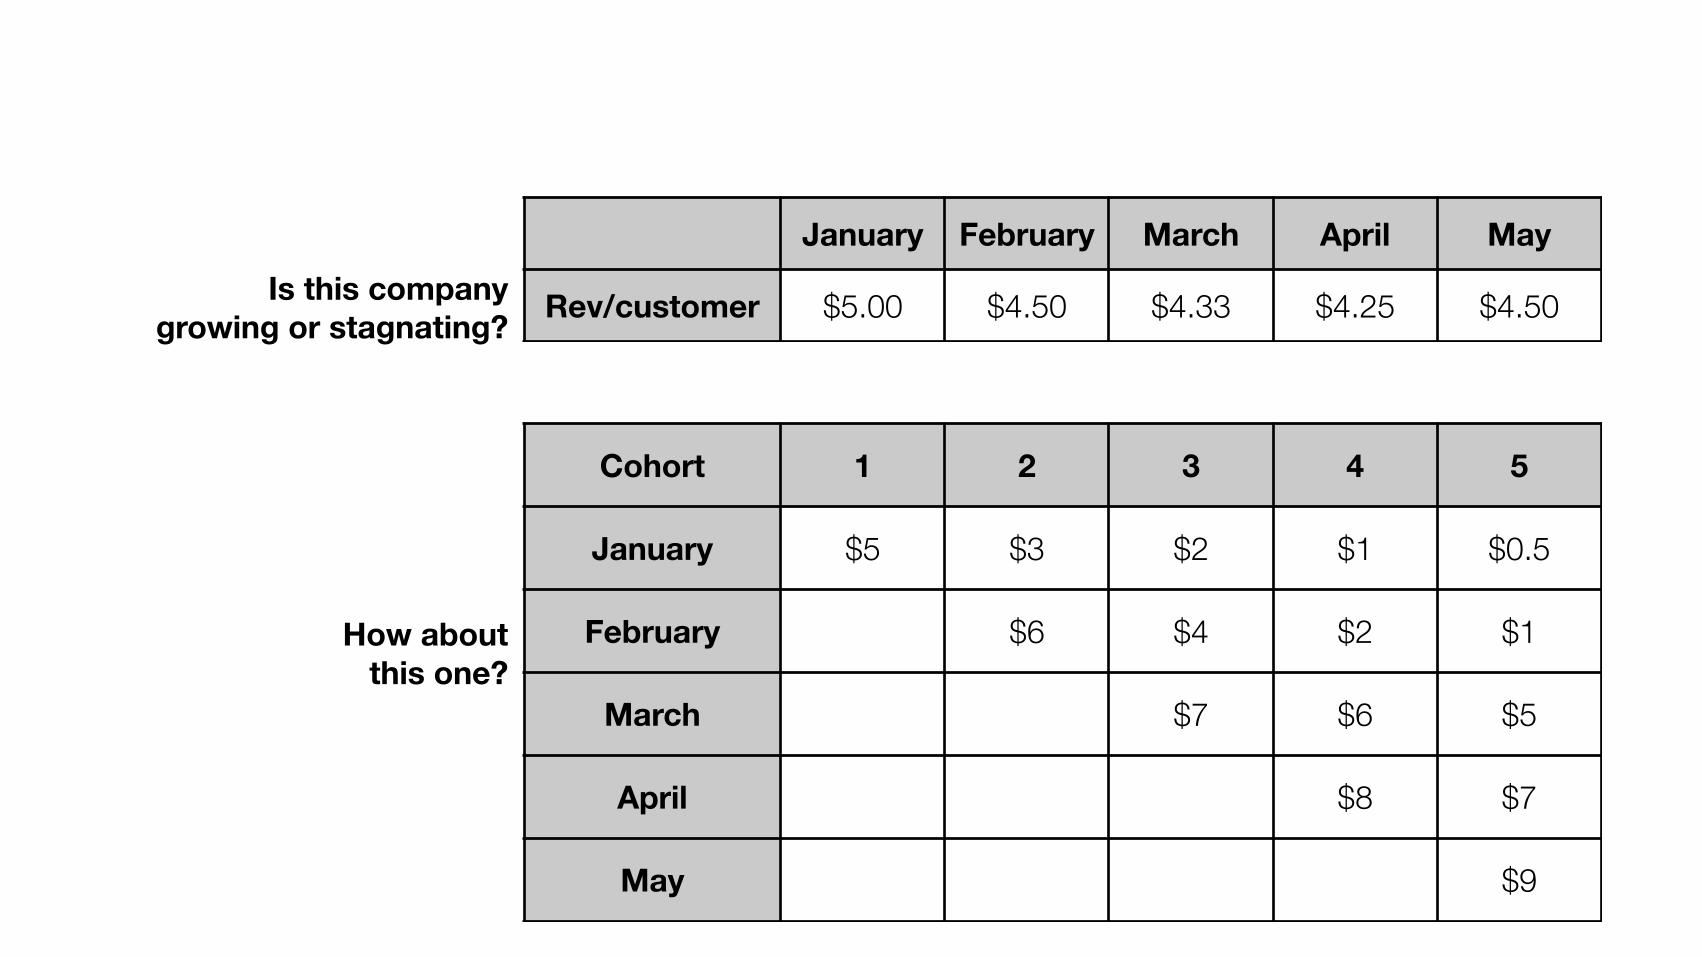
January February March April May
Rev/customer $5.00 $4.50 $4.33 $4.25 $4.50Is this company growing or stagnating?
Cohort 1 2 3 4 5
January $5 $3 $2 $1 $0.5
February $6 $4 $2 $1
March $7 $6 $5
April $8 $7
May $9
How about this one?
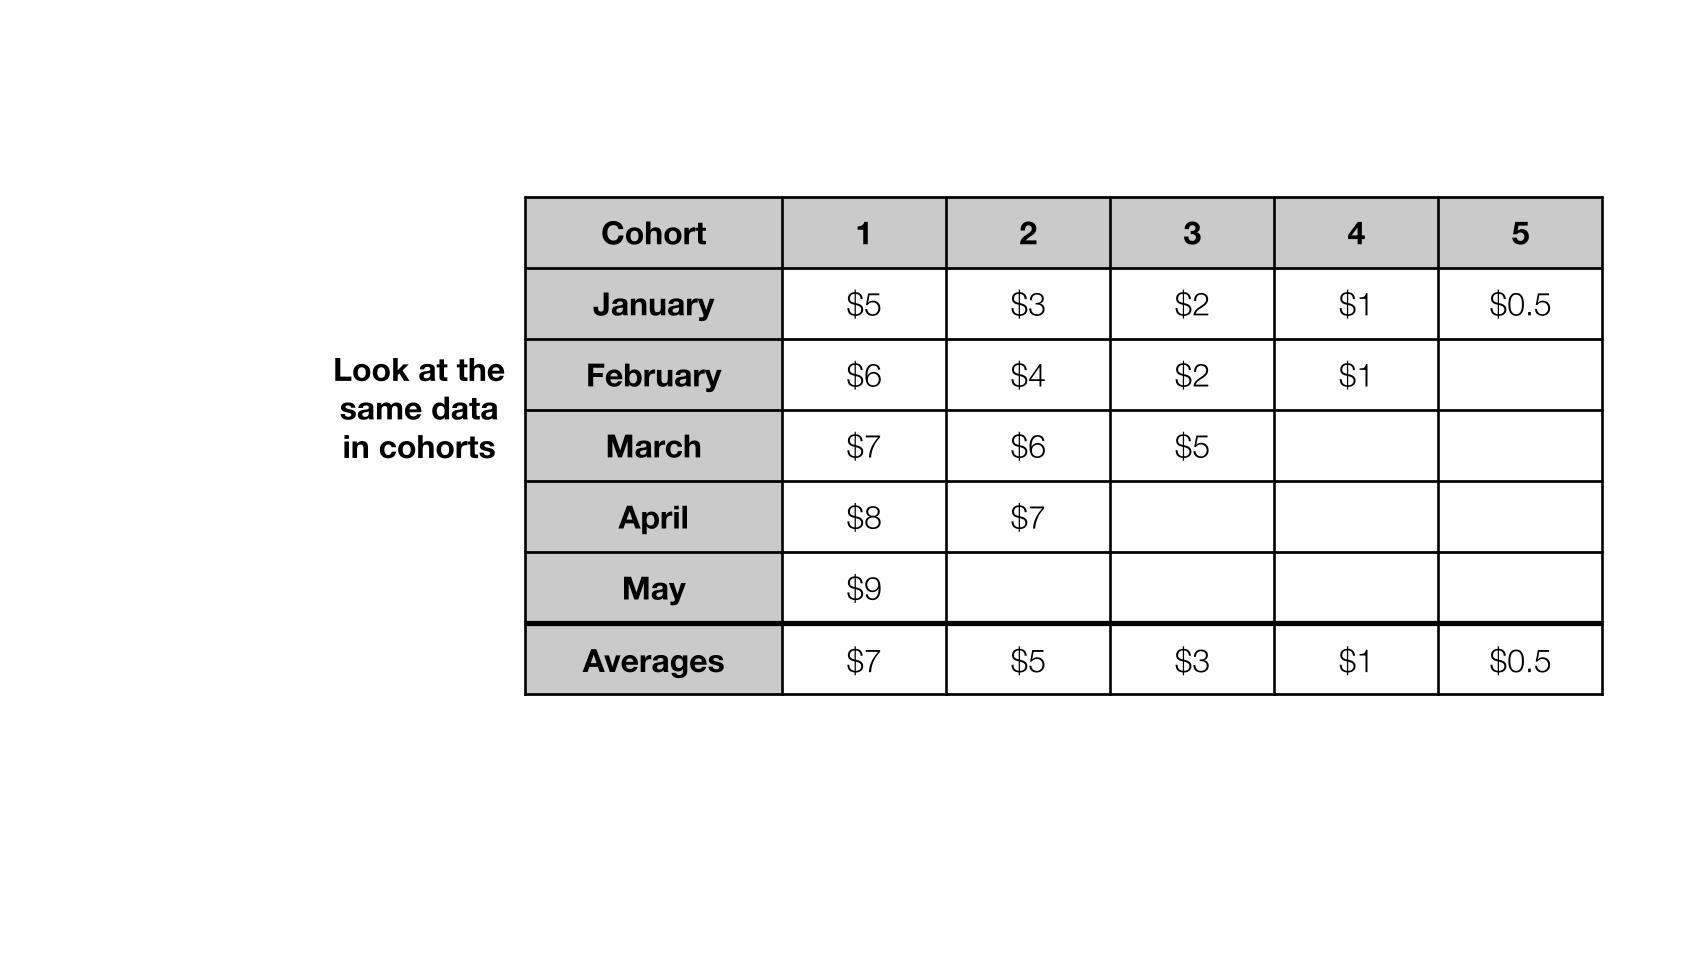
Cohort 1 2 3 4 5
January $5 $3 $2 $1 $0.5
February $6 $4 $2 $1
March $7 $6 $5
April $8 $7
May $9
Averages $7 $5 $3 $1 $0.5
Look at the same data in cohorts
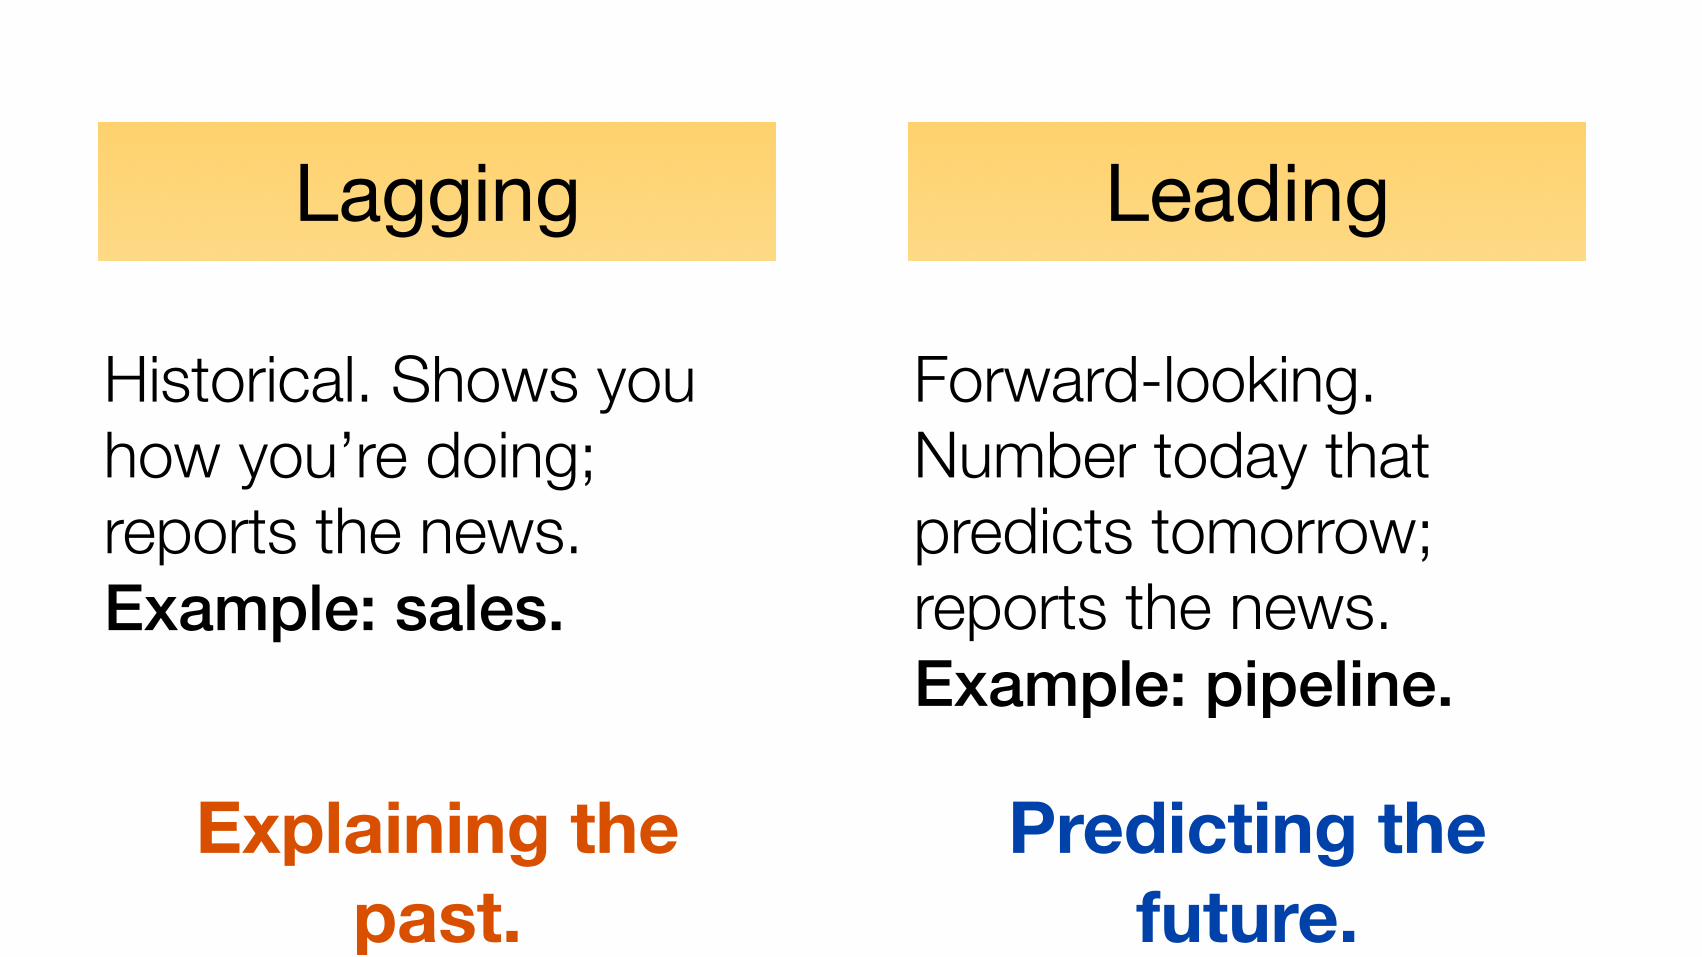
Lagging
Historical. Shows you how you’re doing; reports the news. Example: sales.
Explaining the past.
Leading
Forward-looking. Number today that predicts tomorrow; reports the news. Example: pipeline.
Predicting the future.
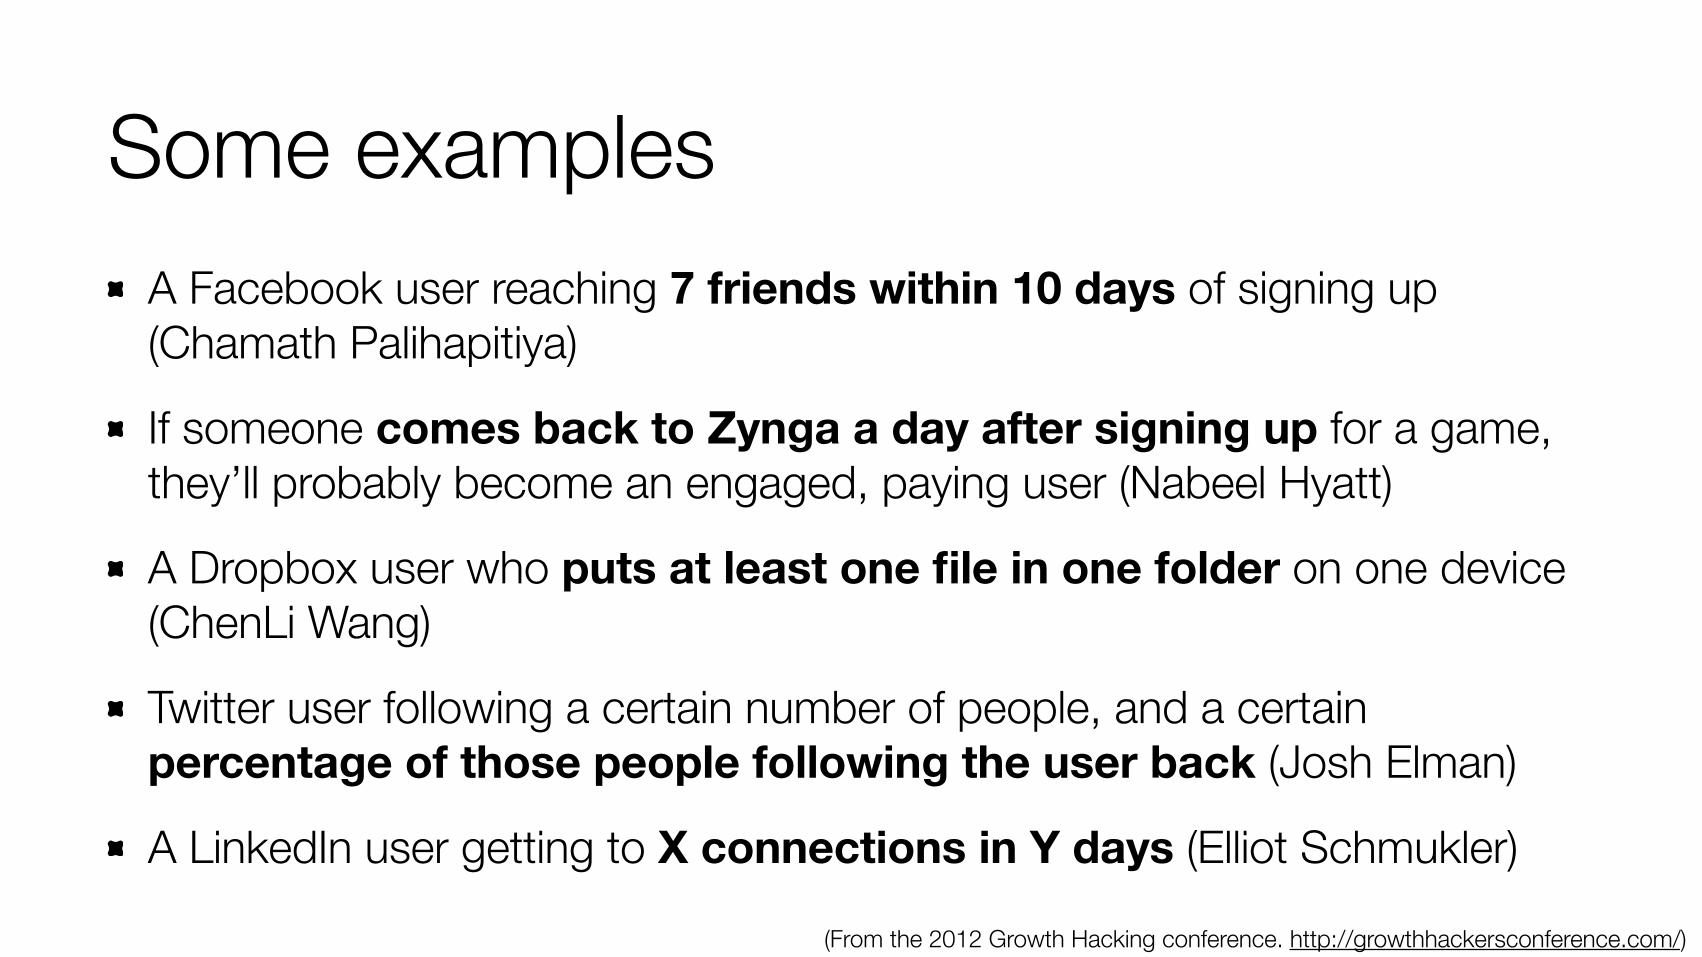
A Facebook user reaching 7 friends within 10 days of signing up (Chamath Palihapitiya)
If someone comes back to Zynga a day after signing up for a game, they’ll probably become an engaged, paying user (Nabeel Hyatt)
A Dropbox user who puts at least one file in one folder on one device (ChenLi Wang)
Twitter user following a certain number of people, and a certain percentage of those people following the user back (Josh Elman)
A LinkedIn user getting to X connections in Y days (Elliot Schmukler)
Some examples
(From the 2012 Growth Hacking conference. http://growthhackersconference.com/)

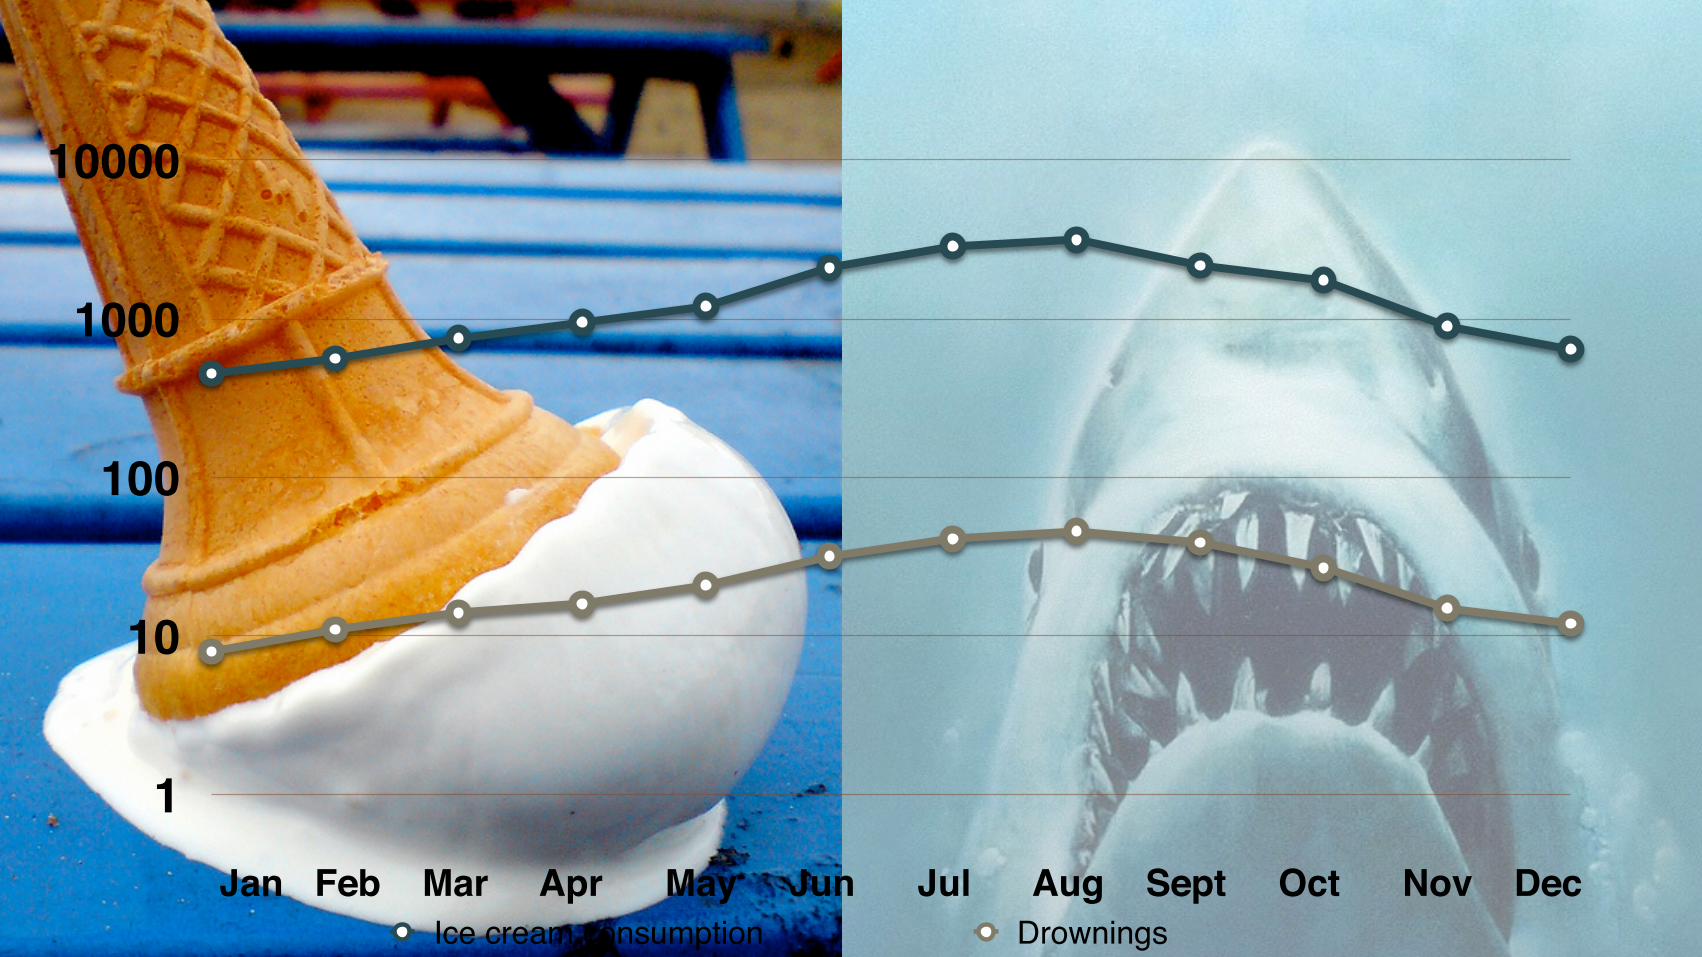
Which means it’s time to talk about correlation.
1
10
100
1000
10000
Ice cream consumption DrowningsJan Feb Mar Apr May Jun Jul Aug Sept Oct Nov Dec
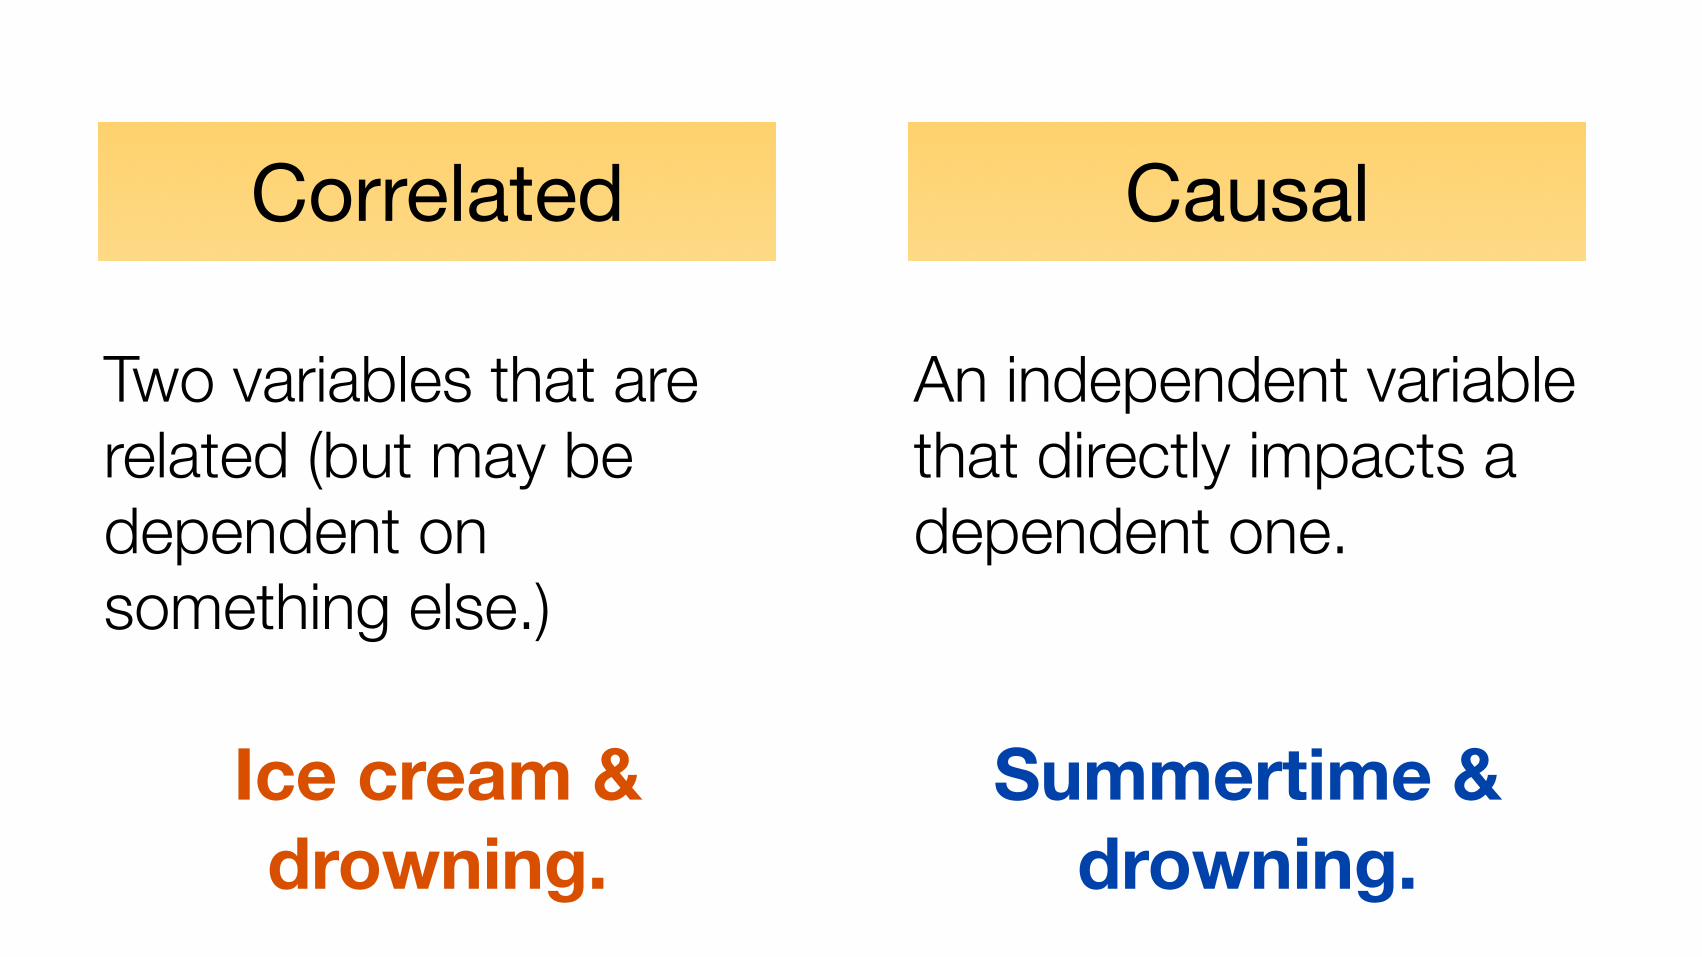
Correlated
Two variables that are related (but may be dependent on something else.)
Ice cream & drowning.
Causal
An independent variable that directly impacts a dependent one.
Summertime & drowning.
A leading, causal metric is a superpower.
h"p://www.flickr.com/photos/bloke_with_camera/401812833/sizes/o/in/photostream/

Why is Nigerian spam so badly written?
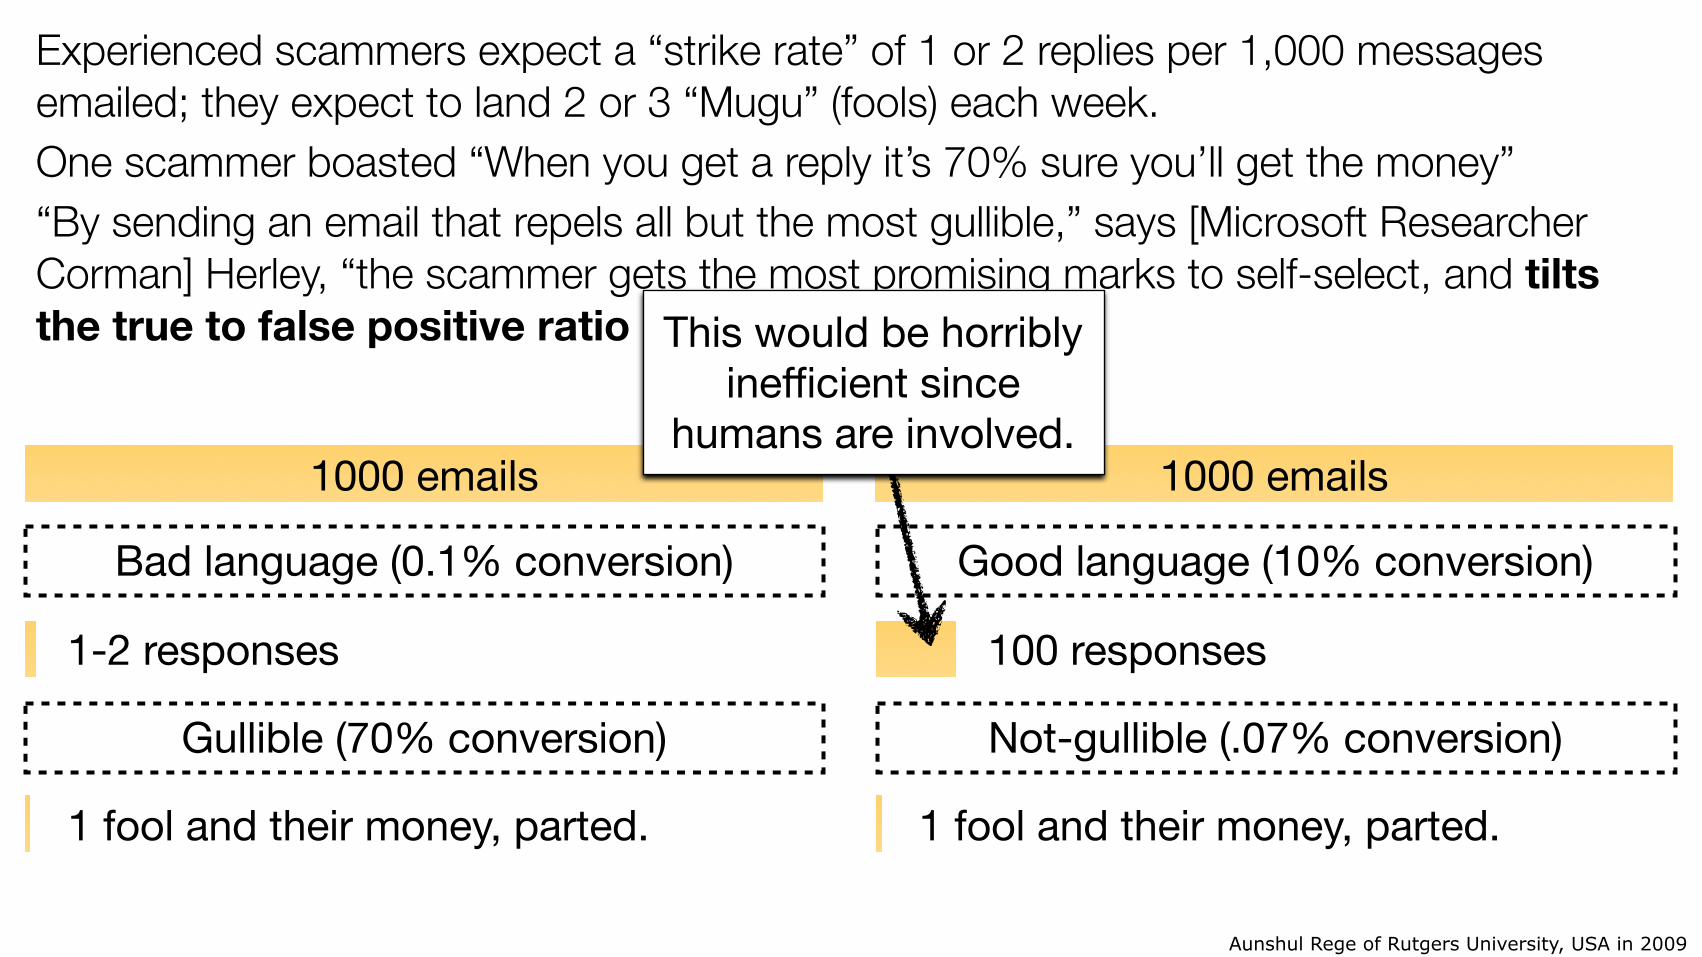
Aunshul Rege of Rutgers University, USA in 2009
Experienced scammers expect a “strike rate” of 1 or 2 replies per 1,000 messages emailed; they expect to land 2 or 3 “Mugu” (fools) each week. One scammer boasted “When you get a reply it’s 70% sure you’ll get the money” “By sending an email that repels all but the most gullible,” says [Microsoft Researcher Corman] Herley, “the scammer gets the most promising marks to self-select, and tilts the true to false positive ratio in his favor.”
1000 emails
1-2 responses
1 fool and their money, parted.
Bad language (0.1% conversion)
Gullible (70% conversion)
1000 emails
100 responses
1 fool and their money, parted.
Good language (10% conversion)
Not-gullible (.07% conversion)
This would be horribly inefficient since
humans are involved.

Turns out the word “Nigeria” is the best way to identify promising prospects.
Nigerian spammers really understand their target market.
They see past vanity metrics.
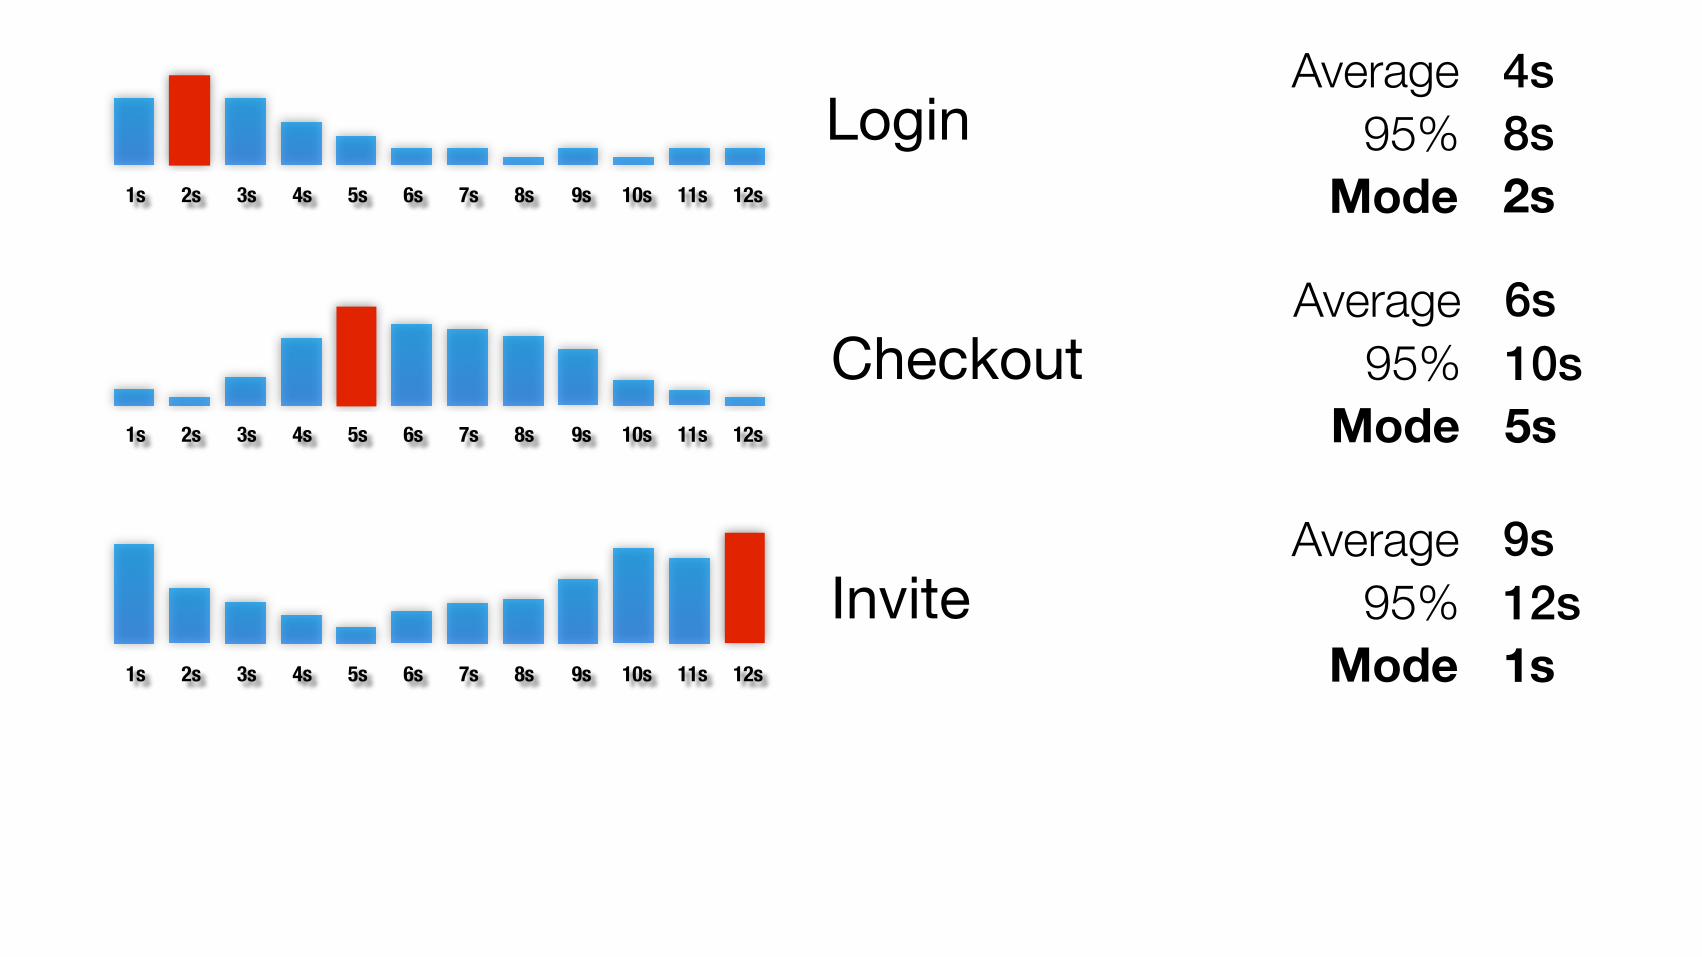
Fundamental:Be careful rolling things up.

http://upload.wikimedia.org/wikipedia/commons/0/0e/Count-von-count.jpg
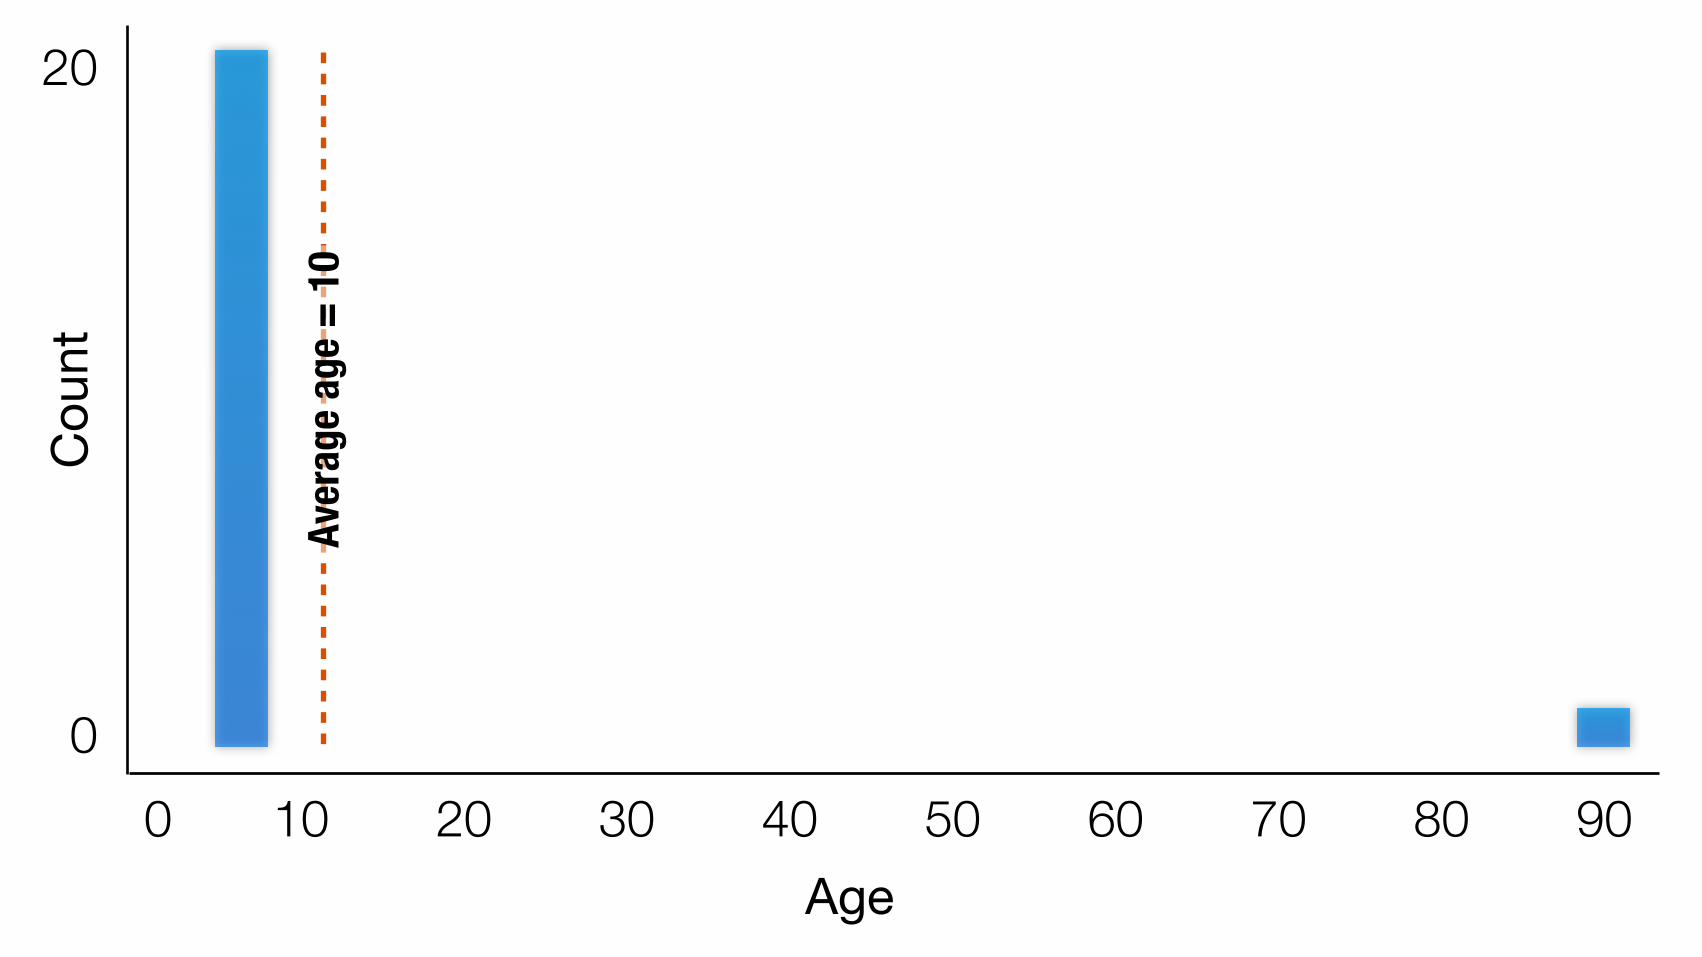
0 10 20 30 40 50 60 70 80 90Age
0
20C
ount
Aver
age a
ge =
10
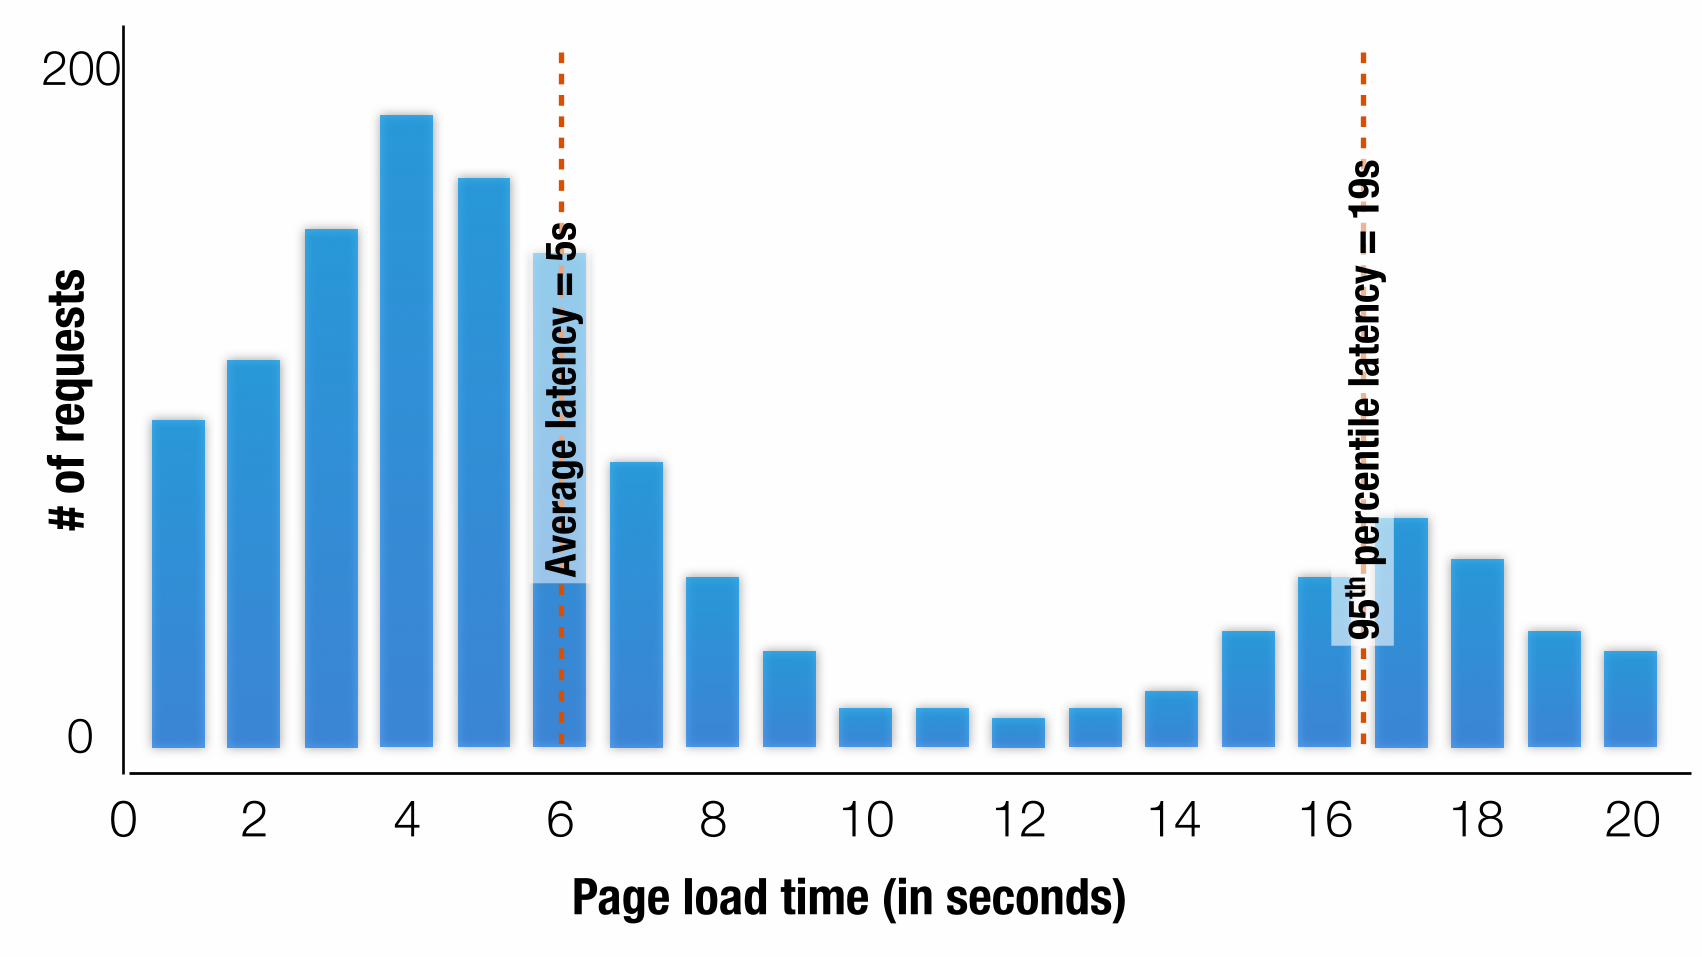
0 2 4 6 8 10 12 14 16 18Page load time (in seconds)
0
200# o
f req
uest
s
20
Aver
age l
aten
cy =
5s
95th
per
cent
ile la
tenc
y = 19
s

KISS
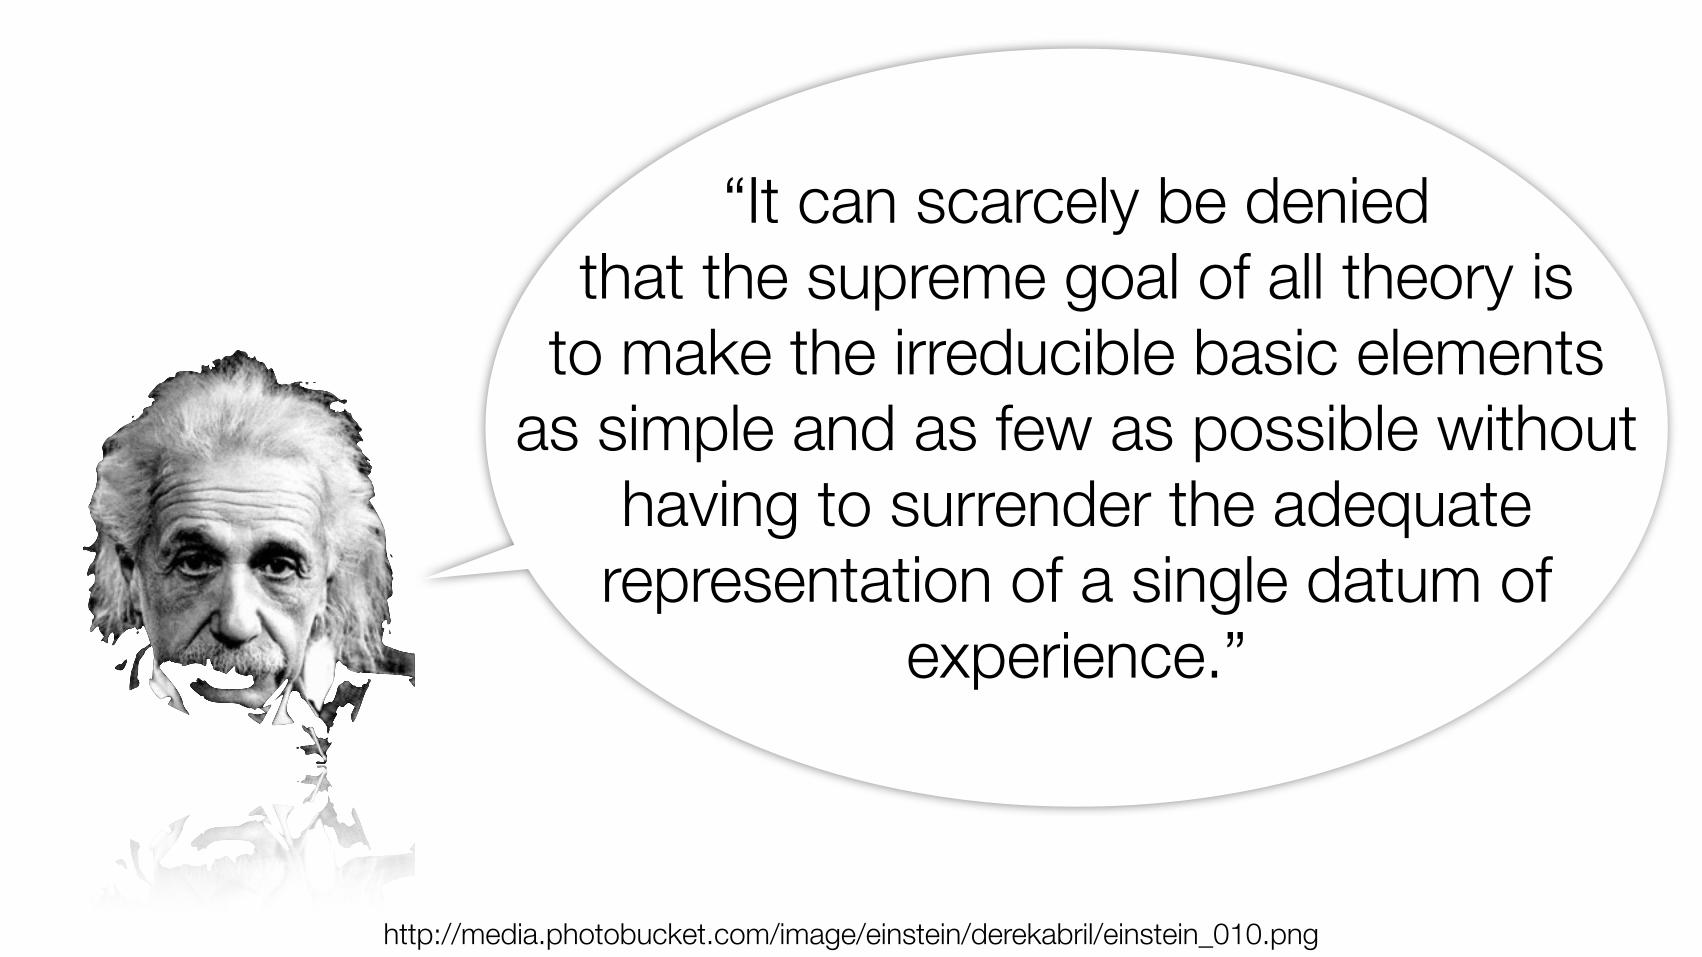
“It can scarcely be denied that the supreme goal of all theory is
to make the irreducible basic elements as simple and as few as possible without
having to surrender the adequate representation of a single datum of
experience.”
http://media.photobucket.com/image/einstein/derekabril/einstein_010.png
“As simple as possible,but no simpler.”
*(FYI, this is irony.)
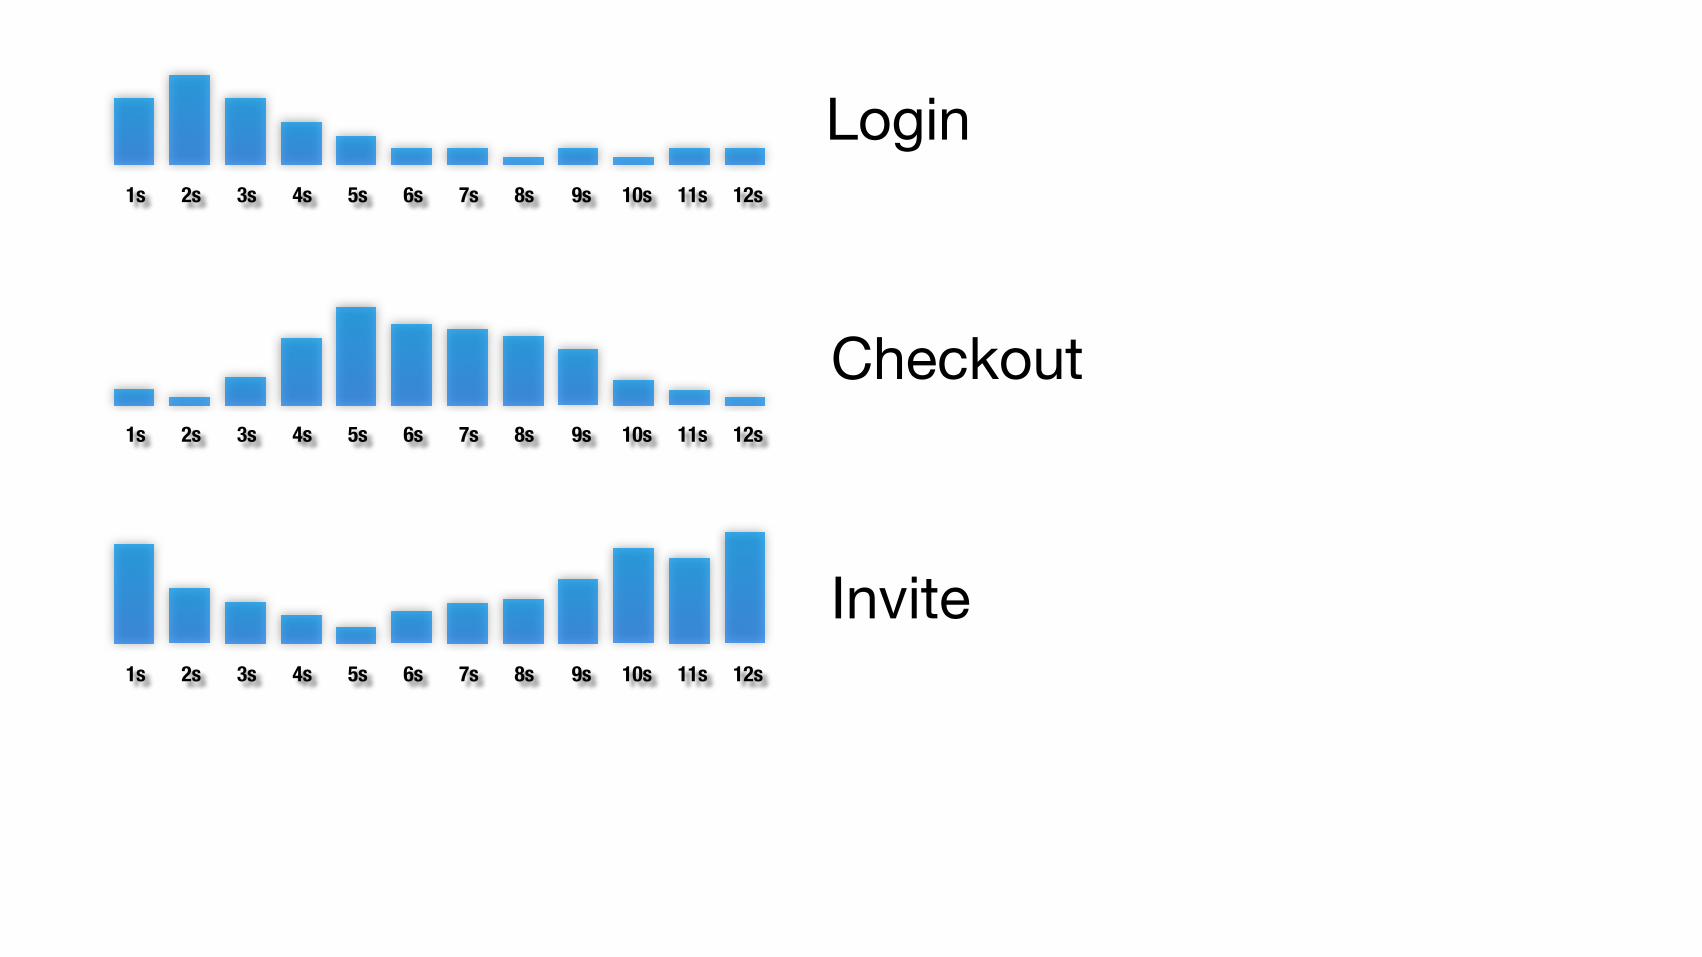
1s 2s 3s 4s 5s 6s 7s 8s 9s 10s 11s 12s
1s 2s 3s 4s 5s 6s 7s 8s 9s 10s 11s 12s
1s 2s 3s 4s 5s 6s 7s 8s 9s 10s 11s 12s
Login
Checkout
Invite
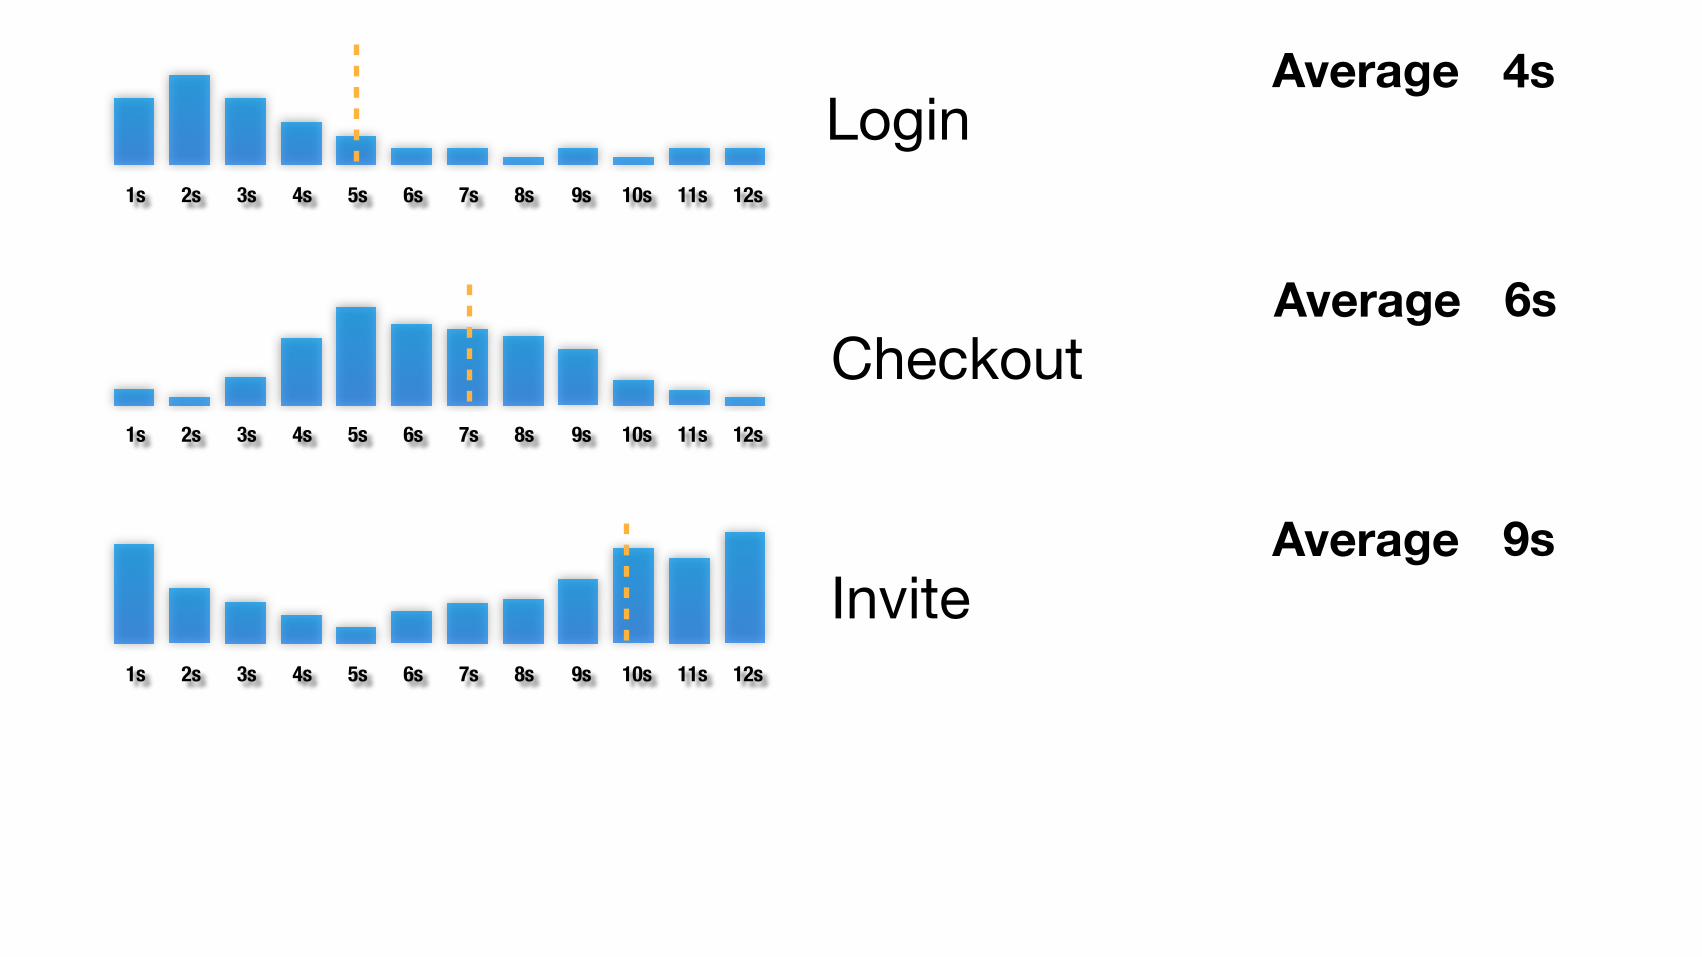
1s 2s 3s 4s 5s 6s 7s 8s 9s 10s 11s 12s
1s 2s 3s 4s 5s 6s 7s 8s 9s 10s 11s 12s
1s 2s 3s 4s 5s 6s 7s 8s 9s 10s 11s 12s
Login
Checkout
Invite
Average 4s
Average 6s
Average 9s
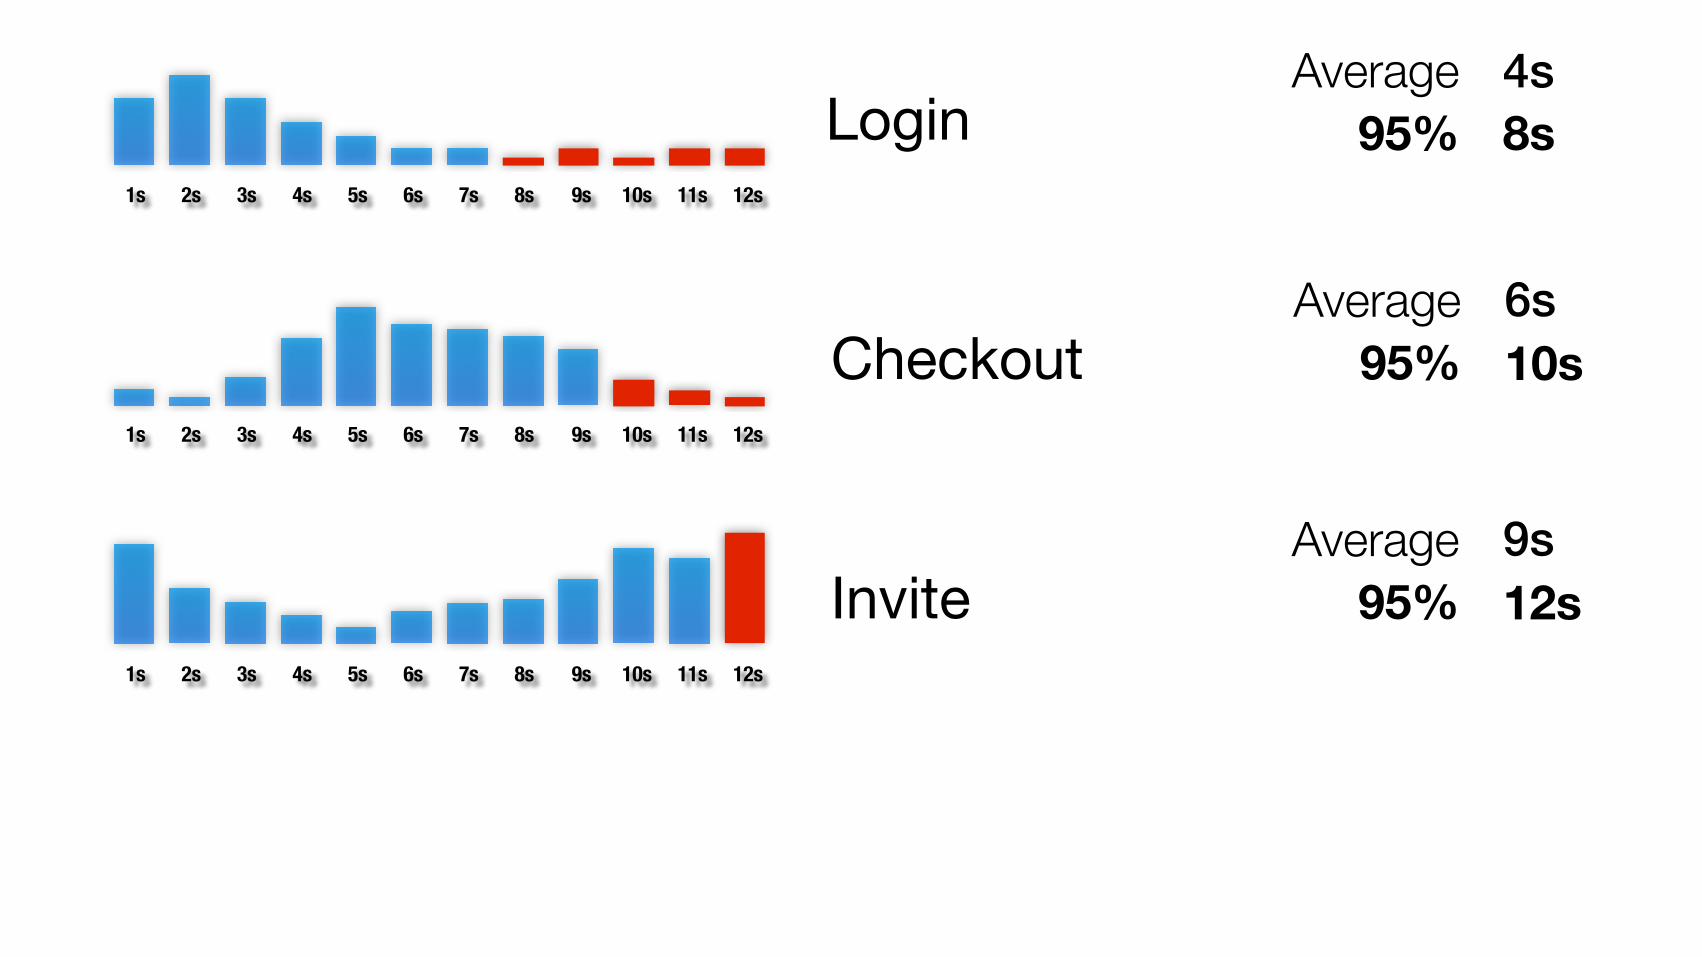
1s 2s 3s 4s 5s 6s 7s 8s 9s 10s 11s 12s
1s 2s 3s 4s 5s 6s 7s 8s 9s 10s 11s 12s
1s 2s 3s 4s 5s 6s 7s 8s 9s 10s 11s 12s
Login
Checkout
Invite
Average95%
4s8s
Average95%
6s10s
Average95%
9s12s
1s 2s 3s 4s 5s 6s 7s 8s 9s 10s 11s 12s
1s 2s 3s 4s 5s 6s 7s 8s 9s 10s 11s 12s
1s 2s 3s 4s 5s 6s 7s 8s 9s 10s 11s 12s
Login
Checkout
Invite
Average95%
Mode
4s8s2s
Average95%
Mode
6s10s5s
Average95%
Mode
9s12s1s
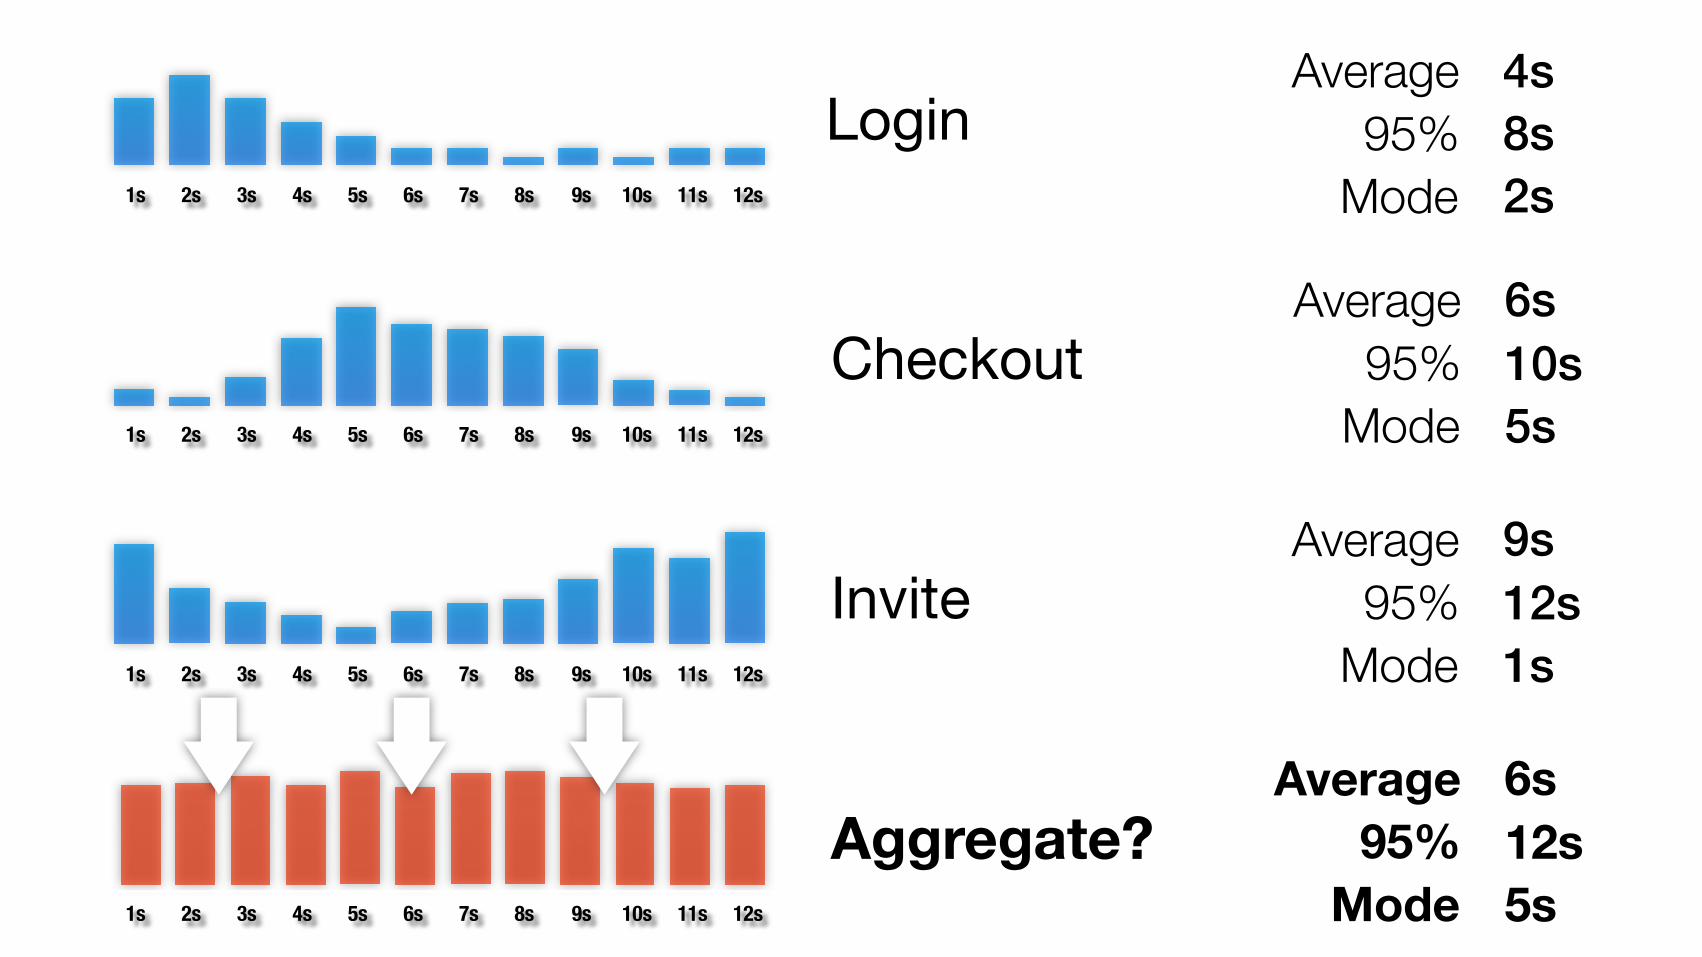
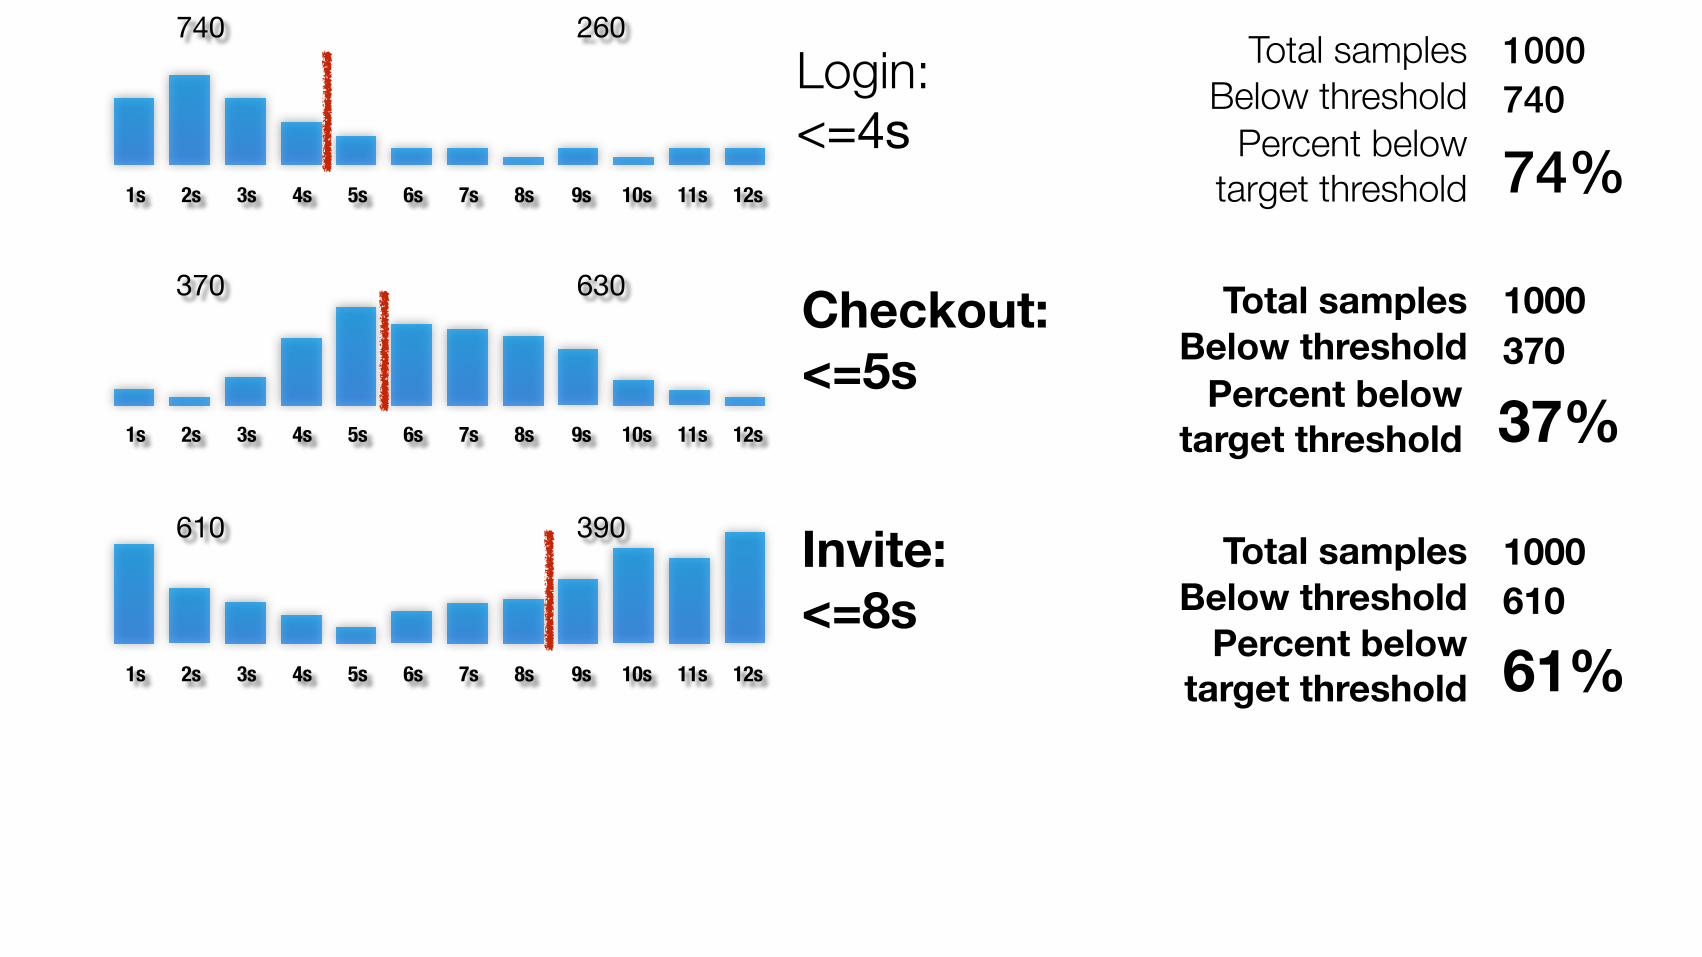
Aggregate?
Average95%
Mode
4s8s2s
Average95%
Mode
6s10s5s
Average95%
Mode
9s12s1s
Average95%
Mode
6s12s5s1s 2s 3s 4s 5s 6s 7s 8s 9s 10s 11s 12s
1s 2s 3s 4s 5s 6s 7s 8s 9s 10s 11s 12s
1s 2s 3s 4s 5s 6s 7s 8s 9s 10s 11s 12s
1s 2s 3s 4s 5s 6s 7s 8s 9s 10s 11s 12s
Login
Checkout
Invite
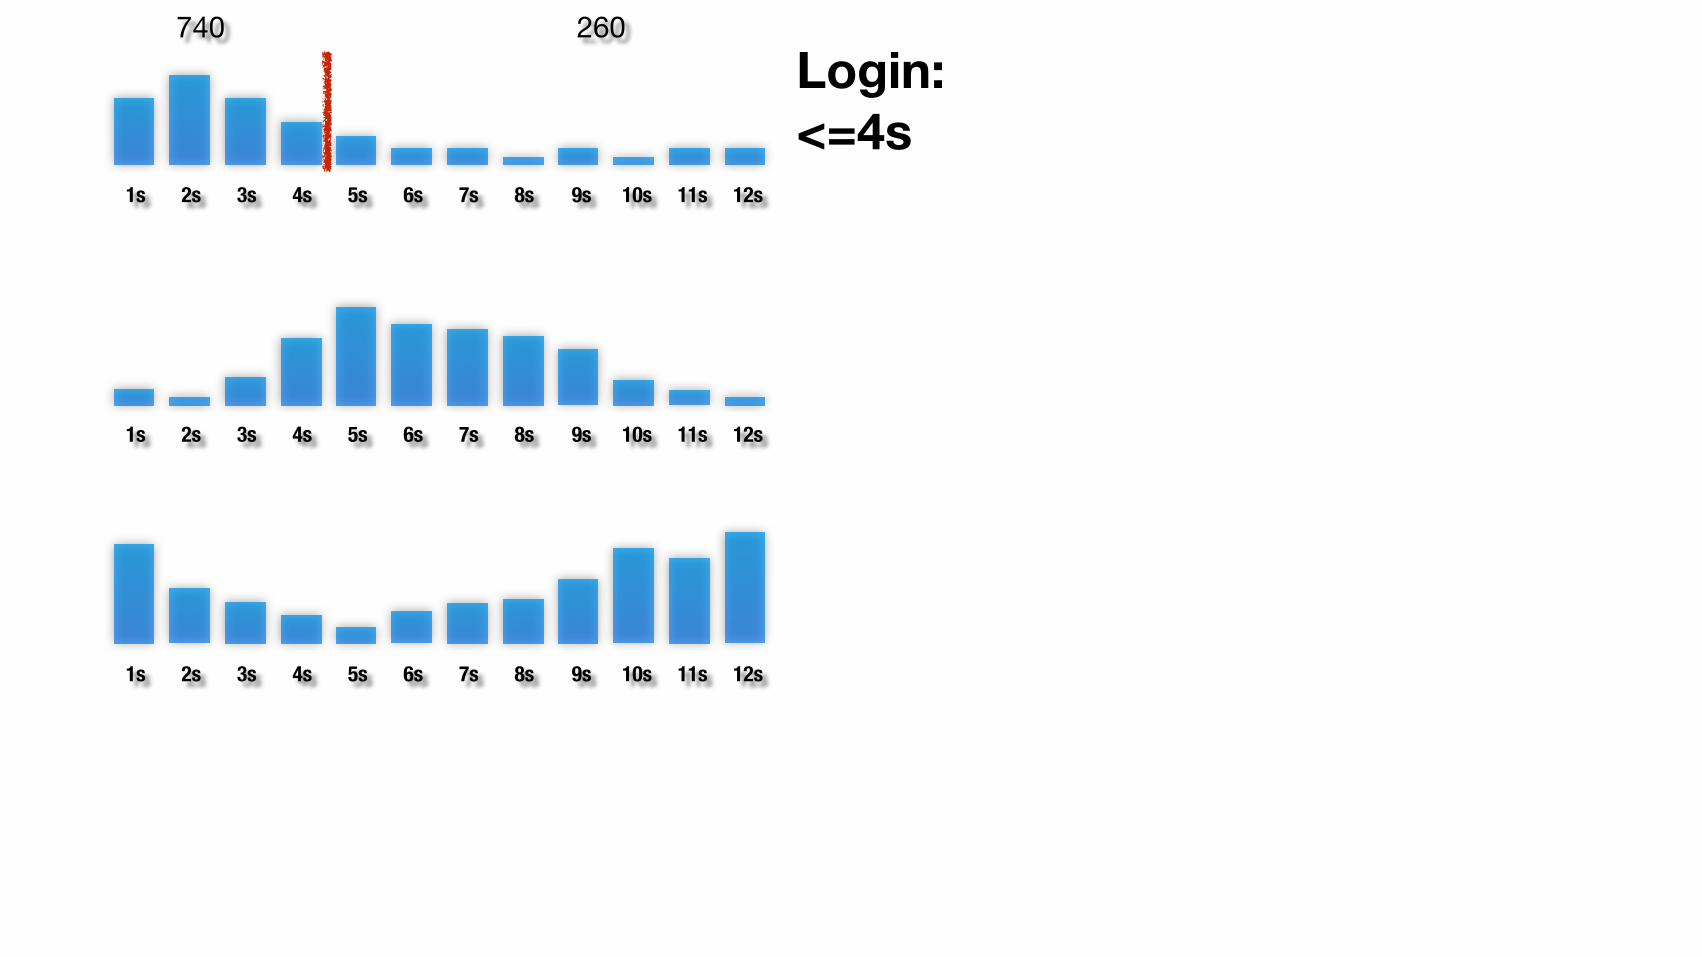
1s 2s 3s 4s 5s 6s 7s 8s 9s 10s 11s 12s
1s 2s 3s 4s 5s 6s 7s 8s 9s 10s 11s 12s
1s 2s 3s 4s 5s 6s 7s 8s 9s 10s 11s 12s
Login: <=4s
740 260
1s 2s 3s 4s 5s 6s 7s 8s 9s 10s 11s 12s
1s 2s 3s 4s 5s 6s 7s 8s 9s 10s 11s 12s
1s 2s 3s 4s 5s 6s 7s 8s 9s 10s 11s 12s
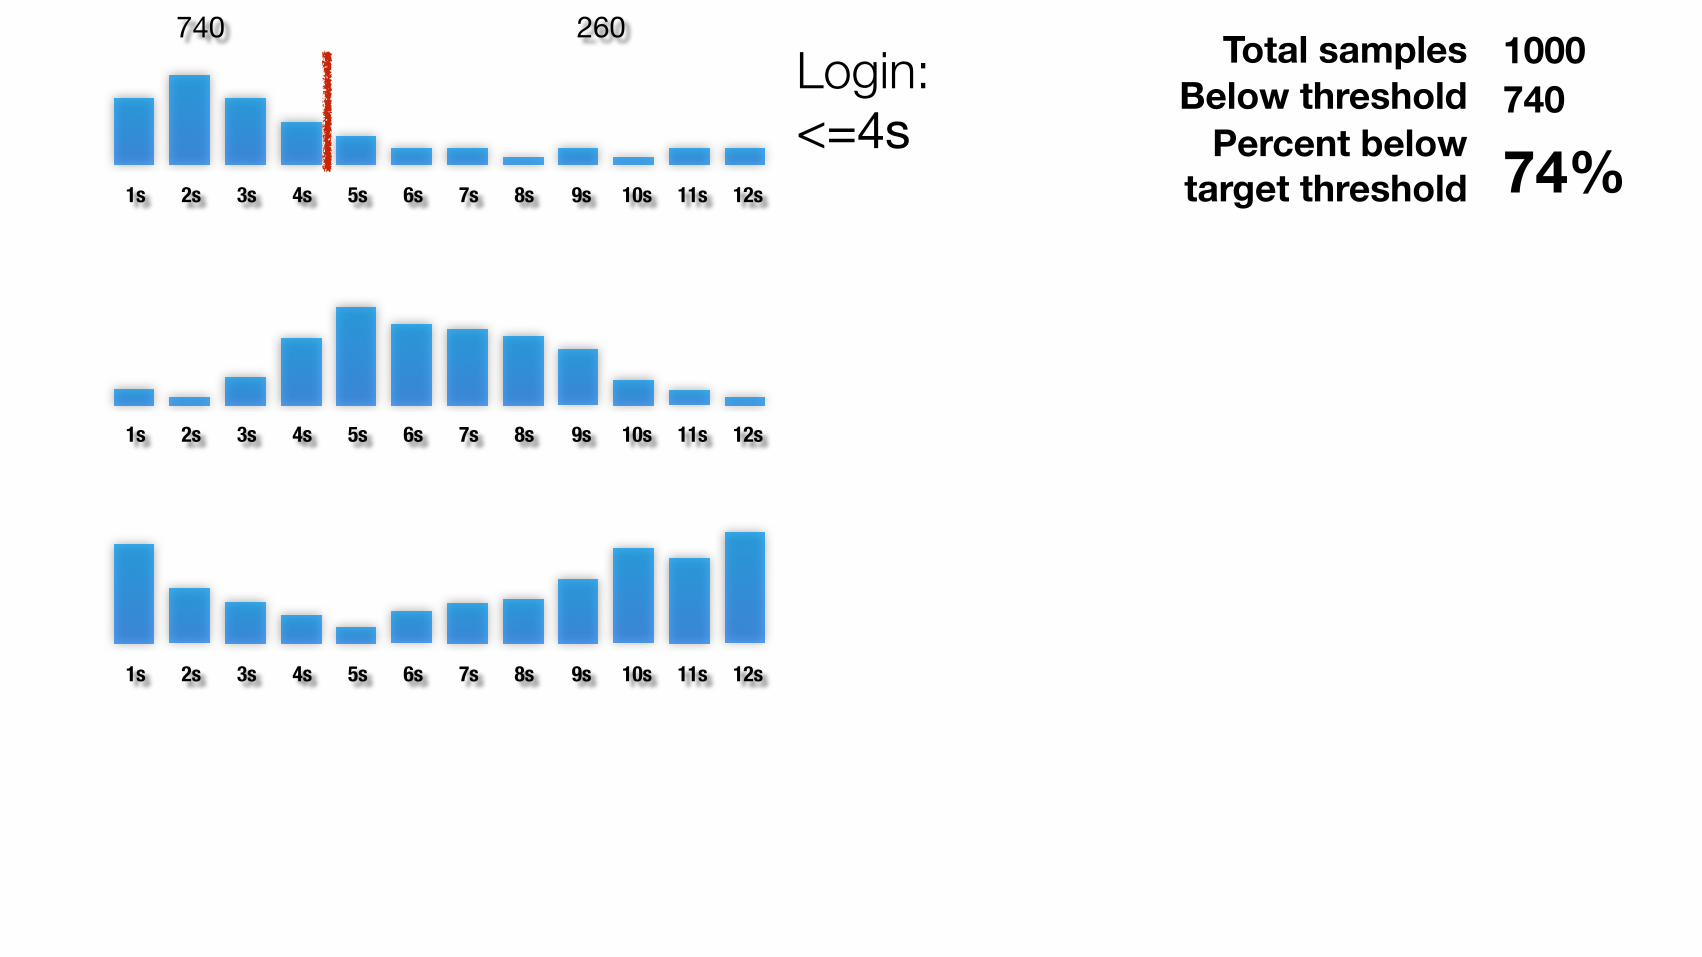
Login: <=4s Percent below
target threshold 74%
Total samples 1000Below threshold 740
740 260
1s 2s 3s 4s 5s 6s 7s 8s 9s 10s 11s 12s
1s 2s 3s 4s 5s 6s 7s 8s 9s 10s 11s 12s
1s 2s 3s 4s 5s 6s 7s 8s 9s 10s 11s 12s
Login: <=4s
Checkout: <=5s
Invite: <=8s
Percent below target threshold 74%
Percent below target threshold 37%
Percent below target threshold 61%
Total samples 1000Below threshold 740
Total samples 1000Below threshold 370
Total samples 1000Below threshold 610
740 260
370 630
610 390
1s 2s 3s 4s 5s 6s 7s 8s 9s 10s 11s 12s
1s 2s 3s 4s 5s 6s 7s 8s 9s 10s 11s 12s
1s 2s 3s 4s 5s 6s 7s 8s 9s 10s 11s 12s
1s 2s 3s 4s 5s 6s 7s 8s 9s 10s 11s 12s
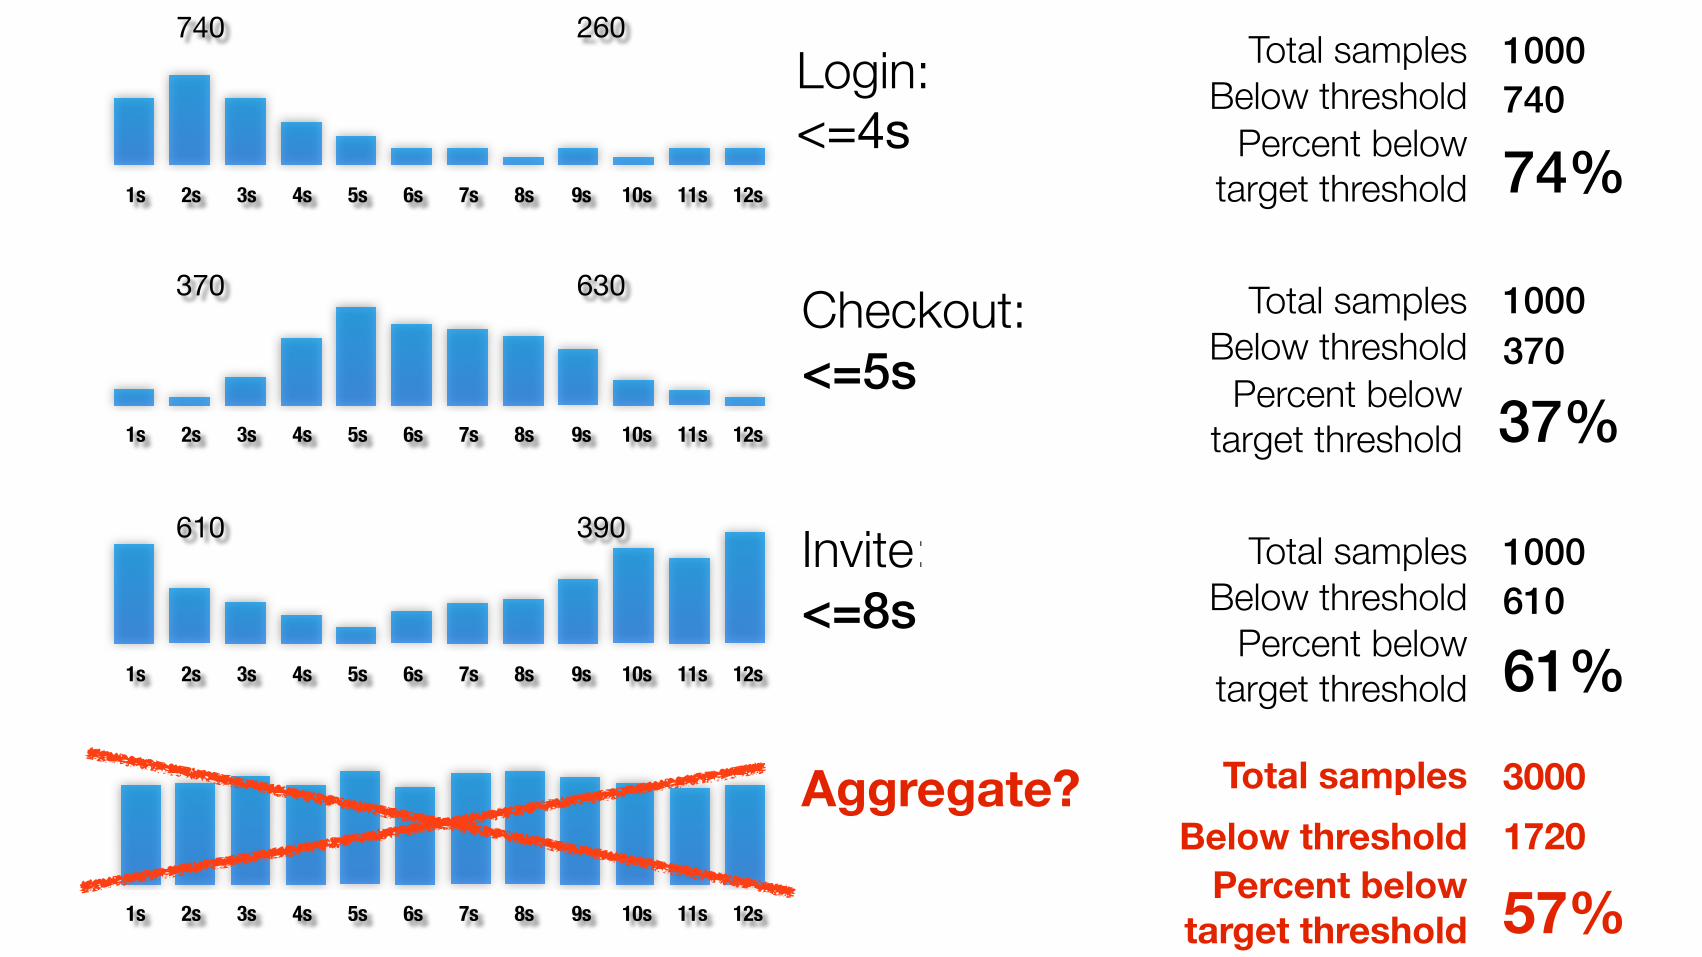
Aggregate?
Login: <=4s
Checkout: <=5s
Invite: <=8s
Percent below target threshold 74%
Percent below target threshold 37%
Percent below target threshold 61%
Total samples 1000Below threshold 740
Total samples 1000Below threshold 370
Total samples 1000Below threshold 610
740 260
370 630
610 390
Percent below target threshold 57%
Total samples 3000Below threshold 1720
1s 2s 3s 4s 5s 6s 7s 8s 9s 10s 11s 12s
1s 2s 3s 4s 5s 6s 7s 8s 9s 10s 11s 12s
1s 2s 3s 4s 5s 6s 7s 8s 9s 10s 11s 12s
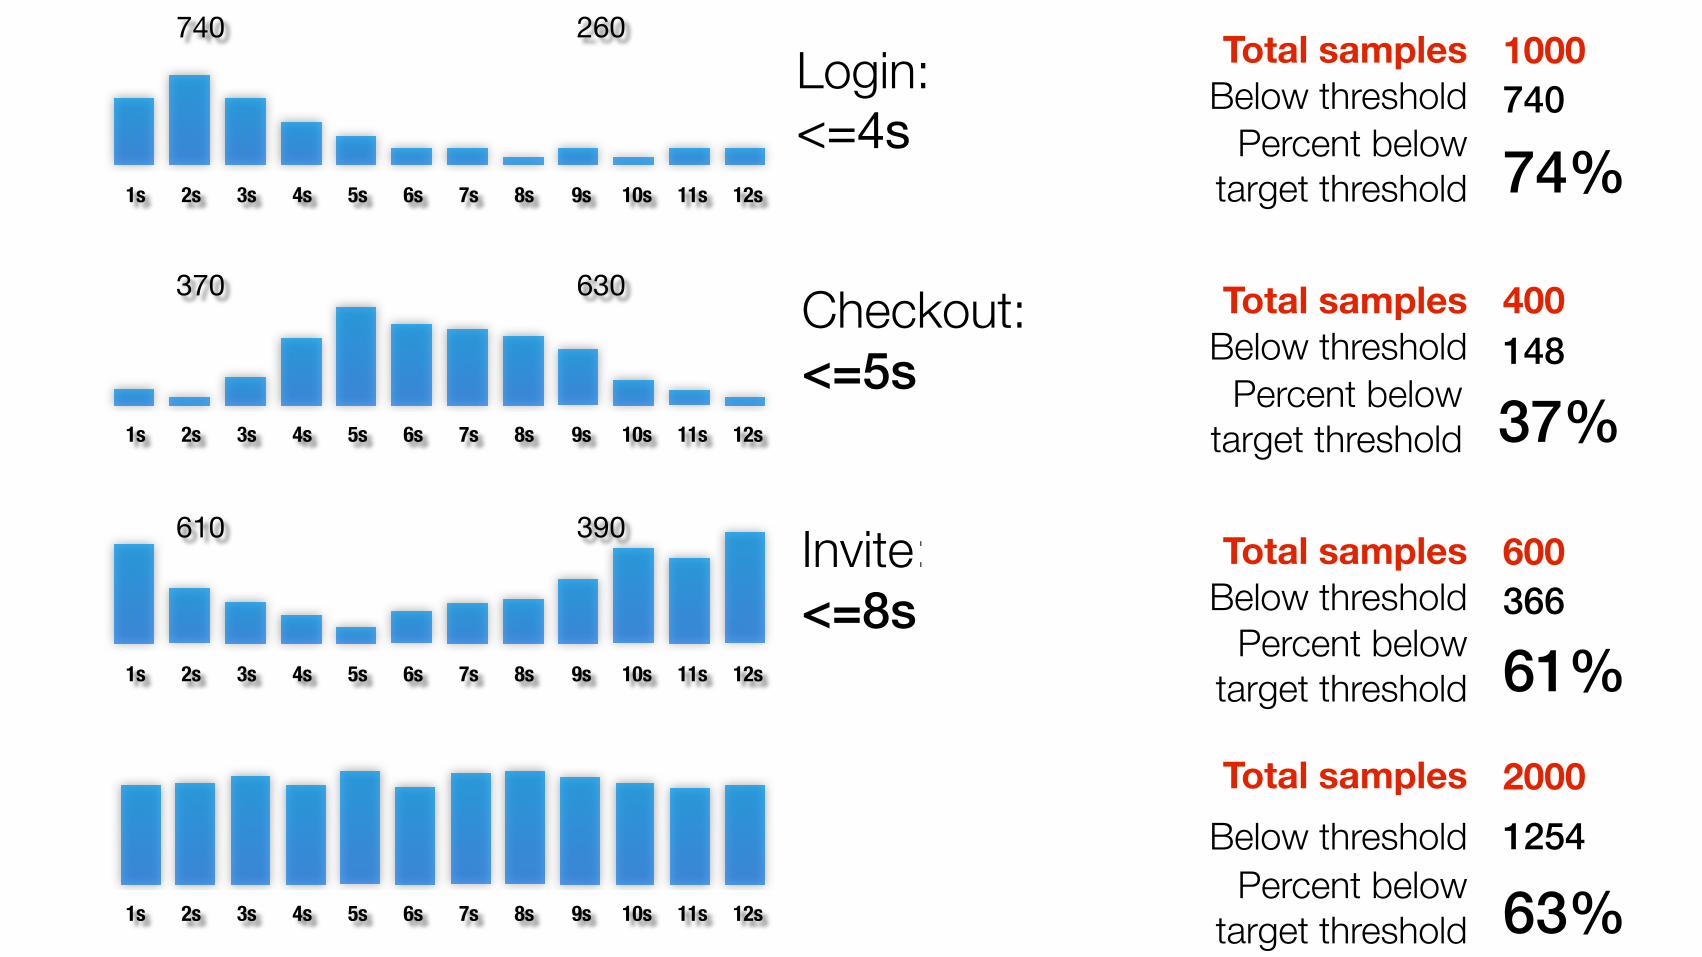
Login: <=4s
Checkout: <=5s
Invite: <=8s
Percent below target threshold 74%
Percent below target threshold 37%
Percent below target threshold 61%
Total samples 1000Below threshold 740
Total samples 400Below threshold 148
Total samples 600Below threshold 366
740 260
370 630
610 390
Percent below target threshold 63%
Total samples 2000Below threshold 1254
1s 2s 3s 4s 5s 6s 7s 8s 9s 10s 11s 12s
1s 2s 3s 4s 5s 6s 7s 8s 9s 10s 11s 12s
1s 2s 3s 4s 5s 6s 7s 8s 9s 10s 11s 12s
1s 2s 3s 4s 5s 6s 7s 8s 9s 10s 11s 12s
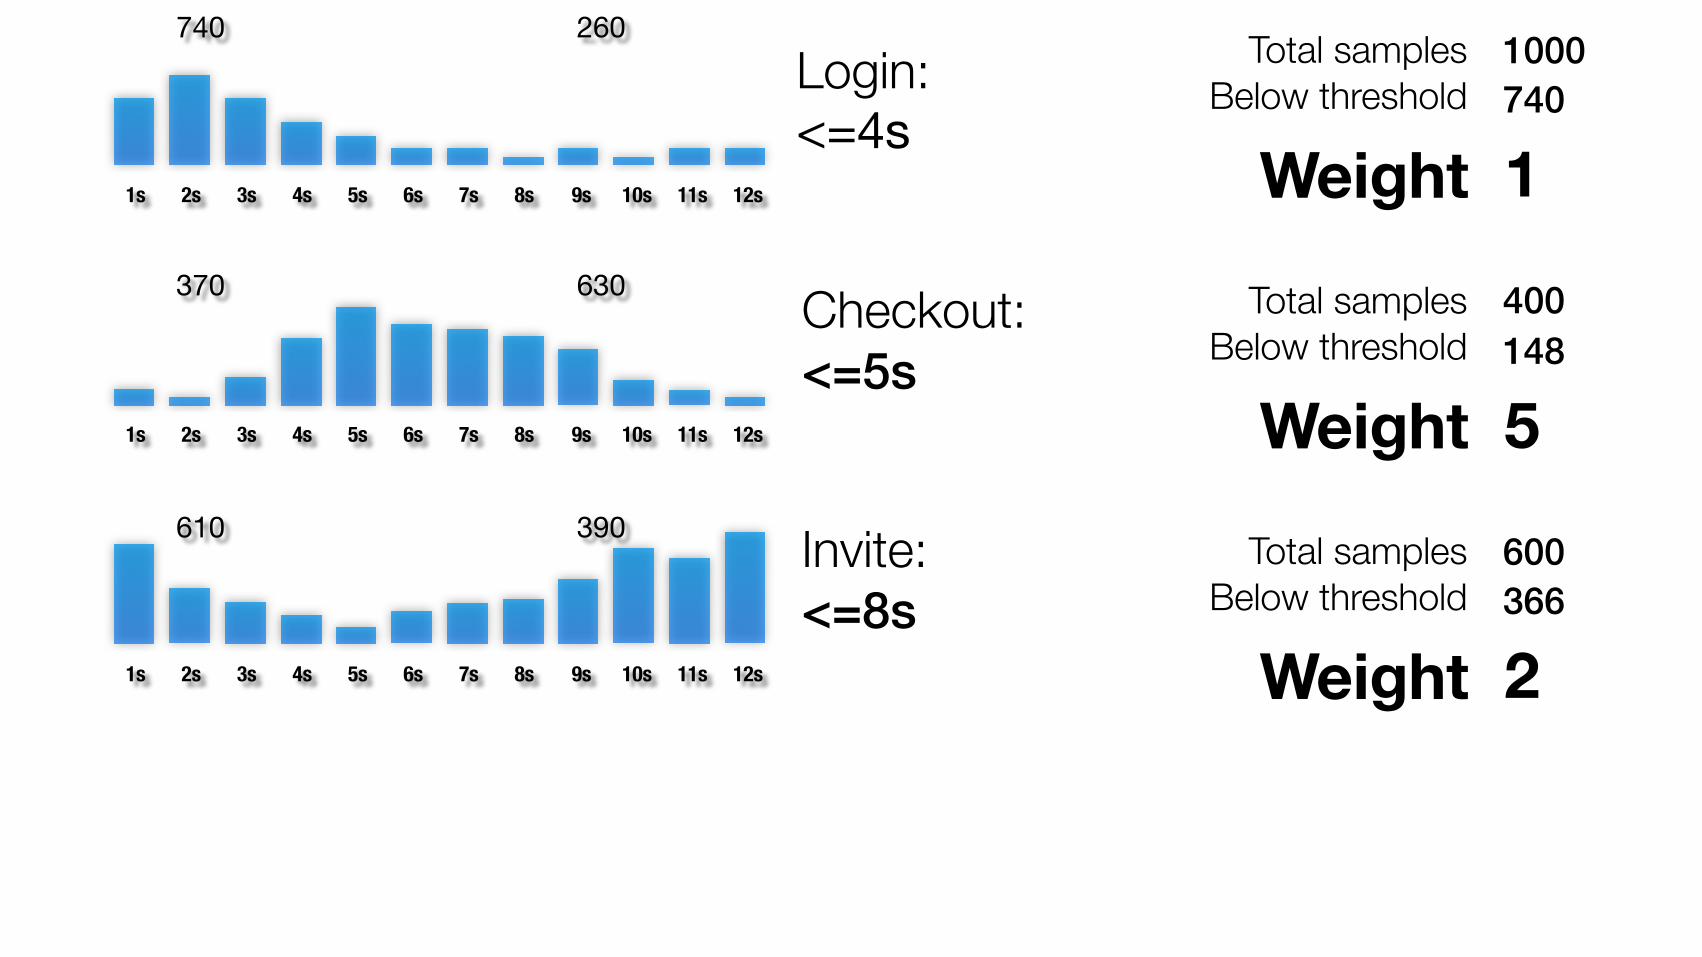
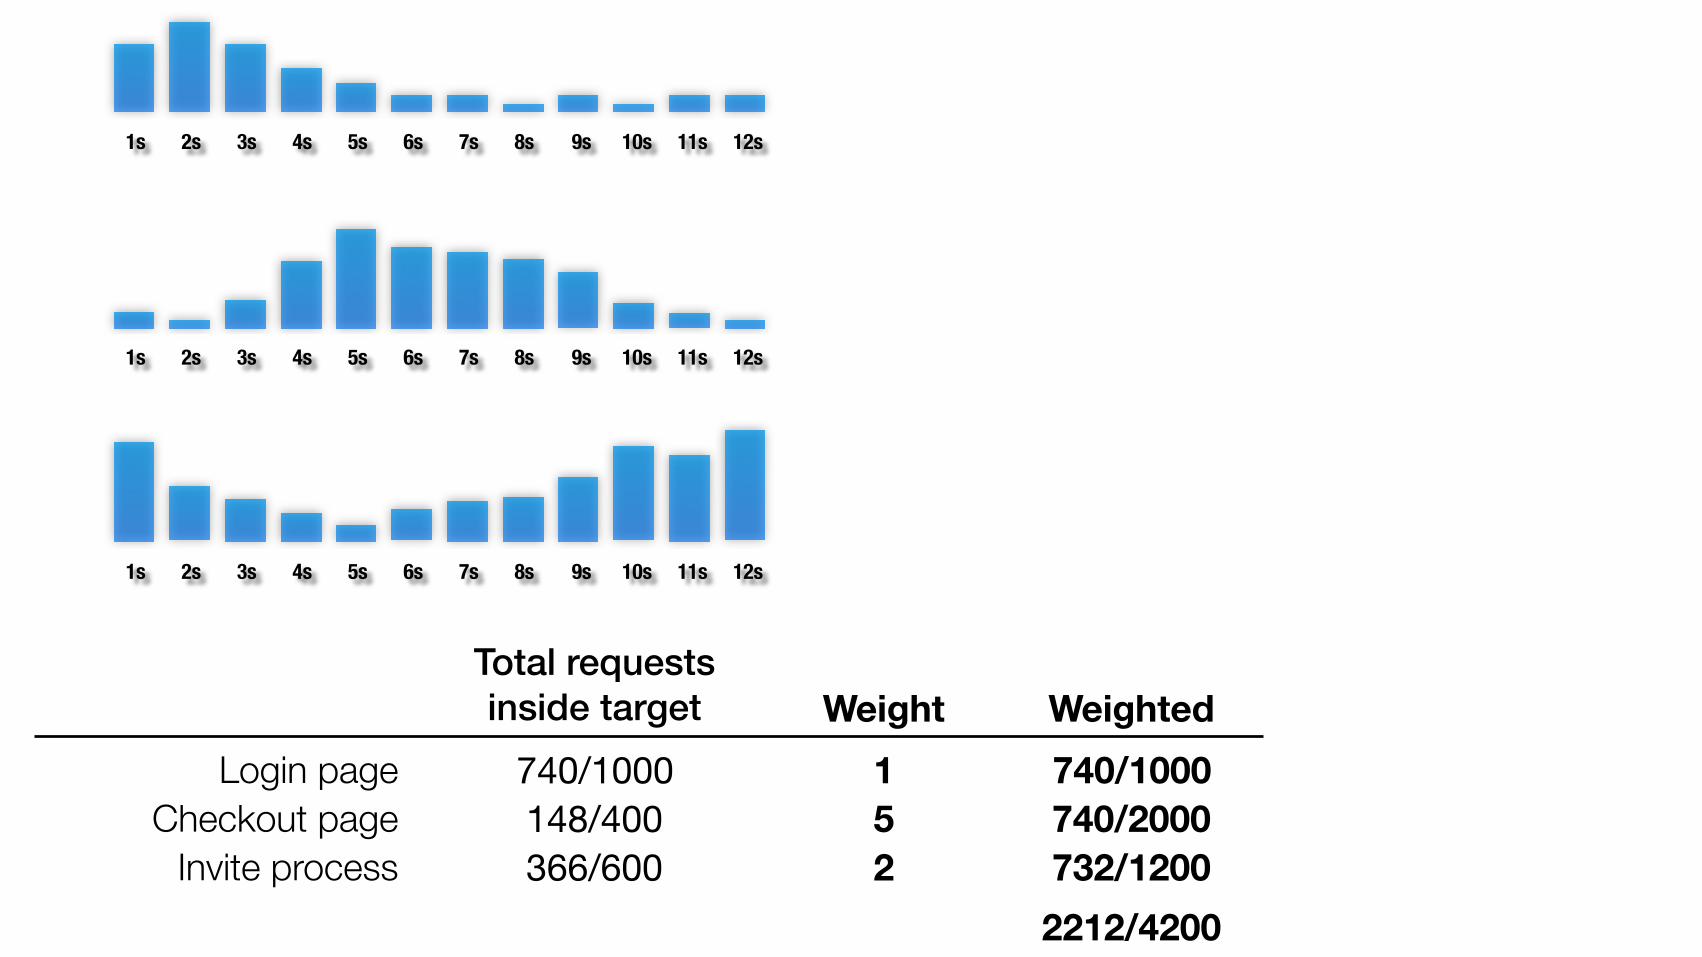
Weight 1
Weight 5
Weight 2
Login: <=4s
Checkout: <=5s
Invite: <=8s
Total samples 1000Below threshold 740
Total samples 400Below threshold 148
Total samples 600Below threshold 366
740 260
370 630
610 390
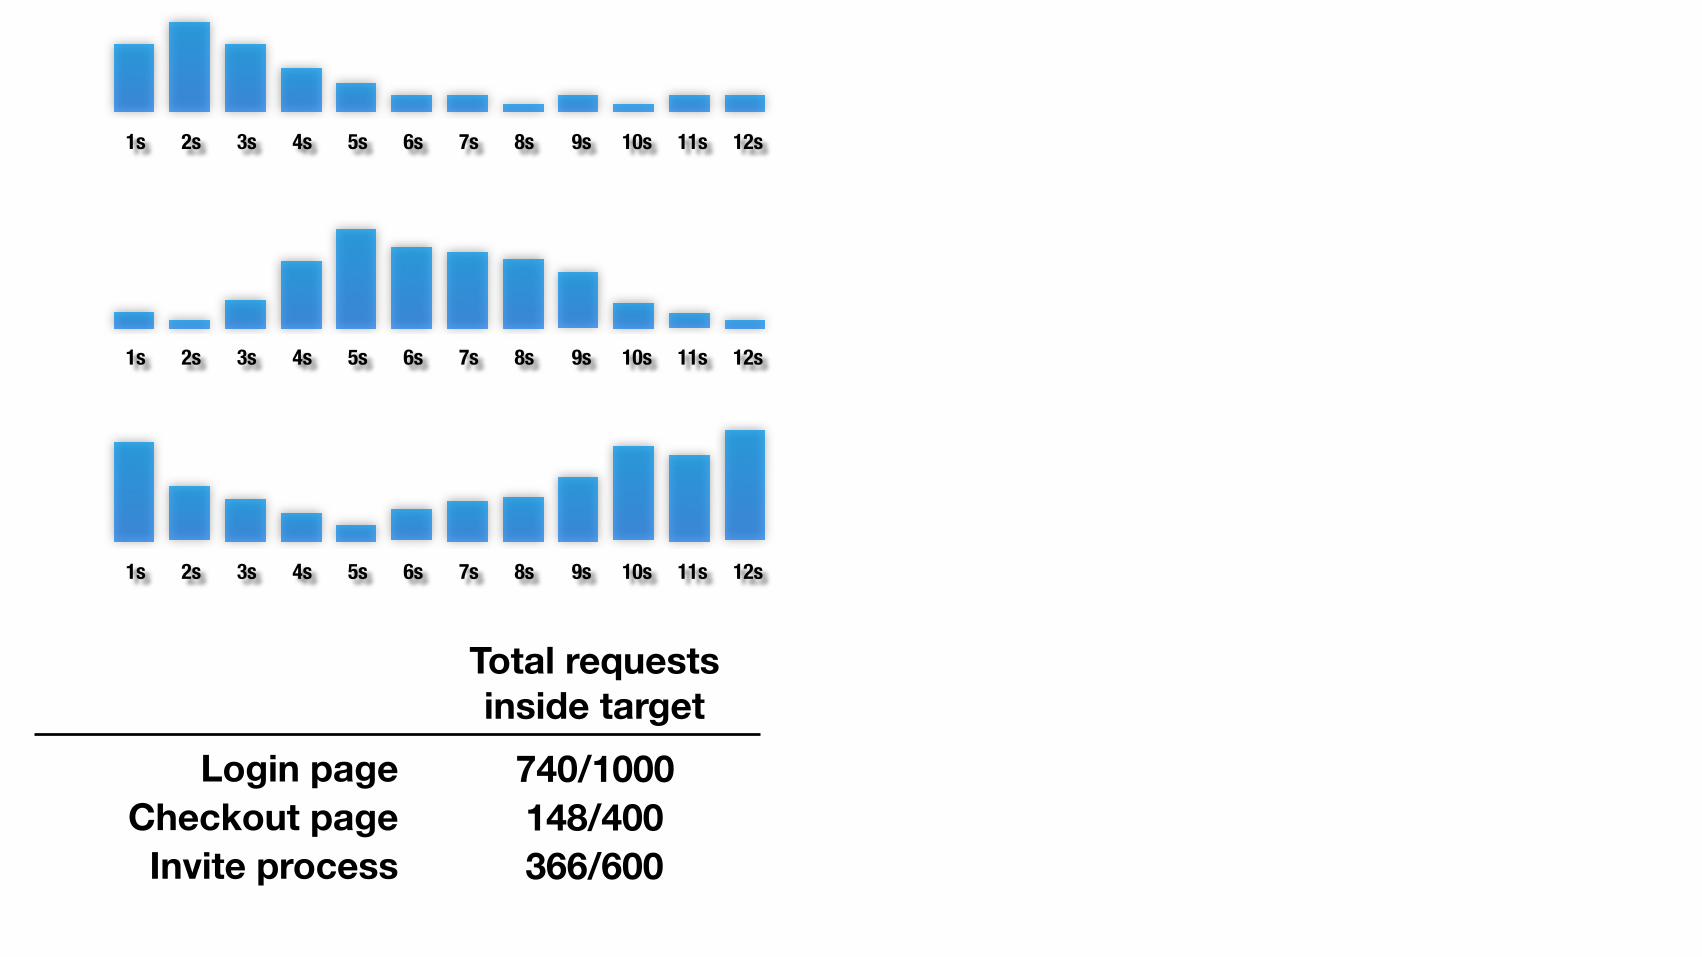
Checkout page 148/400Invite process 366/600
Login page 740/1000
Total requestsinside target
1s 2s 3s 4s 5s 6s 7s 8s 9s 10s 11s 12s
1s 2s 3s 4s 5s 6s 7s 8s 9s 10s 11s 12s
1s 2s 3s 4s 5s 6s 7s 8s 9s 10s 11s 12s
Checkout page 148/400Invite process 366/600
Login page 740/1000
Total requestsinside target
52
1Weight
740/2000732/1200
740/1000Weighted
2212/4200
1s 2s 3s 4s 5s 6s 7s 8s 9s 10s 11s 12s
1s 2s 3s 4s 5s 6s 7s 8s 9s 10s 11s 12s
1s 2s 3s 4s 5s 6s 7s 8s 9s 10s 11s 12s
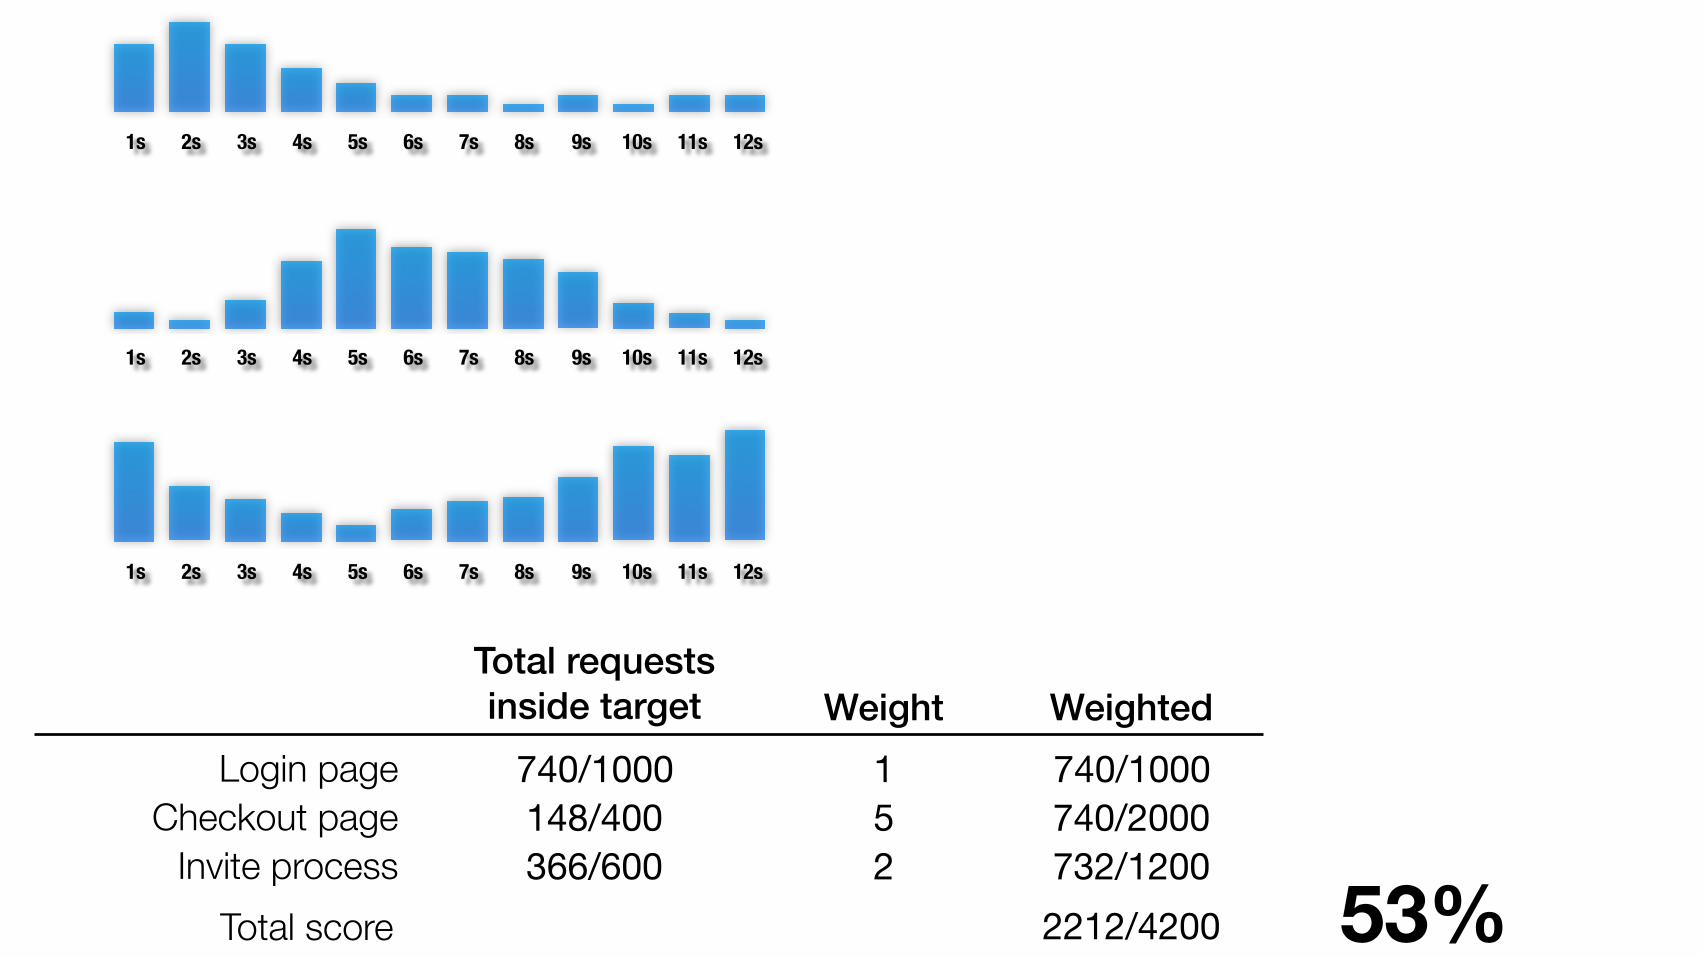
Total score 53%Checkout page 148/400
Invite process 366/600
Login page 740/1000
Total requestsinside target
52
1Weight
740/2000732/1200
740/1000Weighted
2212/4200
1s 2s 3s 4s 5s 6s 7s 8s 9s 10s 11s 12s
1s 2s 3s 4s 5s 6s 7s 8s 9s 10s 11s 12s
1s 2s 3s 4s 5s 6s 7s 8s 9s 10s 11s 12s

The Lean Analytics framework.
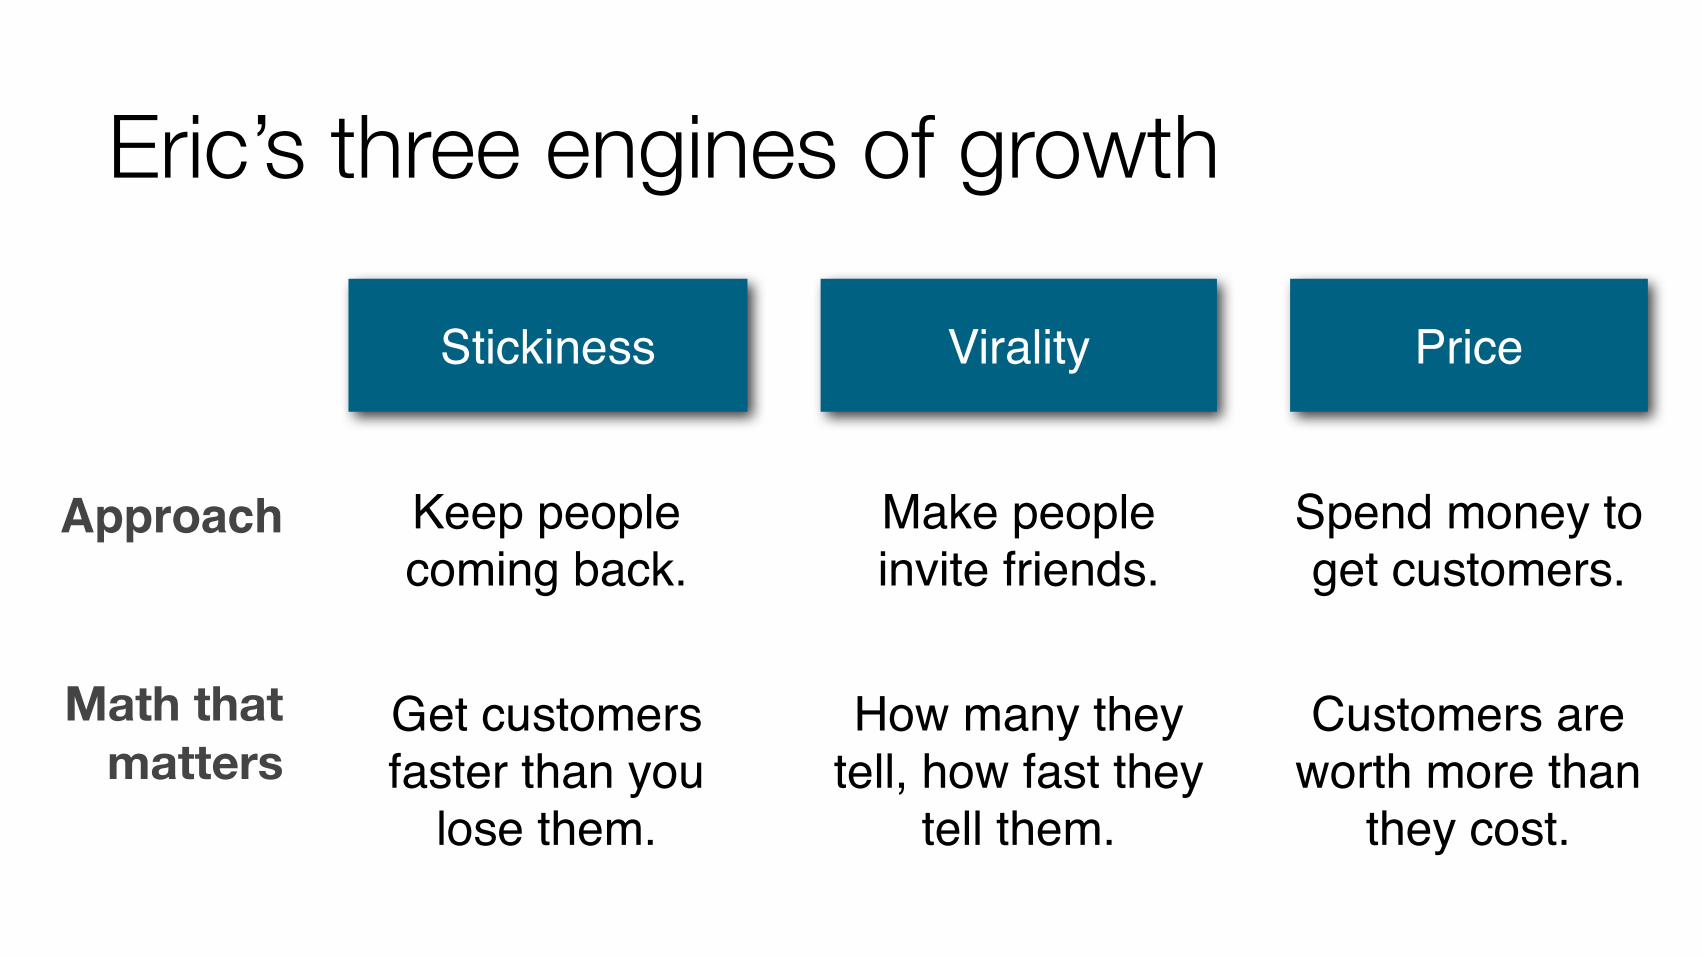
Eric’s three engines of growth
Virality
Make people invite friends.
How many they tell, how fast they
tell them.
Price
Spend money to get customers.
Customers are worth more than
they cost.
Stickiness
Keep people coming back.
Approach
Get customers faster than you
lose them.
Math that matters
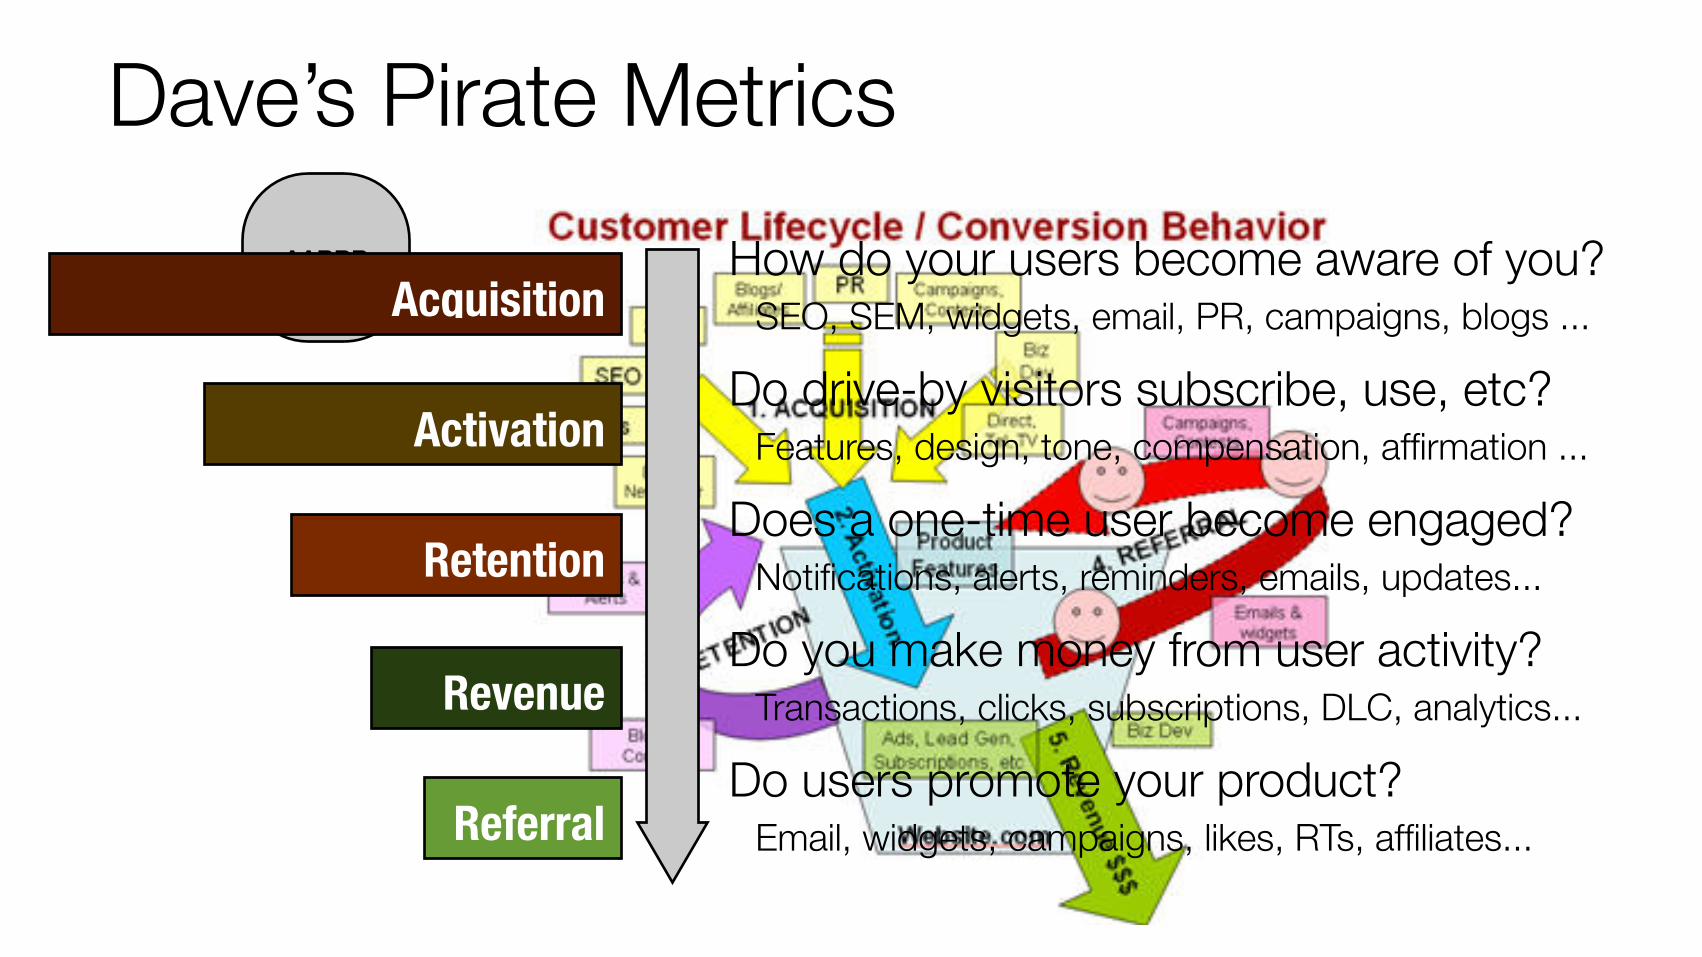
Dave’s Pirate MetricsAARRR
AcquisitionHow do your users become aware of you?
SEO, SEM, widgets, email, PR, campaigns, blogs ...
ActivationDo drive-by visitors subscribe, use, etc?
Features, design, tone, compensation, affirmation ...
RetentionDoes a one-time user become engaged?
Notifications, alerts, reminders, emails, updates...
RevenueDo you make money from user activity?
Transactions, clicks, subscriptions, DLC, analytics...
ReferralDo users promote your product?
Email, widgets, campaigns, likes, RTs, affiliates...
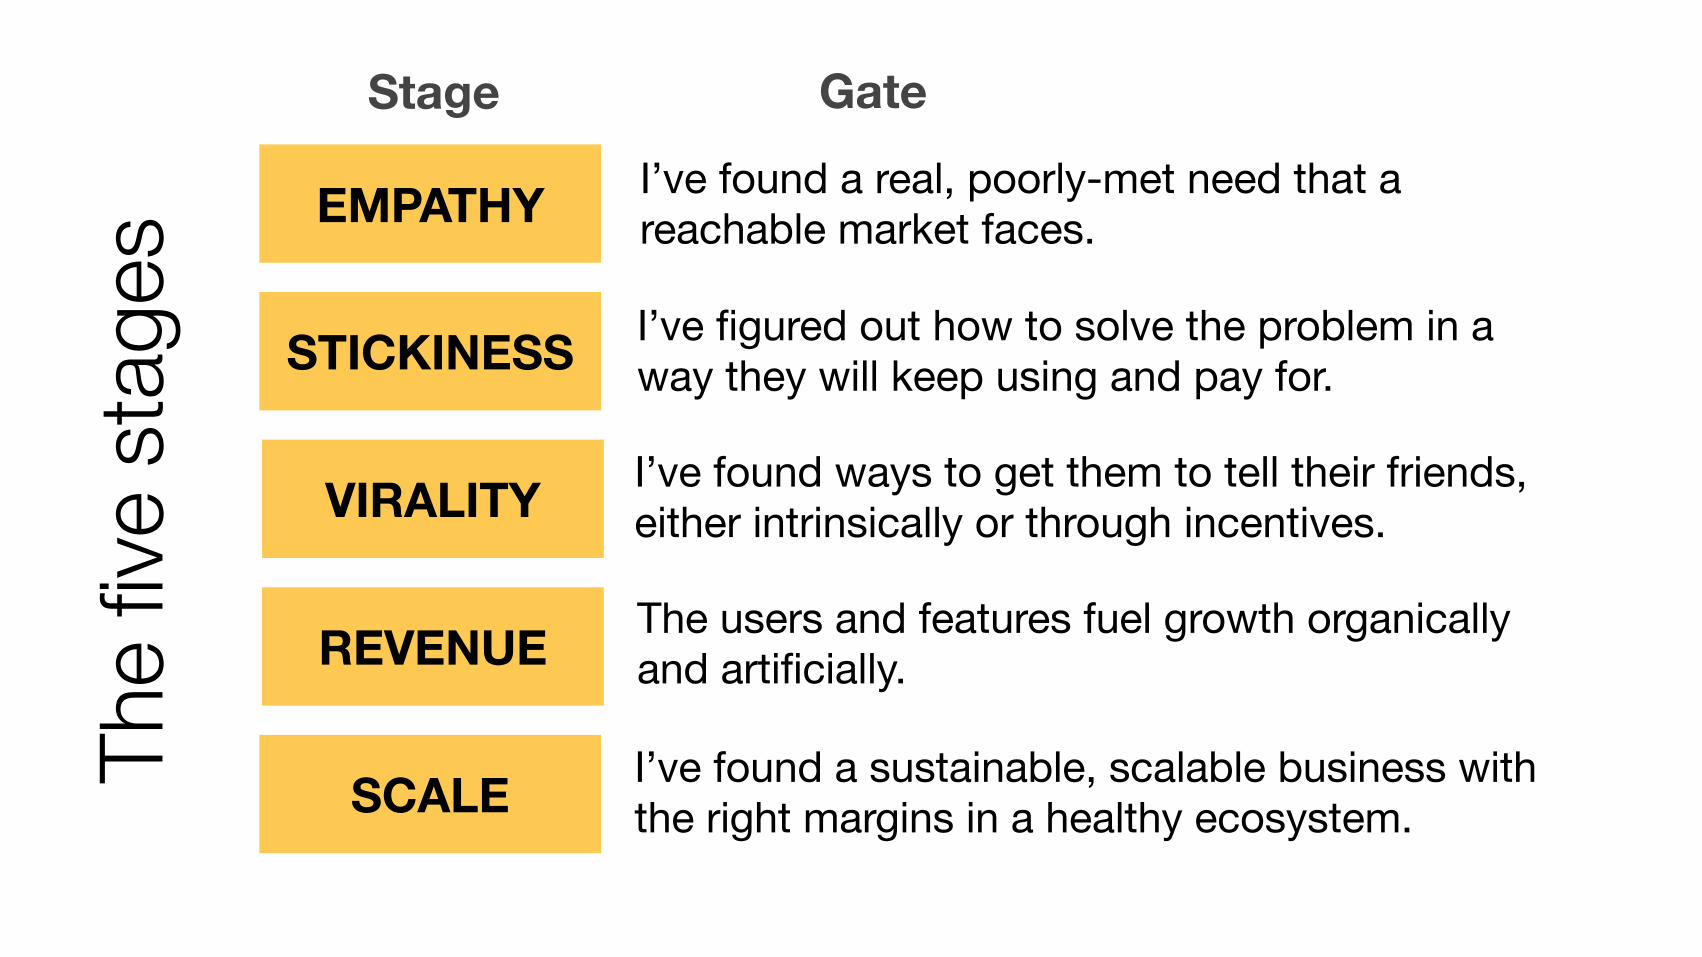
Stage
EMPATHY I’ve found a real, poorly-met need that a reachable market faces.
STICKINESS I’ve figured out how to solve the problem in a way they will keep using and pay for.
VIRALITY I’ve found ways to get them to tell their friends, either intrinsically or through incentives.
REVENUE The users and features fuel growth organically and artificially.
SCALE I’ve found a sustainable, scalable business with the right margins in a healthy ecosystem.
GateTh
e fiv
e st
ages
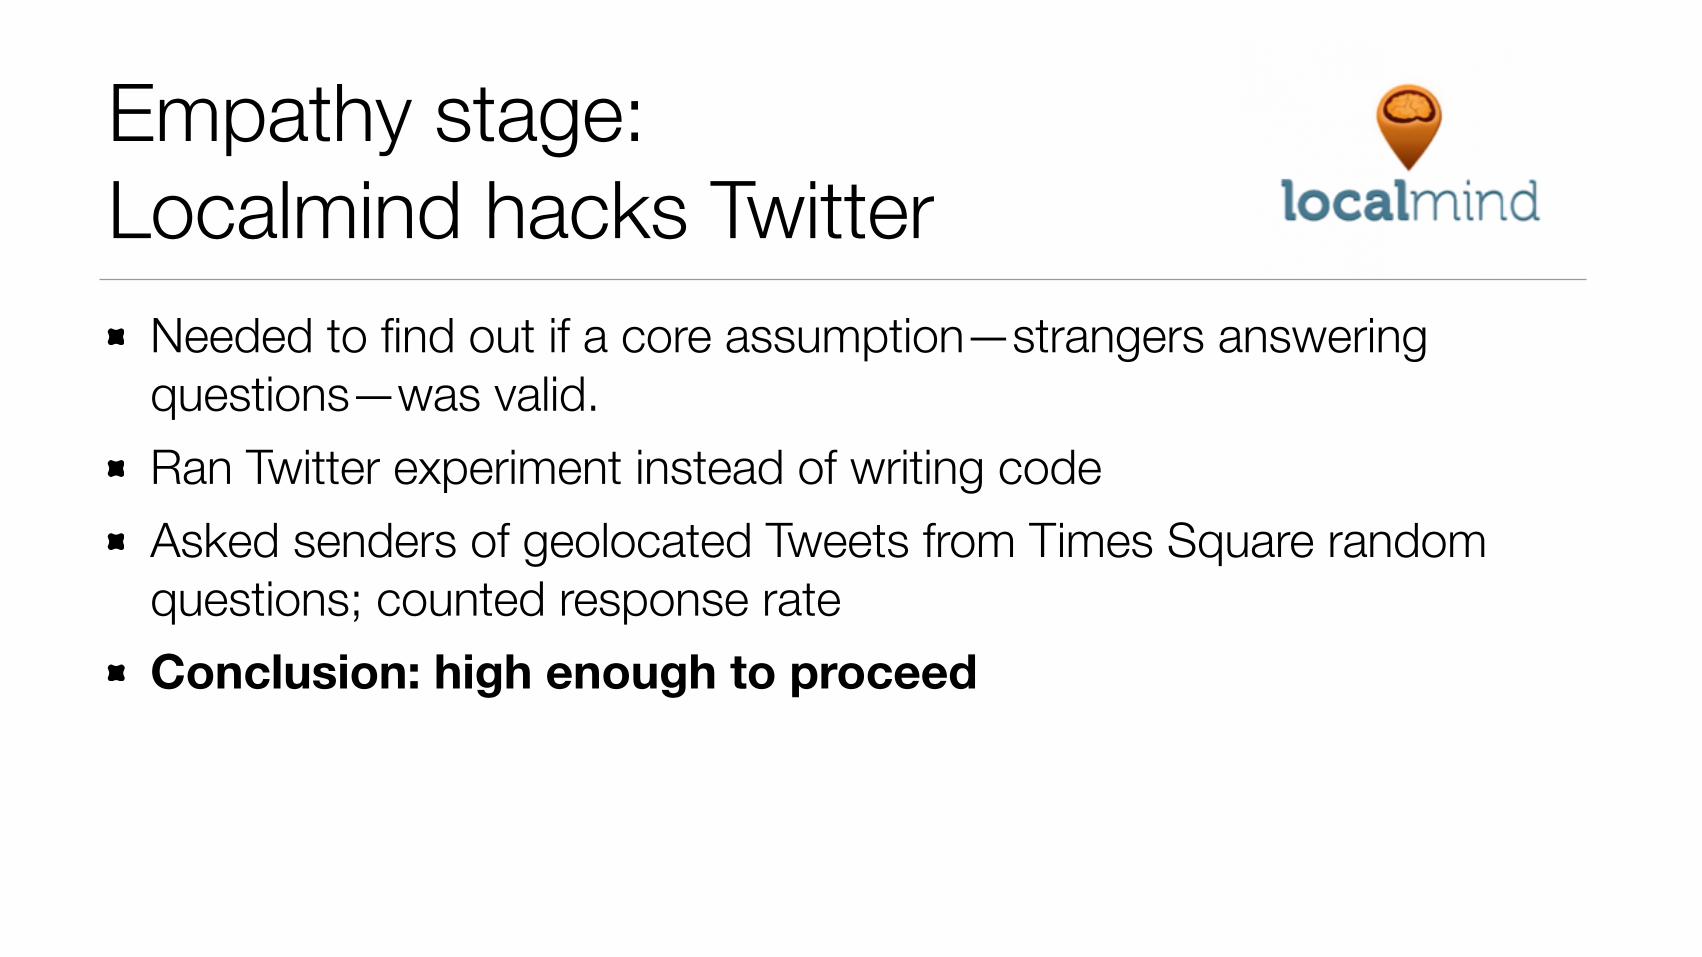
Empathy stage: Localmind hacks Twitter
Needed to find out if a core assumption—strangers answering questions—was valid. Ran Twitter experiment instead of writing code Asked senders of geolocated Tweets from Times Square random questions; counted response rate Conclusion: high enough to proceed
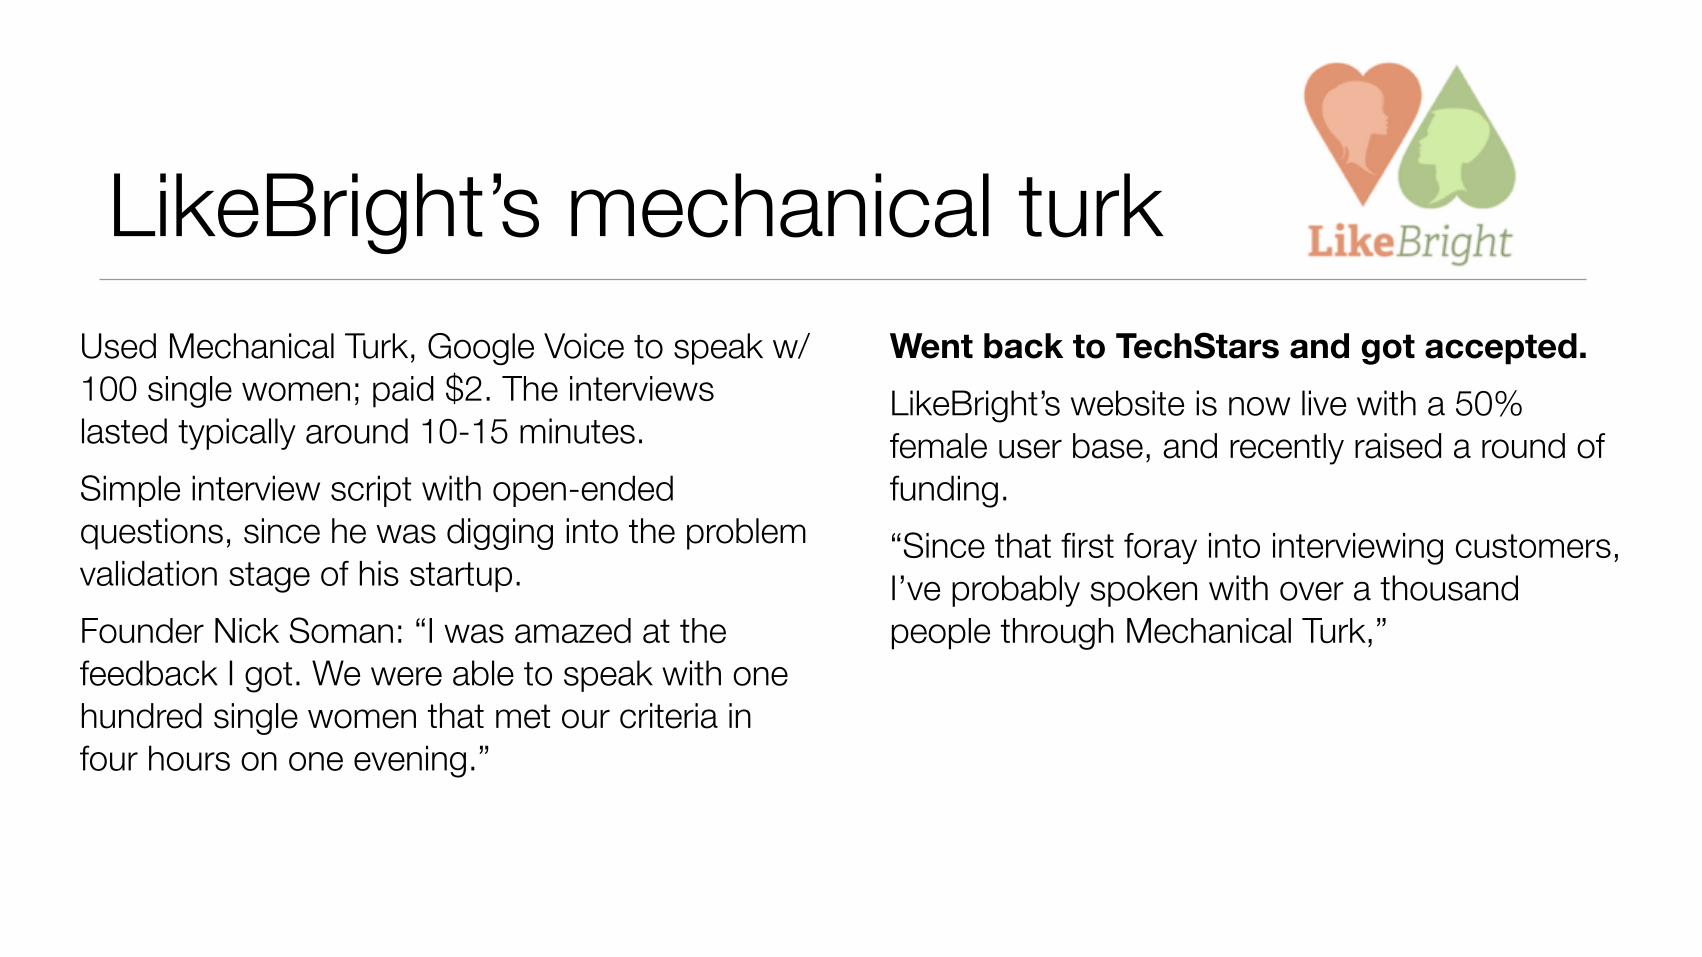
LikeBright’s mechanical turkUsed Mechanical Turk, Google Voice to speak w/100 single women; paid $2. The interviews lasted typically around 10-15 minutes. Simple interview script with open-ended questions, since he was digging into the problem validation stage of his startup. Founder Nick Soman: “I was amazed at the feedback I got. We were able to speak with one hundred single women that met our criteria in four hours on one evening.”
Went back to TechStars and got accepted. LikeBright’s website is now live with a 50% female user base, and recently raised a round of funding. “Since that first foray into interviewing customers, I’ve probably spoken with over a thousand people through Mechanical Turk,”
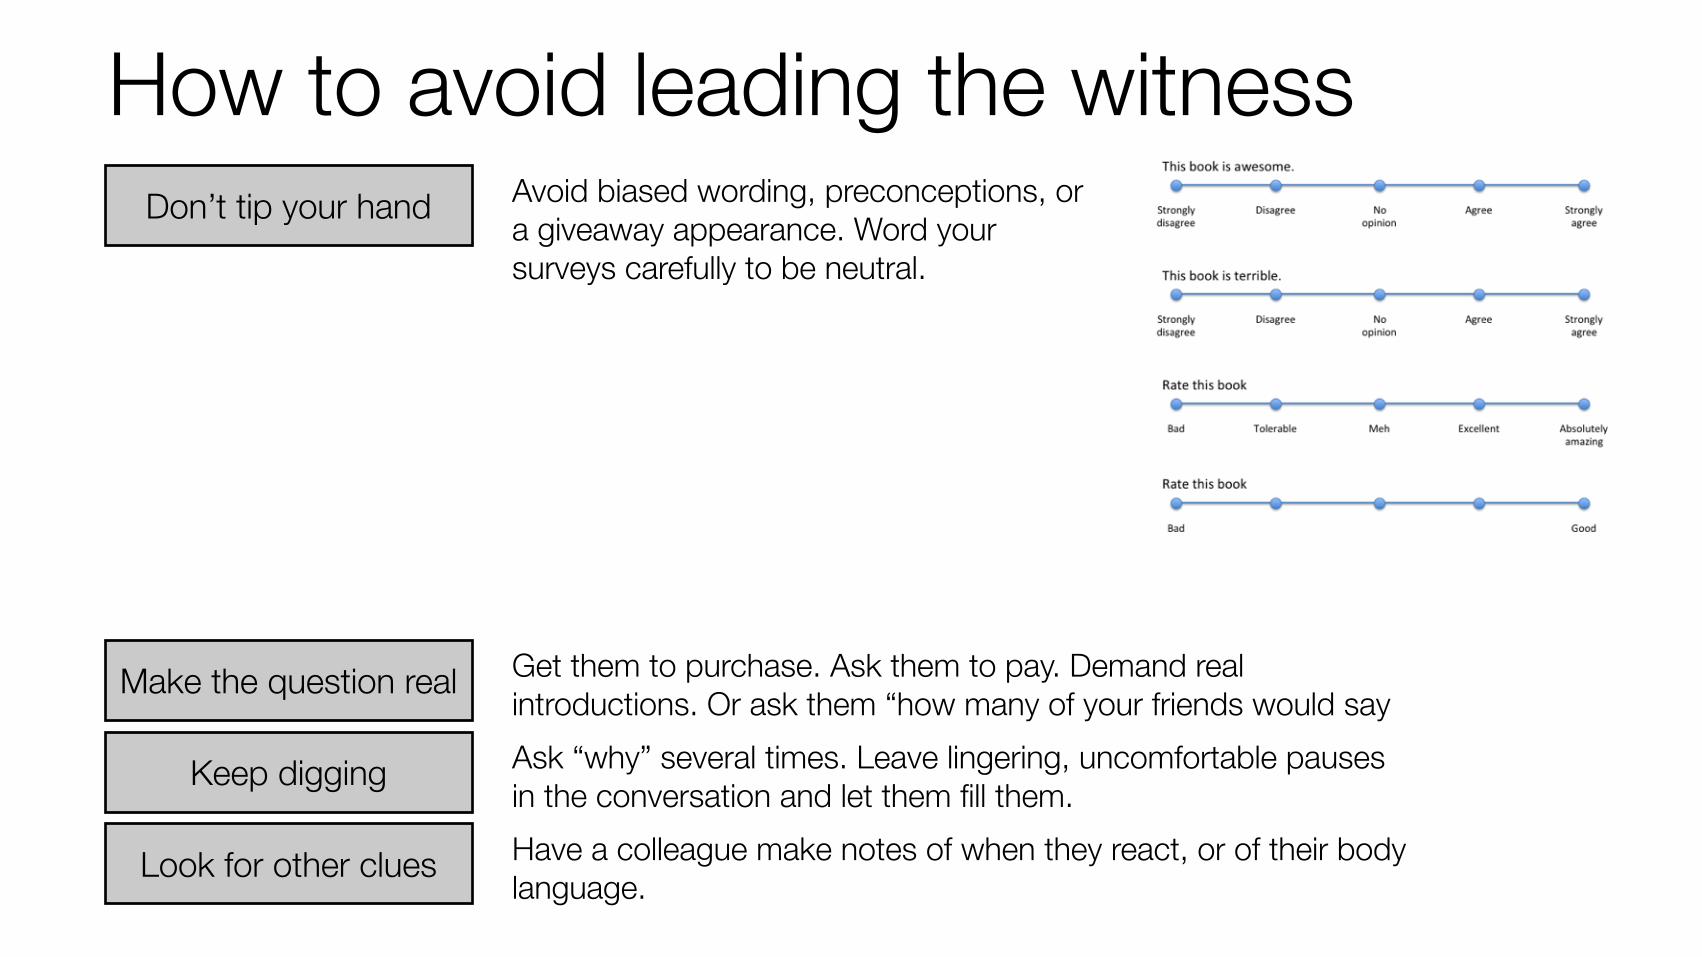
How to avoid leading the witnessAvoid biased wording, preconceptions, or a giveaway appearance. Word your surveys carefully to be neutral.
Get them to purchase. Ask them to pay. Demand real introductions. Or ask them “how many of your friends would say Ask “why” several times. Leave lingering, uncomfortable pauses in the conversation and let them fill them.
Don’t tip your hand
Make the question real
Keep digging
Look for other clues Have a colleague make notes of when they react, or of their body language.
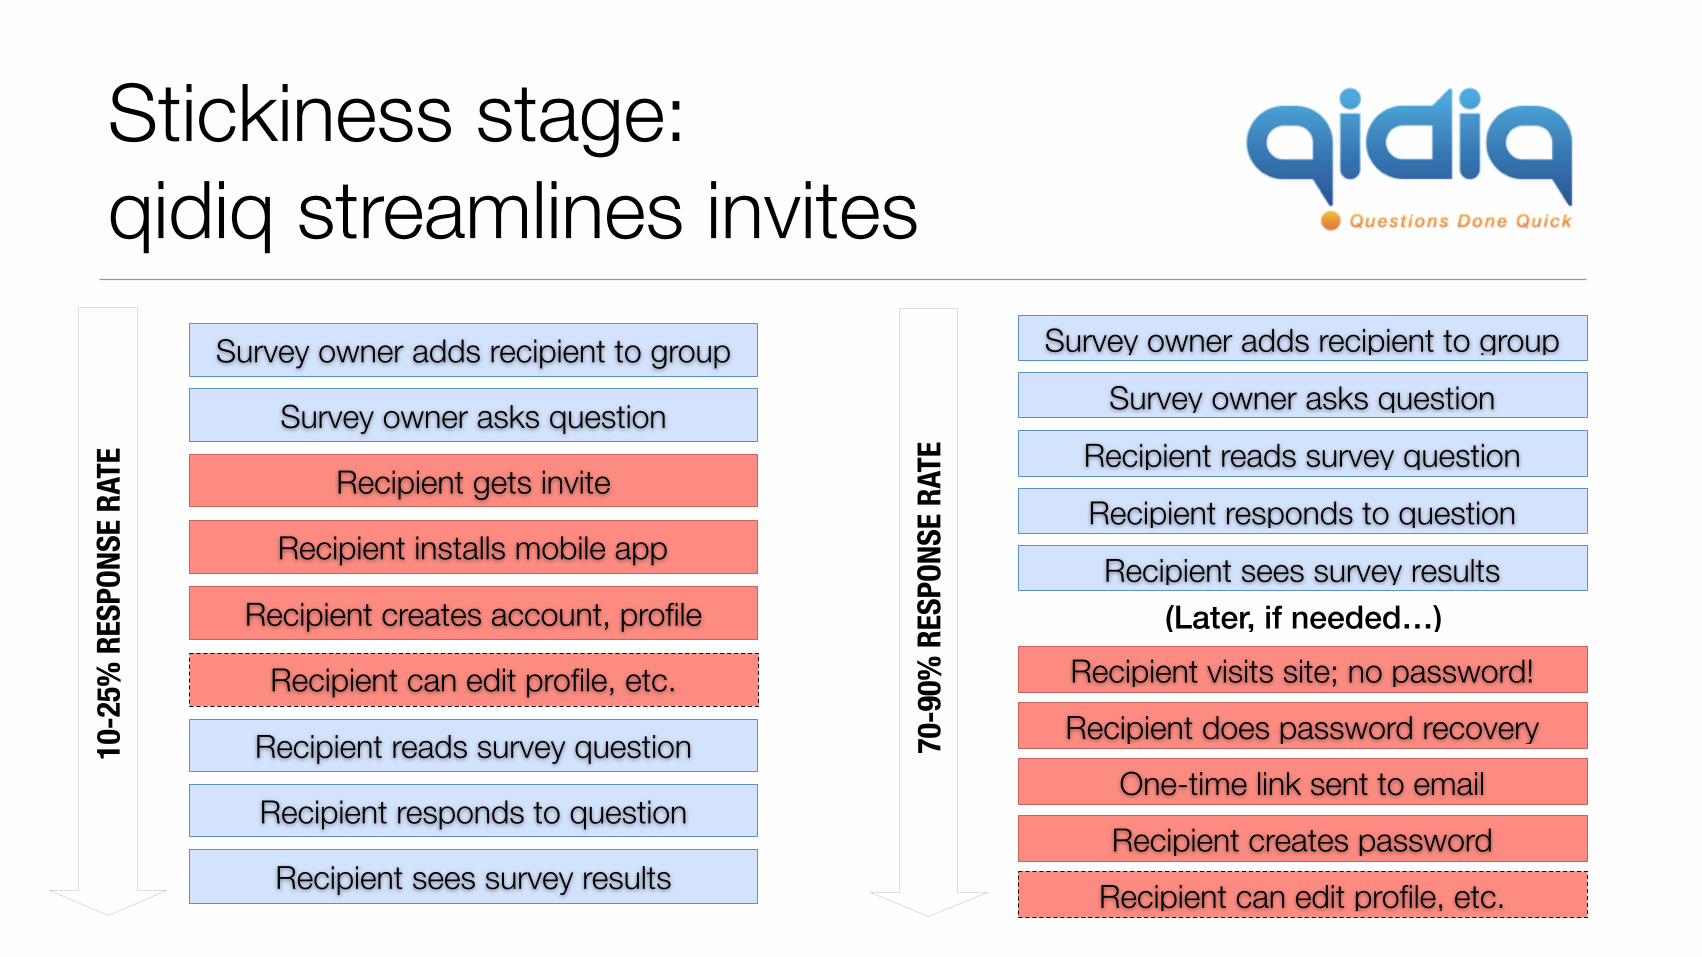
Stickiness stage: qidiq streamlines invites
Survey owner adds recipient to groupSurvey owner asks question
Recipient reads survey questionRecipient responds to questionRecipient sees survey results
(Later, if needed…)Recipient visits site; no password!Recipient does password recovery
One-time link sent to emailRecipient creates password
Recipient can edit profile, etc.
Survey owner adds recipient to group
Survey owner asks question
Recipient gets invite
Recipient reads survey question
Recipient responds to question
Recipient installs mobile app
Recipient creates account, profile
Recipient sees survey results
Recipient can edit profile, etc.
10-2
5% R
ESPO
NSE R
ATE
70-9
0% R
ESPO
NSE R
ATE
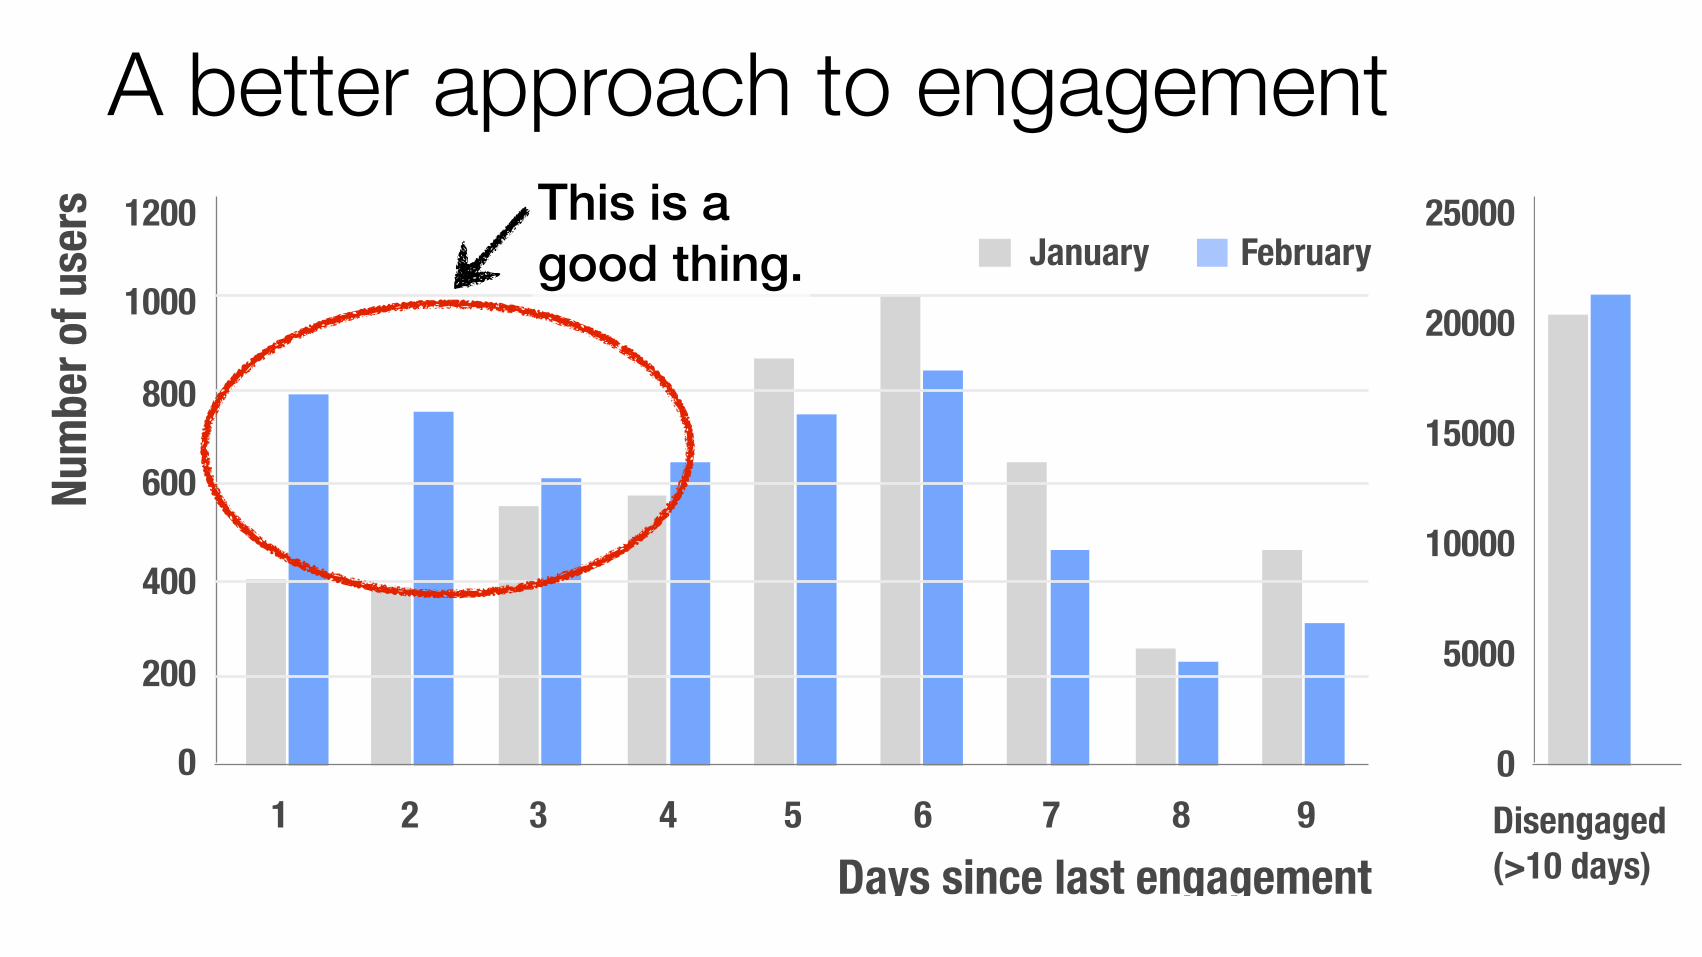
1200
1000
800
600
400
200
01 2 3 4 5 6 7 8 9
Days since last engagement
January February
Disengaged(>10 days)
25000
20000
15000
10000
5000
0
Num
ber o
f use
rsA better approach to engagement
This is agood thing.
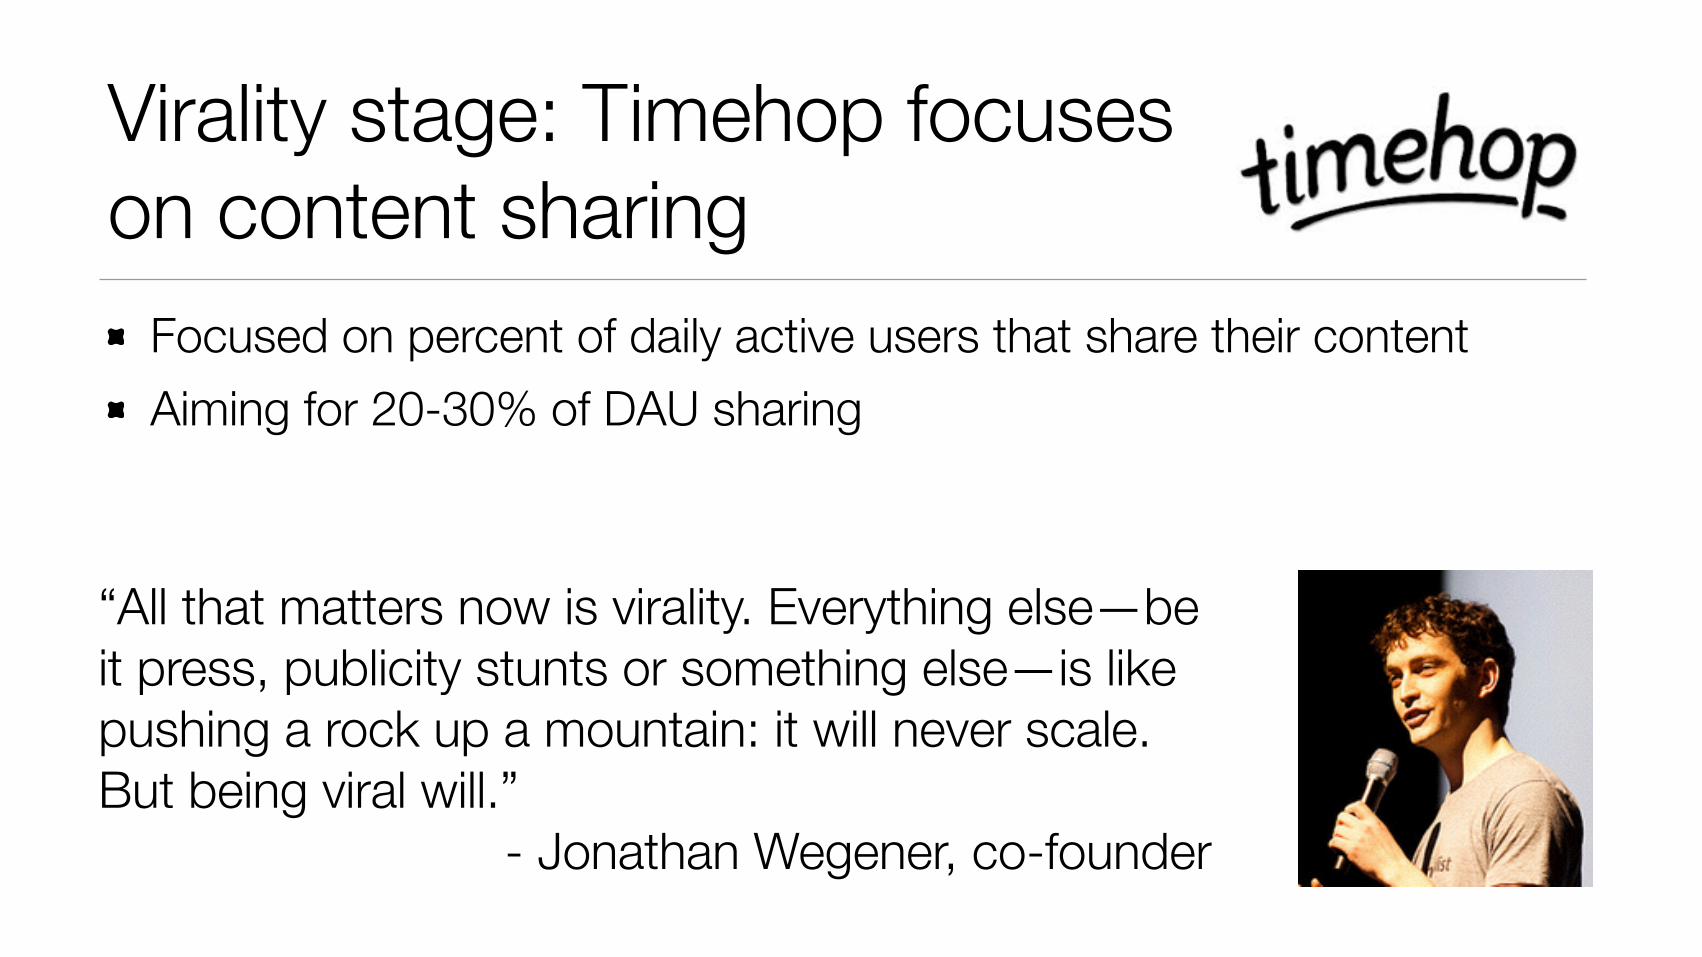
Virality stage: Timehop focuses on content sharing
Focused on percent of daily active users that share their content Aiming for 20-30% of DAU sharing
“All that matters now is virality. Everything else—be it press, publicity stunts or something else—is like pushing a rock up a mountain: it will never scale. But being viral will.”
- Jonathan Wegener, co-founder

------------------------------------------------------Get your free private email at http://www.hotmail.com ------------------------------------------------------
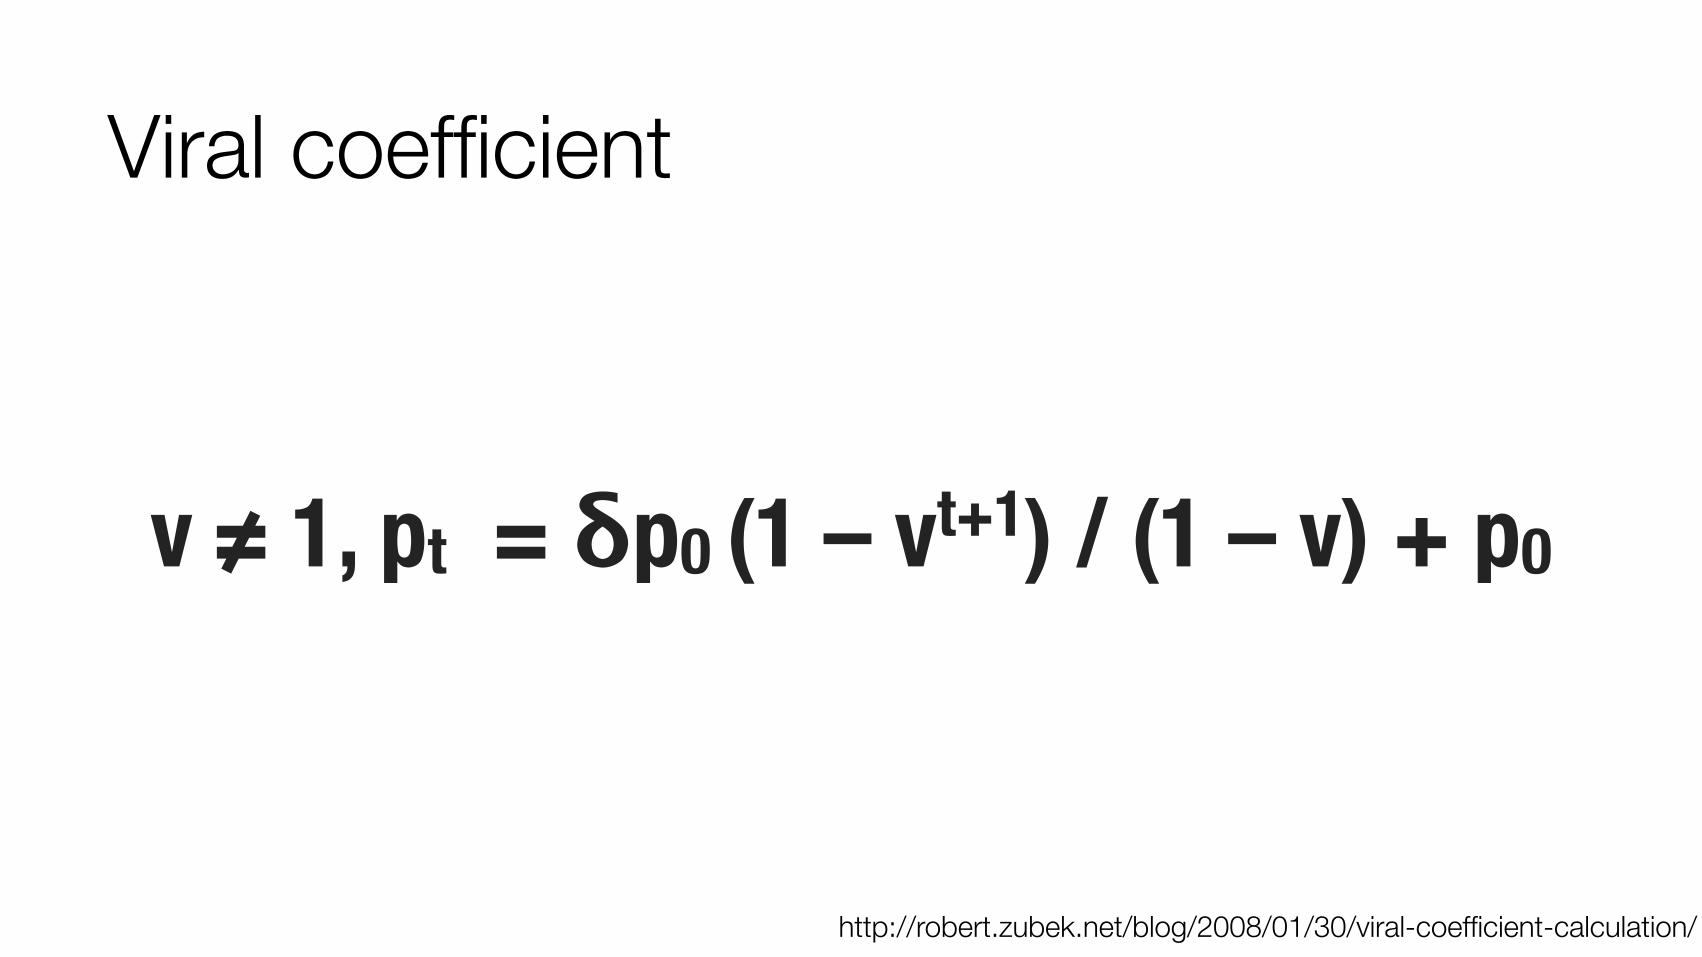
v ≠ 1, pt = δp0 (1 – vt+1) / (1 – v) + p0
http://robert.zubek.net/blog/2008/01/30/viral-coefficient-calculation/
Viral coefficient
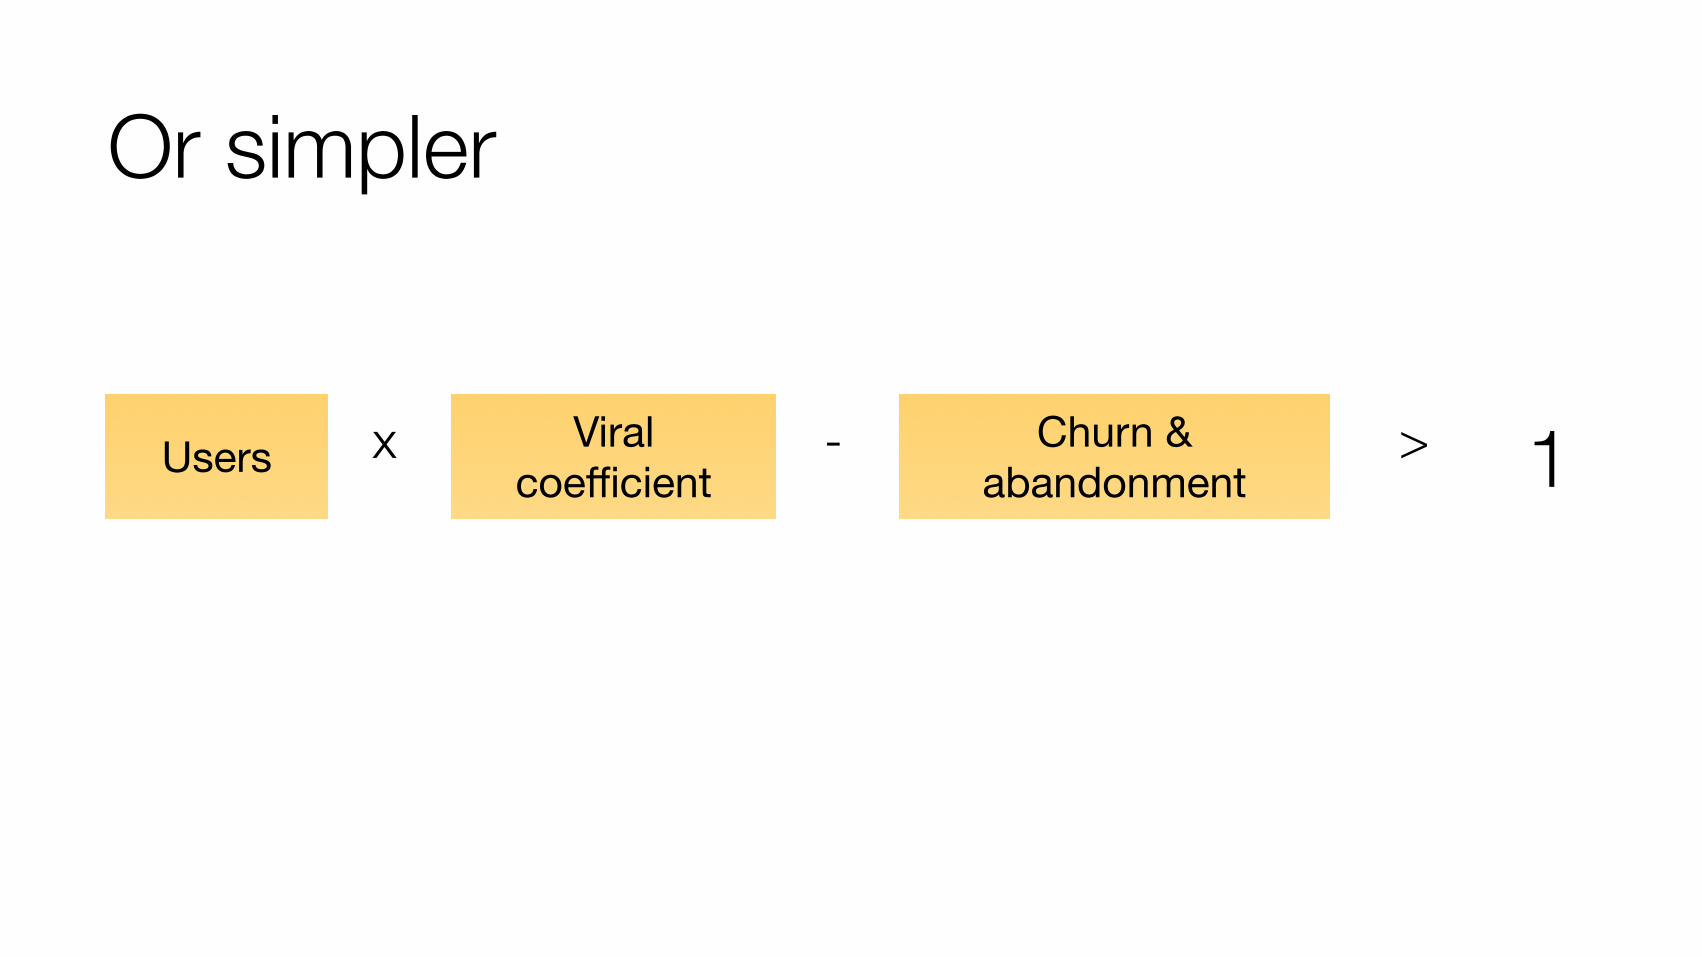
Or simpler
Users Viralcoefficient
Churn &abandonment
x - > 1
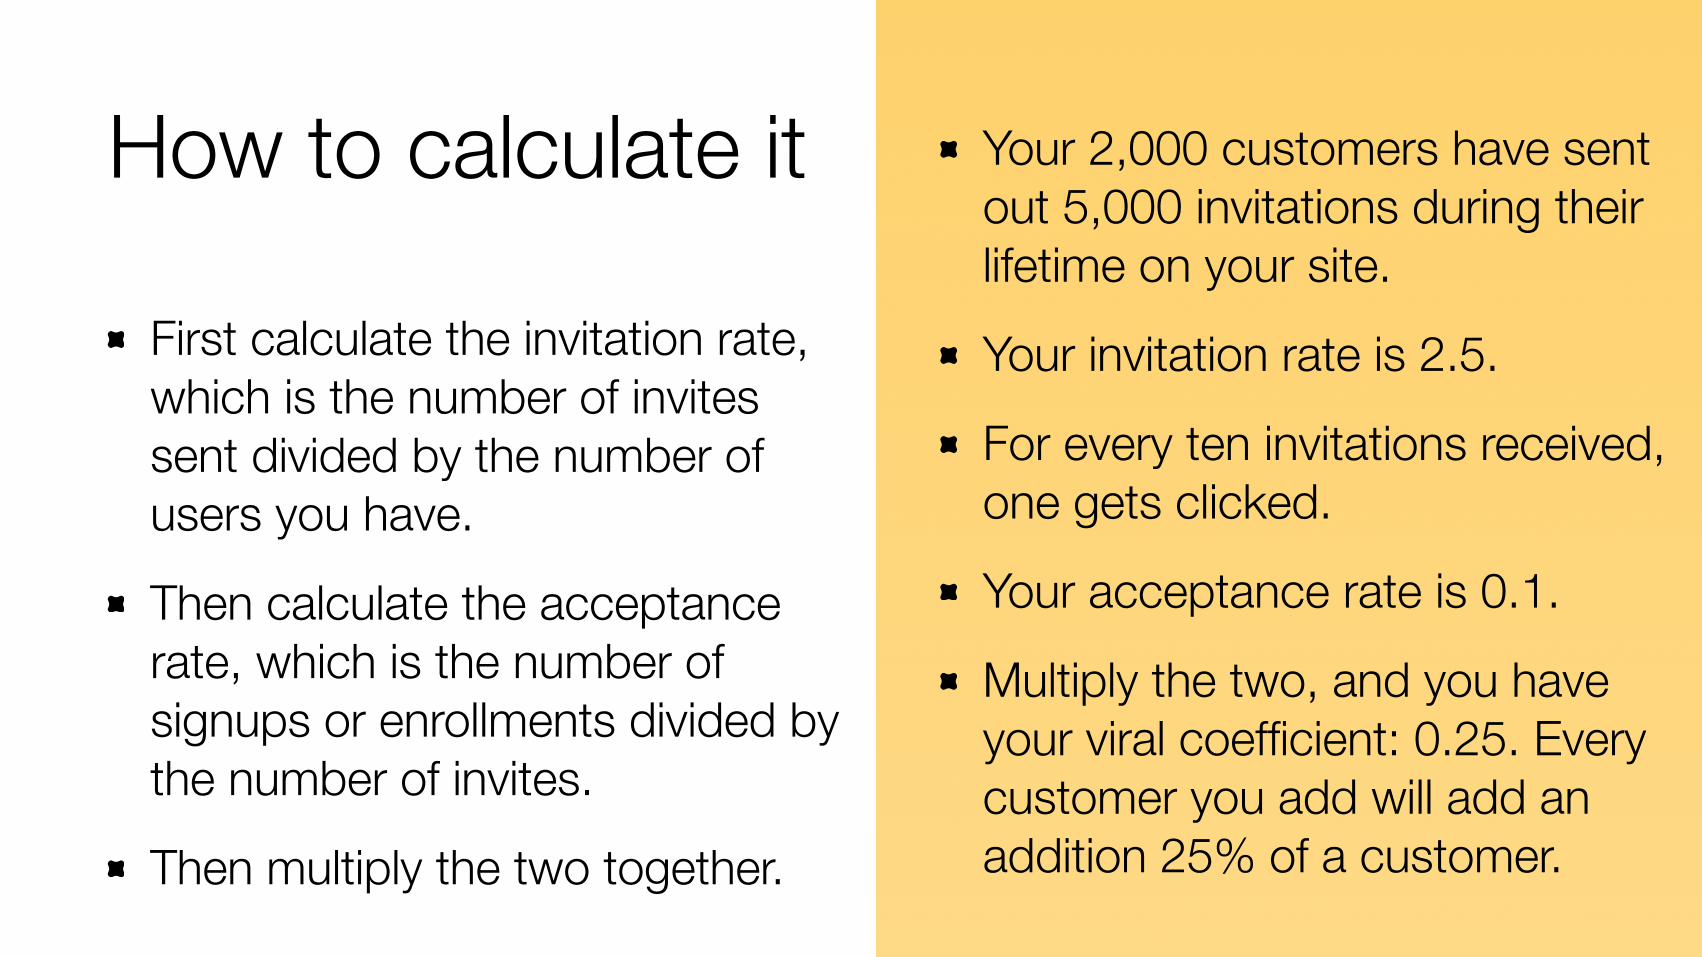
How to calculate it
First calculate the invitation rate, which is the number of invites sent divided by the number of users you have.
Then calculate the acceptance rate, which is the number of signups or enrollments divided by the number of invites.
Then multiply the two together.
Your 2,000 customers have sent out 5,000 invitations during their lifetime on your site.
Your invitation rate is 2.5.
For every ten invitations received, one gets clicked.
Your acceptance rate is 0.1.
Multiply the two, and you have your viral coefficient: 0.25. Every customer you add will add an addition 25% of a customer.
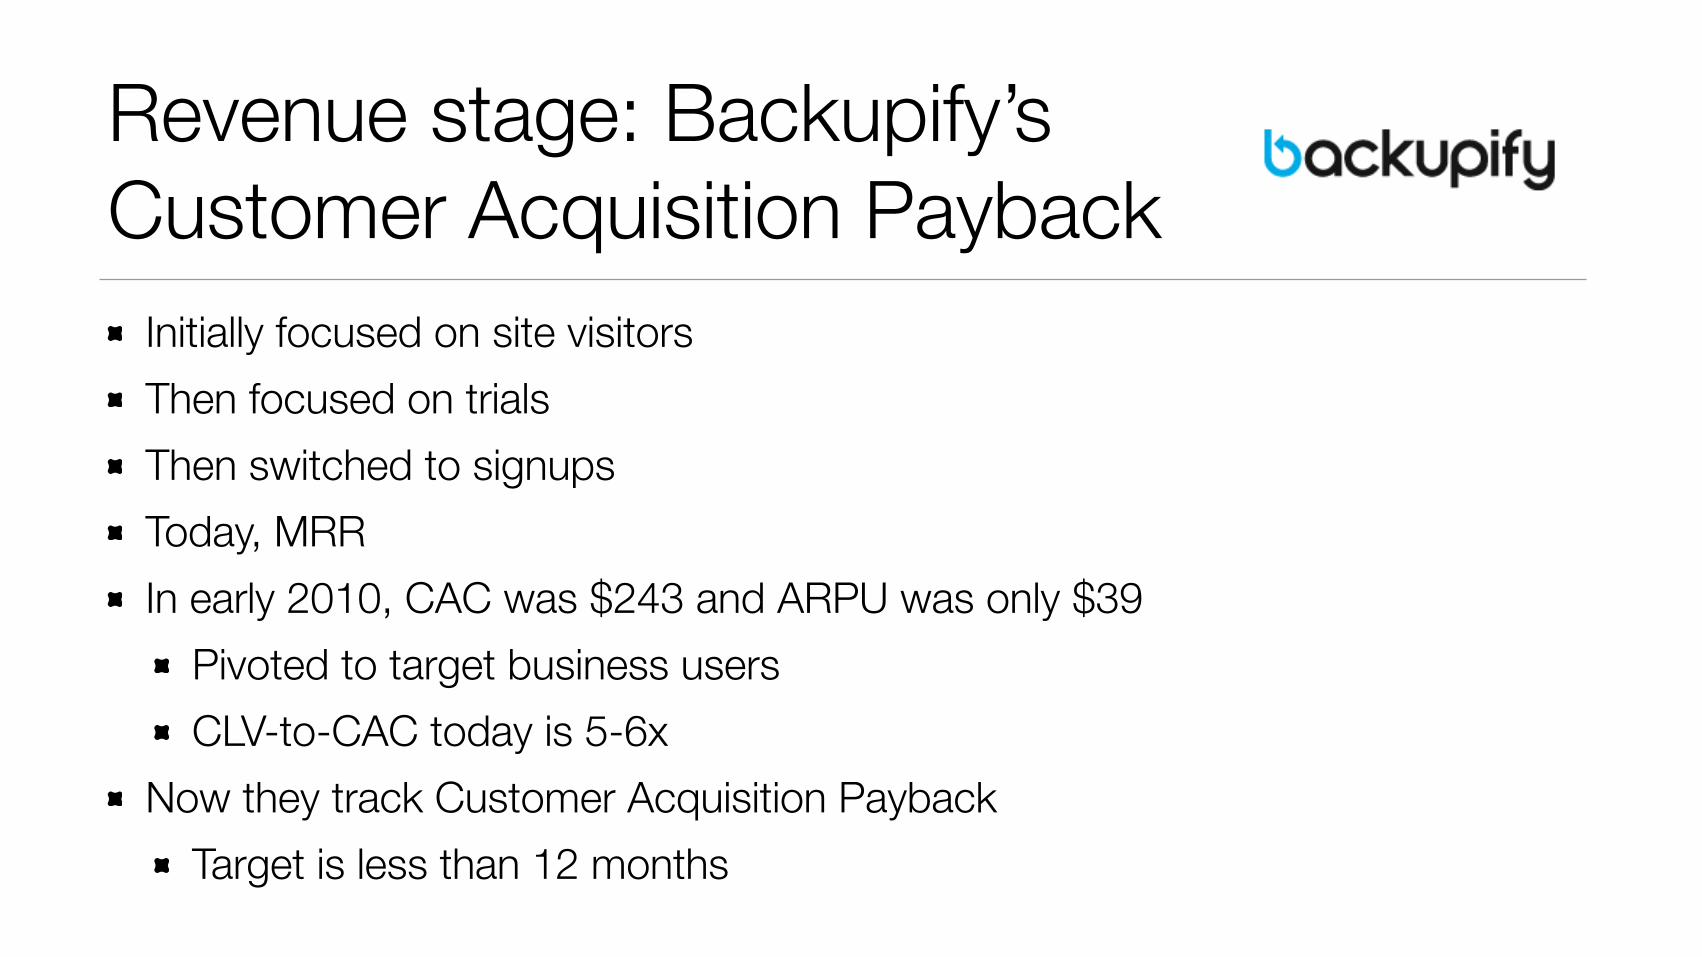
Revenue stage: Backupify’s Customer Acquisition Payback
Initially focused on site visitors Then focused on trials Then switched to signups Today, MRR In early 2010, CAC was $243 and ARPU was only $39
Pivoted to target business users CLV-to-CAC today is 5-6x
Now they track Customer Acquisition Payback Target is less than 12 months
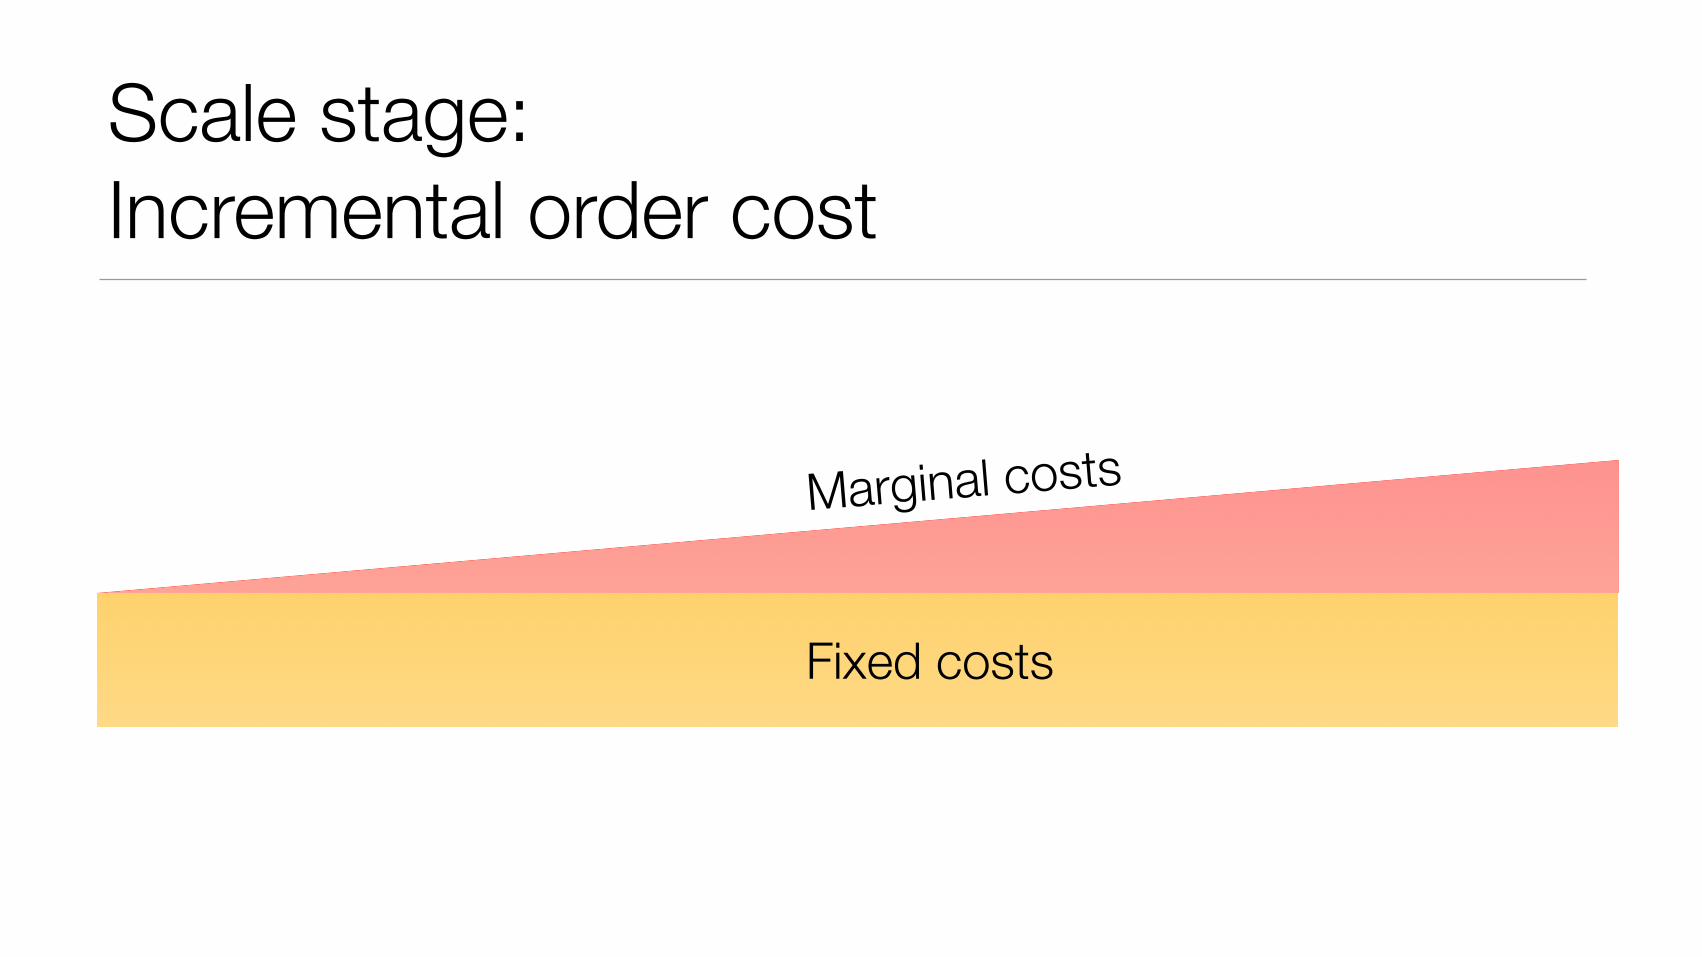
Scale stage: Incremental order cost
Fixed costs
Marginal costs
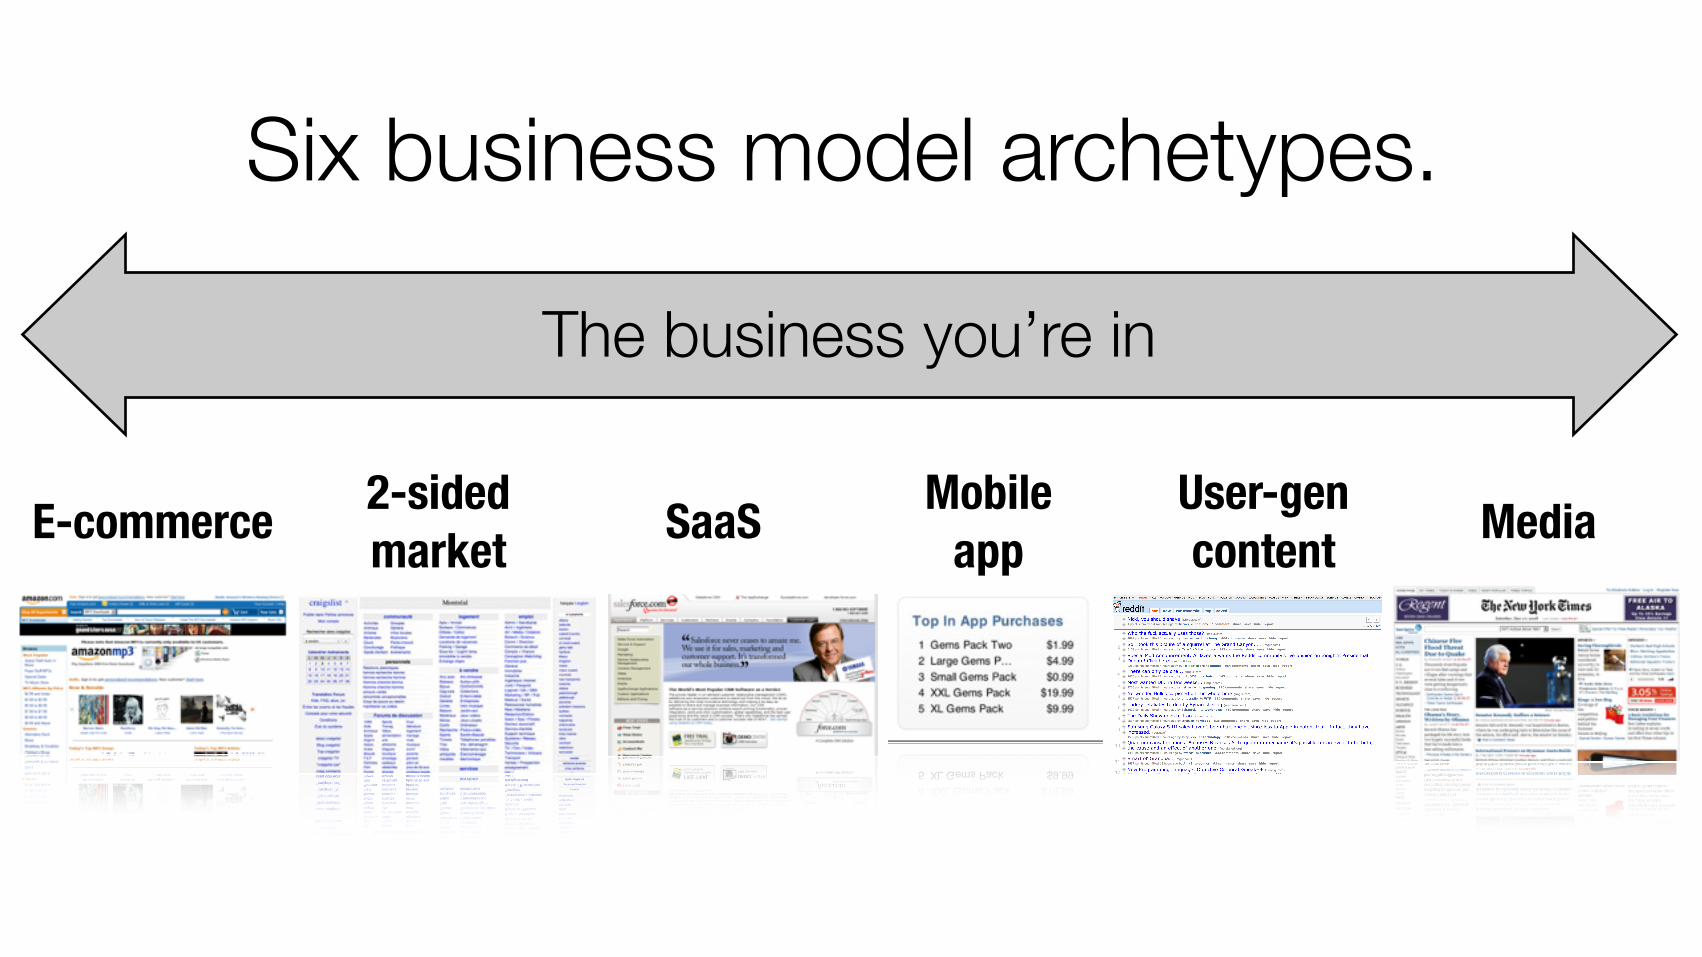
Six business model archetypes.
E-commerce SaaS MediaMobileapp
User-gencontent
2-sidedmarket
The business you’re in
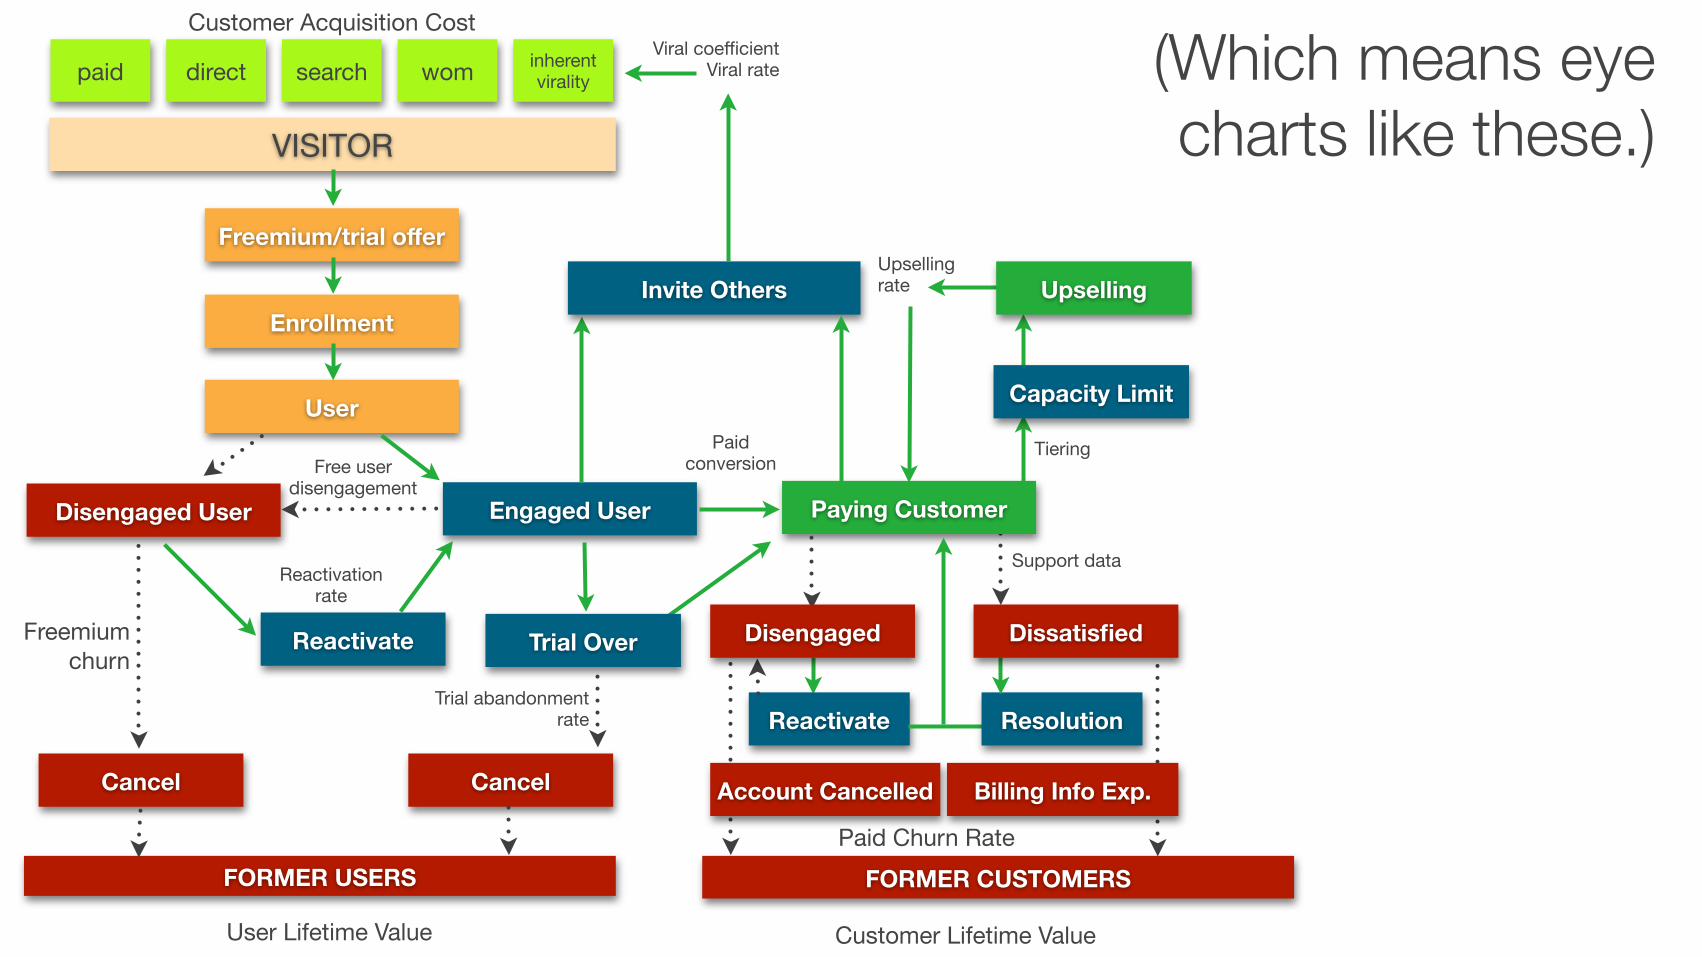
(Which means eye charts like these.)
Customer Acquisition Cost
paid direct search wom inherent virality
VISITOR
Freemium/trial offer
Enrollment
User
Disengaged User
Cancel
Freemium churn
Engaged User
Free user disengagement
Reactivate
Cancel
Trial abandonment rate
Invite Others
Paying Customer
Reactivationrate
Paid conversion
FORMER USERS
User Lifetime Value
Reactivate
FORMER CUSTOMERS
Customer Lifetime Value
Viral coefficientViral rate
Resolution
Support data
Account Cancelled Billing Info Exp.
Paid Churn Rate
Tiering
Capacity Limit
Upselling rate Upselling
Disengaged DissatisfiedTrial Over
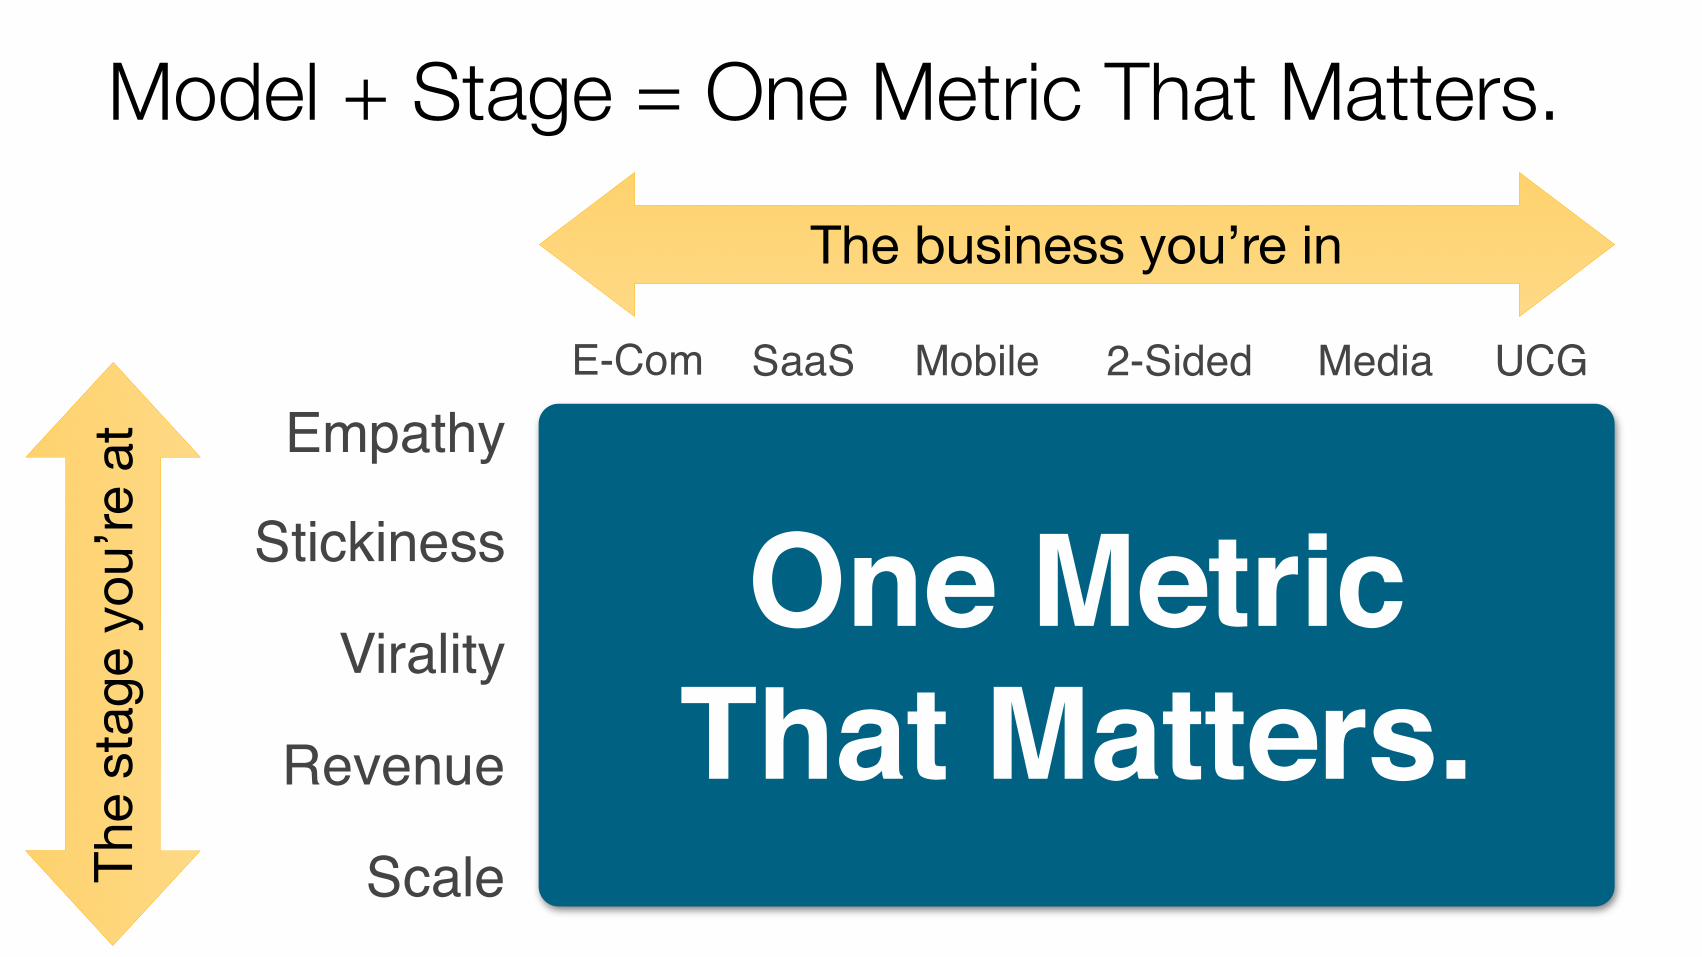
Model + Stage = One Metric That Matters.
One Metric That Matters.
The business you’re in
E-Com SaaS Mobile 2-Sided Media UCG
Empathy
Stickiness
Virality
Revenue
ScaleThe
stag
e yo
u’re
at

Really? Just one?

Yes, one.

In a startup, focus is hard to achieve.
Having only one metric addresses this problem.
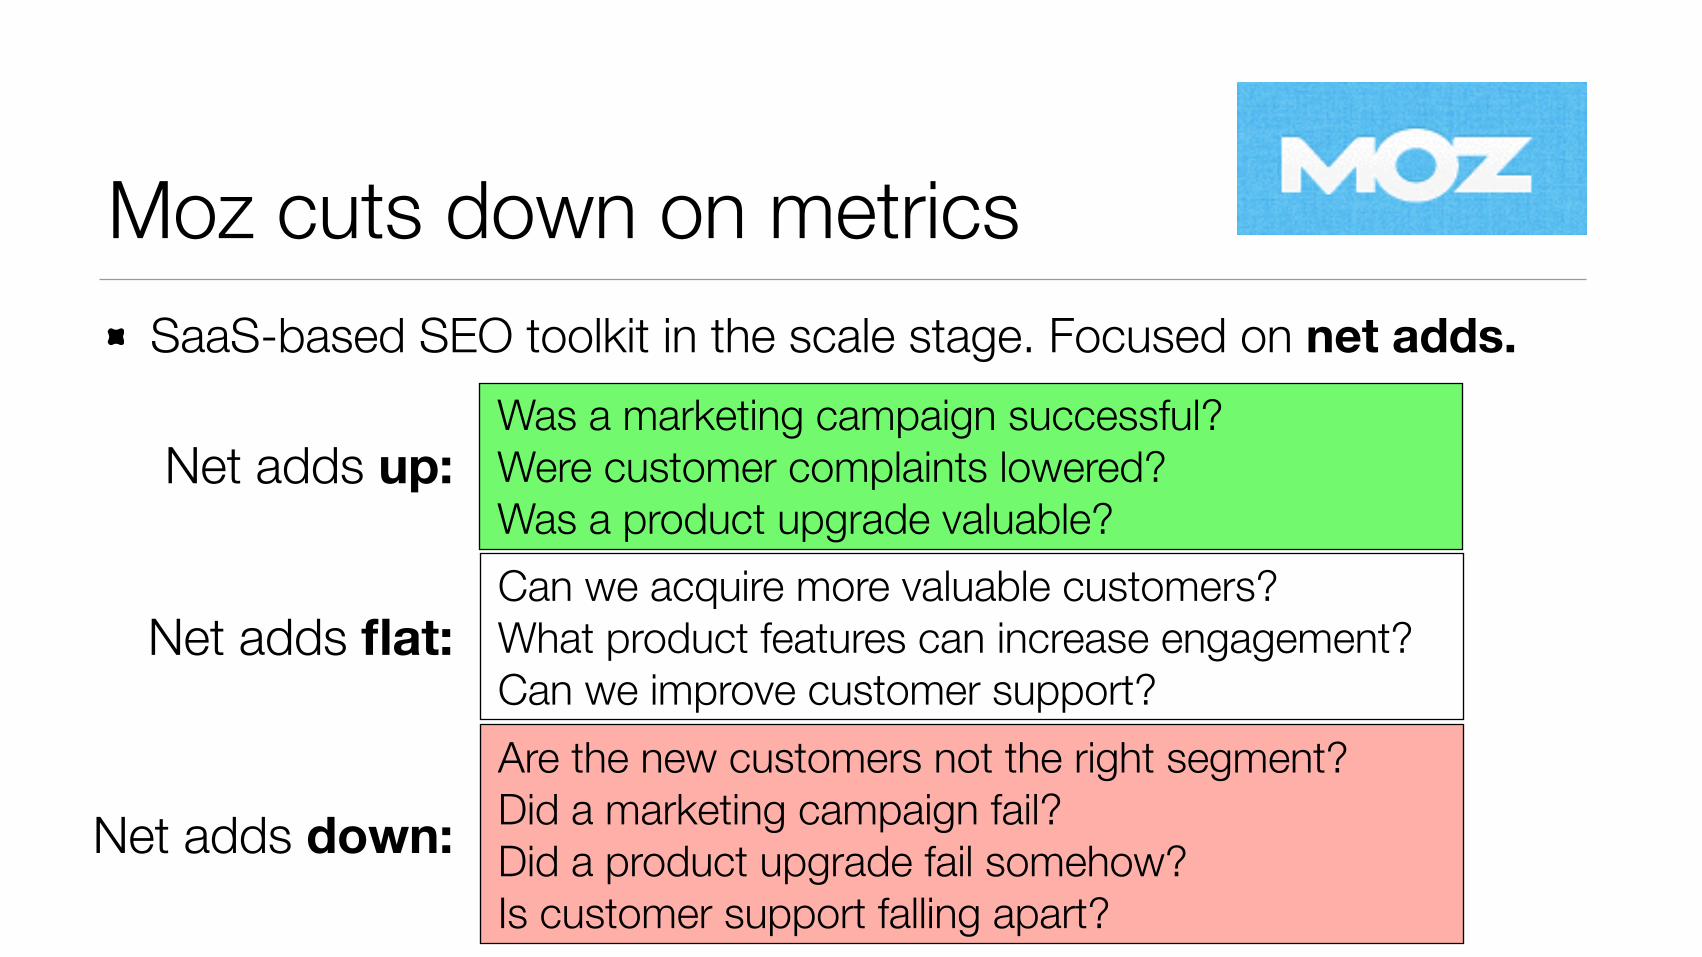
Moz cuts down on metricsSaaS-based SEO toolkit in the scale stage. Focused on net adds.
Was a marketing campaign successful? Were customer complaints lowered? Was a product upgrade valuable?
Net adds up:
Can we acquire more valuable customers? What product features can increase engagement? Can we improve customer support?
Net adds flat:
Are the new customers not the right segment? Did a marketing campaign fail? Did a product upgrade fail somehow? Is customer support falling apart?
Net adds down:
Metrics are like squeeze toys.
http://www.flickr.com/photos/connortarter/4791605202/
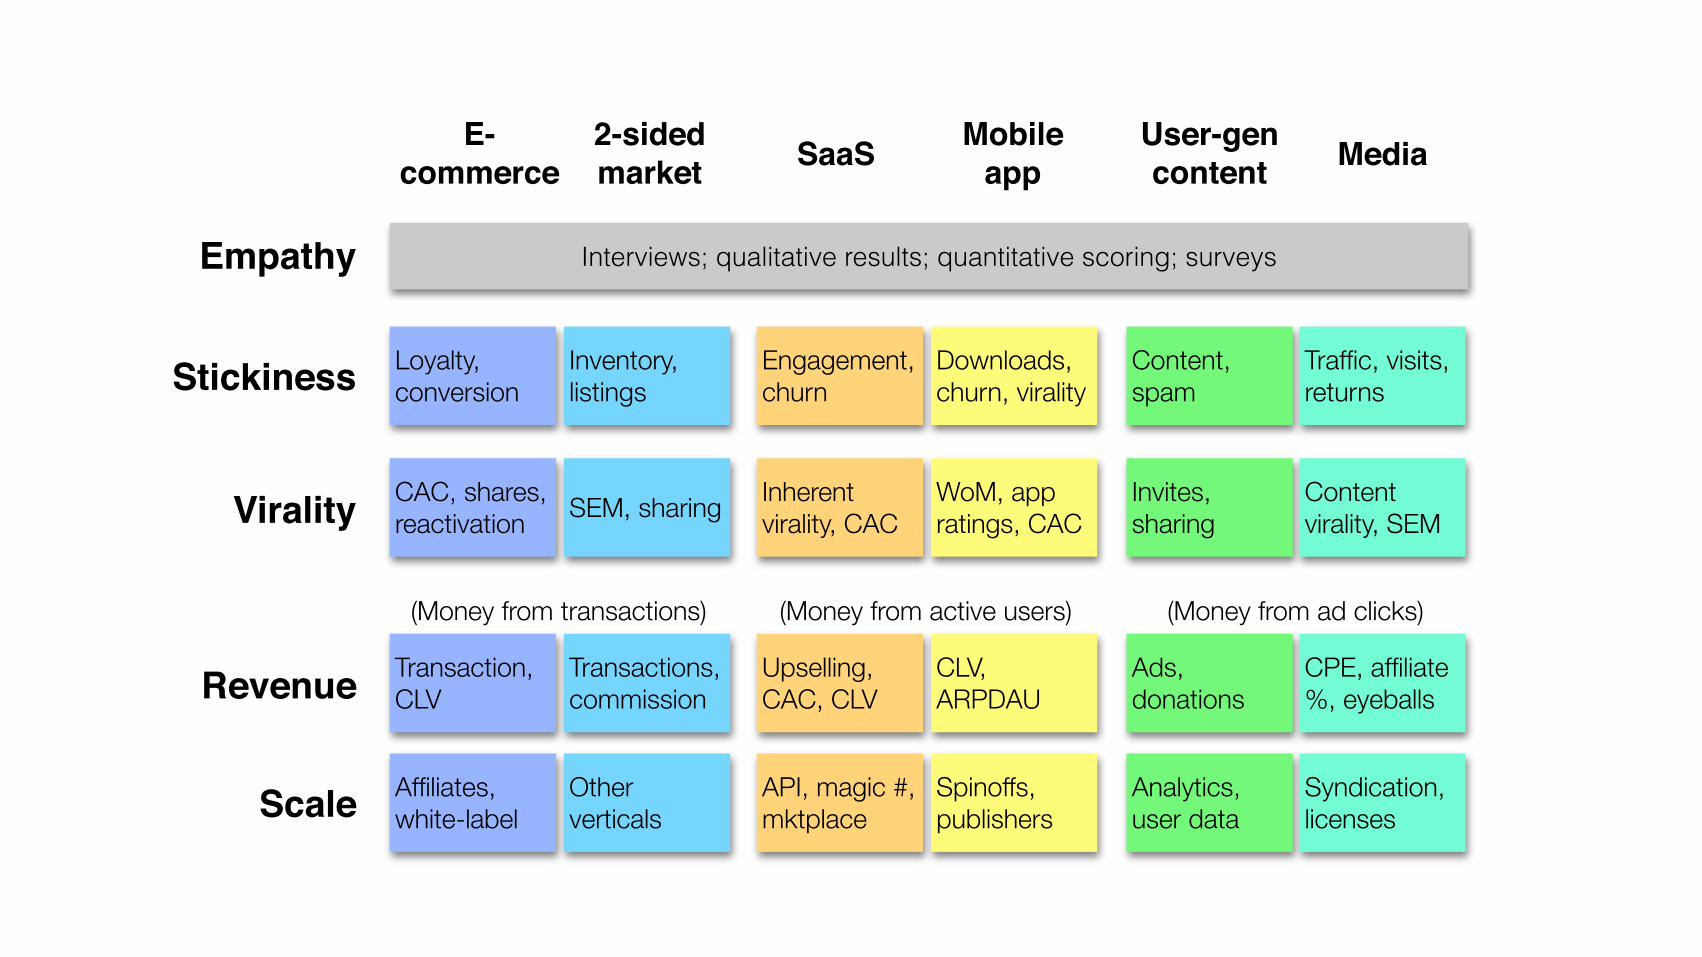
Empathy
Stickiness
Virality
Revenue
Scale
E-commerce SaaS MediaMobile
appUser-gencontent
2-sidedmarket
Interviews; qualitative results; quantitative scoring; surveys
Loyalty, conversion
CAC, shares, reactivation
Transaction, CLV
Affiliates, white-label
Engagement, churn
Inherent virality, CAC
Upselling, CAC, CLV
API, magic #, mktplace
Content, spam
Invites, sharing
Ads, donations
Analytics, user data
Inventory, listings
SEM, sharing
Transactions, commission
Other verticals
(Money from transactions)
Downloads, churn, virality
WoM, app ratings, CAC
CLV, ARPDAU
Spinoffs, publishers
(Money from active users)
Traffic, visits, returns
Content virality, SEM
CPE, affiliate %, eyeballs
Syndication, licenses
(Money from ad clicks)

Better: bit.ly/BigLeanTable

Drawing some lines in the sand.
A company loses a quarter of its customers every year.
Is this good or bad?

Not knowing what normal is makes you do stupid things.
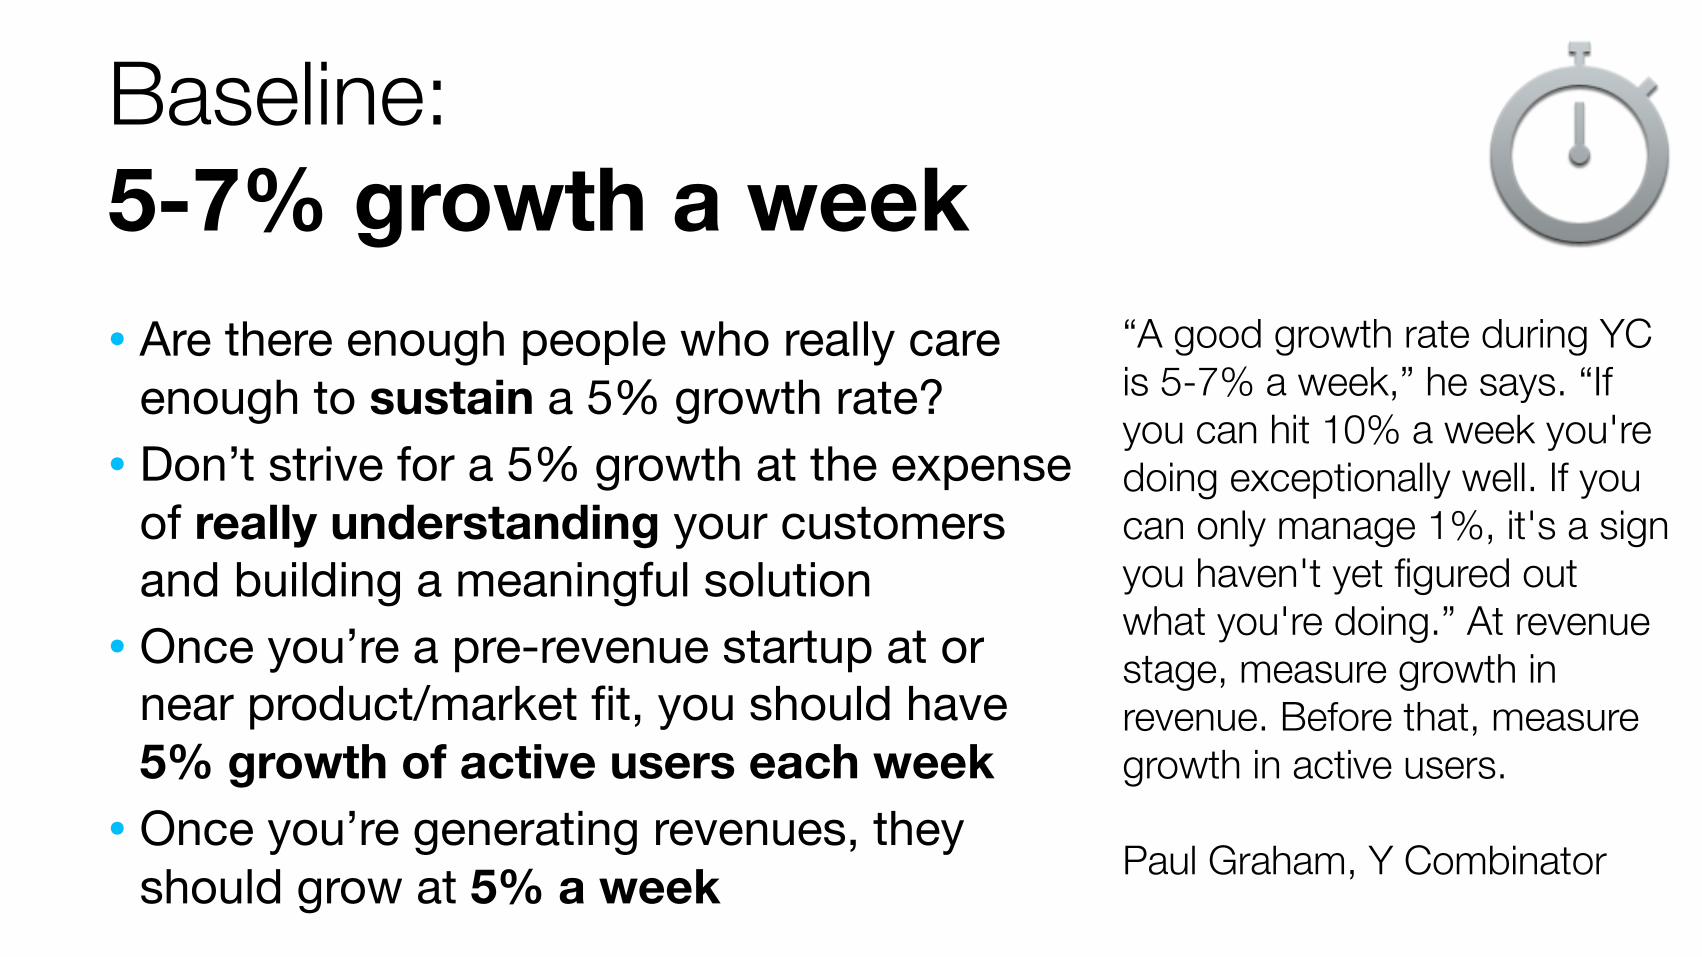
Baseline: 5-7% growth a week
“A good growth rate during YC is 5-7% a week,” he says. “If you can hit 10% a week you're doing exceptionally well. If you can only manage 1%, it's a sign you haven't yet figured out what you're doing.” At revenue stage, measure growth in revenue. Before that, measure growth in active users.
Paul Graham, Y Combinator
• Are there enough people who really care enough to sustain a 5% growth rate?
• Don’t strive for a 5% growth at the expense of really understanding your customers and building a meaningful solution
• Once you’re a pre-revenue startup at or near product/market fit, you should have 5% growth of active users each week
• Once you’re generating revenues, they should grow at 5% a week
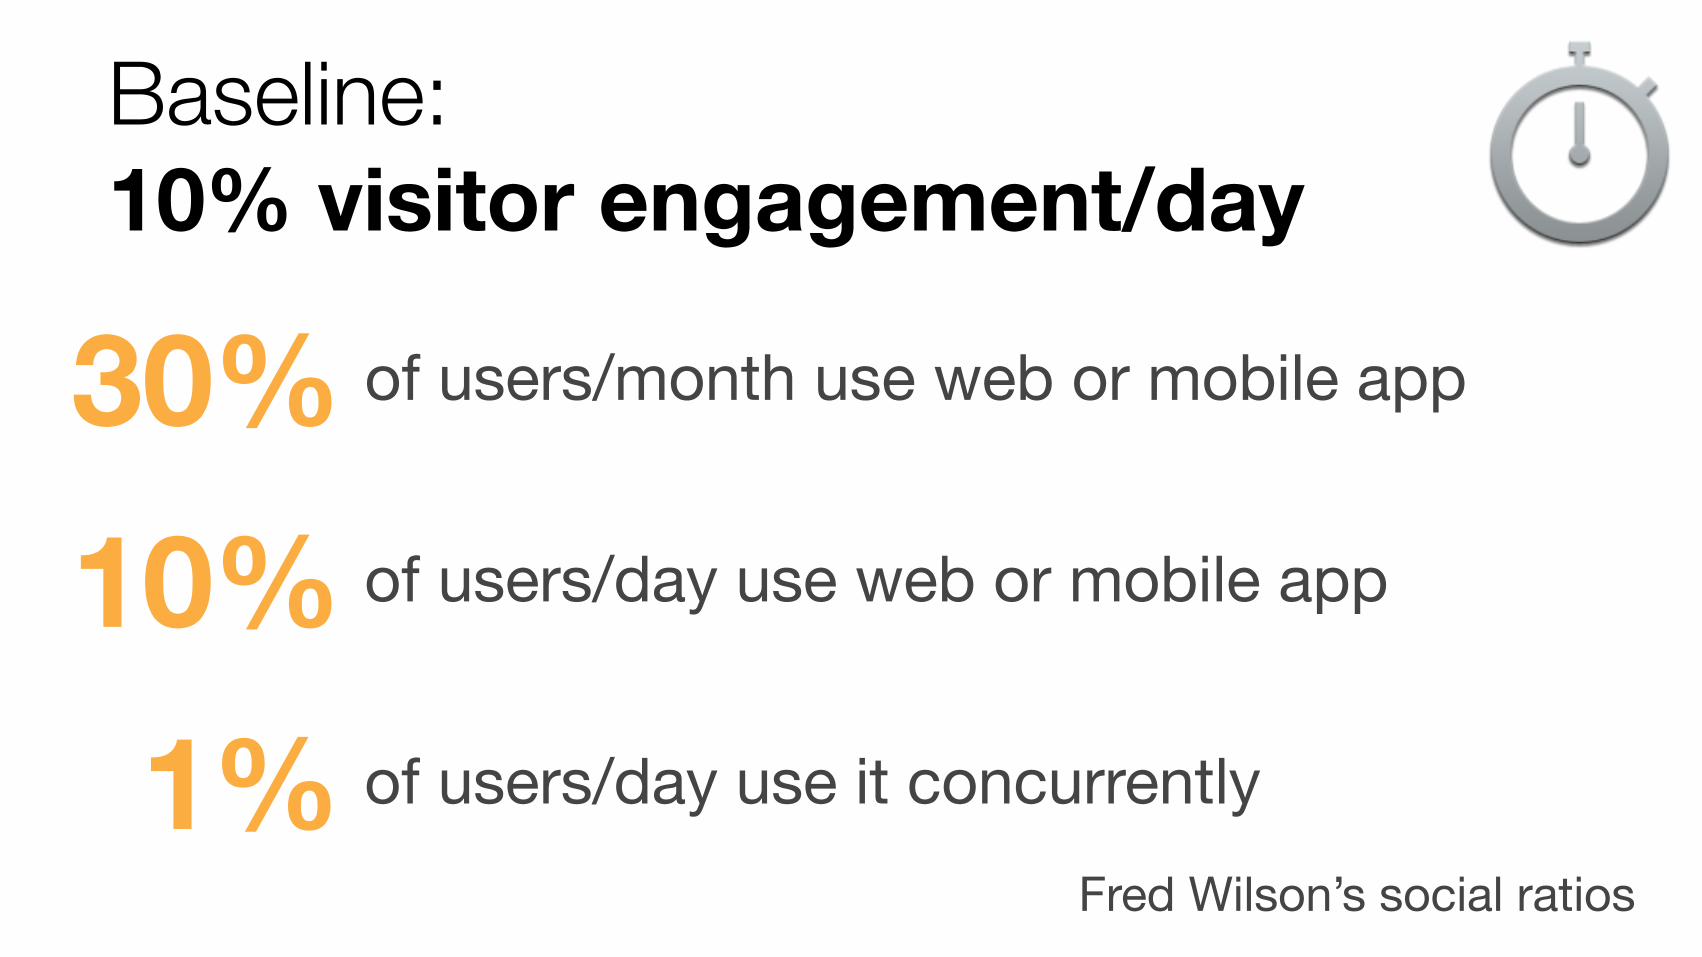
Baseline: 10% visitor engagement/day
Fred Wilson’s social ratios
30% of users/month use web or mobile app
10% of users/day use web or mobile app
1% of users/day use it concurrently
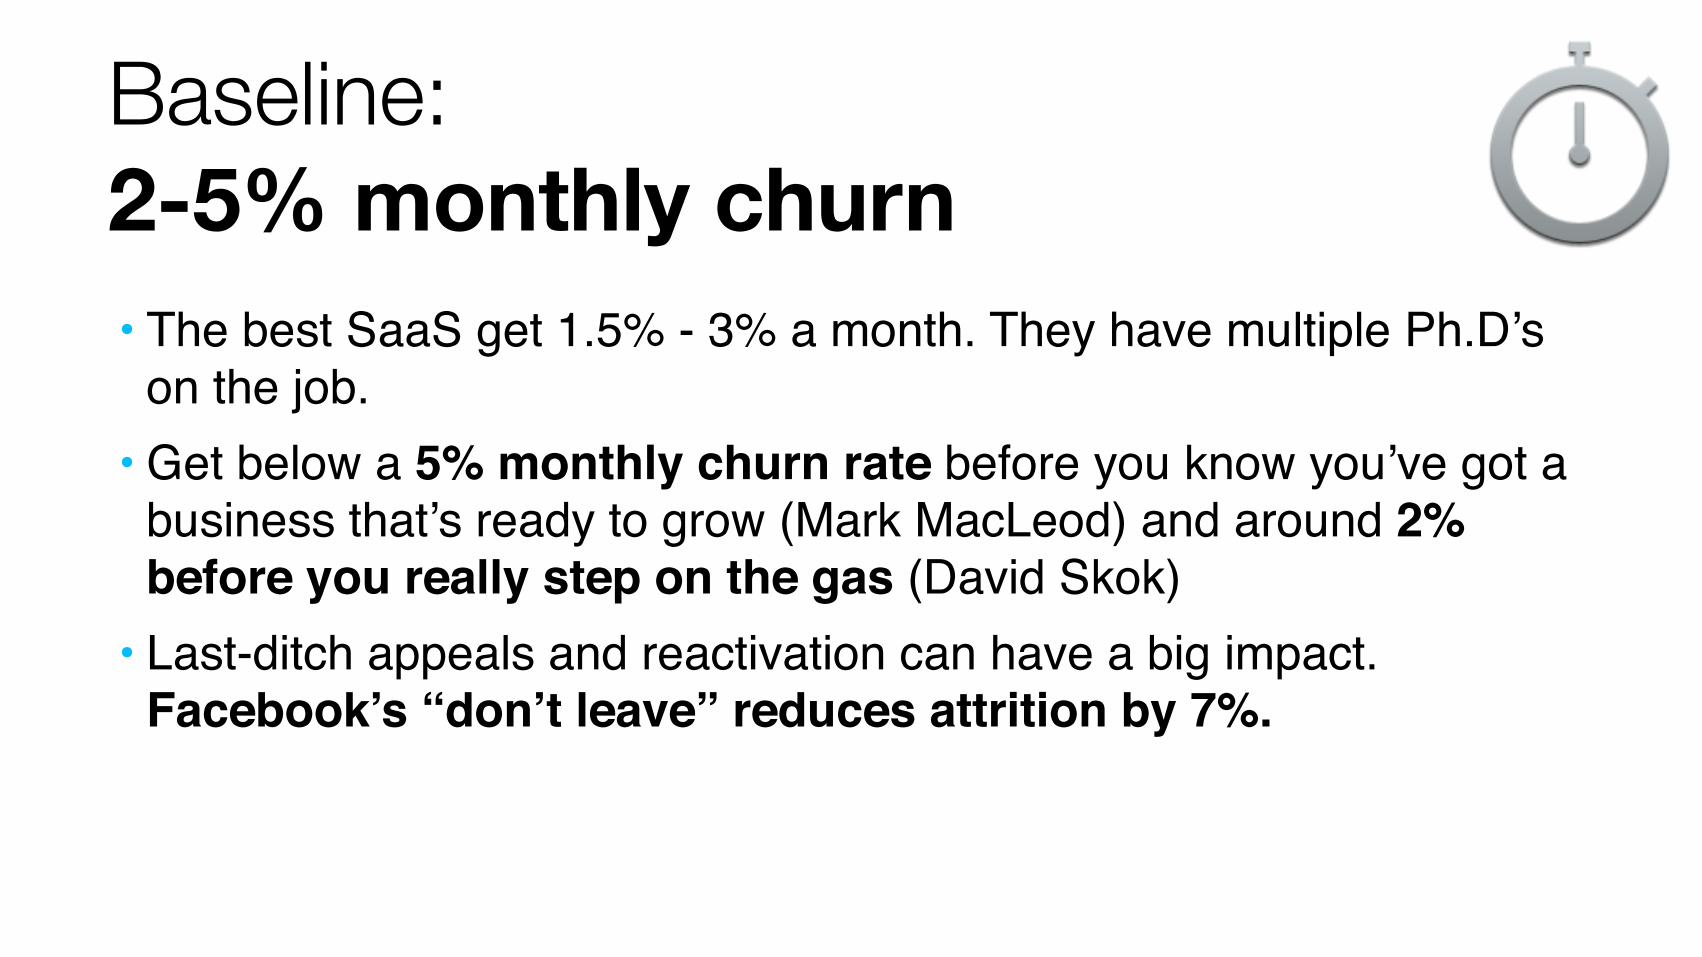
Baseline: 2-5% monthly churn• The best SaaS get 1.5% - 3% a month. They have multiple Ph.D’s
on the job.• Get below a 5% monthly churn rate before you know you’ve got a
business that’s ready to grow (Mark MacLeod) and around 2% before you really step on the gas (David Skok)
• Last-ditch appeals and reactivation can have a big impact. Facebook’s “don’t leave” reduces attrition by 7%.
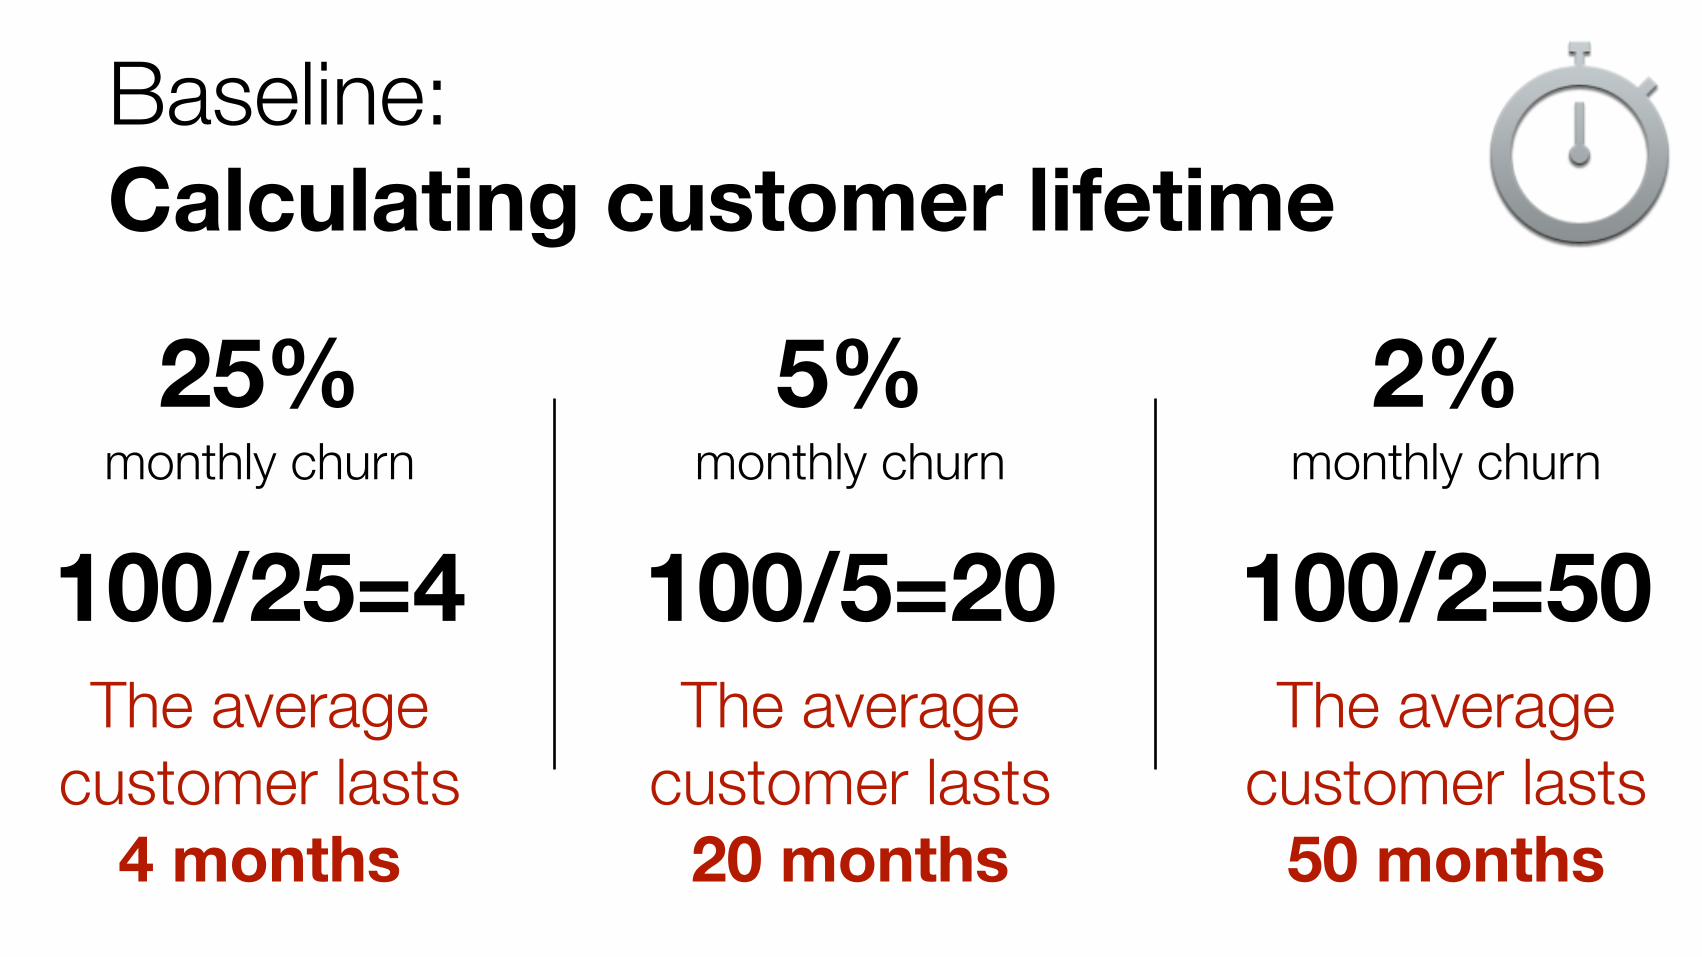
Baseline: Calculating customer lifetime
25%monthly churn
100/25=4The average
customer lasts 4 months
5%monthly churn
100/5=20The average
customer lasts 20 months
2%monthly churn
100/2=50The average
customer lasts 50 months
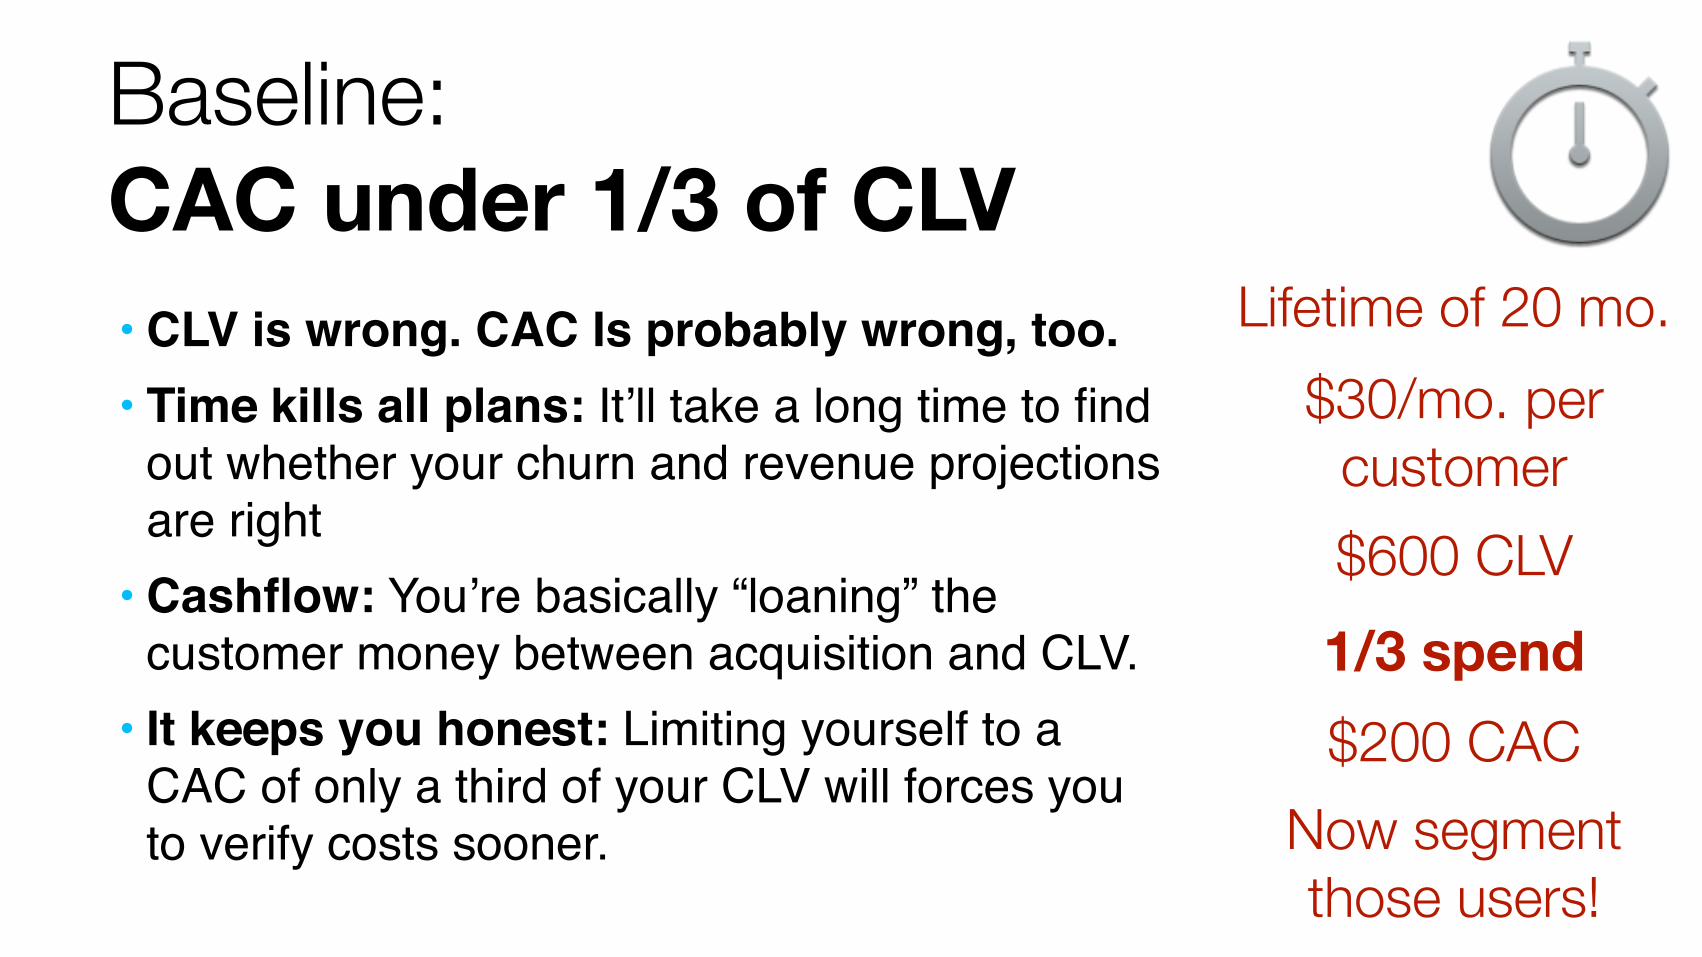
Baseline: CAC under 1/3 of CLV• CLV is wrong. CAC Is probably wrong, too.• Time kills all plans: It’ll take a long time to find
out whether your churn and revenue projections are right
• Cashflow: You’re basically “loaning” the customer money between acquisition and CLV.
• It keeps you honest: Limiting yourself to a CAC of only a third of your CLV will forces you to verify costs sooner.
Lifetime of 20 mo.$30/mo. per
customer$600 CLV
$200 CACNow segment those users!
1/3 spend
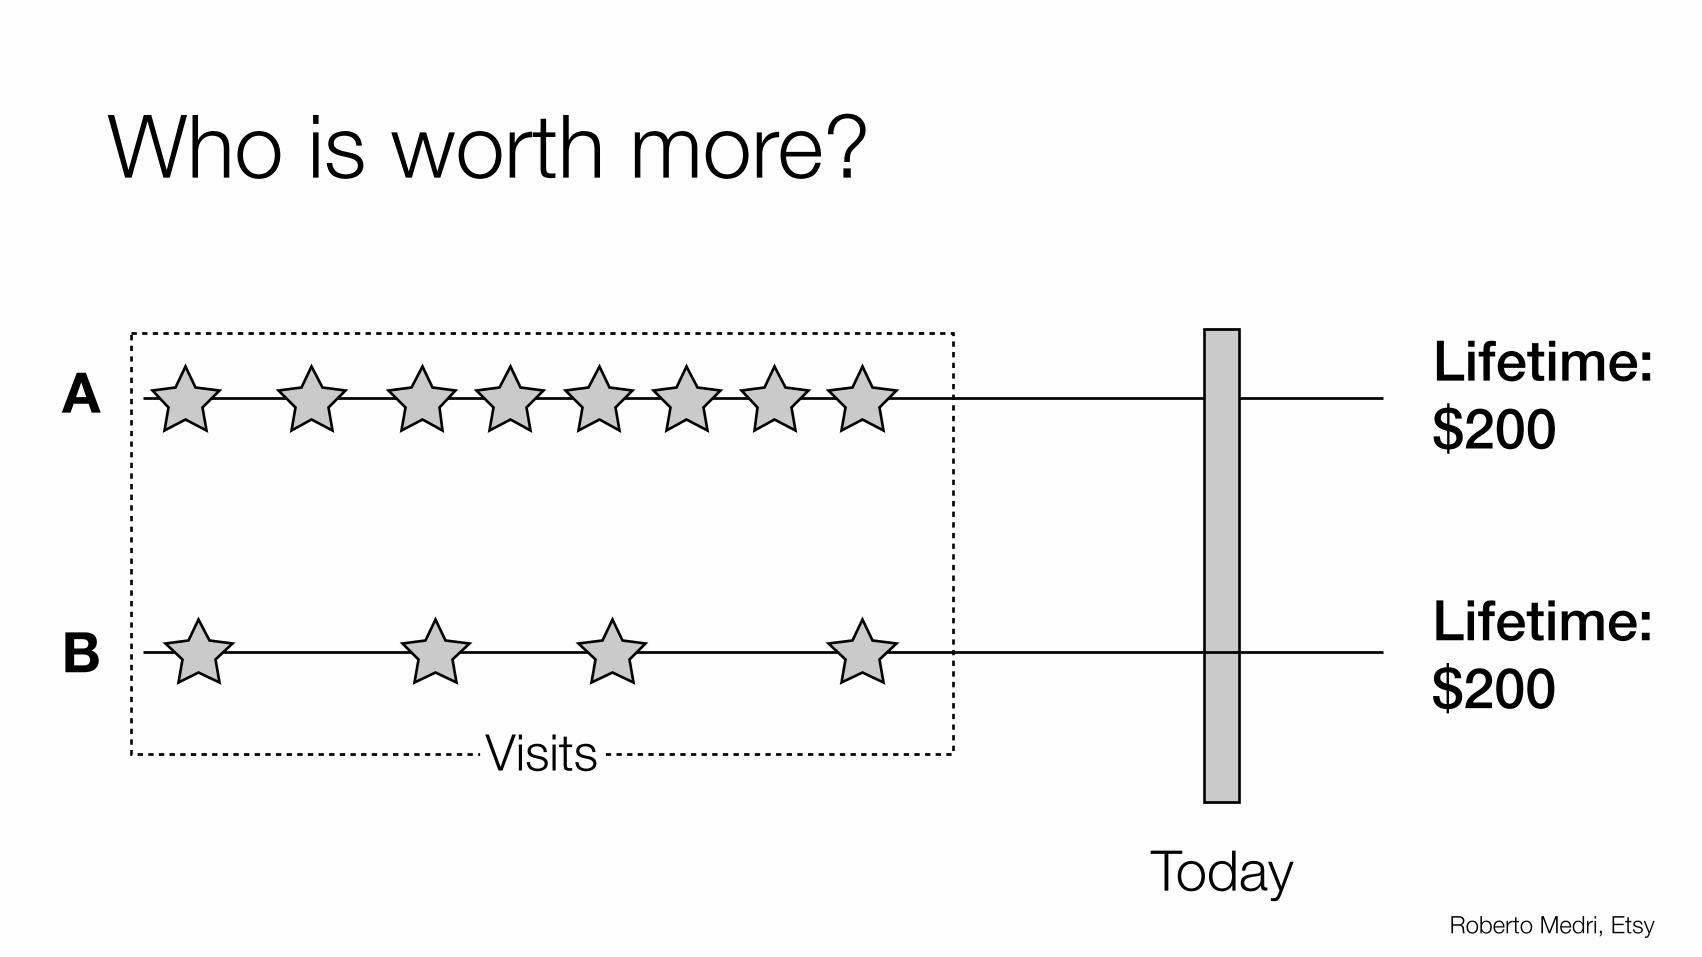
Who is worth more?
Today
A Lifetime:$200
Roberto Medri, Etsy
B Lifetime:$200
Visits
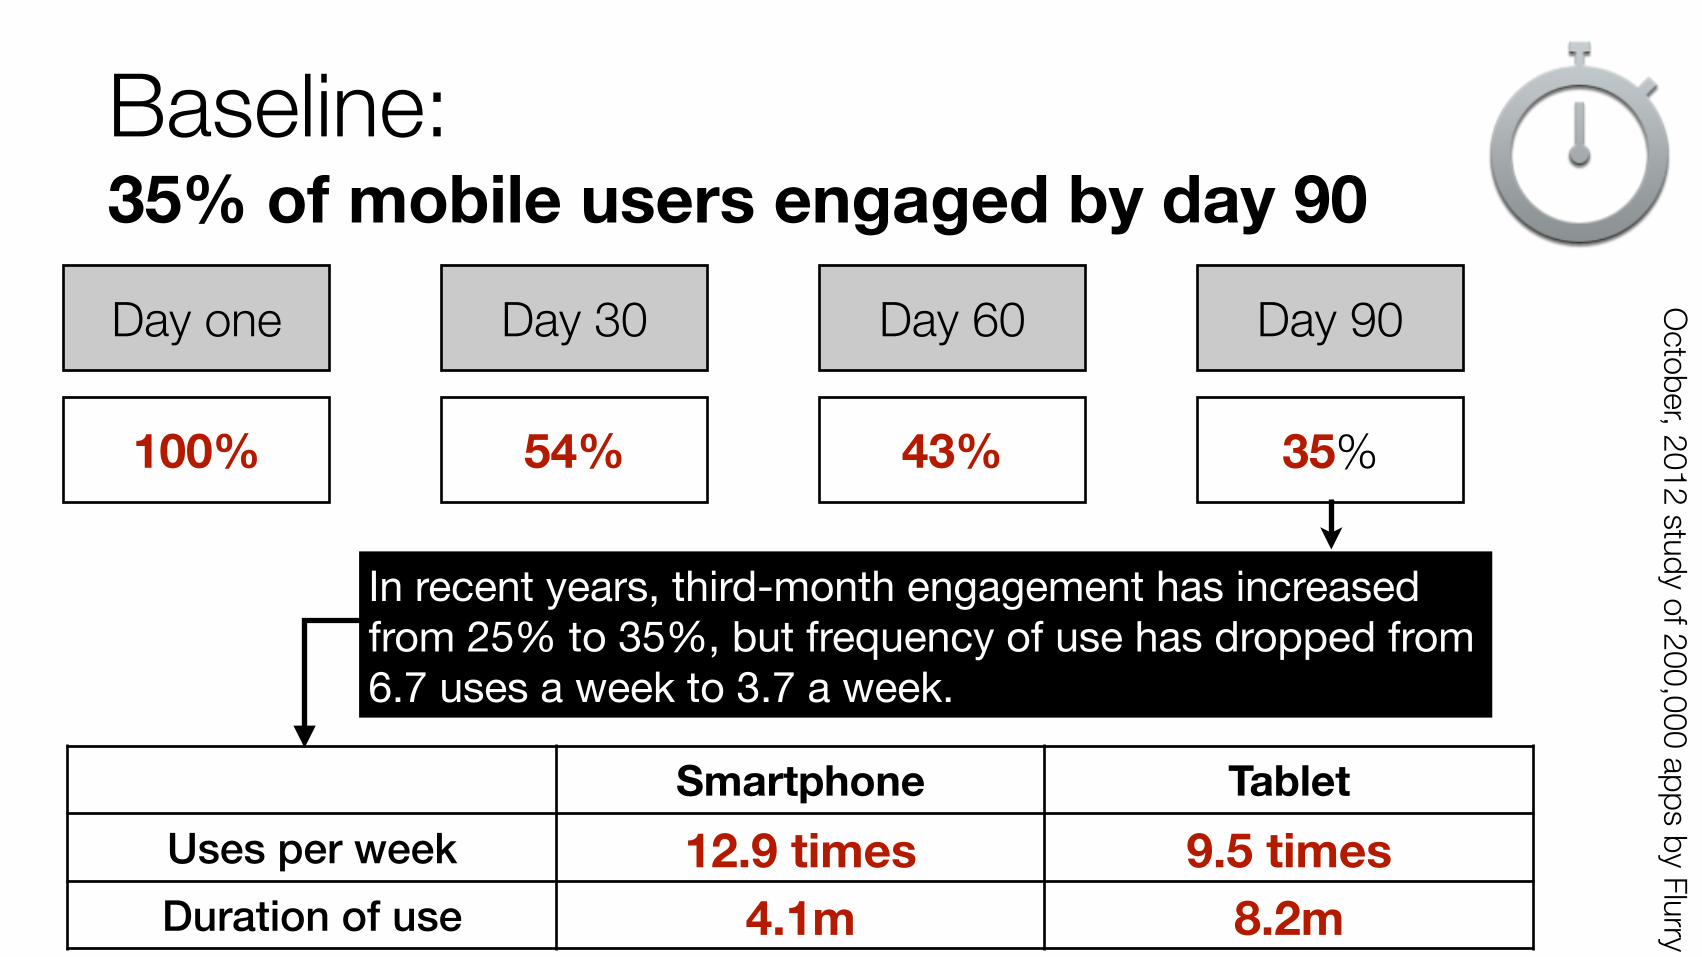
Baseline: 35% of mobile users engaged by day 90Day one
100%
Day 30
54%
Day 60
43%
Day 90
35%
October, 2012 study of 200,000 apps by Flurry
Smartphone TabletUses per week 12.9 times 9.5 timesDuration of use 4.1m 8.2m
In recent years, third-month engagement has increased from 25% to 35%, but frequency of use has dropped from 6.7 uses a week to 3.7 a week.
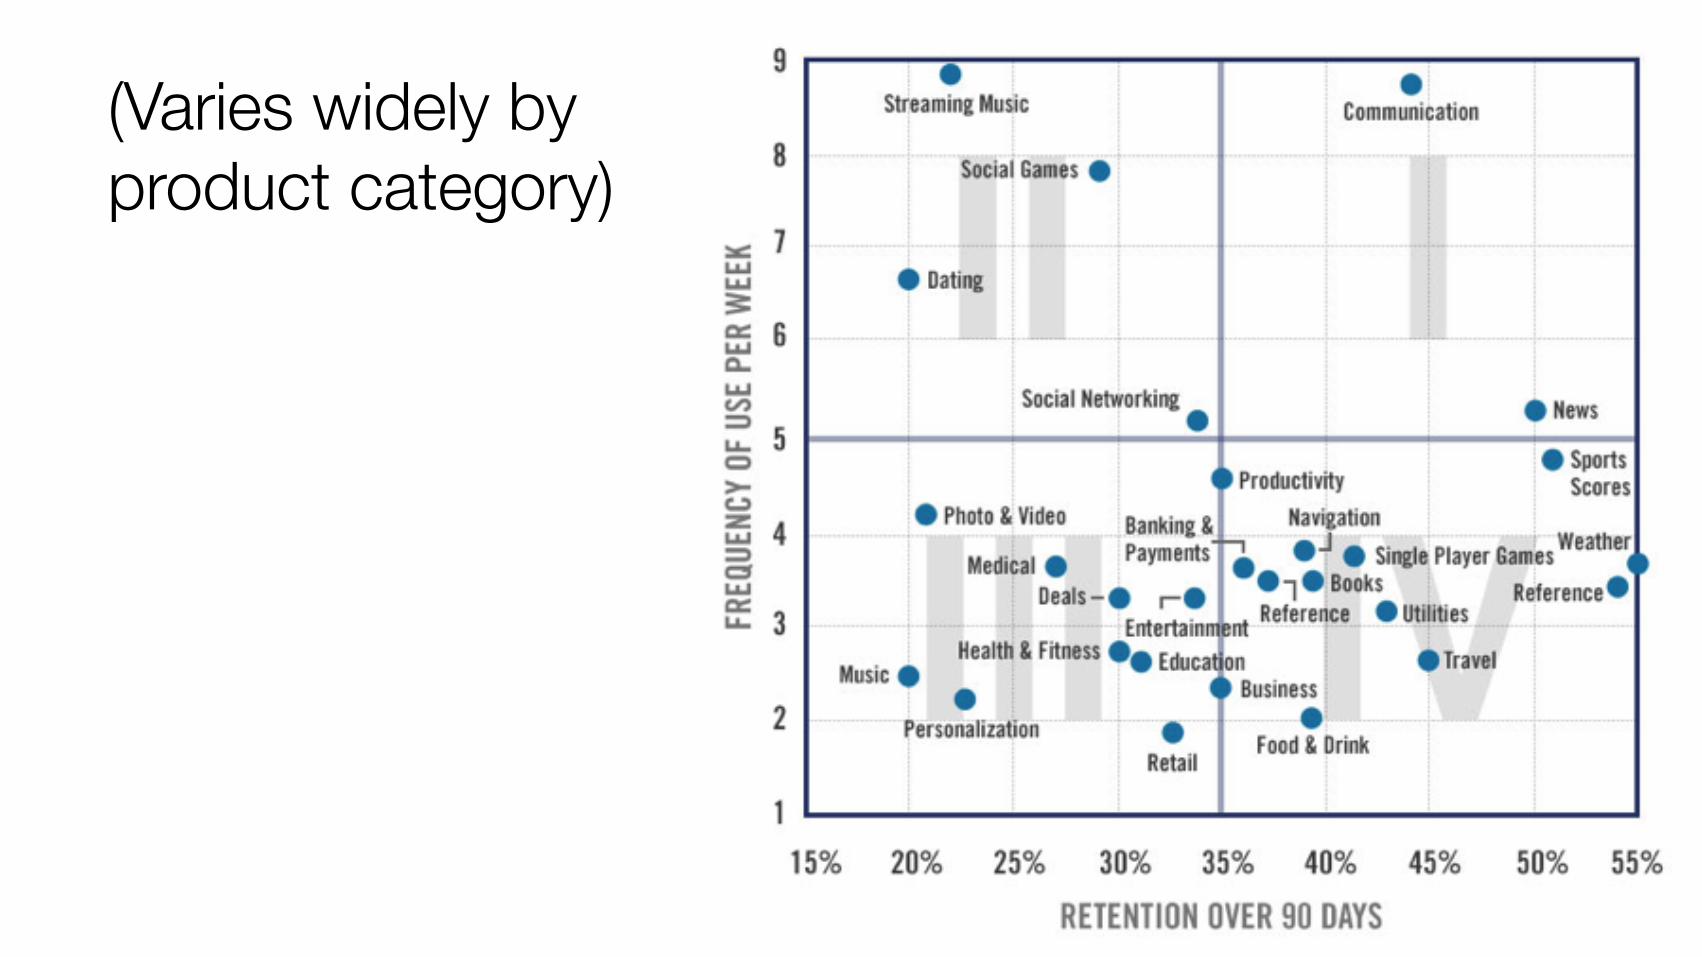
(Varies widely by product category)
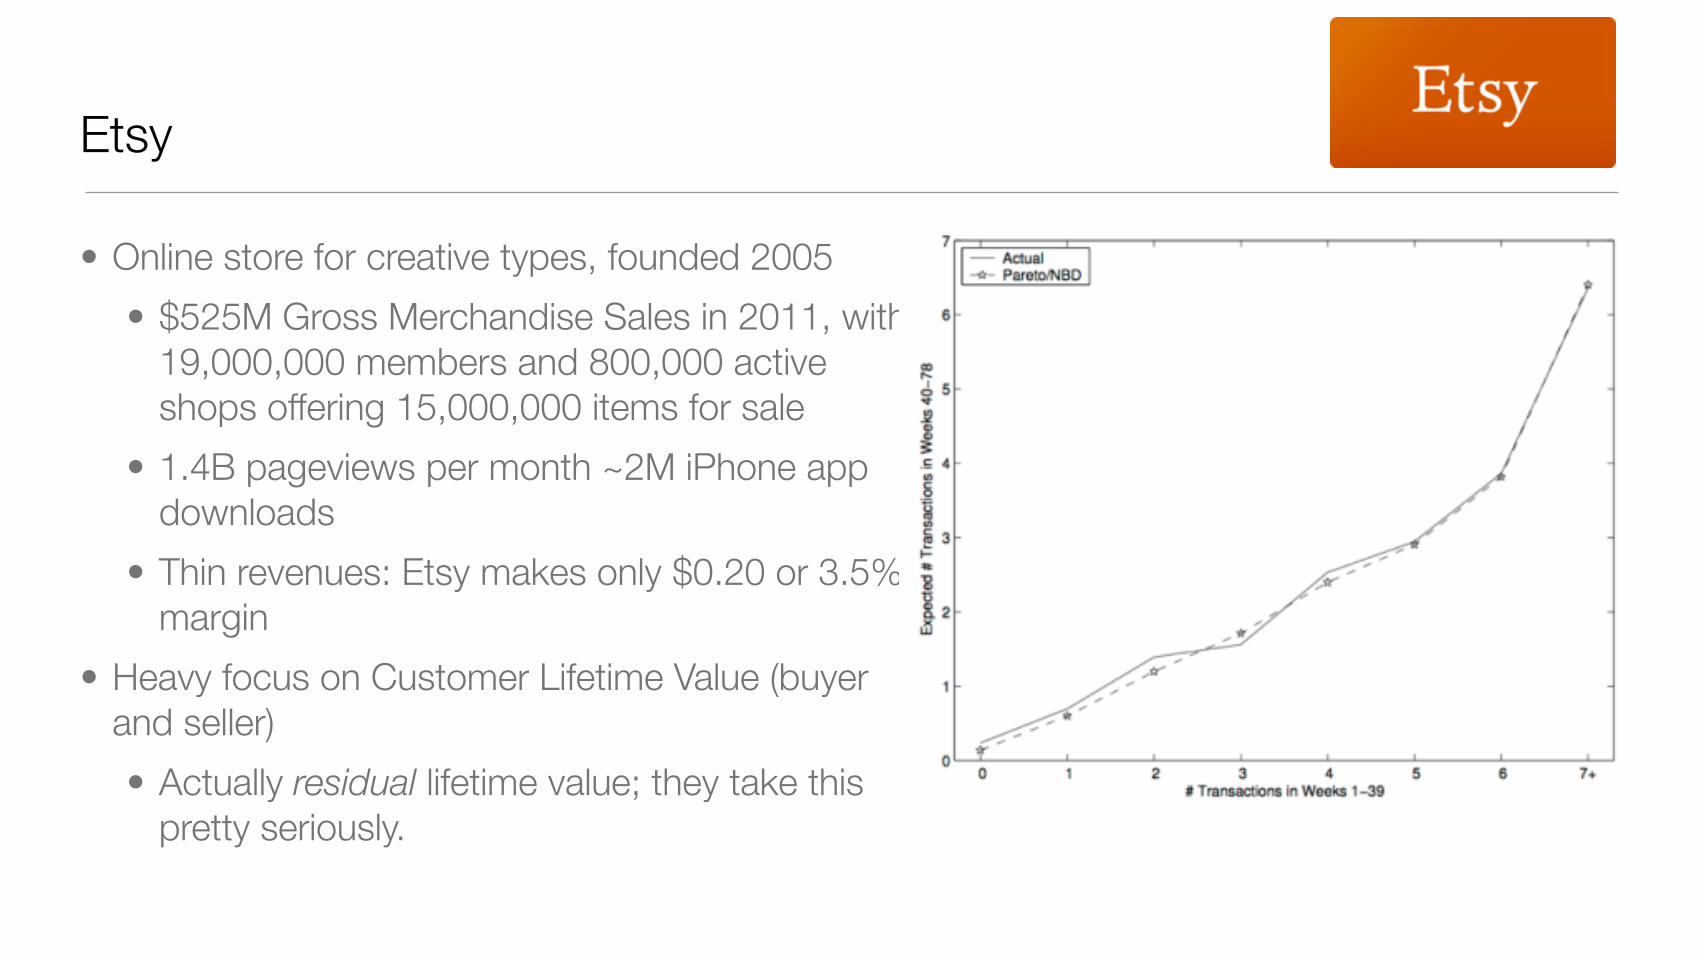
Etsy
• Online store for creative types, founded 2005 • $525M Gross Merchandise Sales in 2011, with
19,000,000 members and 800,000 active shops offering 15,000,000 items for sale
• 1.4B pageviews per month ~2M iPhone app downloads
• Thin revenues: Etsy makes only $0.20 or 3.5% margin
• Heavy focus on Customer Lifetime Value (buyer and seller) • Actually residual lifetime value; they take this
pretty seriously.
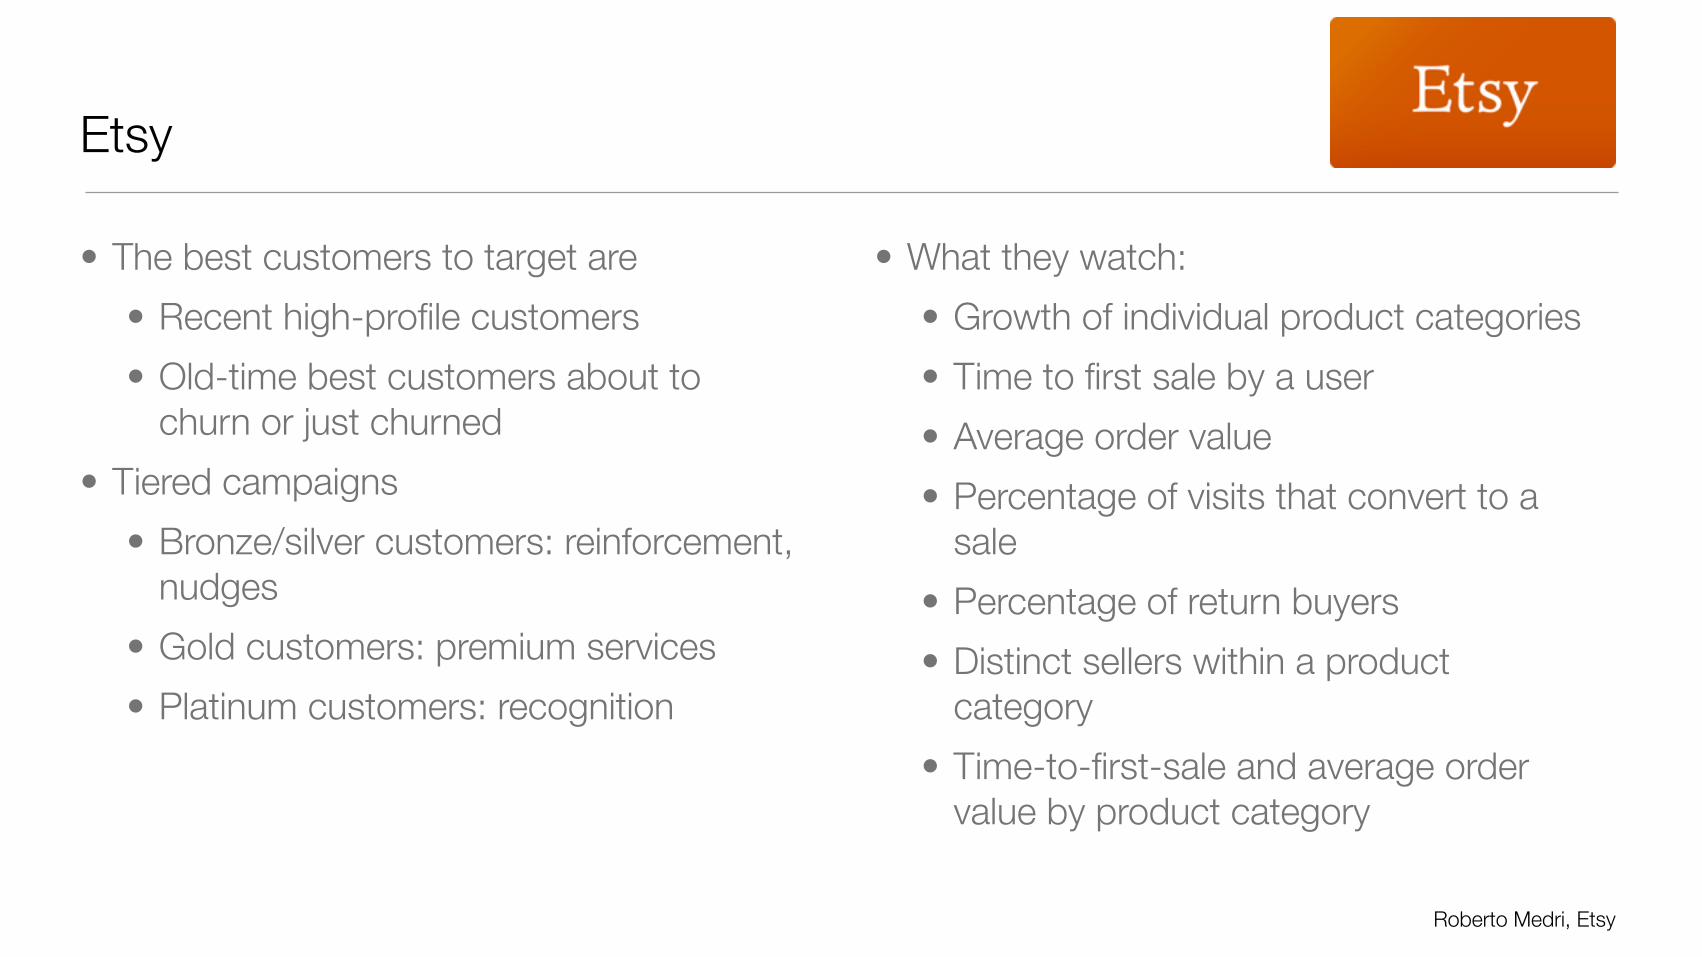
Etsy
• The best customers to target are • Recent high-profile customers • Old-time best customers about to
churn or just churned • Tiered campaigns
• Bronze/silver customers: reinforcement, nudges
• Gold customers: premium services • Platinum customers: recognition
• What they watch: • Growth of individual product categories • Time to first sale by a user • Average order value • Percentage of visits that convert to a
sale • Percentage of return buyers • Distinct sellers within a product
category • Time-to-first-sale and average order
value by product category
Roberto Medri, Etsy
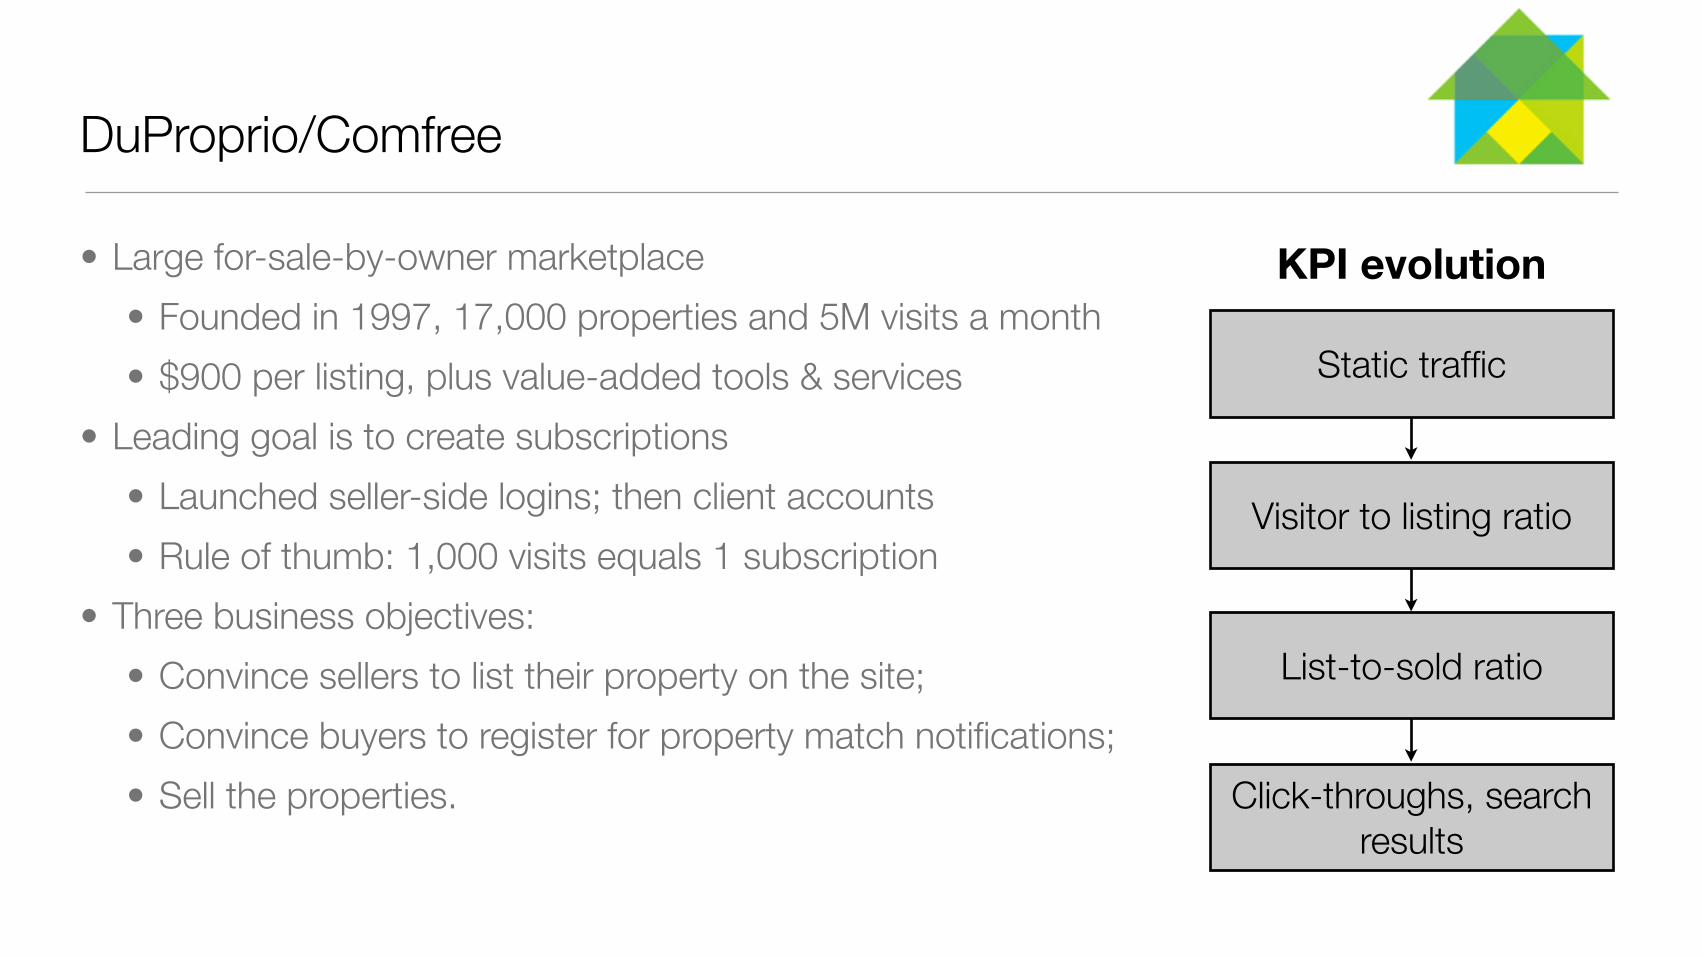
DuProprio/Comfree
• Large for-sale-by-owner marketplace • Founded in 1997, 17,000 properties and 5M visits a month • $900 per listing, plus value-added tools & services
• Leading goal is to create subscriptions • Launched seller-side logins; then client accounts • Rule of thumb: 1,000 visits equals 1 subscription
• Three business objectives: • Convince sellers to list their property on the site; • Convince buyers to register for property match notifications; • Sell the properties.
Static traffic
Visitor to listing ratio
List-to-sold ratio
Click-throughs, search results
KPI evolution
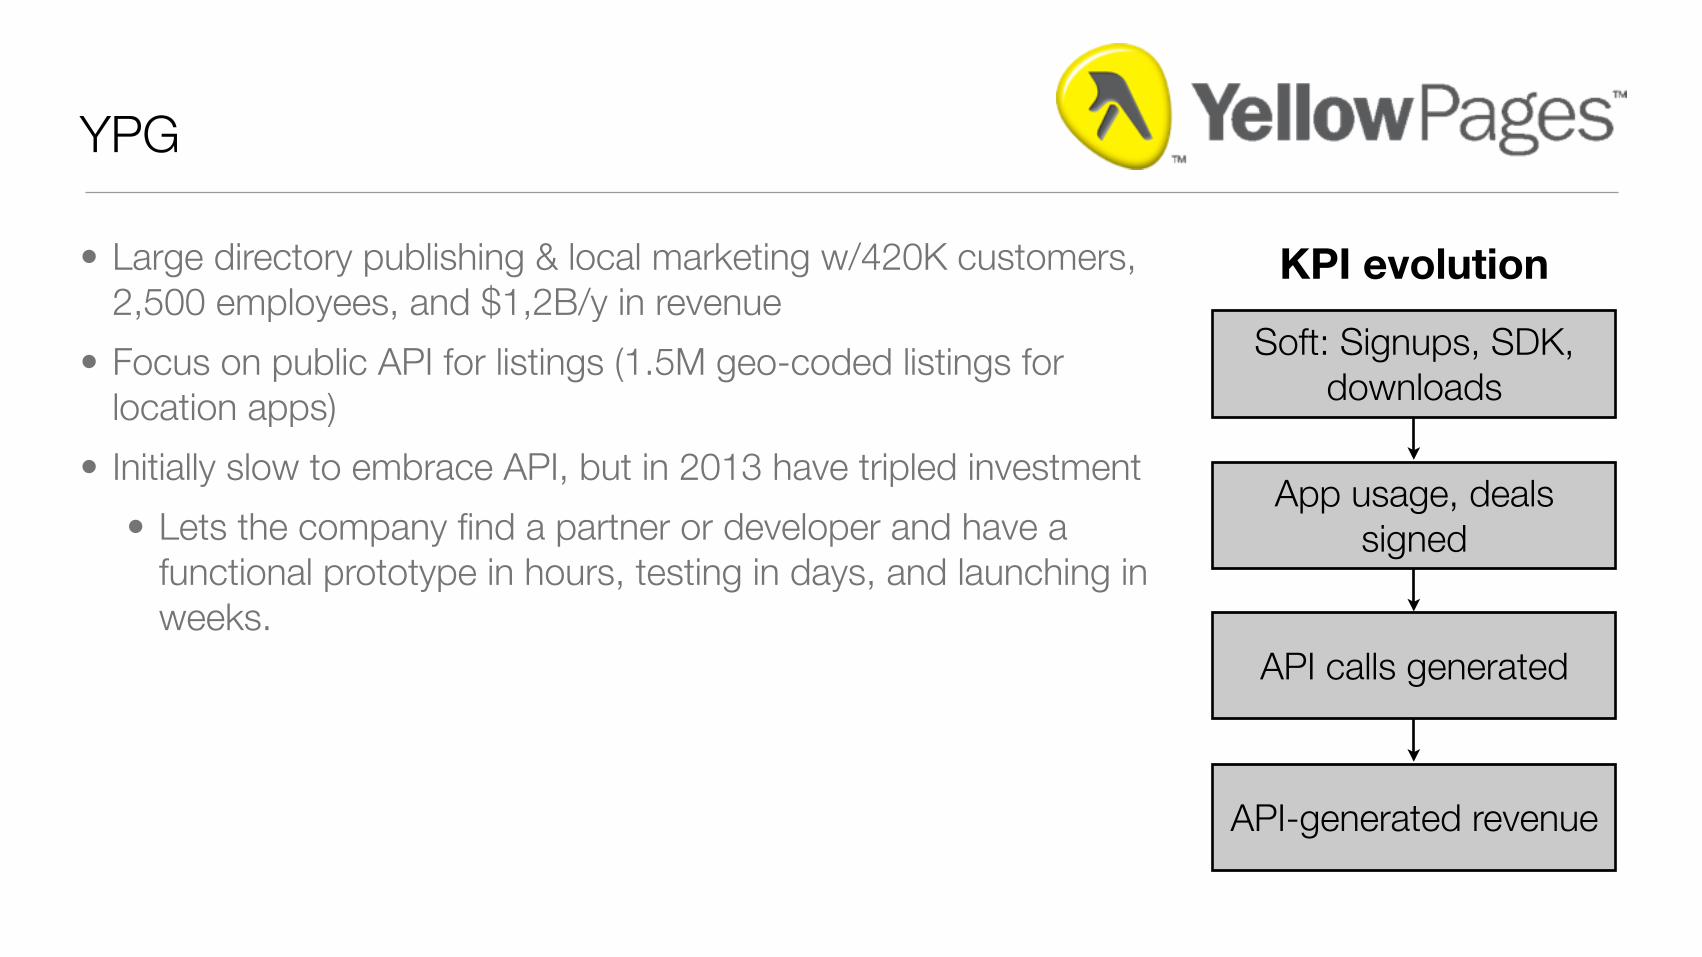
YPG
• Large directory publishing & local marketing w/420K customers, 2,500 employees, and $1,2B/y in revenue
• Focus on public API for listings (1.5M geo-coded listings for location apps)
• Initially slow to embrace API, but in 2013 have tripled investment • Lets the company find a partner or developer and have a
functional prototype in hours, testing in days, and launching in weeks.
Soft: Signups, SDK, downloads
App usage, deals signed
API calls generated
API-generated revenue
KPI evolution

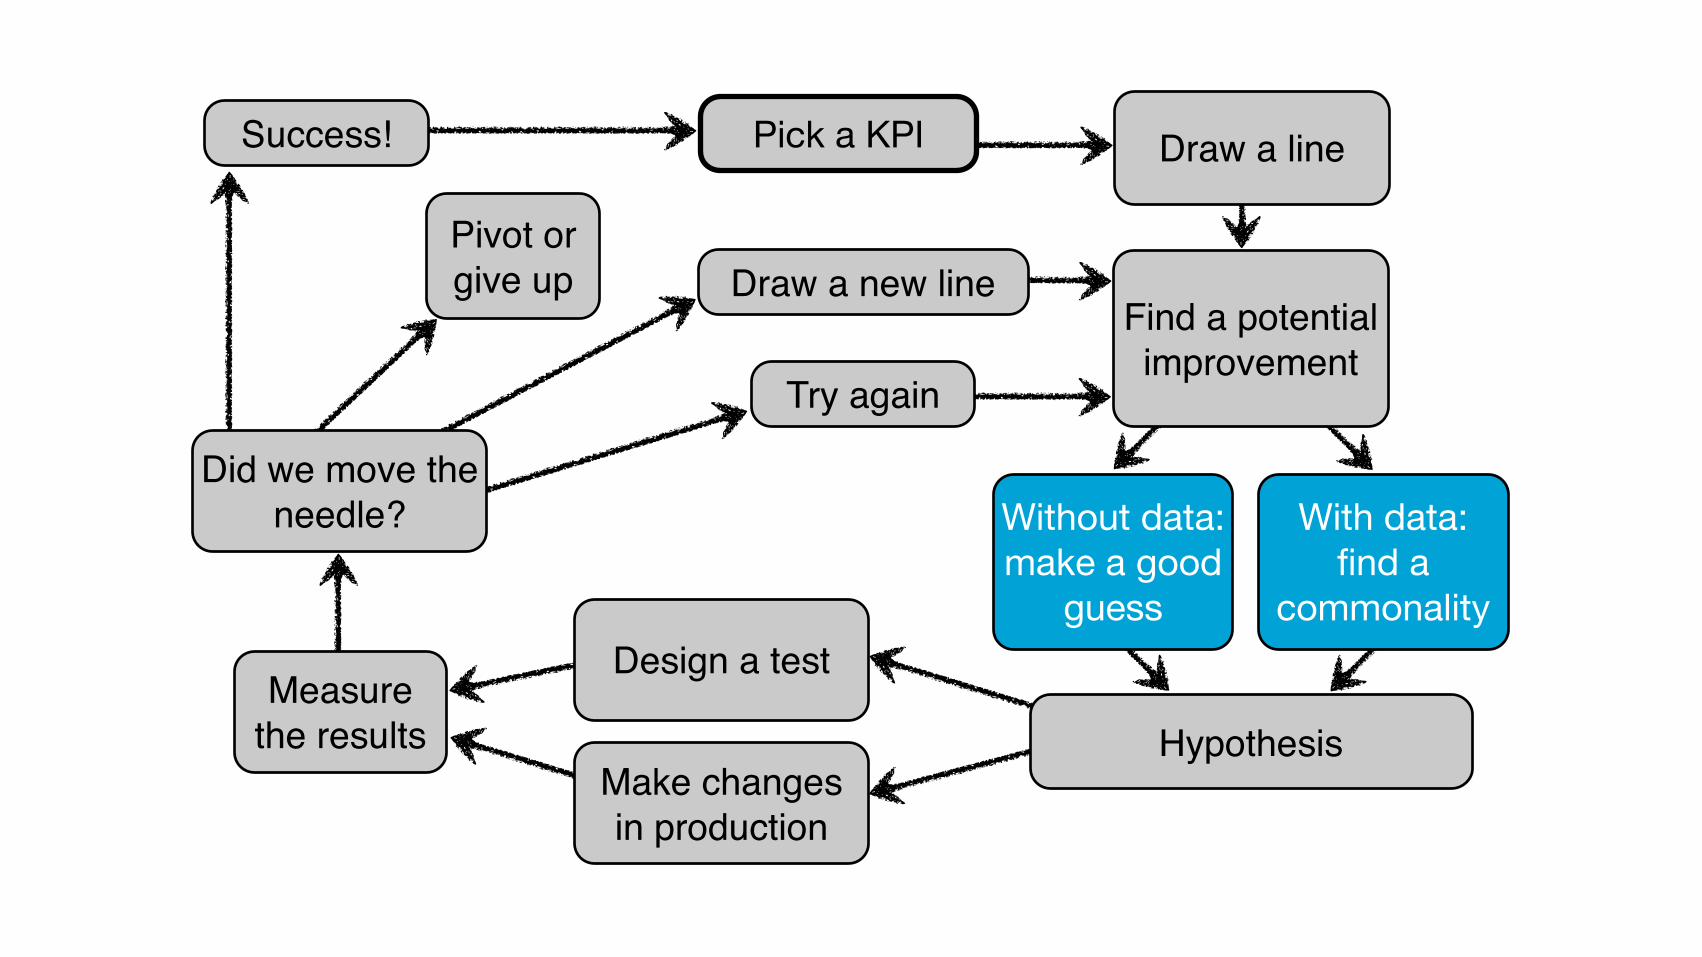
The Lean Analytics cycle
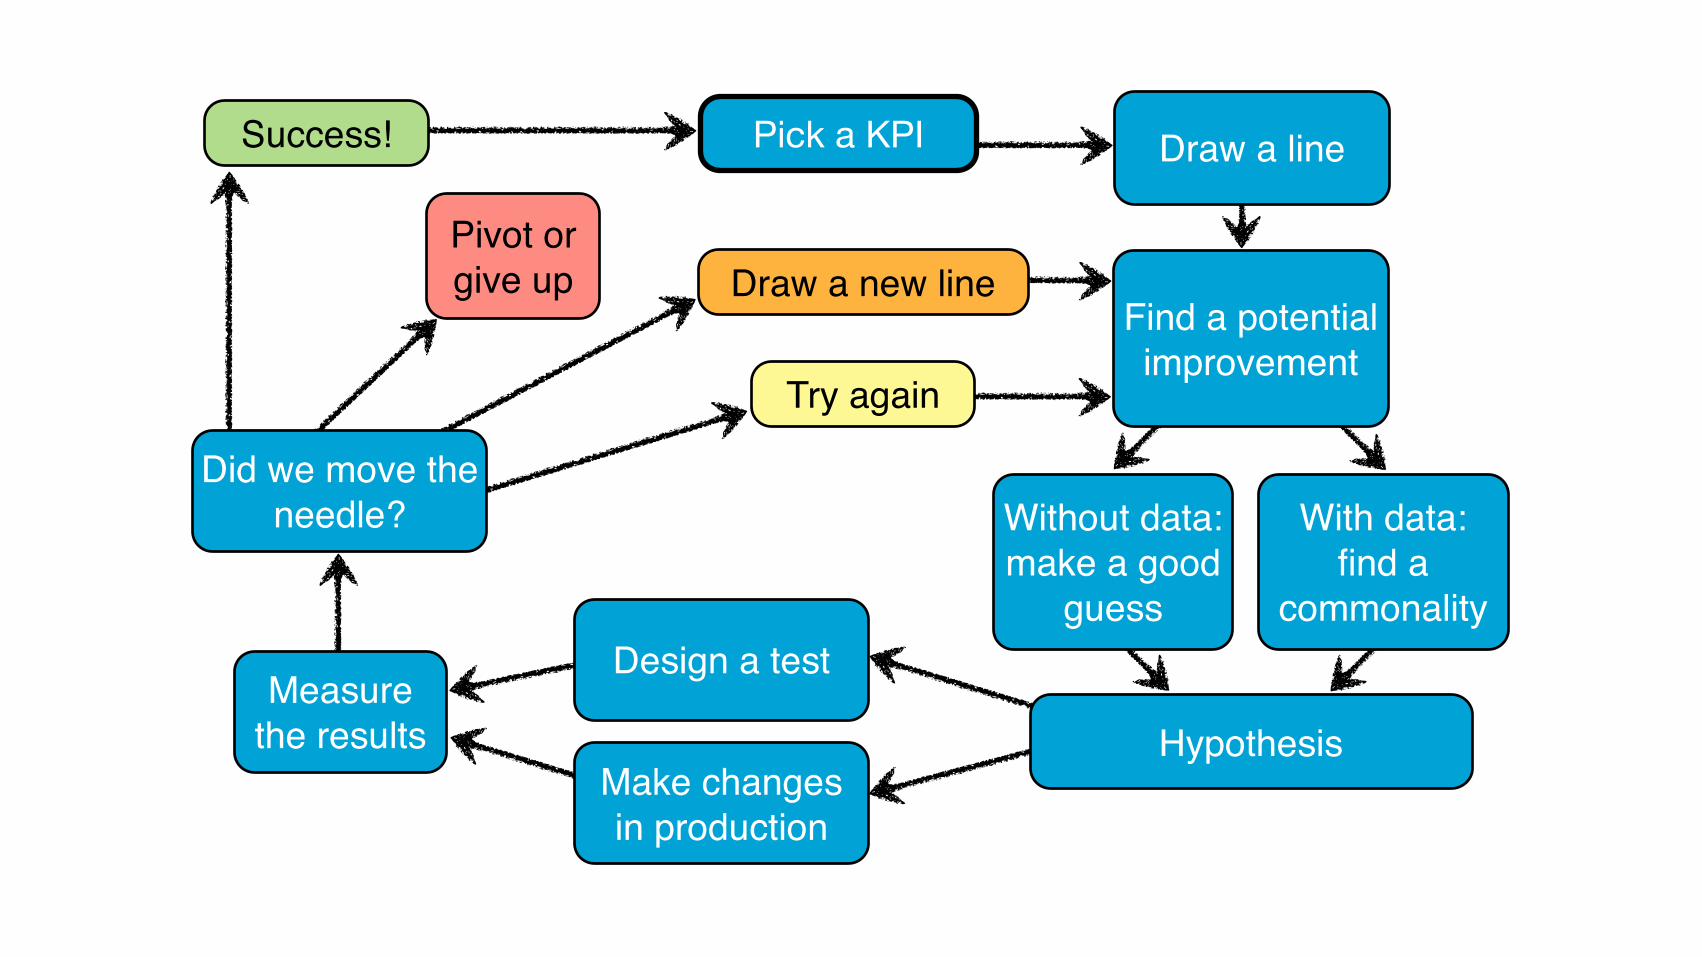
Draw a new linePivot orgive up
Try again
Success!
Did we move the needle?
Measure the results
Make changes in production
Design a test
Hypothesis
With data:find a
commonality
Without data: make a good
guess
Find a potential improvement
Draw a linePick a KPI

Do AirBnB hosts get more business if their property is professionally photographed?
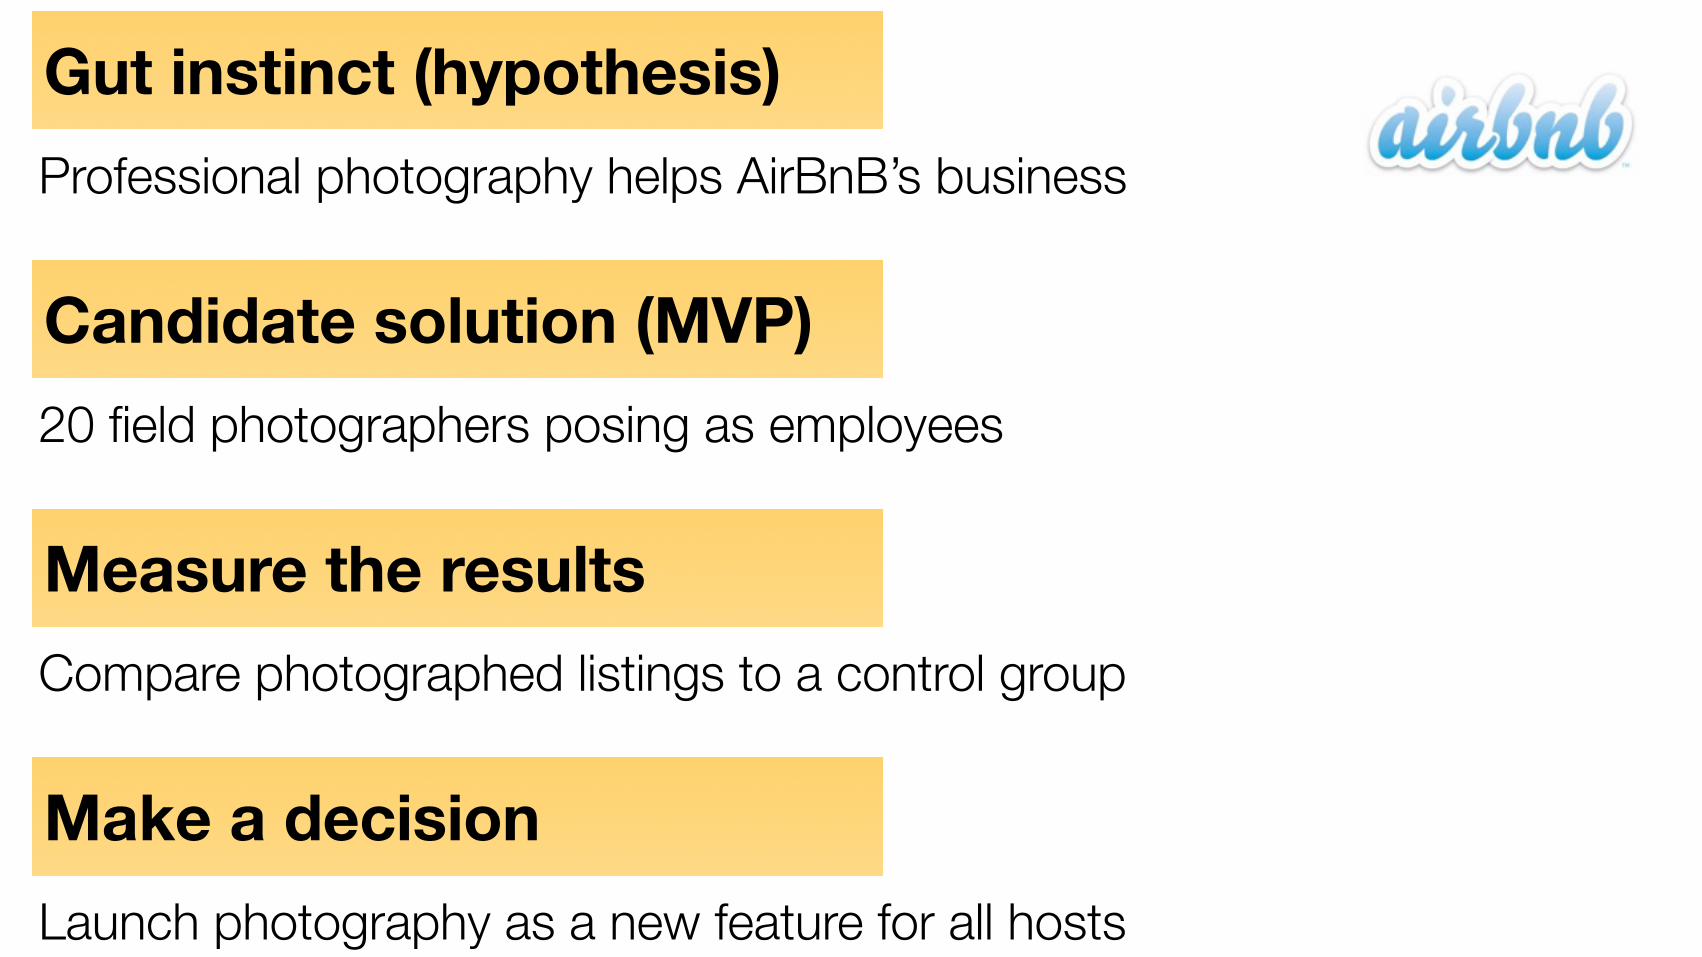
Gut instinct (hypothesis)Professional photography helps AirBnB’s business
Candidate solution (MVP)20 field photographers posing as employees
Measure the resultsCompare photographed listings to a control group
Make a decision Launch photography as a new feature for all hosts

5,000 shoots per month by February 2012

Hang on a second.
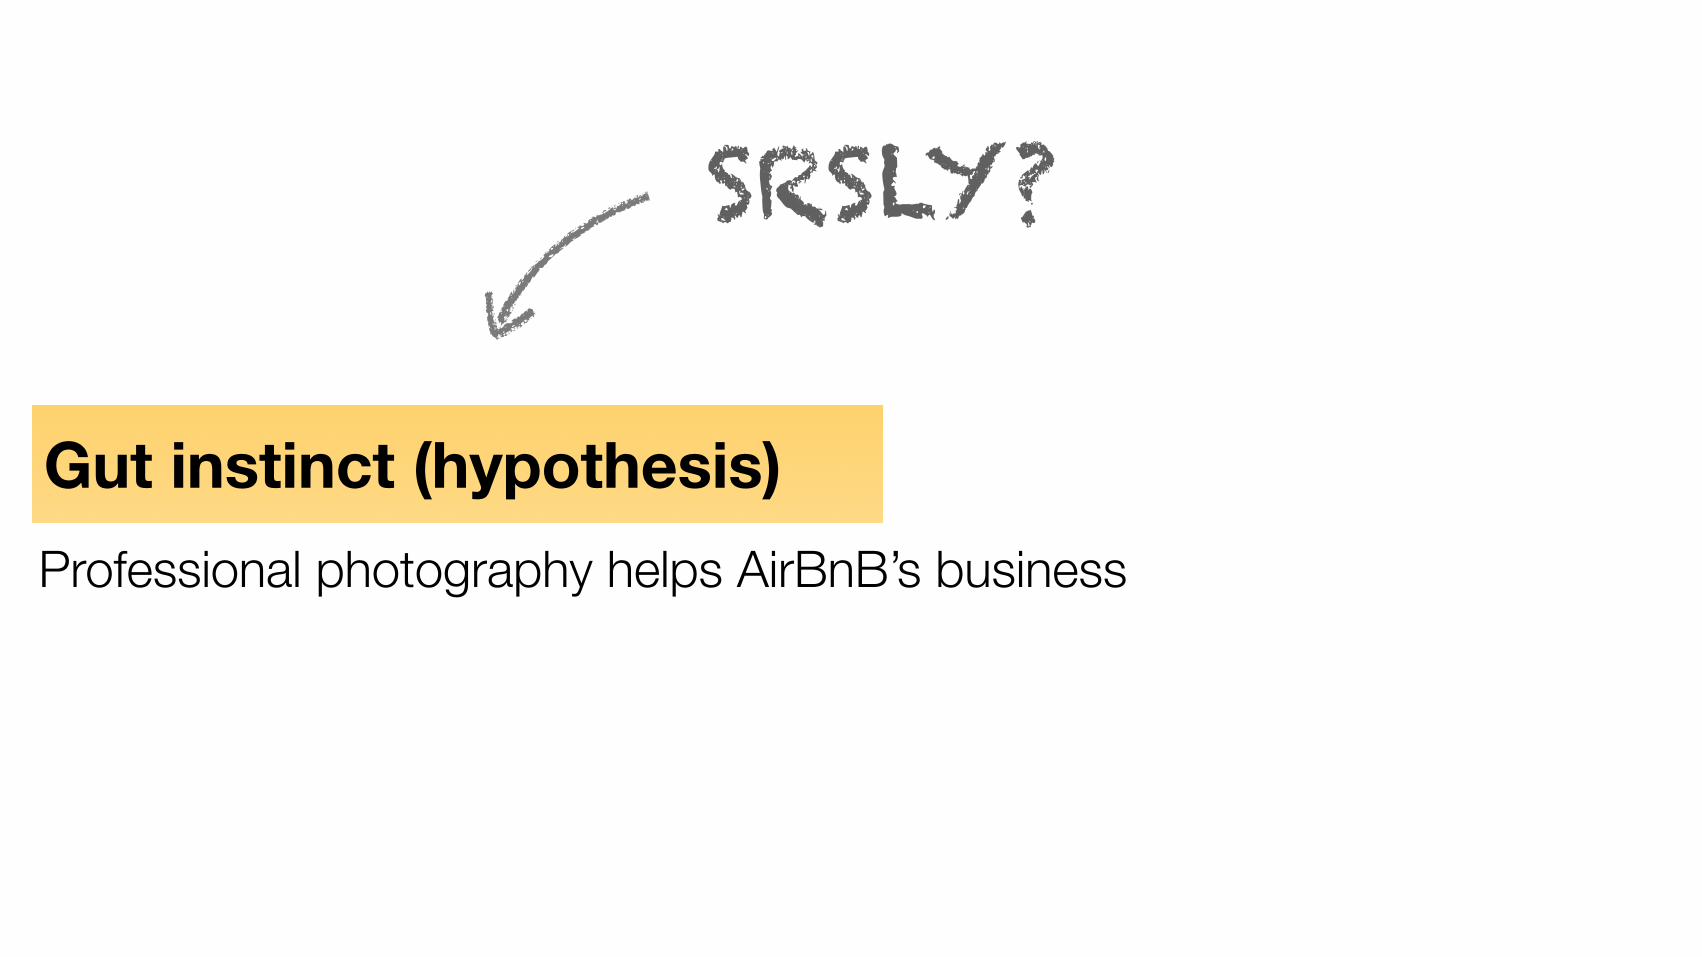
Gut instinct (hypothesis)Professional photography helps AirBnB’s business
SRSLY?
Draw a new linePivot orgive up
Try again
Success!
Did we move the needle?
Measure the results
Make changes in production
Design a test
Hypothesis
With data:find a
commonality
Without data: make a good
guess
Find a potential improvement
Draw a linePick a KPI
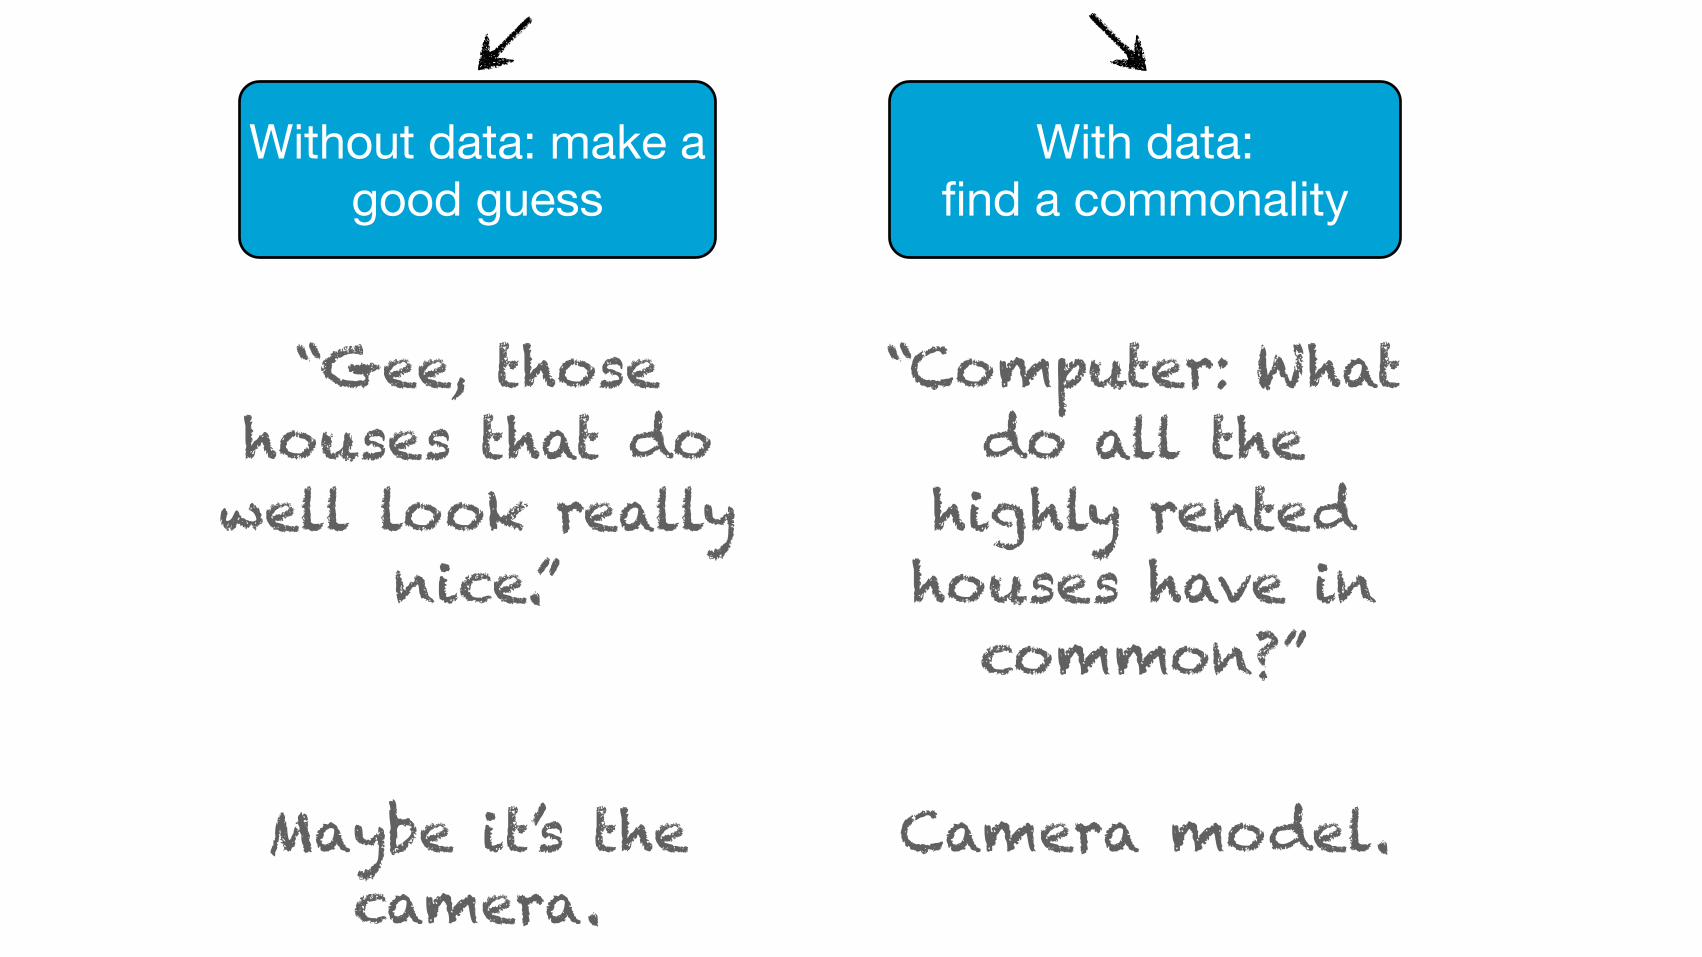
“Gee, those houses that do well look really
nice.”
Maybe it’s the camera.
“Computer: What do all the
highly rented houses have in
common?”
Camera model.
With data:find a commonality
Without data: make a good guess
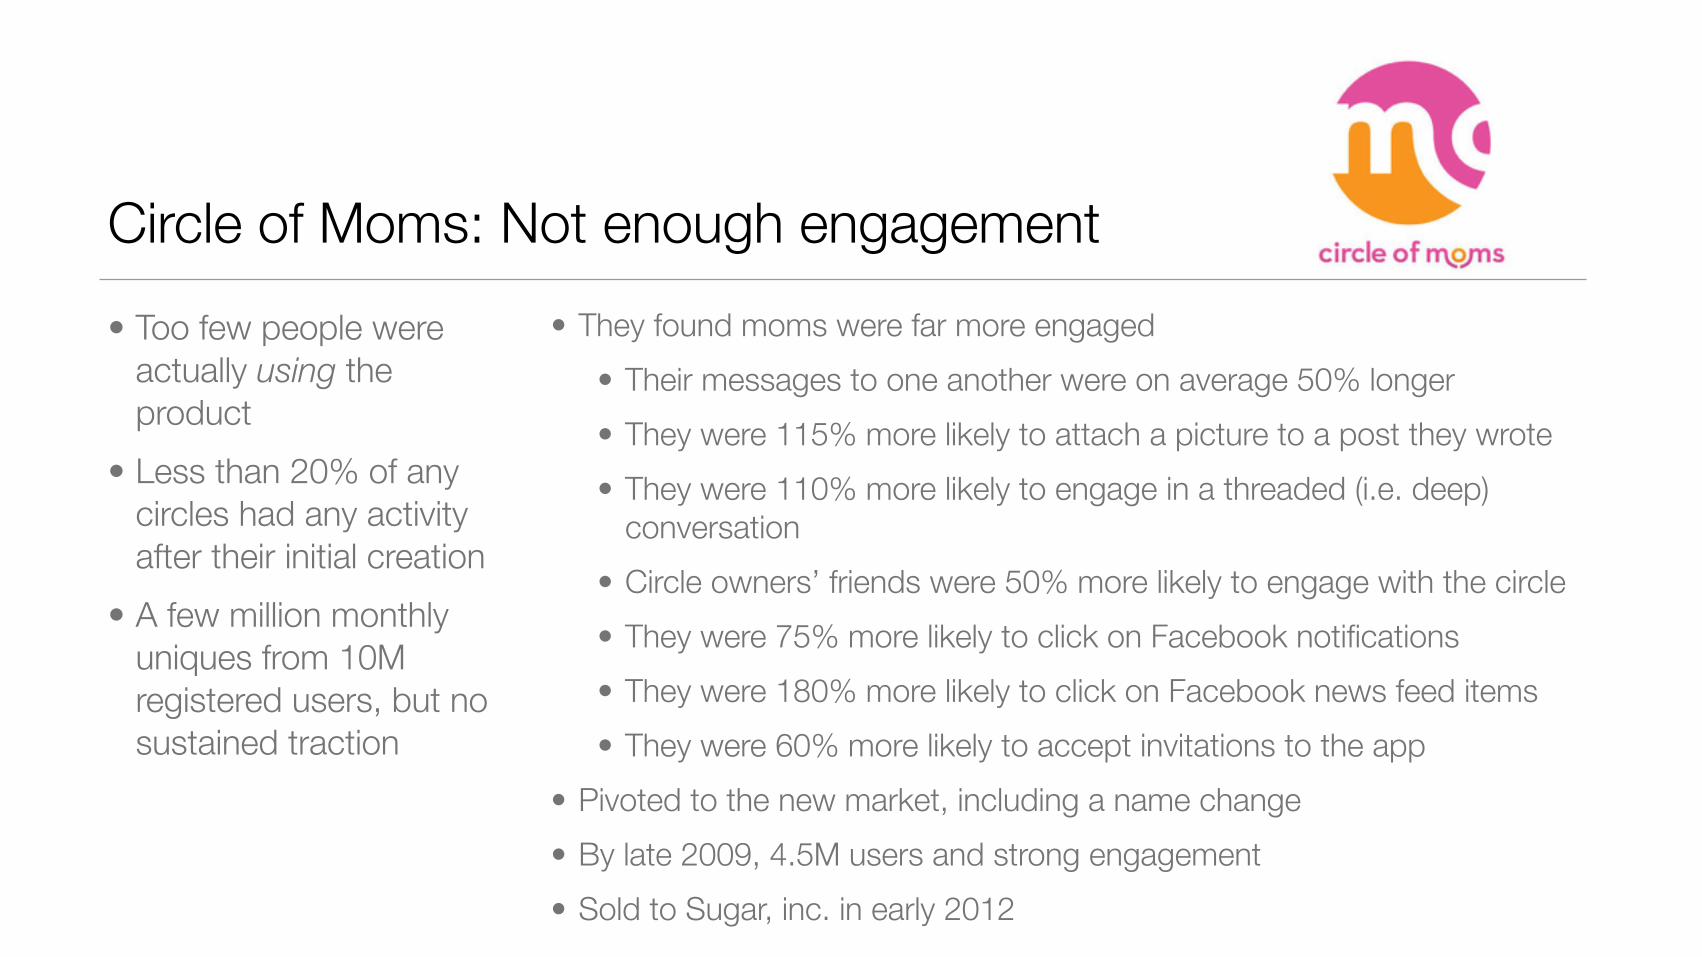
Circle of Moms: Not enough engagement• Too few people were
actually using the product
• Less than 20% of any circles had any activity after their initial creation
• A few million monthly uniques from 10M registered users, but no sustained traction
• They found moms were far more engaged • Their messages to one another were on average 50% longer • They were 115% more likely to attach a picture to a post they wrote • They were 110% more likely to engage in a threaded (i.e. deep)
conversation • Circle owners’ friends were 50% more likely to engage with the circle • They were 75% more likely to click on Facebook notifications • They were 180% more likely to click on Facebook news feed items • They were 60% more likely to accept invitations to the app
• Pivoted to the new market, including a name change • By late 2009, 4.5M users and strong engagement • Sold to Sugar, inc. in early 2012
Landing page design A/B testing
Cohort analysis General analytics
URL shortening
Funnel analytics
Influencer Marketing
Publisher analytics
SaaS analytics
Gaming analytics
User interaction Customer satisfaction KPI dashboardsUser segmentation
User analytics Spying on users

Consider a media company
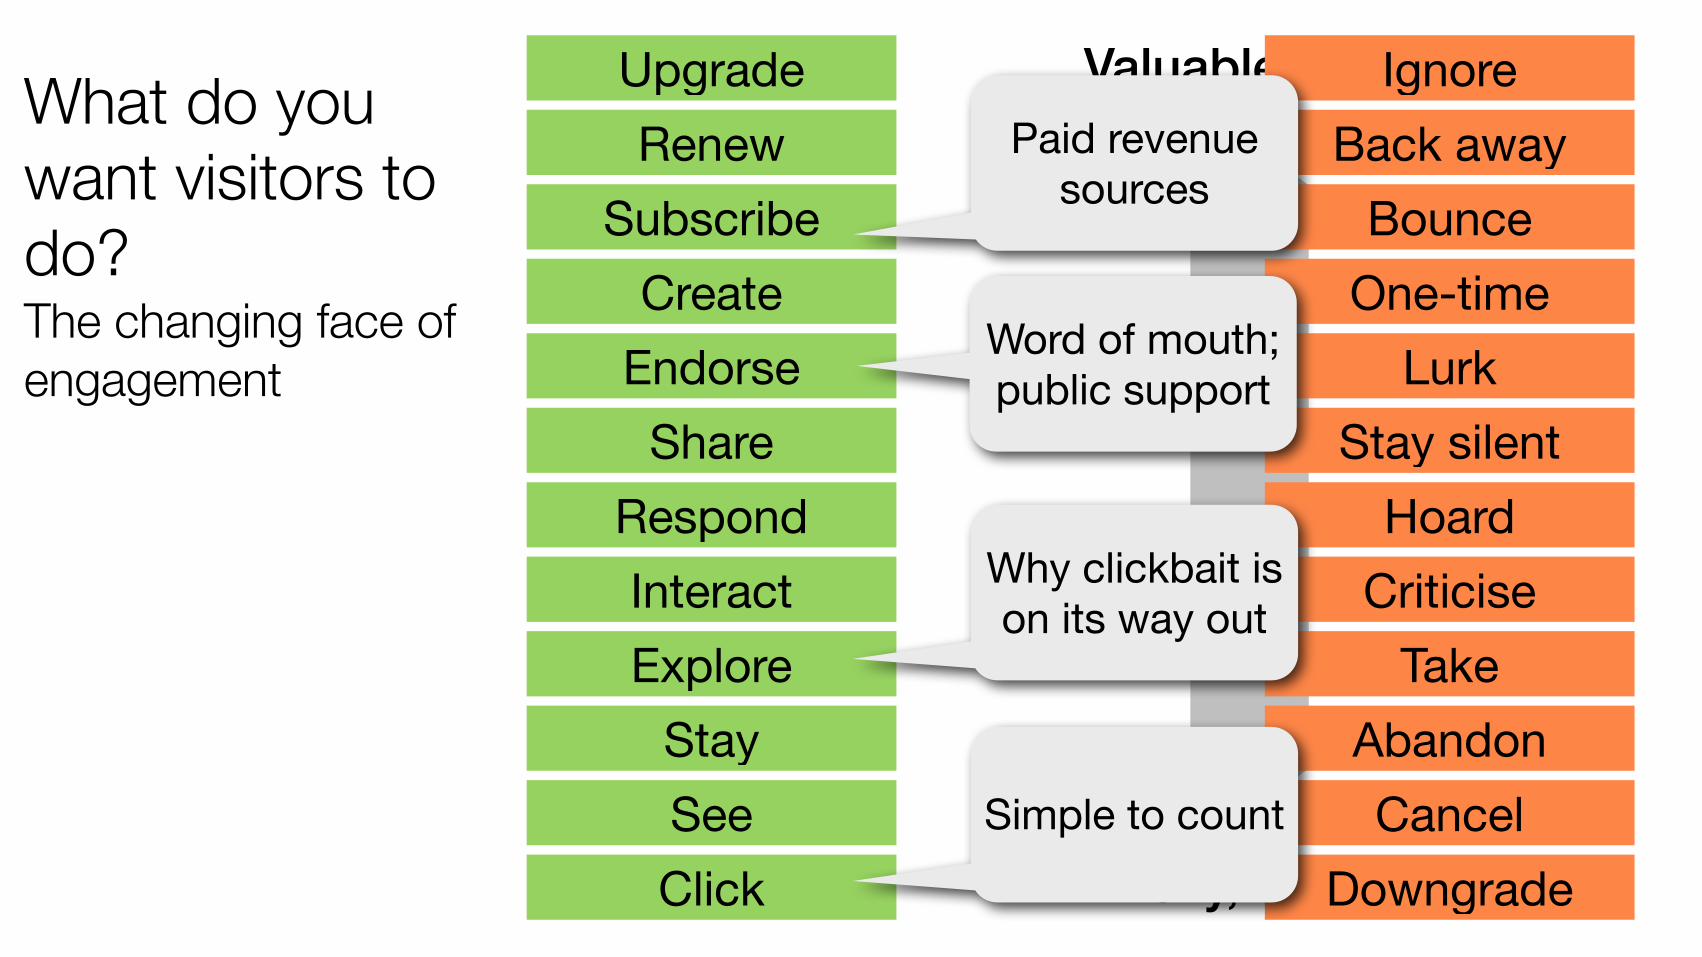
Valuable, hard
Icky, easy
What do you want visitors to do? The changing face of engagement
IgnoreBack away
BounceOne-time
LurkStay silent
HoardCriticise
TakeAbandonCancel
DowngradeClickSeeStay
ExploreInteract
RespondShare
EndorseCreate
SubscribeRenew
Upgrade
Why clickbait is on its way out
Word of mouth; public support
Paid revenue sources
Simple to count
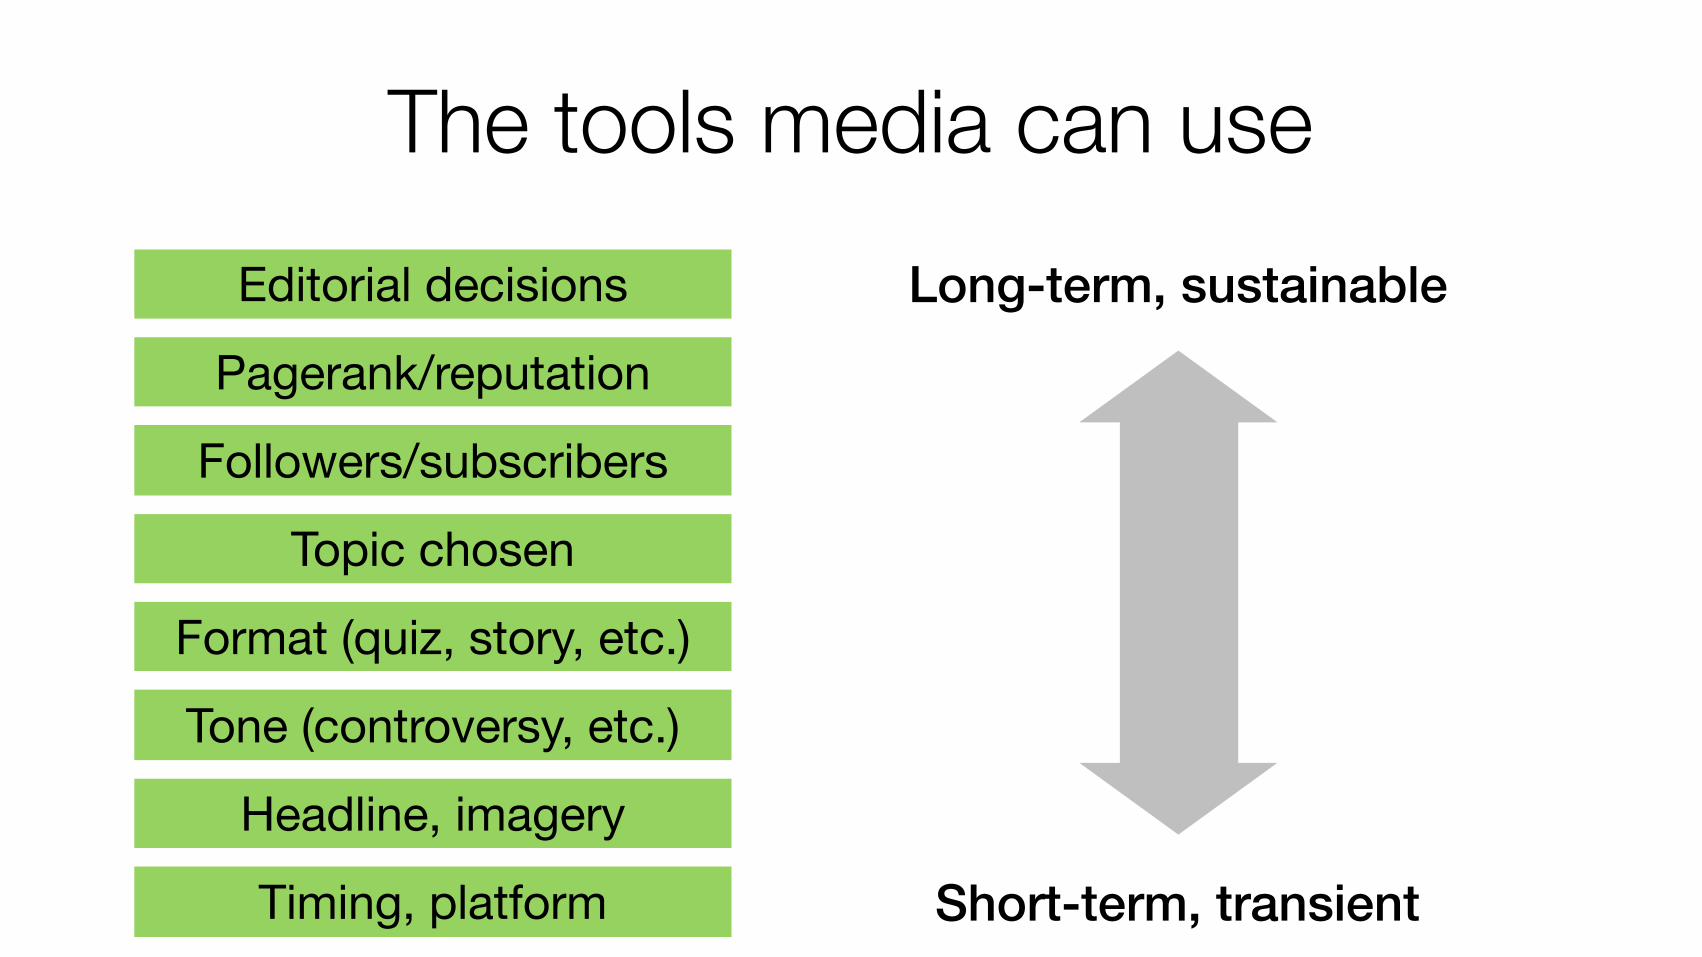
The tools media can useEditorial decisions
Pagerank/reputation
Followers/subscribers
Topic chosen
Format (quiz, story, etc.)
Tone (controversy, etc.)
Headline, imagery
Timing, platform
Long-term, sustainable
Short-term, transient
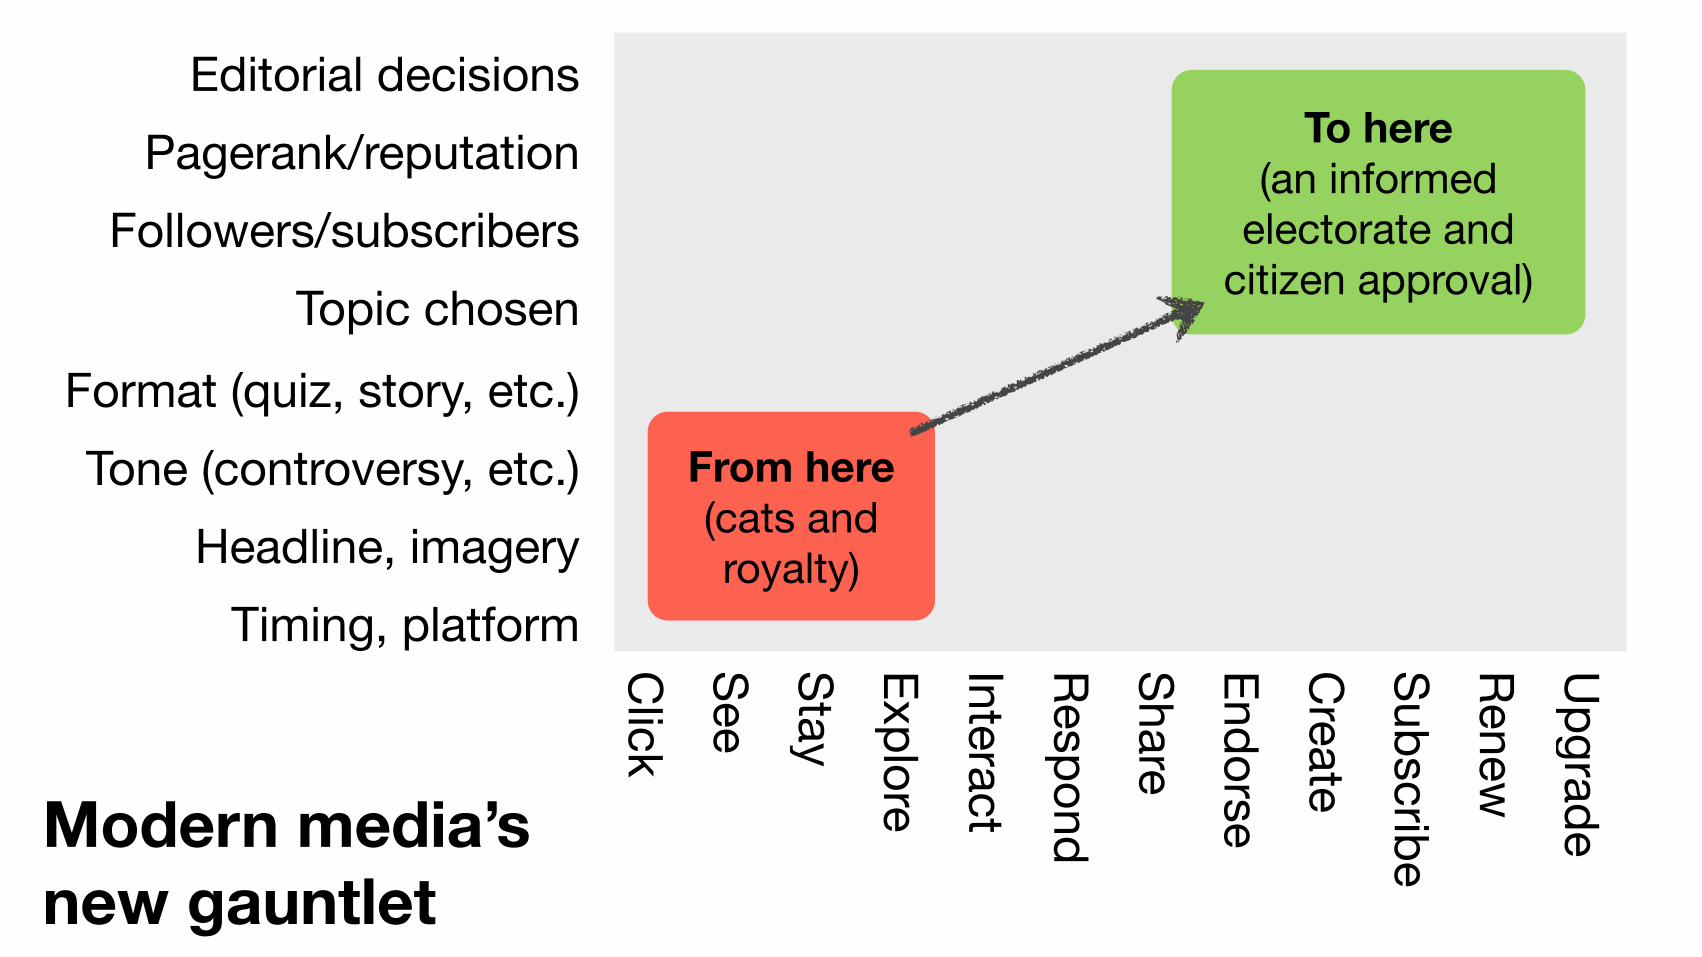
Modern media’s new gauntlet
Click
SeeStayExploreInteractRespondShareEndorseC
reateSubscribeRenewU
pgradeEditorial decisions
Pagerank/reputationFollowers/subscribers
Topic chosenFormat (quiz, story, etc.)Tone (controversy, etc.)
Headline, imageryTiming, platform
From here (cats and royalty)
To here(an informed
electorate and citizen approval)

Some non-tech examples.

I lied. Everyone is a tech company.
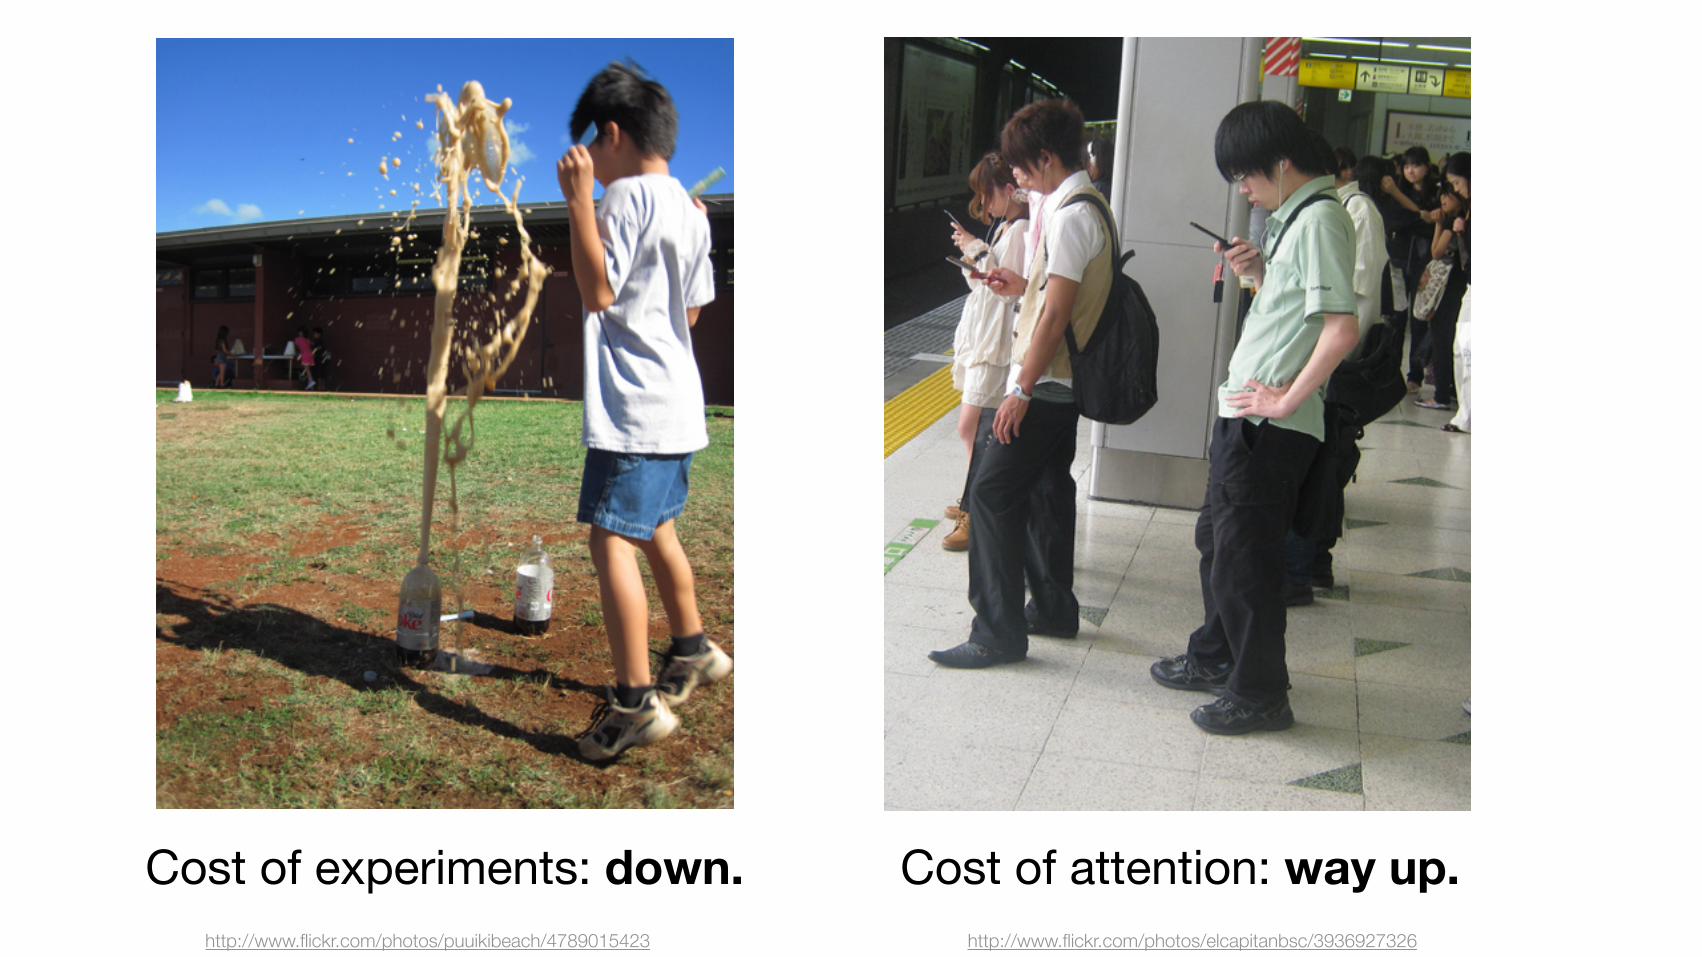
http://www.flickr.com/photos/puuikibeach/4789015423 http://www.flickr.com/photos/elcapitanbsc/3936927326
Cost of experiments: down. Cost of attention: way up.

Let’s pick on restaurants for a while.
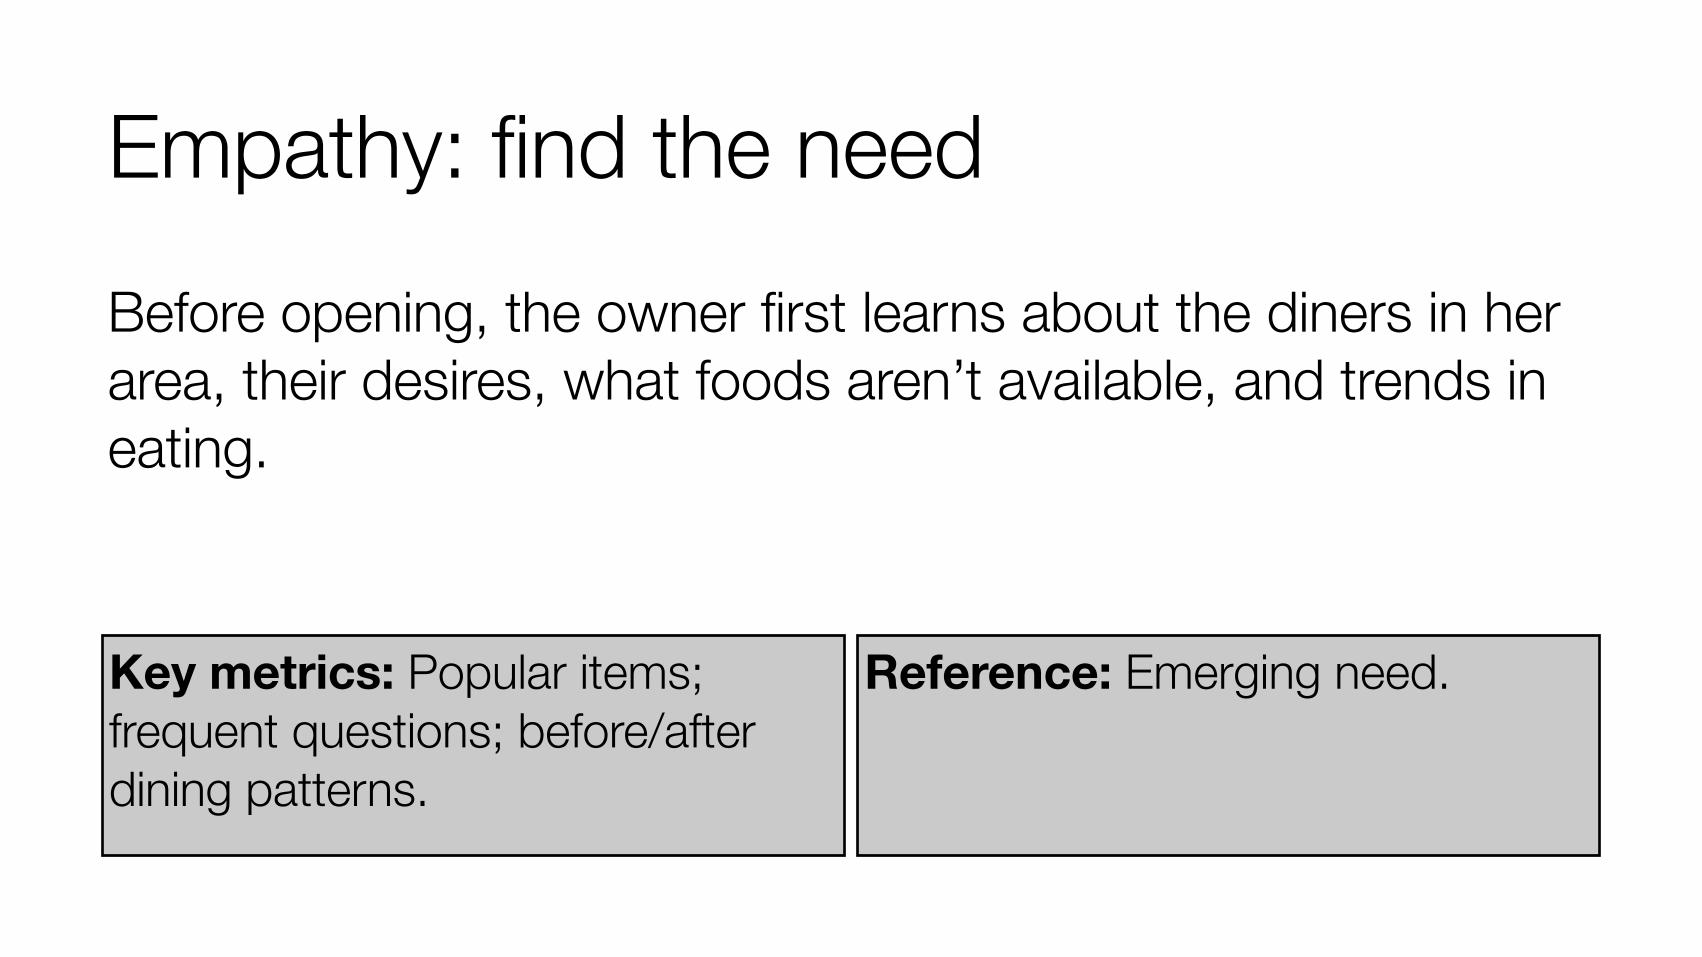
Before opening, the owner first learns about the diners in her area, their desires, what foods aren’t available, and trends in eating.
Empathy: find the need
Key metrics: Popular items; frequent questions; before/after dining patterns.
Reference: Emerging need.
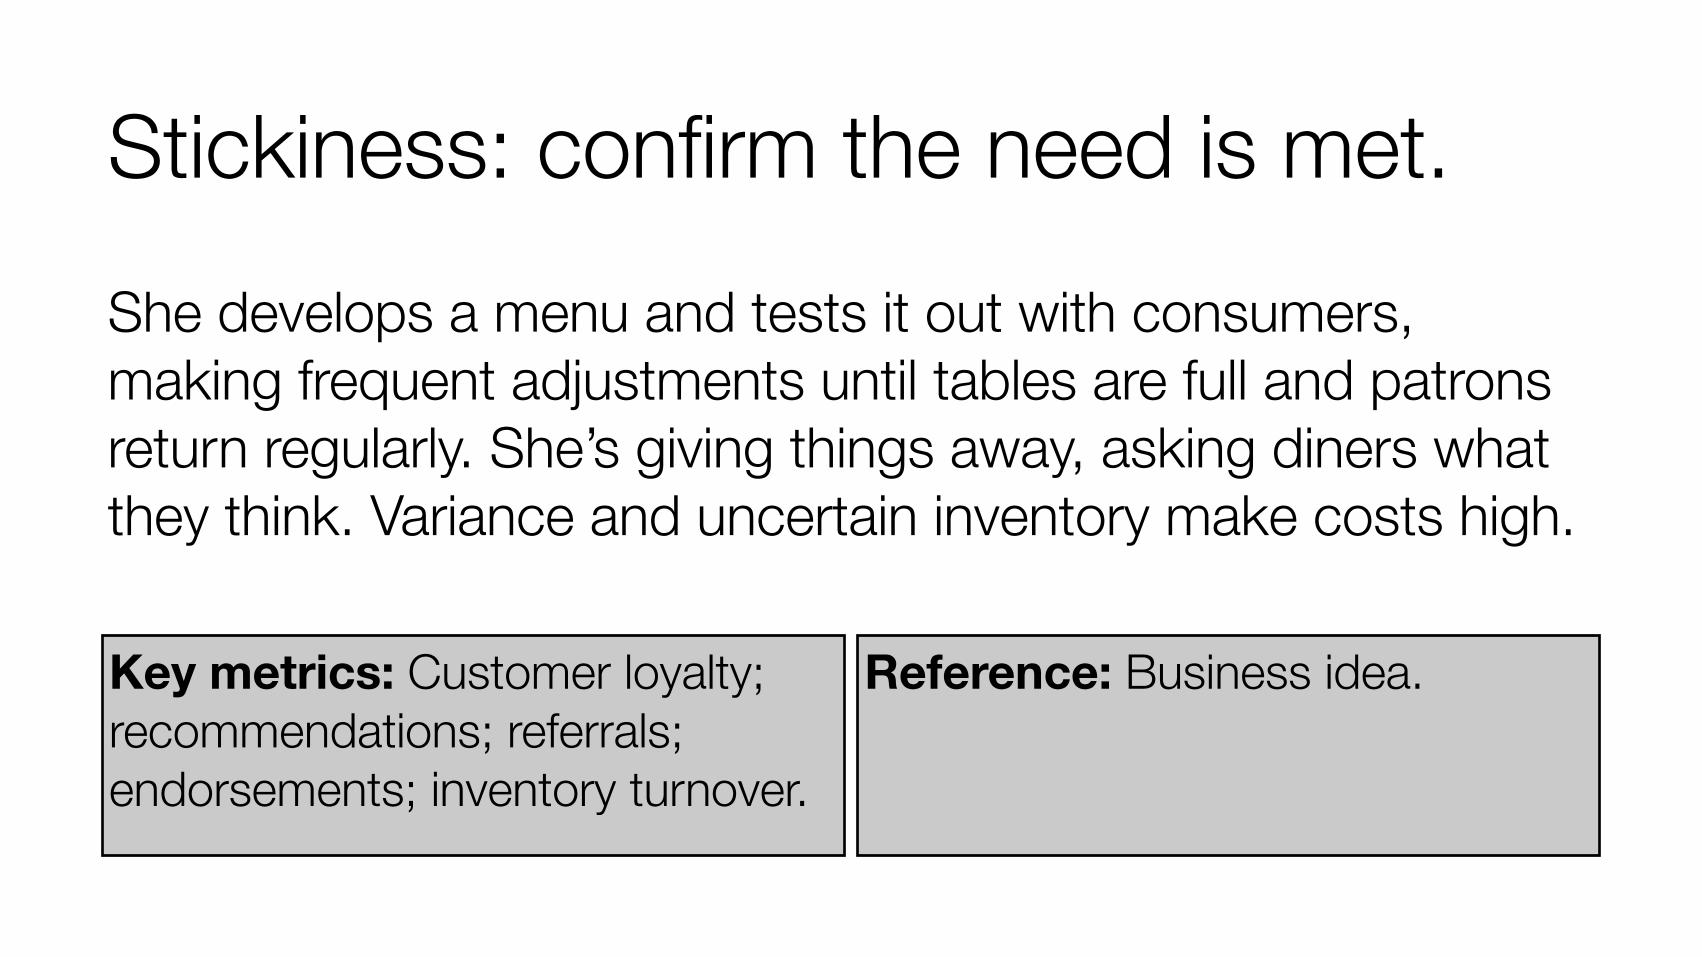
She develops a menu and tests it out with consumers, making frequent adjustments until tables are full and patrons return regularly. She’s giving things away, asking diners what they think. Variance and uncertain inventory make costs high.
Stickiness: confirm the need is met.
Key metrics: Customer loyalty; recommendations; referrals; endorsements; inventory turnover.
Reference: Business idea.
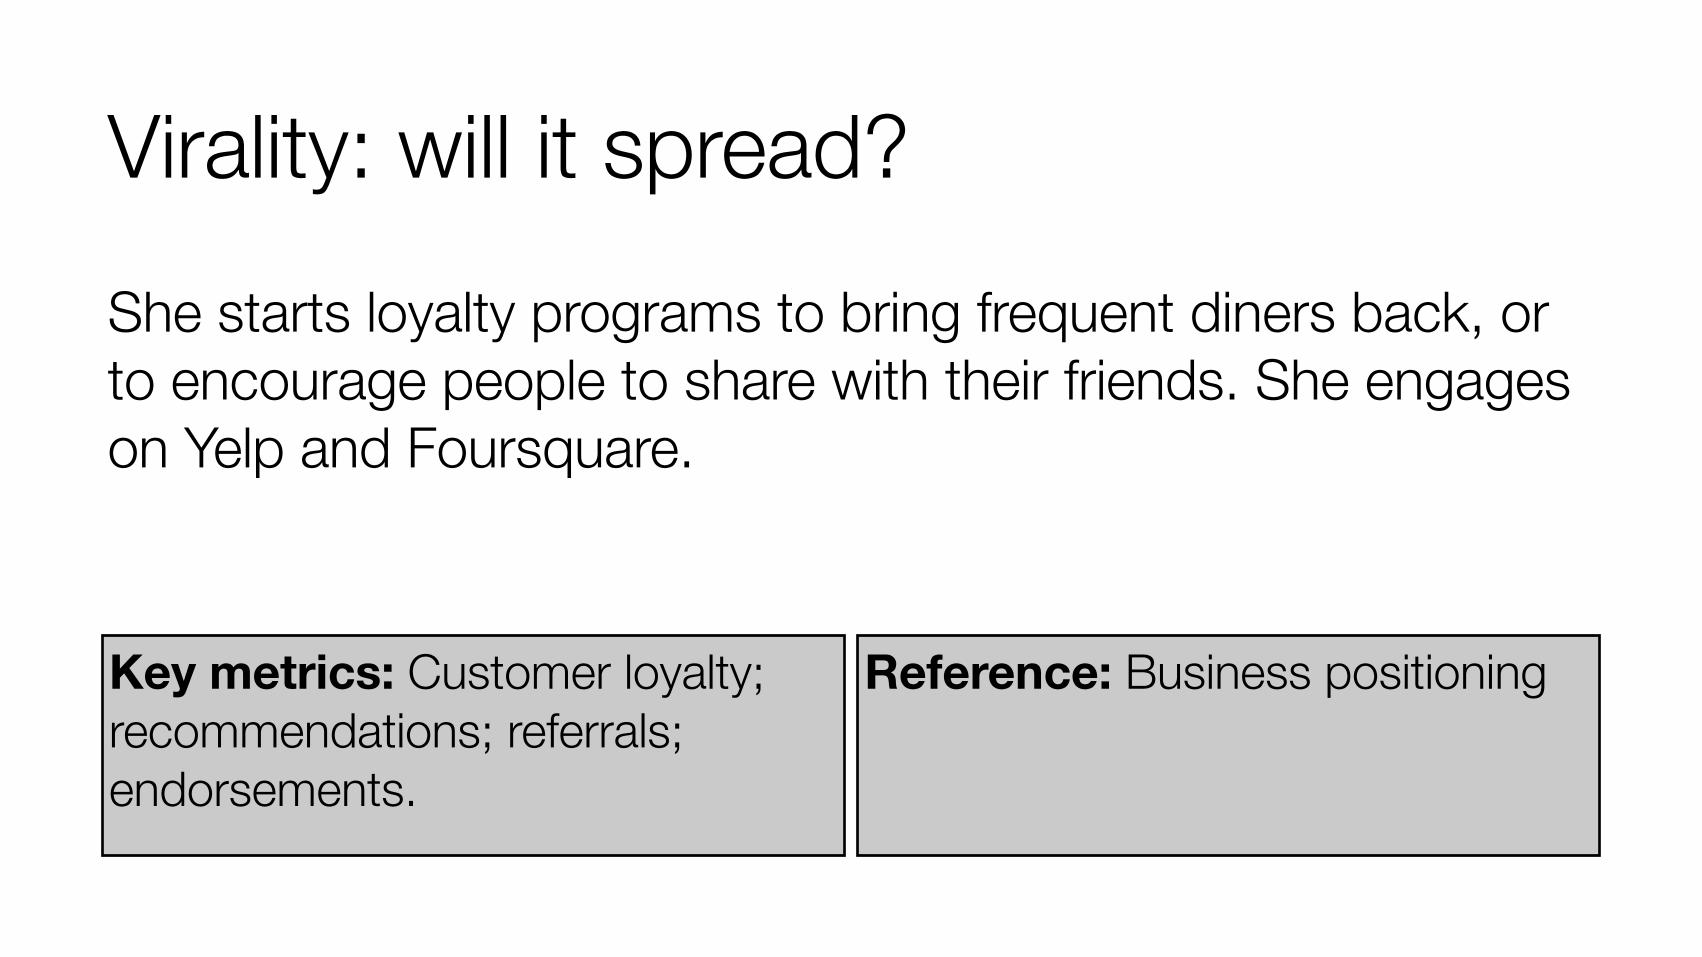
She starts loyalty programs to bring frequent diners back, or to encourage people to share with their friends. She engages on Yelp and Foursquare.
Virality: will it spread?
Key metrics: Customer loyalty; recommendations; referrals; endorsements.
Reference: Business positioning
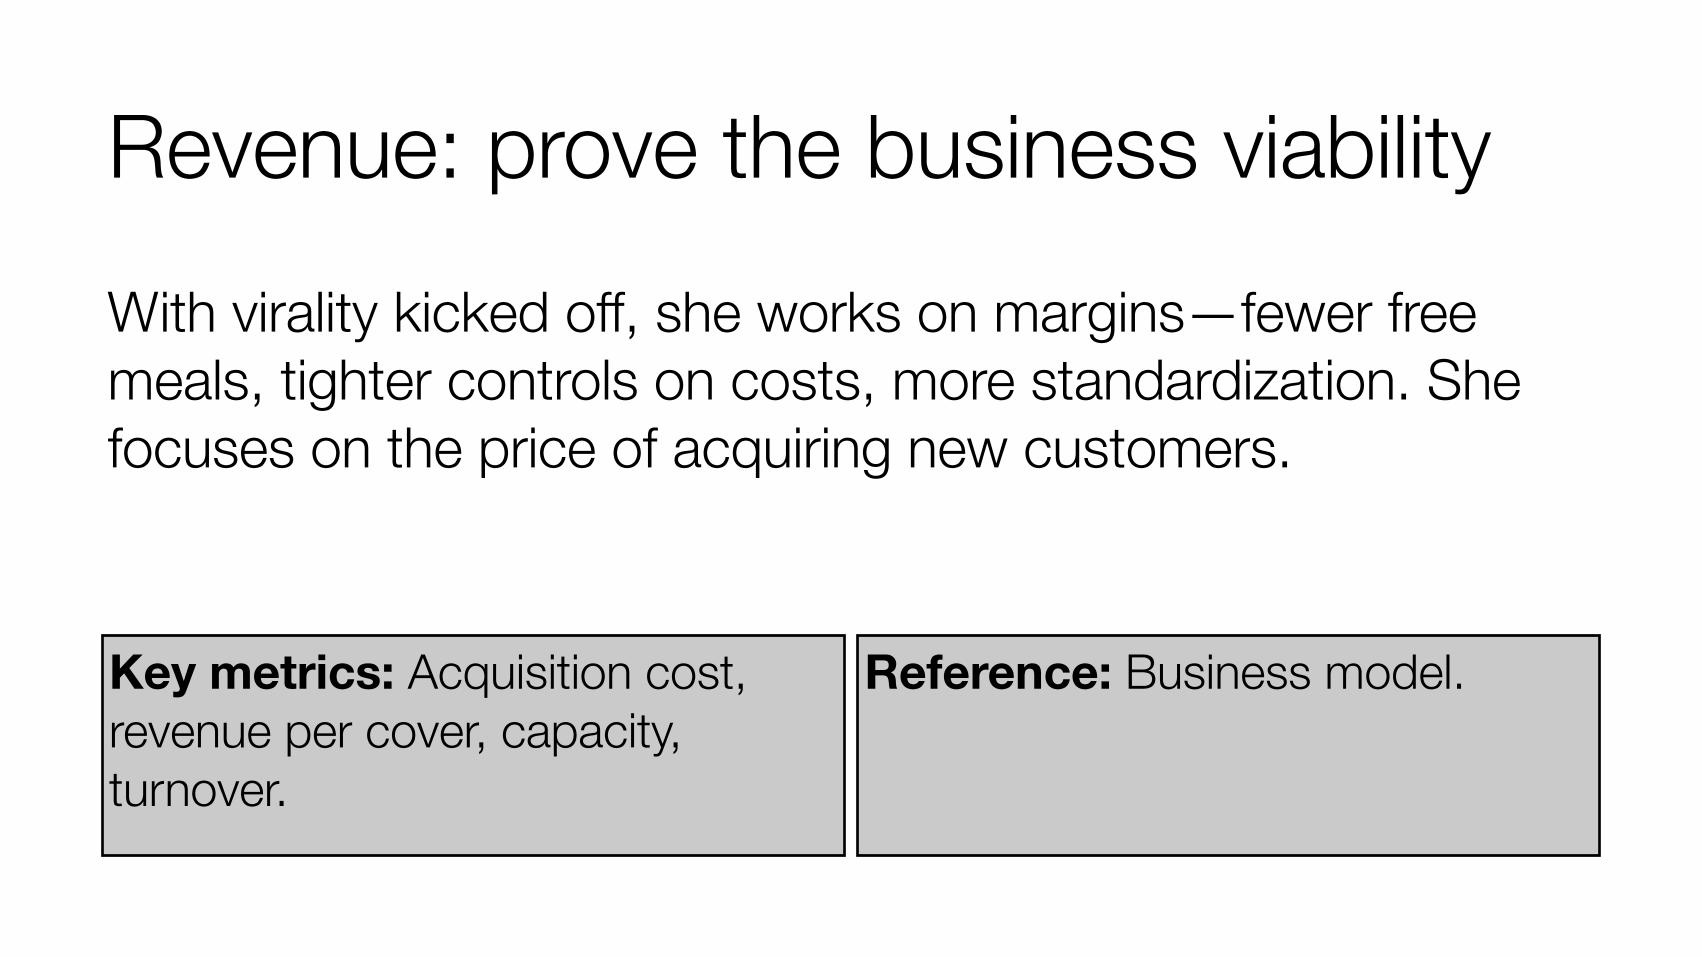
With virality kicked off, she works on margins—fewer free meals, tighter controls on costs, more standardization. She focuses on the price of acquiring new customers.
Revenue: prove the business viability
Key metrics: Acquisition cost, revenue per cover, capacity, turnover.
Reference: Business model.
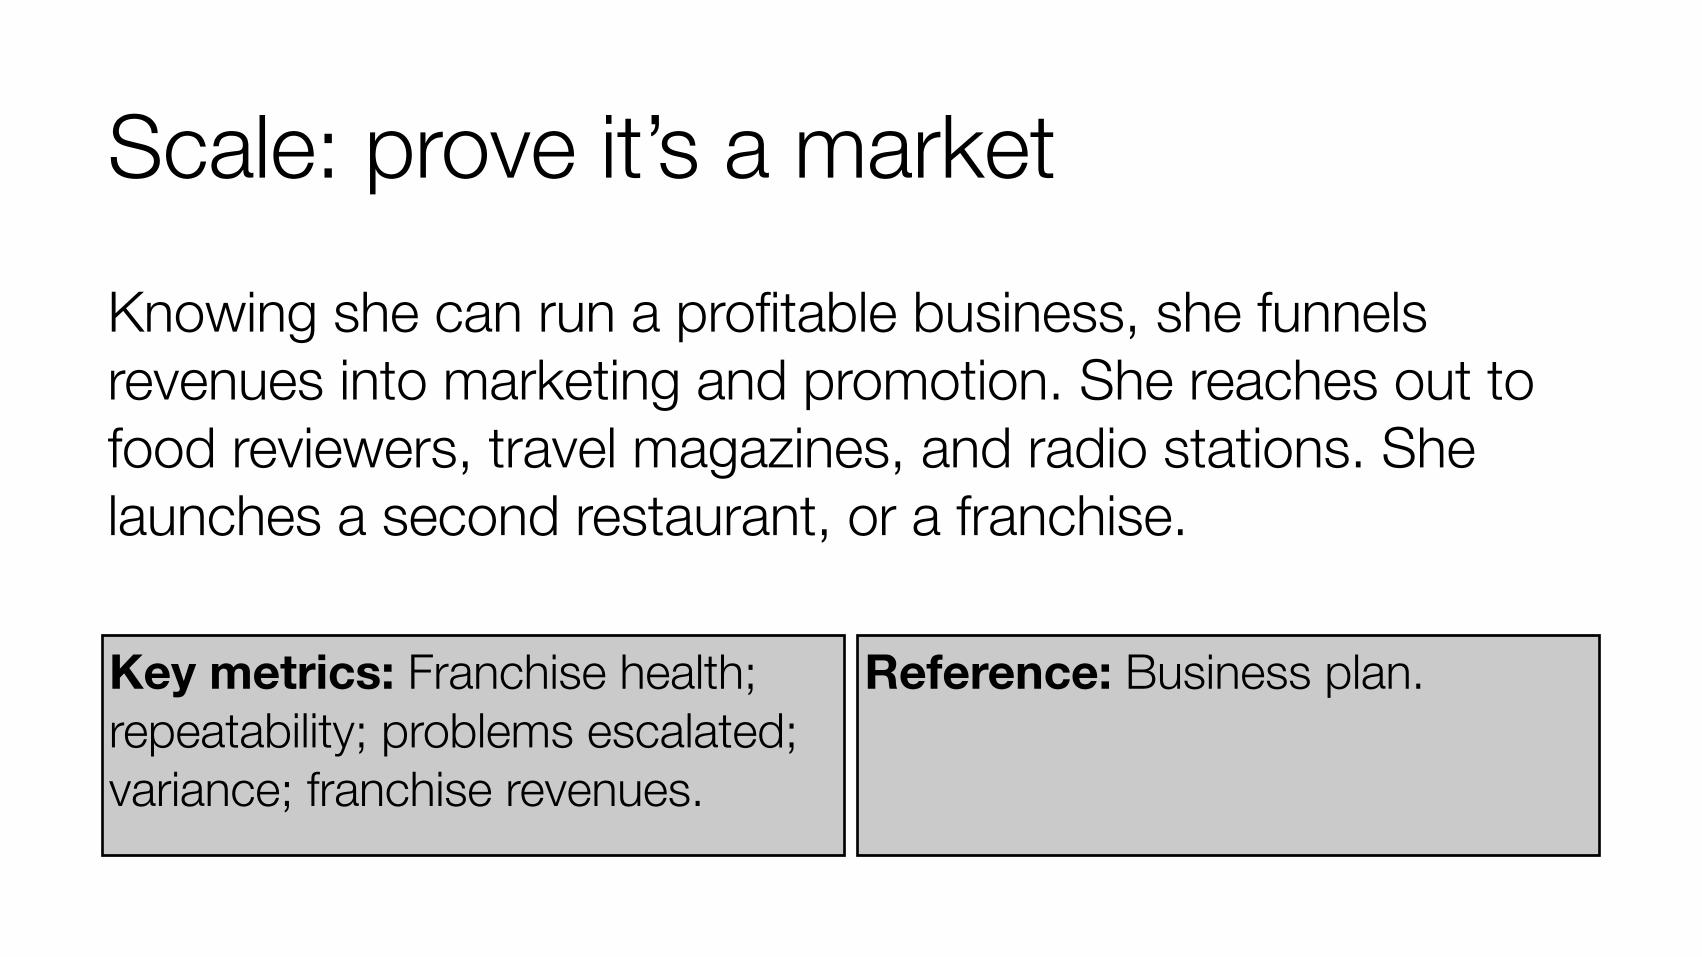
Knowing she can run a profitable business, she funnels revenues into marketing and promotion. She reaches out to food reviewers, travel magazines, and radio stations. She launches a second restaurant, or a franchise.
Scale: prove it’s a market
Key metrics: Franchise health; repeatability; problems escalated; variance; franchise revenues.
Reference: Business plan.
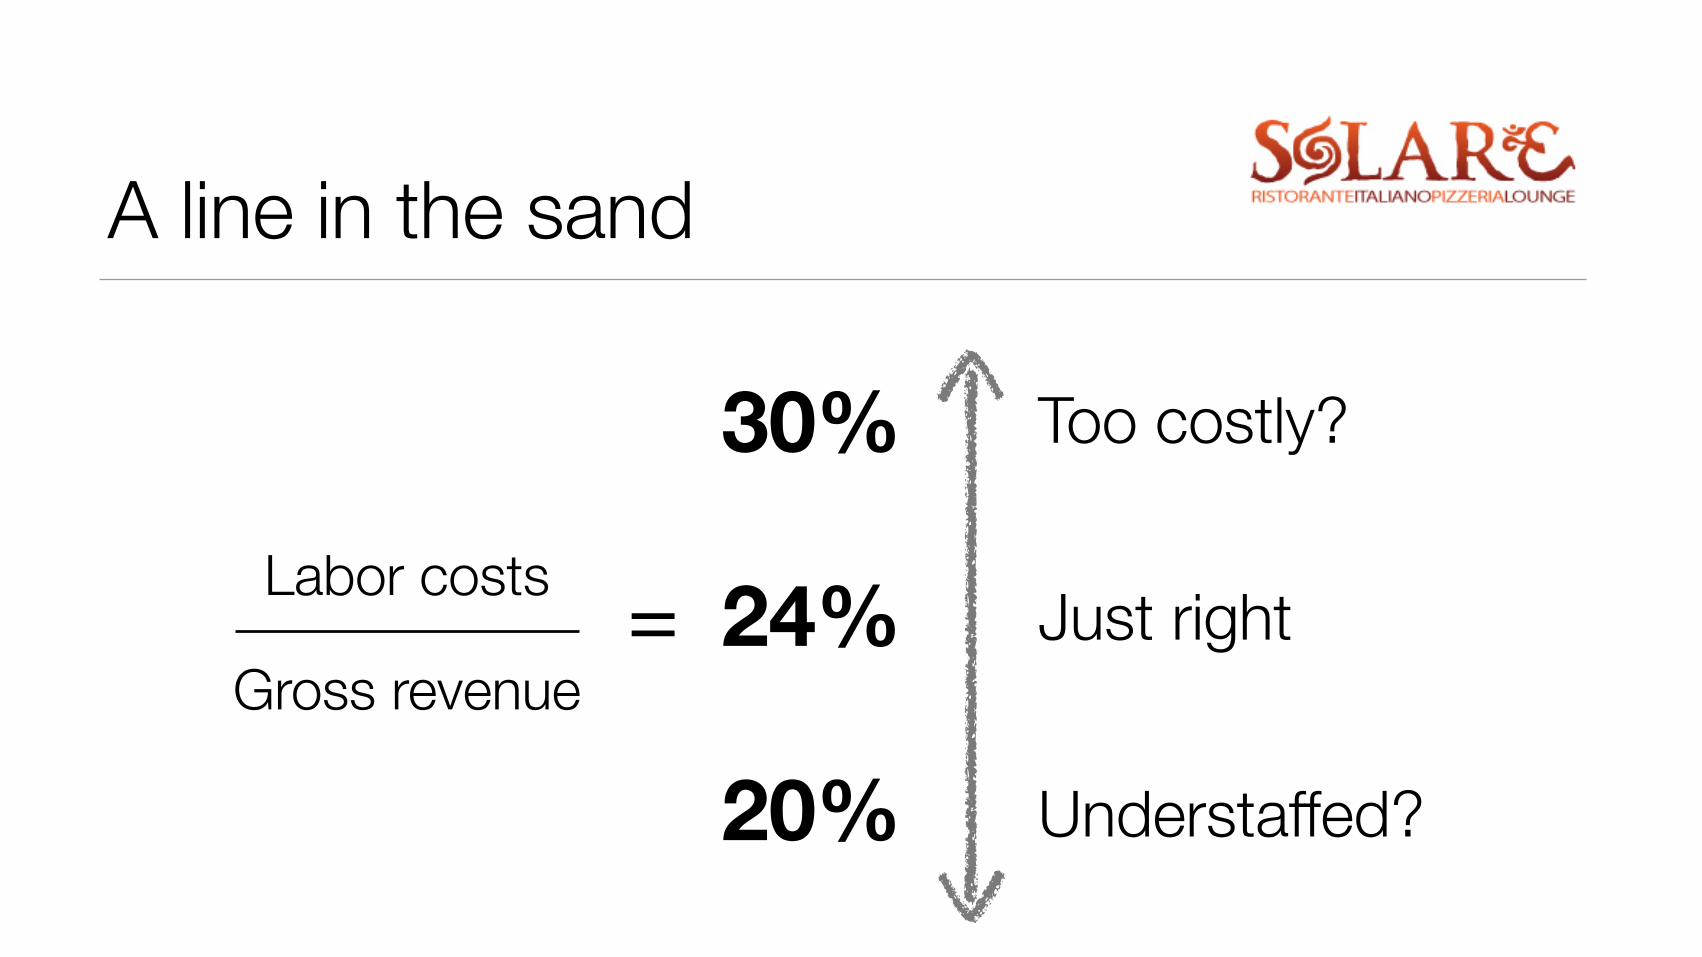
A line in the sand
Labor costs
Gross revenue
30%
24%
20%
Too costly?
Just right
Understaffed?
=

A leading indicator
http://www.flickr.com/photos/avlxyz/4889656453http://www.flickr.com/photos/mysticcountry/3567440970
50 reservationsat 5PM
250 coversthat night
(Varies by restaurant. McDonalds ≠ Fat Duck.)
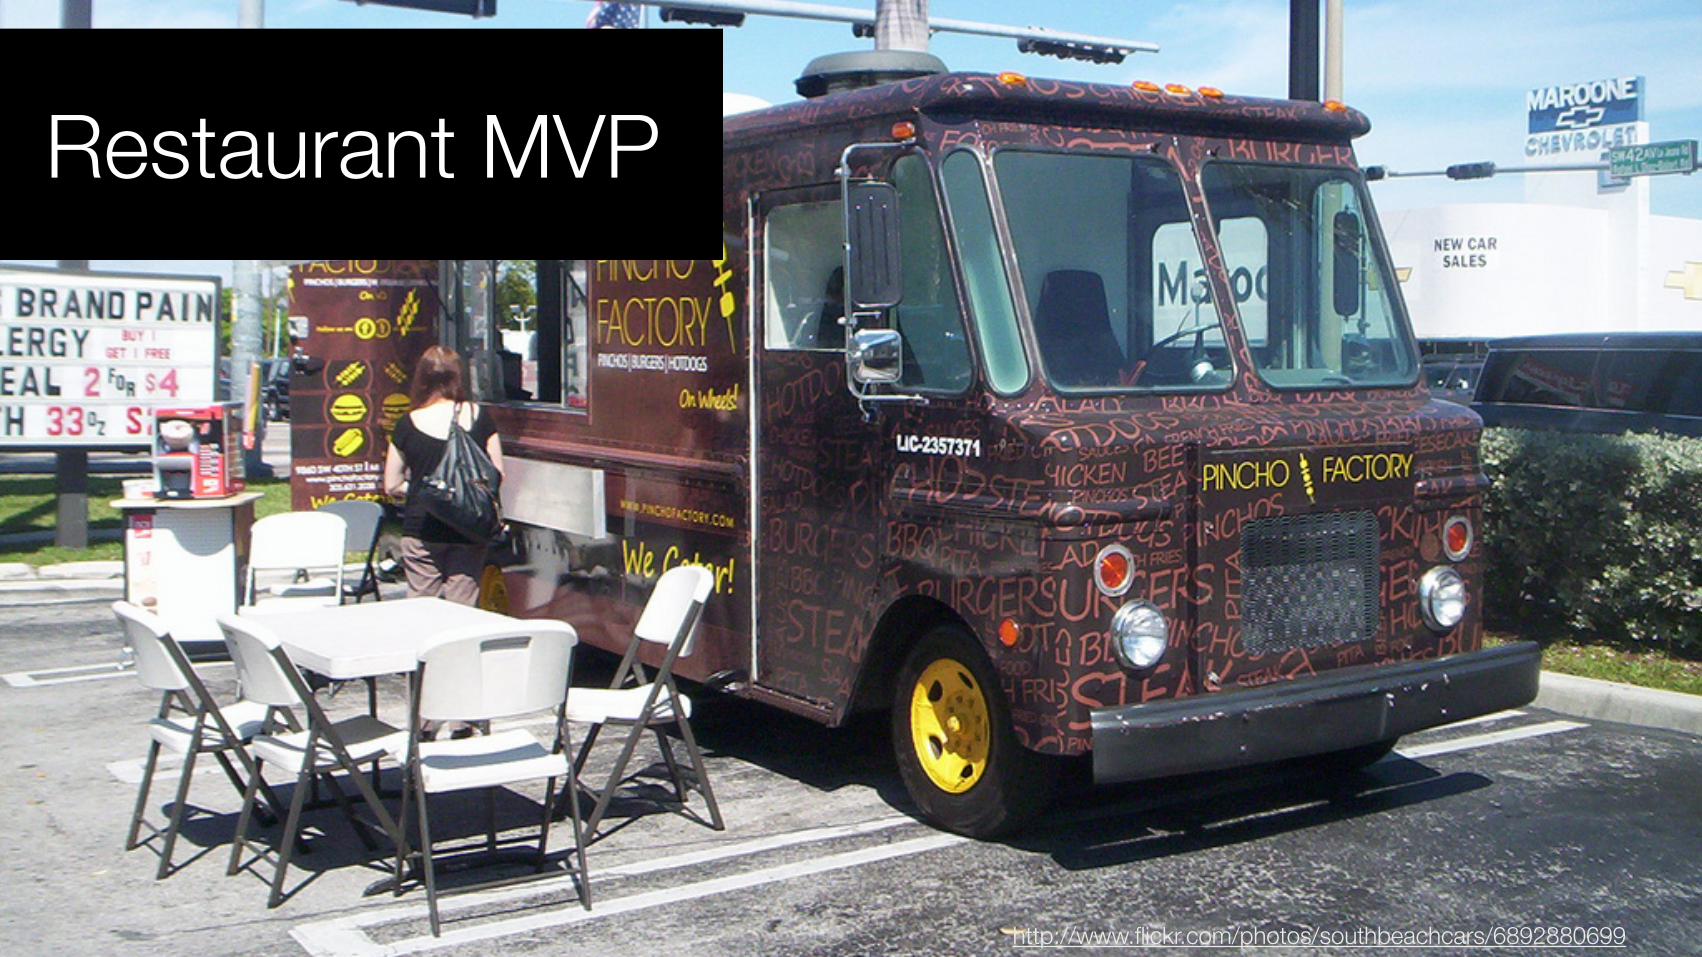
http://www.flickr.com/photos/southbeachcars/6892880699
Restaurant MVP
Is tip amount a leading indicator of long-term revenue?

Why does every table get the same menu?
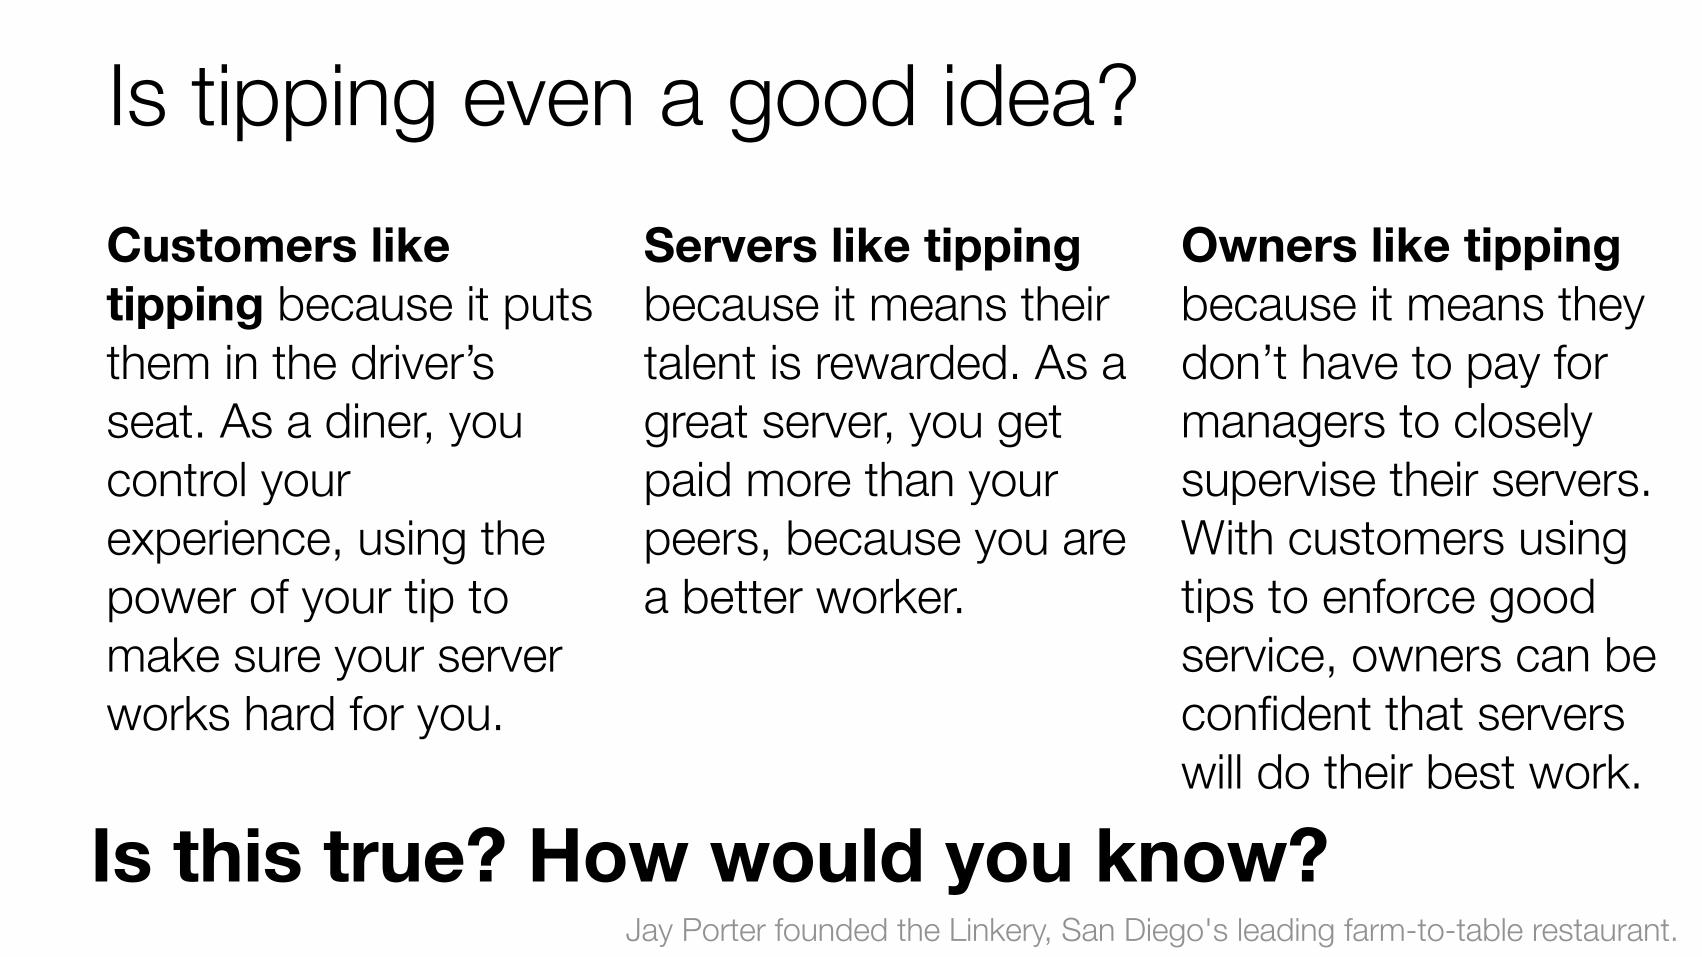
Is tipping even a good idea?Customers like tipping because it puts them in the driver’s seat. As a diner, you control your experience, using the power of your tip to make sure your server works hard for you.
Servers like tipping because it means their talent is rewarded. As a great server, you get paid more than your peers, because you are a better worker.
Owners like tipping because it means they don’t have to pay for managers to closely supervise their servers. With customers using tips to enforce good service, owners can be confident that servers will do their best work.
Is this true? How would you know?Jay Porter founded the Linkery, San Diego's leading farm-to-table restaurant.
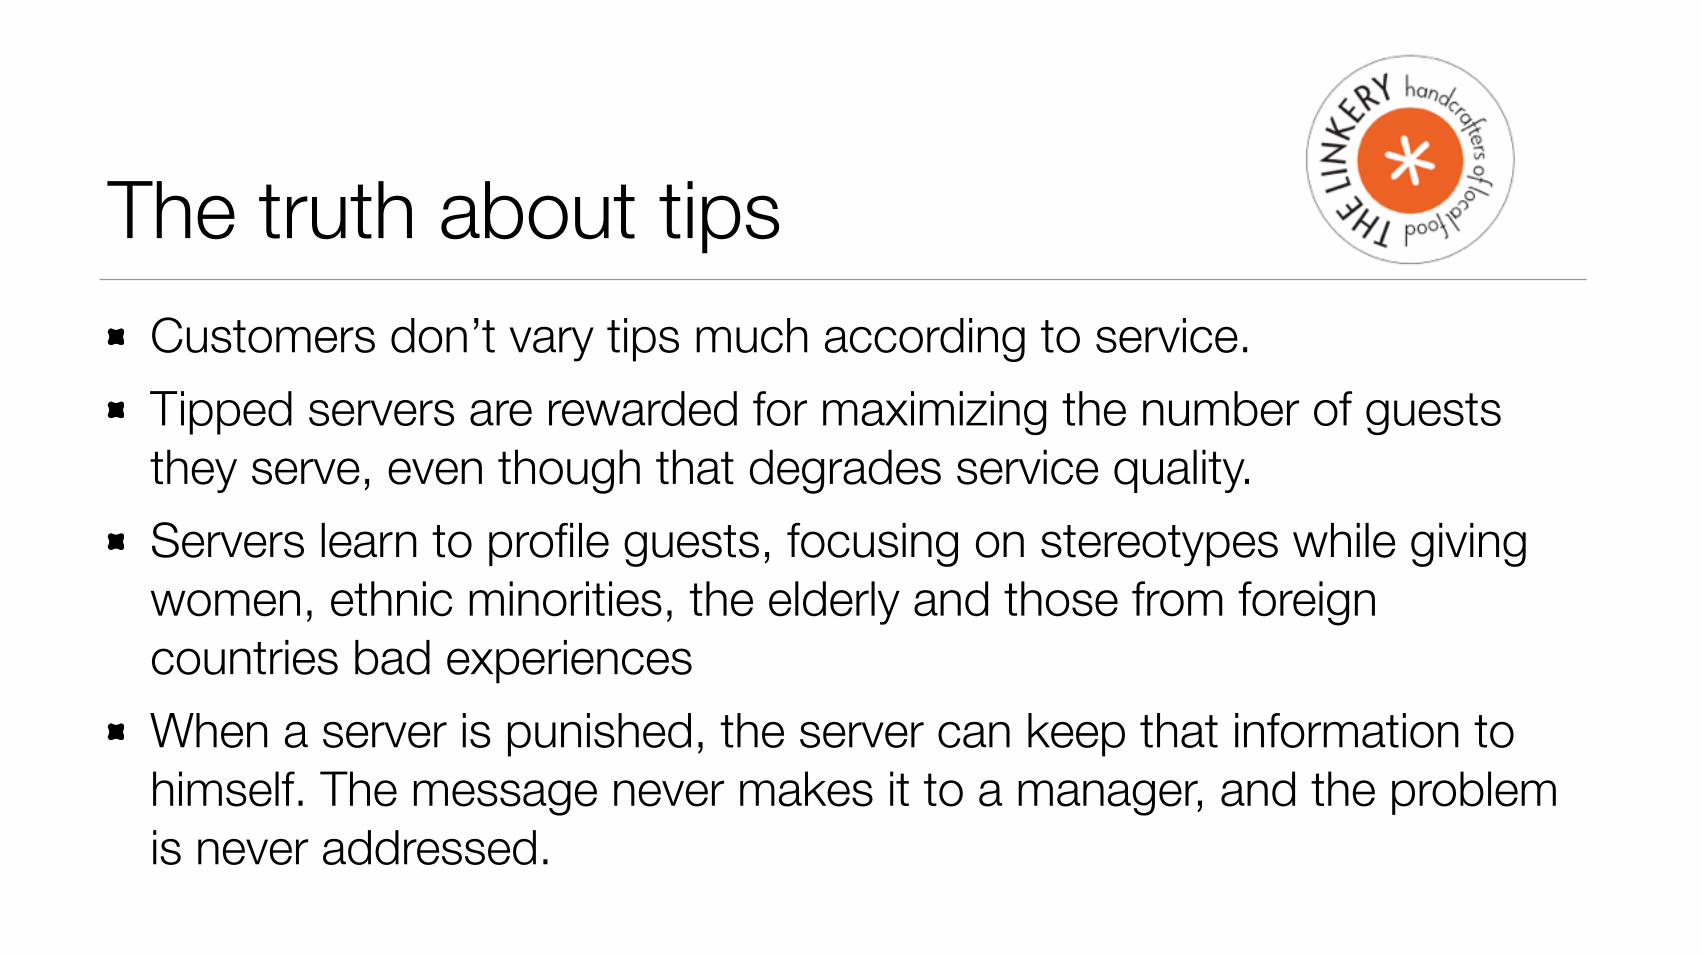
The truth about tipsCustomers don’t vary tips much according to service. Tipped servers are rewarded for maximizing the number of guests they serve, even though that degrades service quality. Servers learn to profile guests, focusing on stereotypes while giving women, ethnic minorities, the elderly and those from foreign countries bad experiences When a server is punished, the server can keep that information to himself. The message never makes it to a manager, and the problem is never addressed.
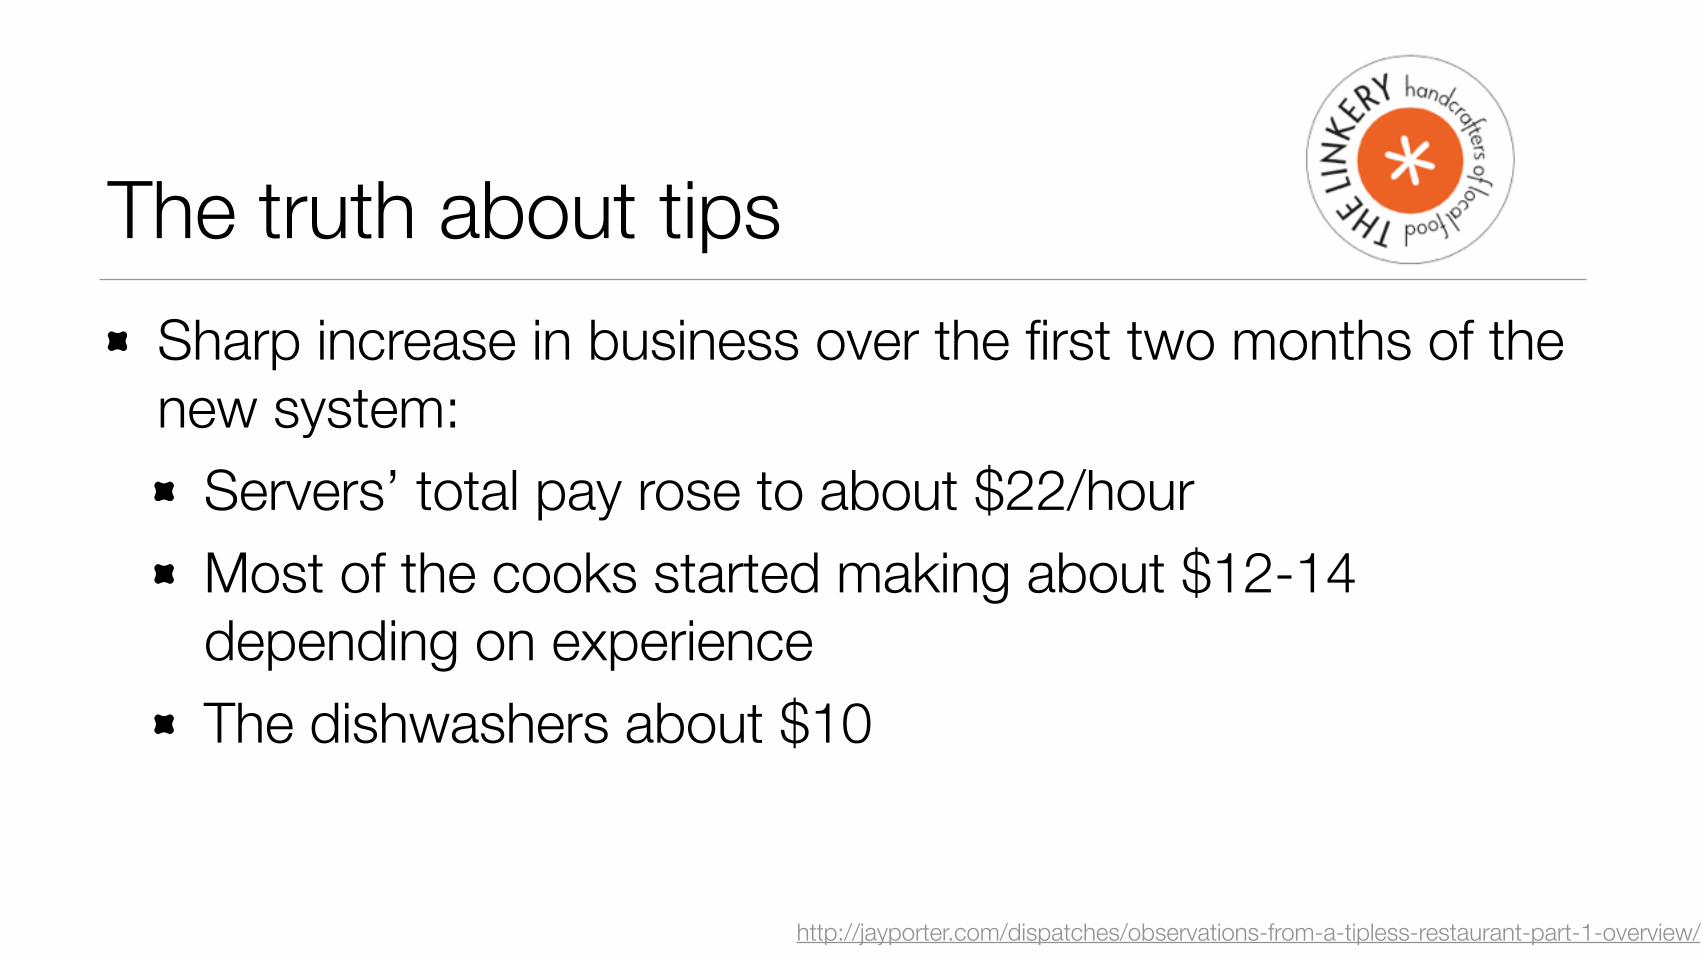
The truth about tipsSharp increase in business over the first two months of the new system:
Servers’ total pay rose to about $22/hour Most of the cooks started making about $12-14 depending on experience The dishwashers about $10
http://jayporter.com/dispatches/observations-from-a-tipless-restaurant-part-1-overview/

Is purple ink better?http://tippingresearch.com/uploads/managing_tips.pdf

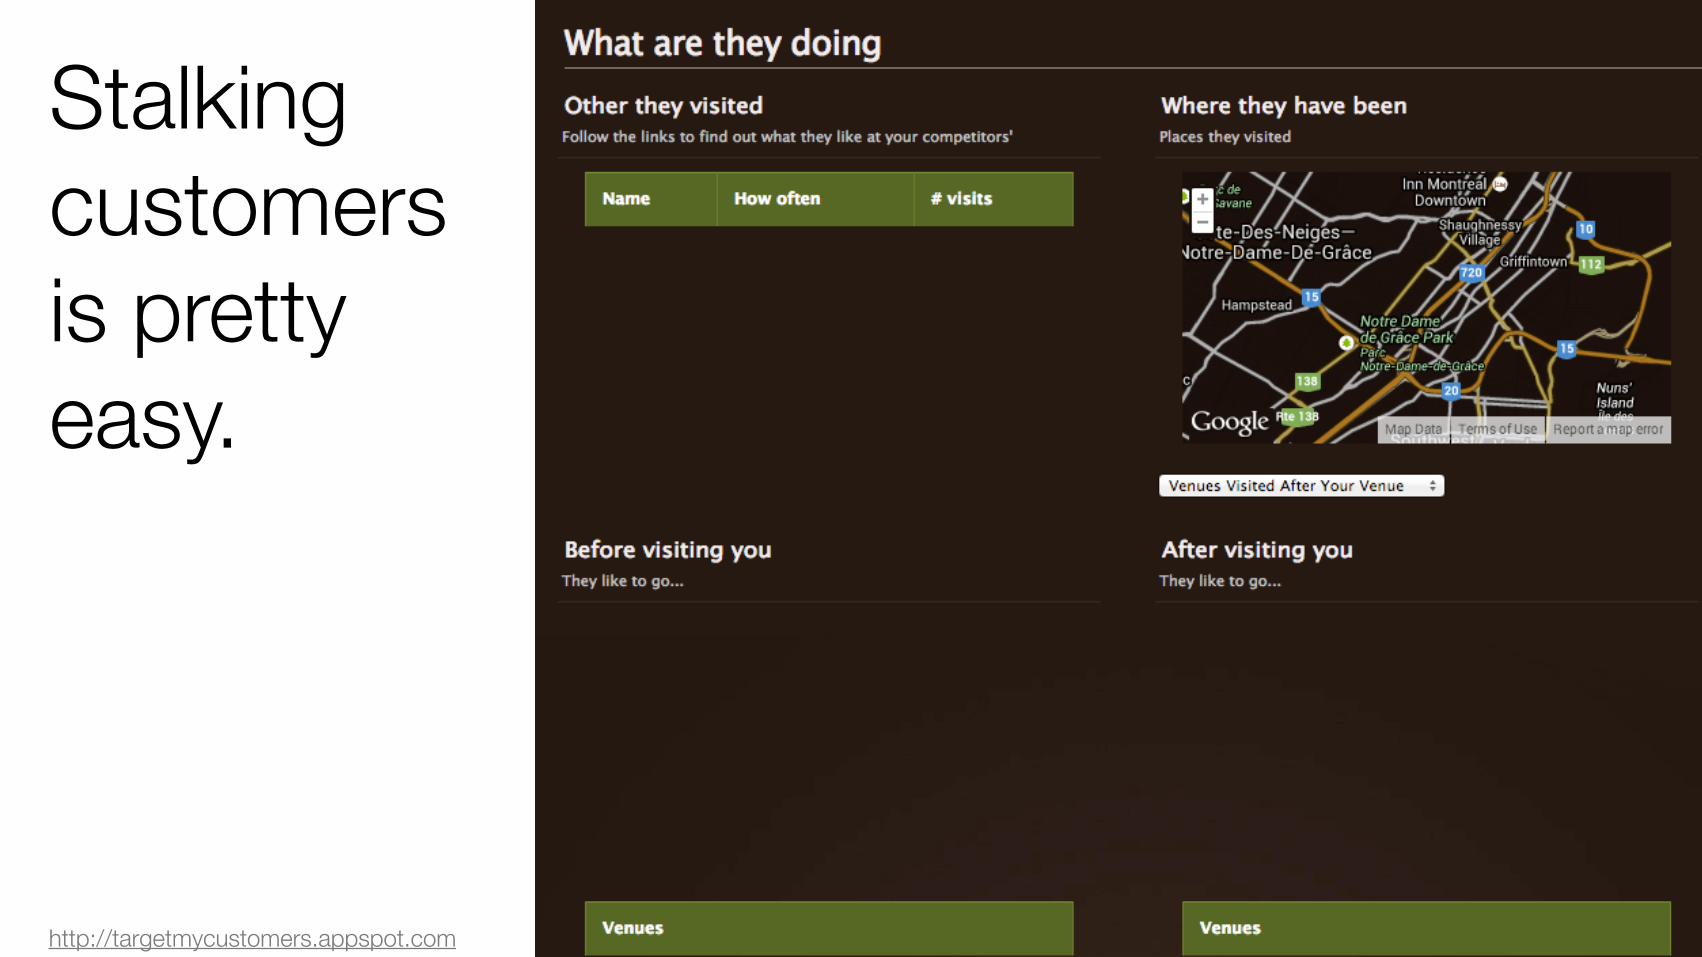
Stalking customers is pretty easy.
http://tippingresearch.com/uploads/managing_tips.pdfhttp://targetmycustomers.appspot.com
Growth hacking
(is a word you should hate but will hear a lot about.)
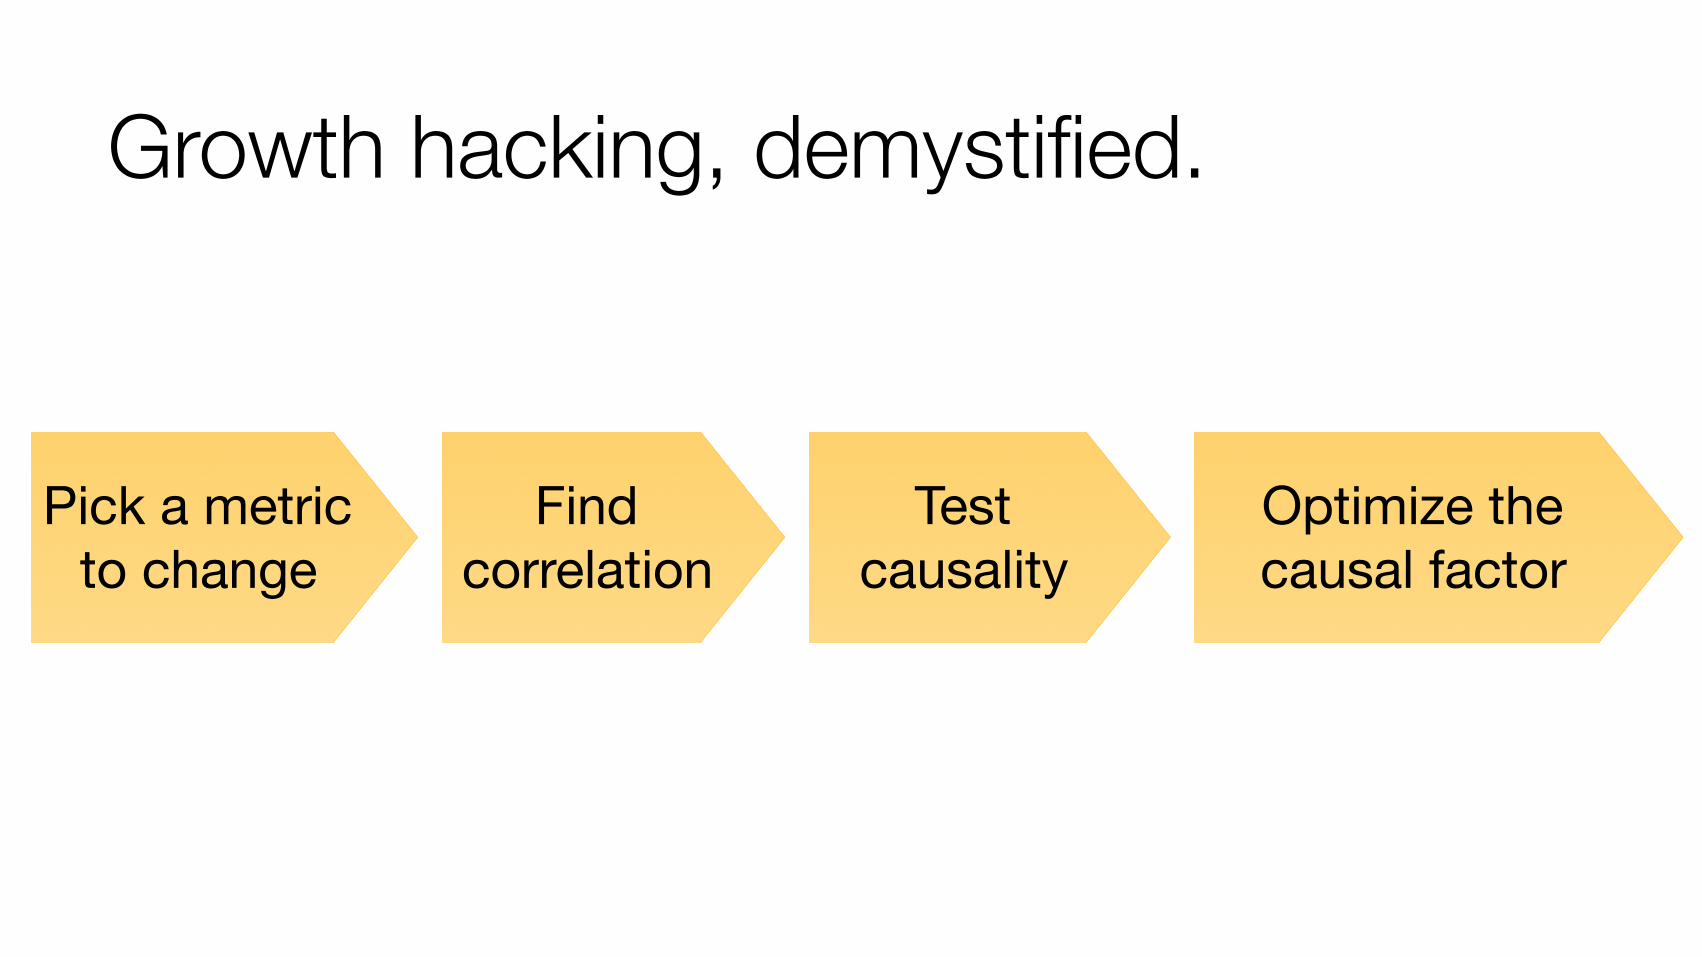
Growth hacking, demystified.
Find correlation
Test causality
Optimize the causal factor
Pick a metric to change
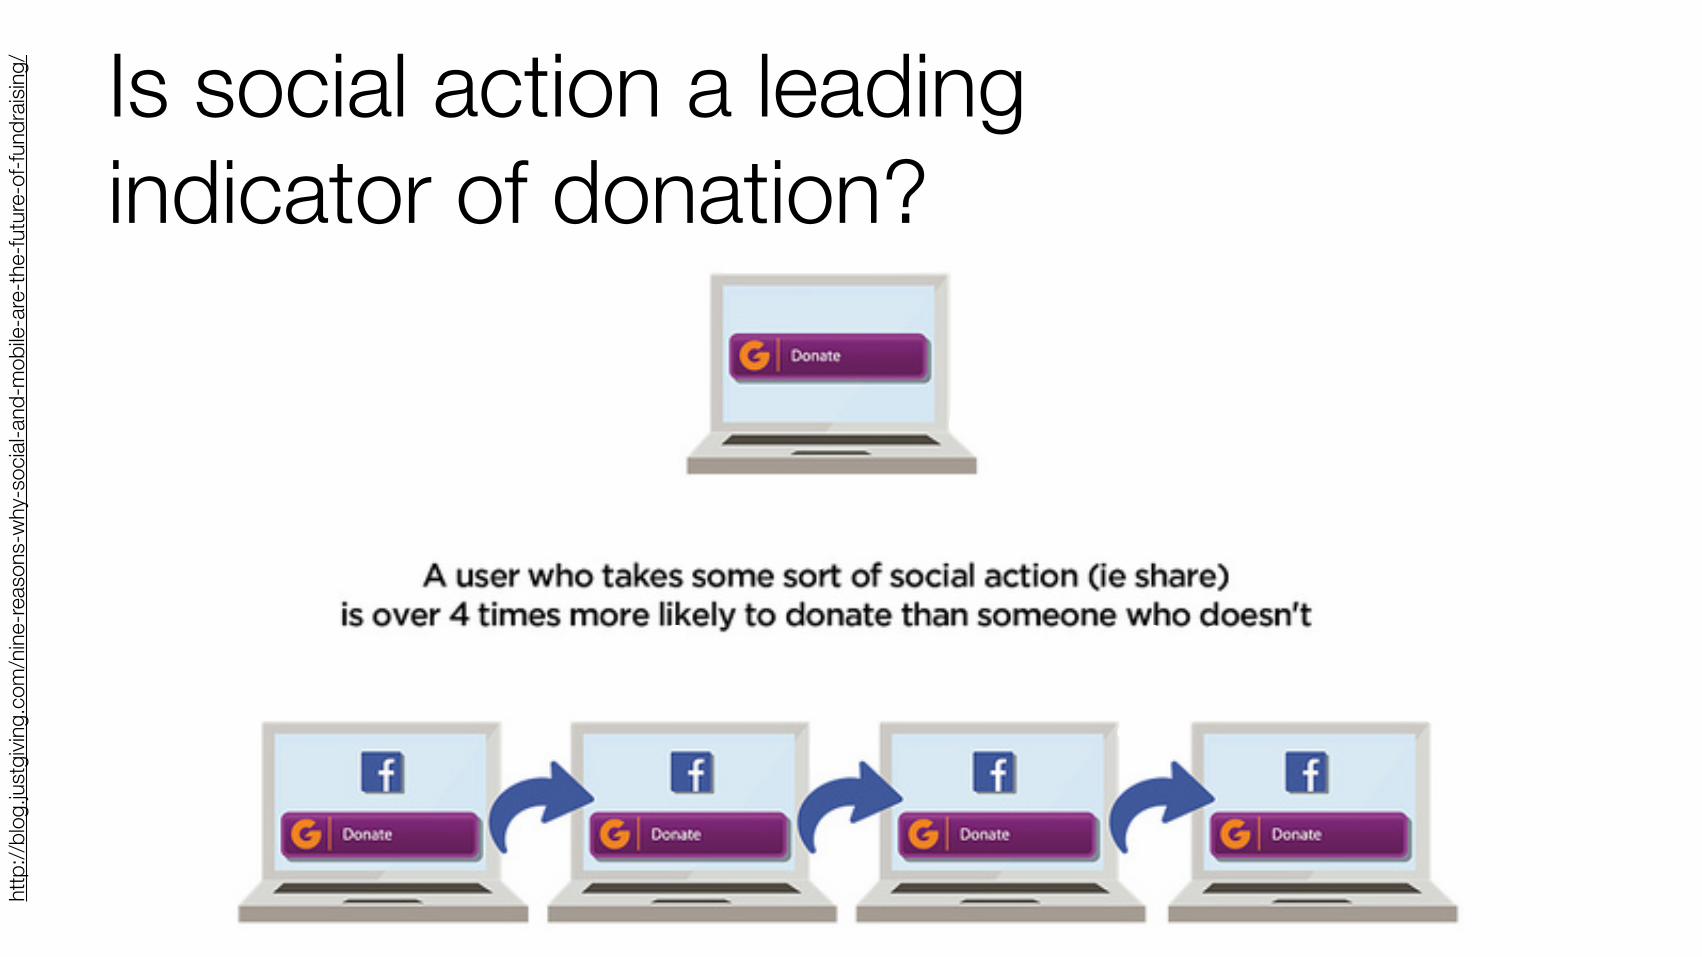
Is social action a leading indicator of donation?
http
://bl
og.ju
stgi
ving.
com
/nine
-reas
ons-
why
-soc
ial-a
nd-m
obile
-are
-the-
futu
re-o
f-fun
drais
ing/
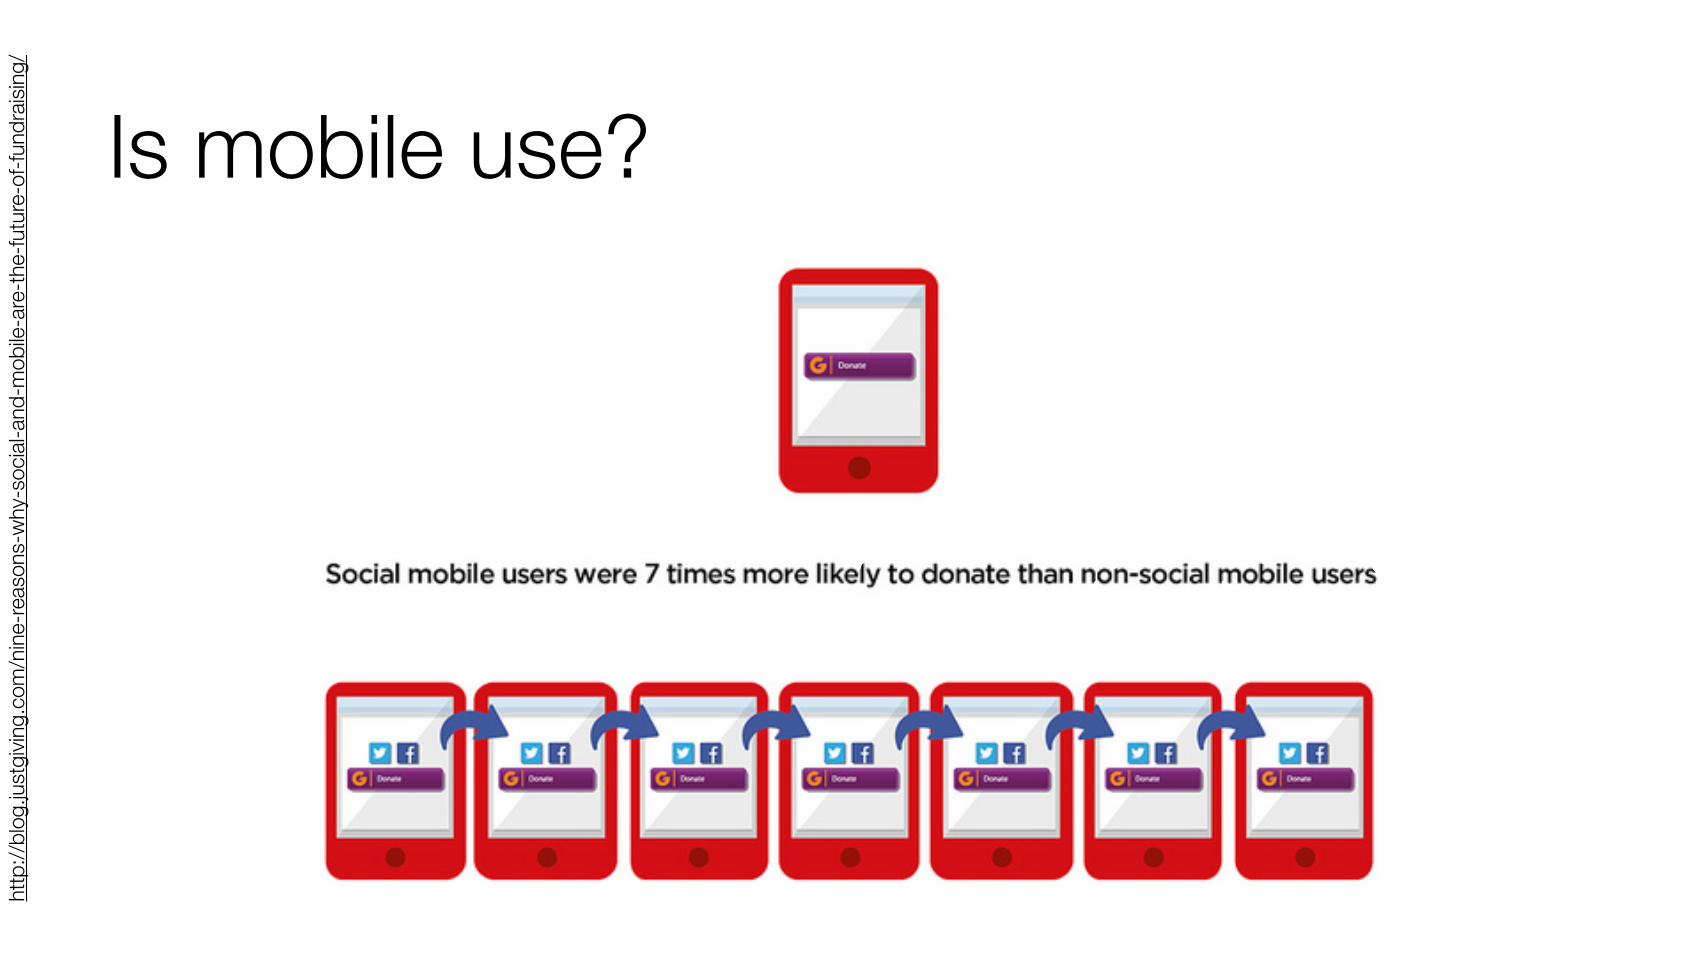
Is mobile use?ht
tp://
blog
.just
givin
g.co
m/n
ine-re
ason
s-w
hy-s
ocial
-and
-mob
ile-a
re-th
e-fu
ture
-of-f
undr
aising
/
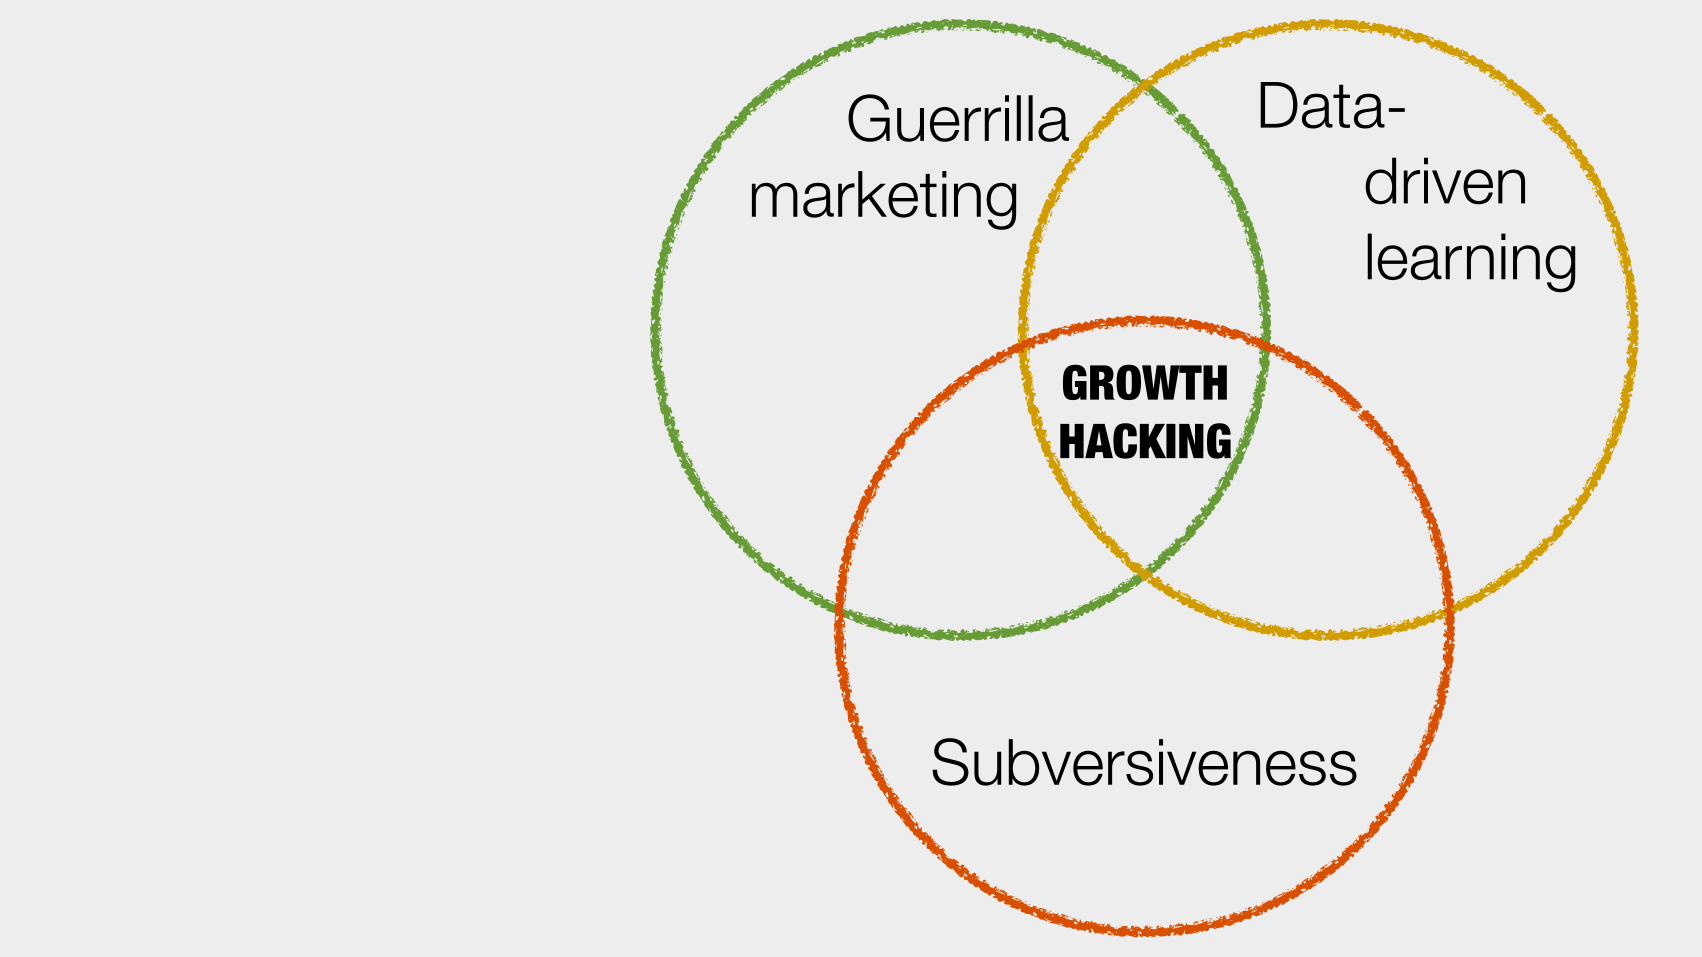
Guerrillamarketing
Data-drivenlearning
Subversiveness
GROWTHHACKING
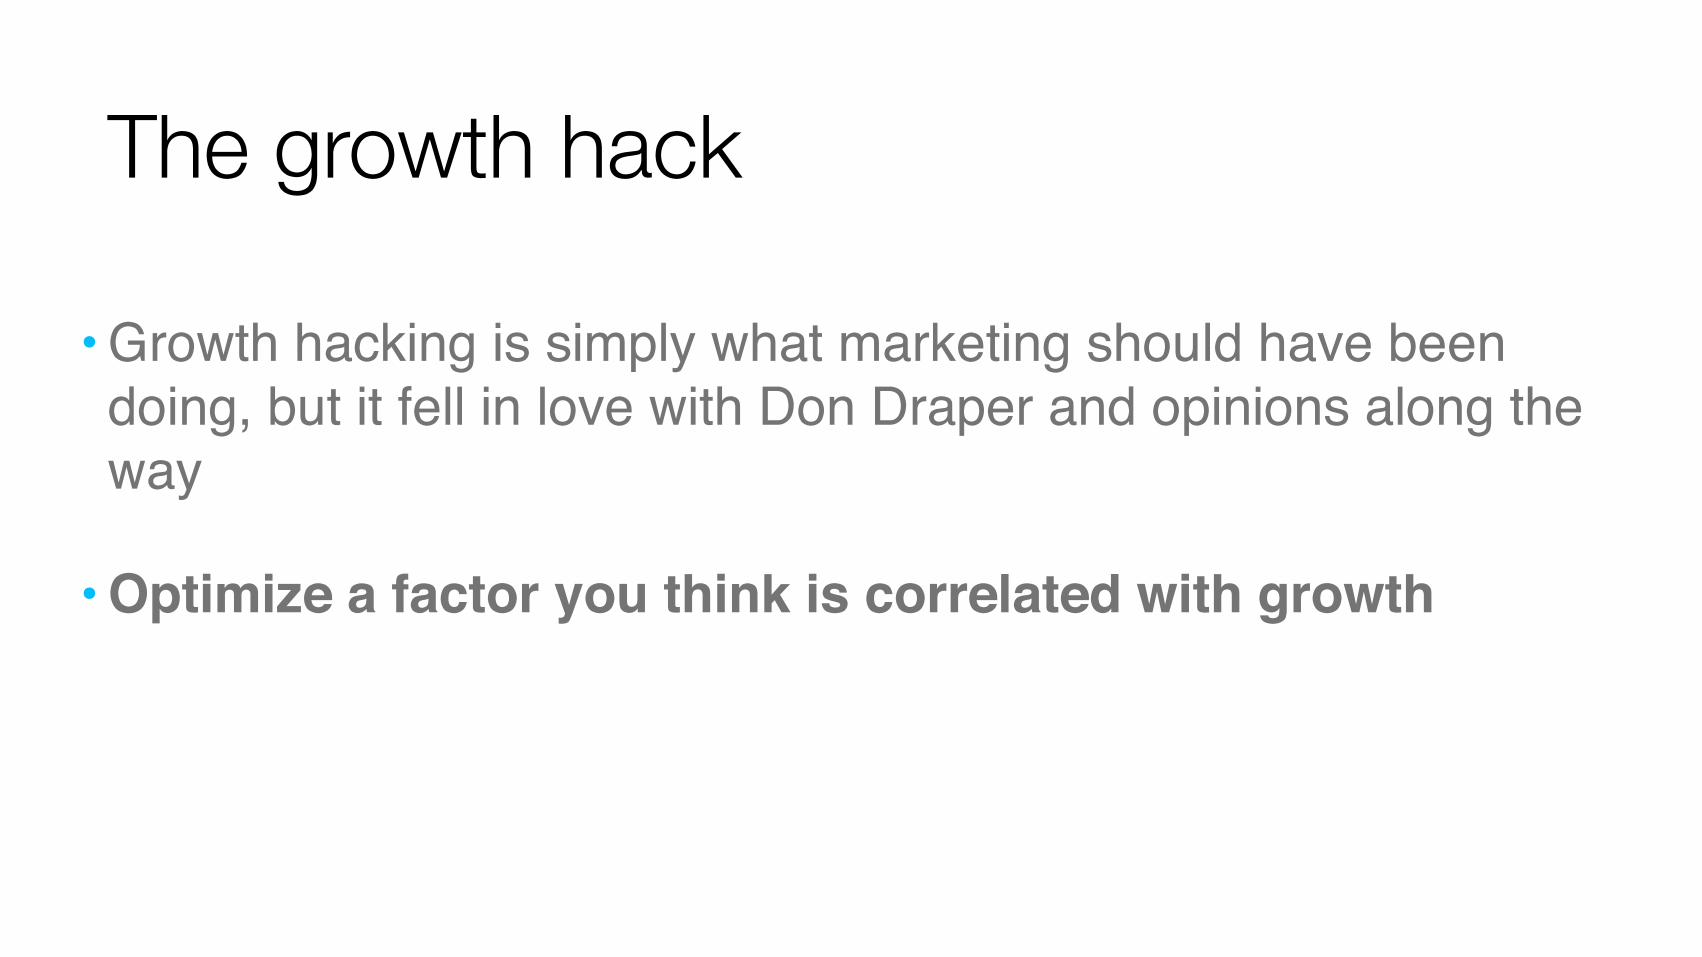
• Growth hacking is simply what marketing should have been doing, but it fell in love with Don Draper and opinions along the way
• Optimize a factor you think is correlated with growth
The growth hack
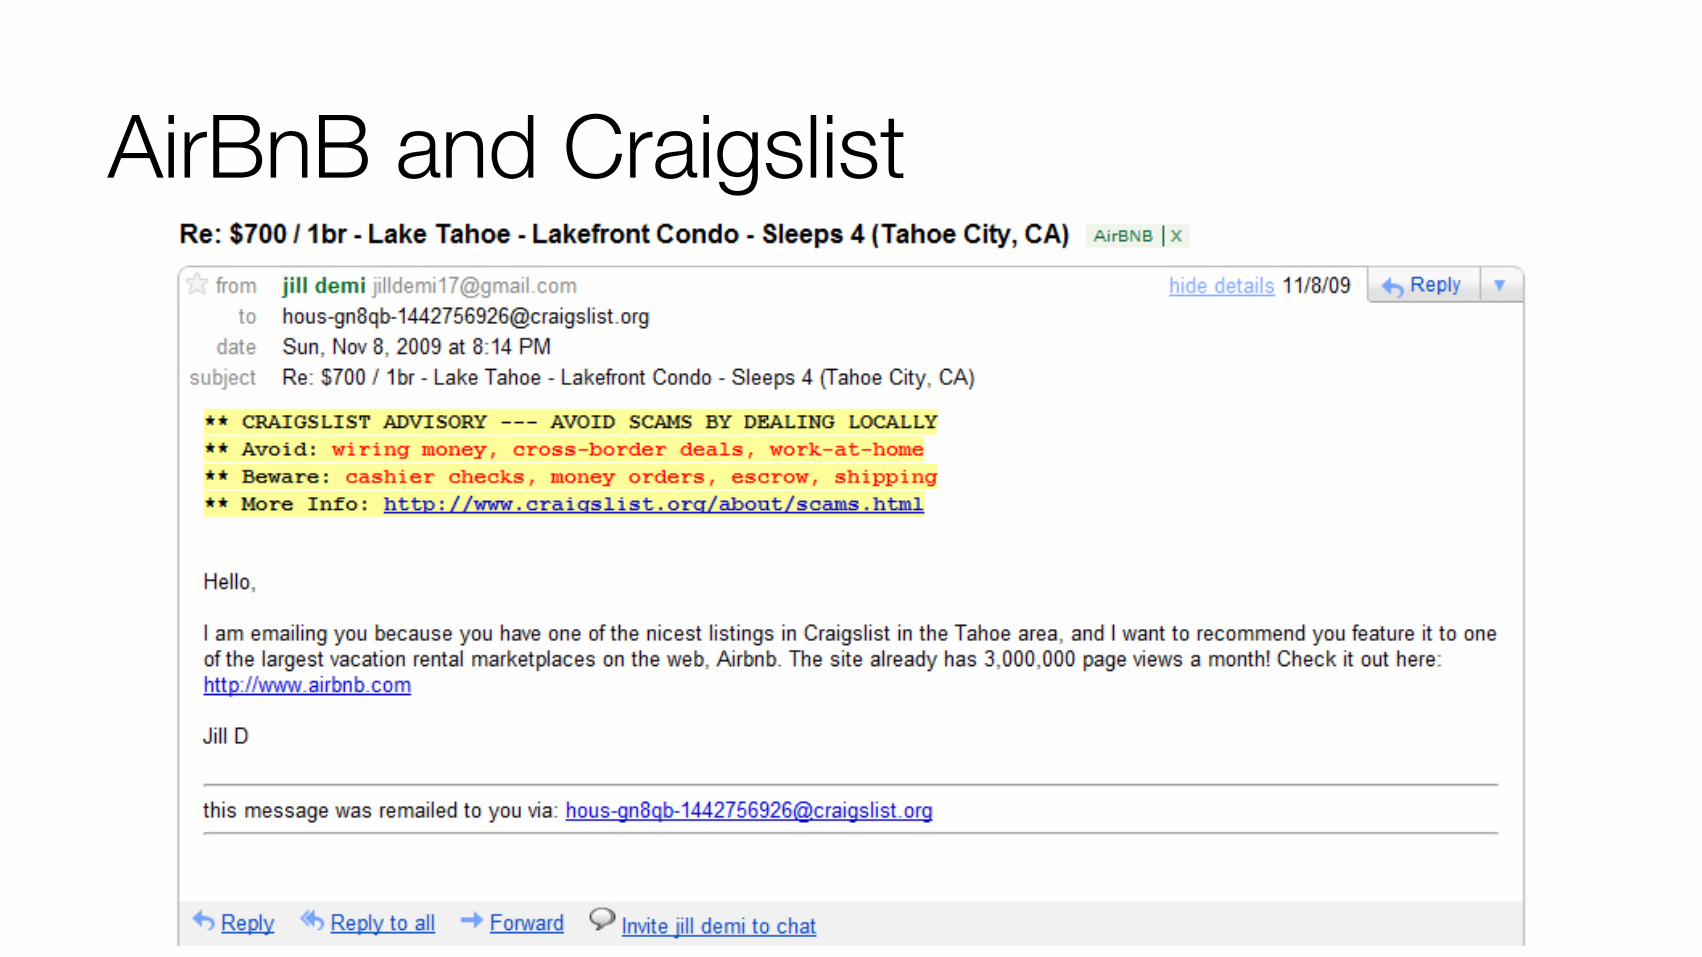
AirBnB and Craigslist


What if you’re an Intrapreneur?
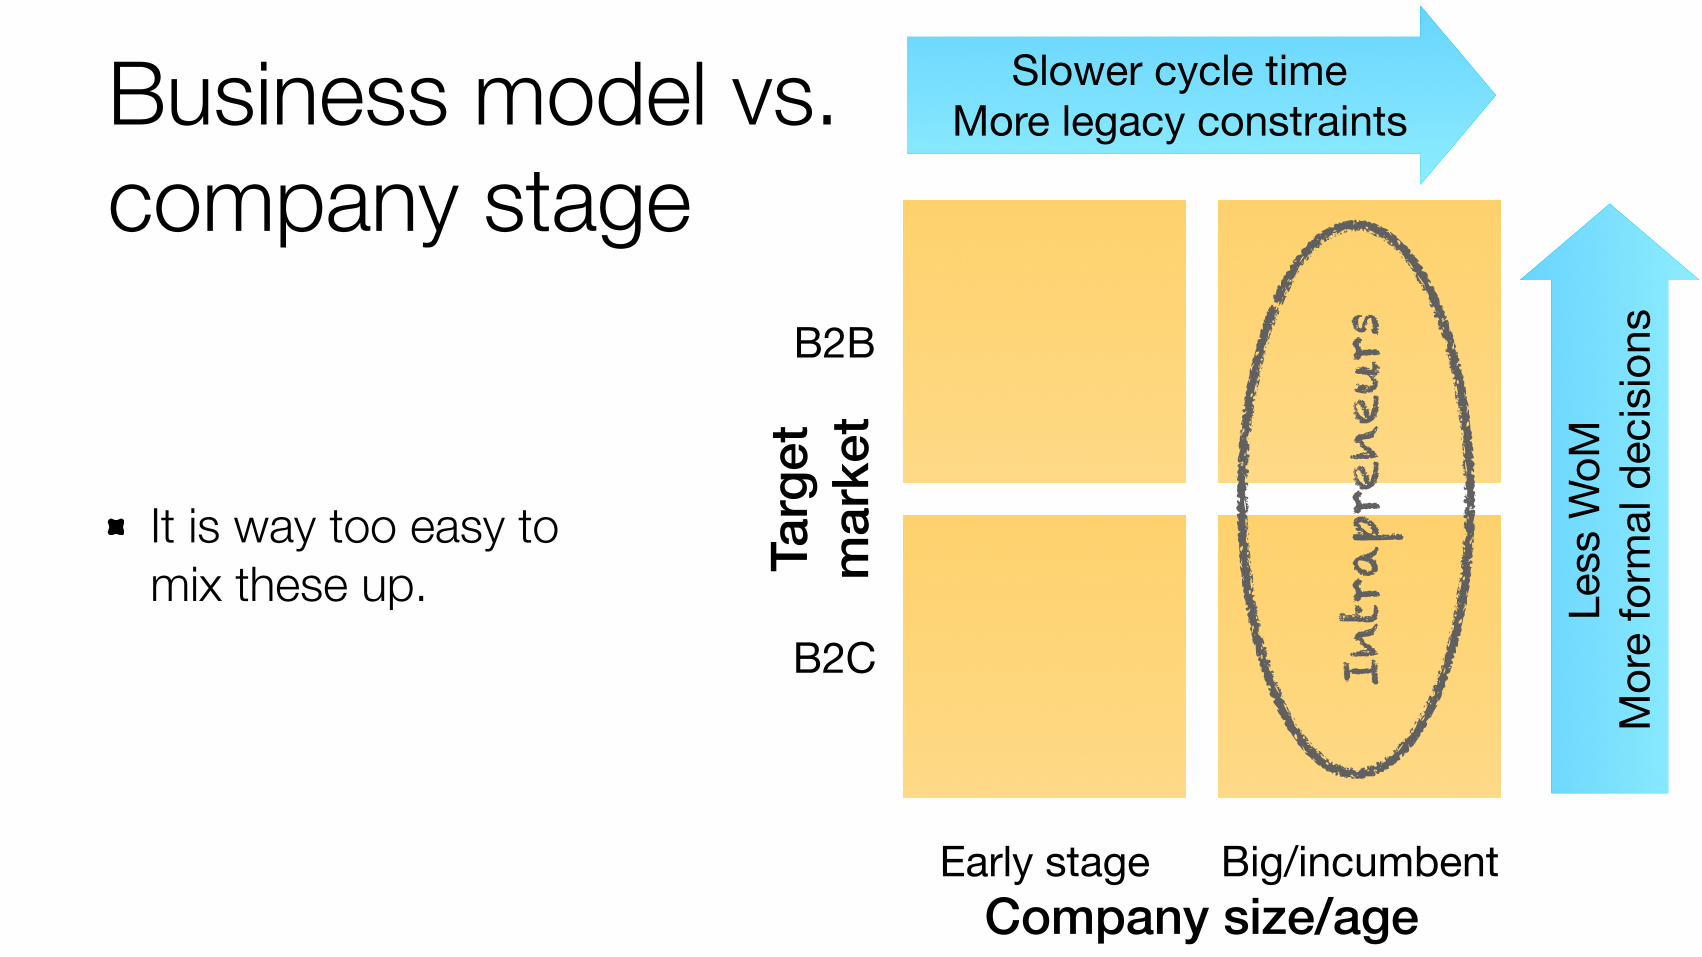
Business model vs. company stage
Company size/ageEarly stage Big/incumbent
B2B
Targ
et
mar
ket
B2C
Less
WoM
M
ore
form
al d
ecis
ions
Slower cycle timeMore legacy constraints
It is way too easy to mix these up.
Intrap
reneu
rs
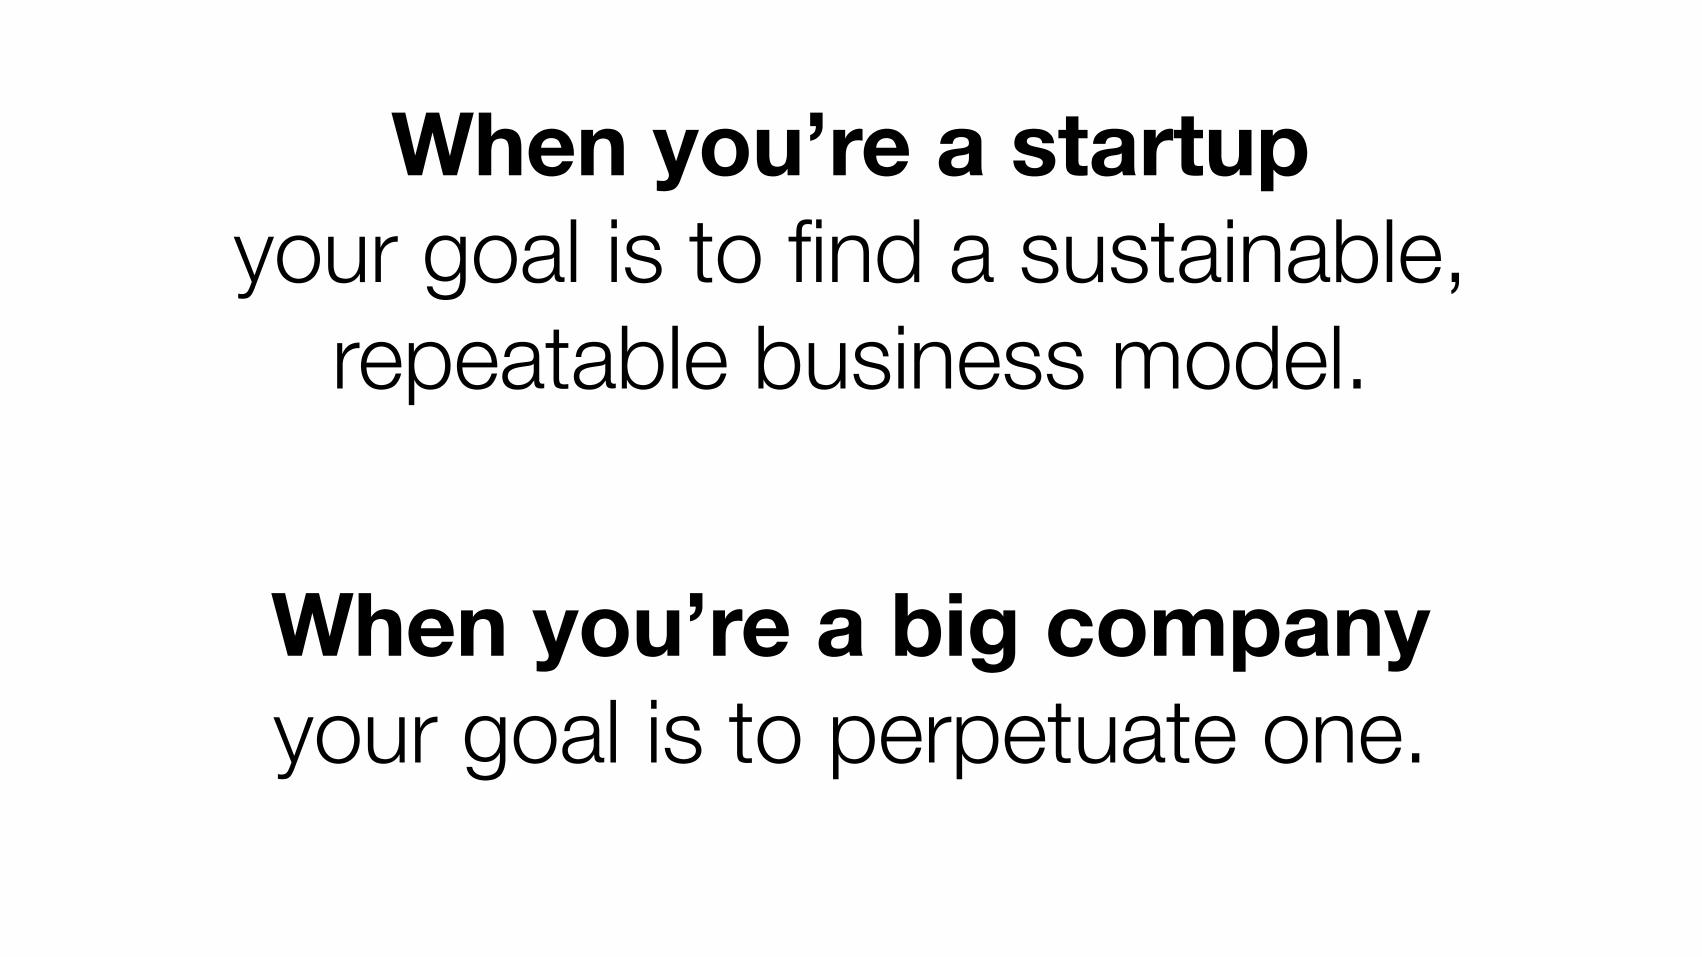
When you’re a startup your goal is to find a sustainable,
repeatable business model.
When you’re a big company your goal is to perpetuate one.
Intrapreneur: Someone working to produce
disruptive change in an organization that has already found a sustainable,
repeatable business model.
In a startup, the purpose of analytics is to iterate to product/market fit
before the money runs out.
In a big company, analytics replaces opinion with fact.
(Before we get into Lean Analytics, 2 key lessons.)
Lesson one: Companies die because they fail to
move to new business models.
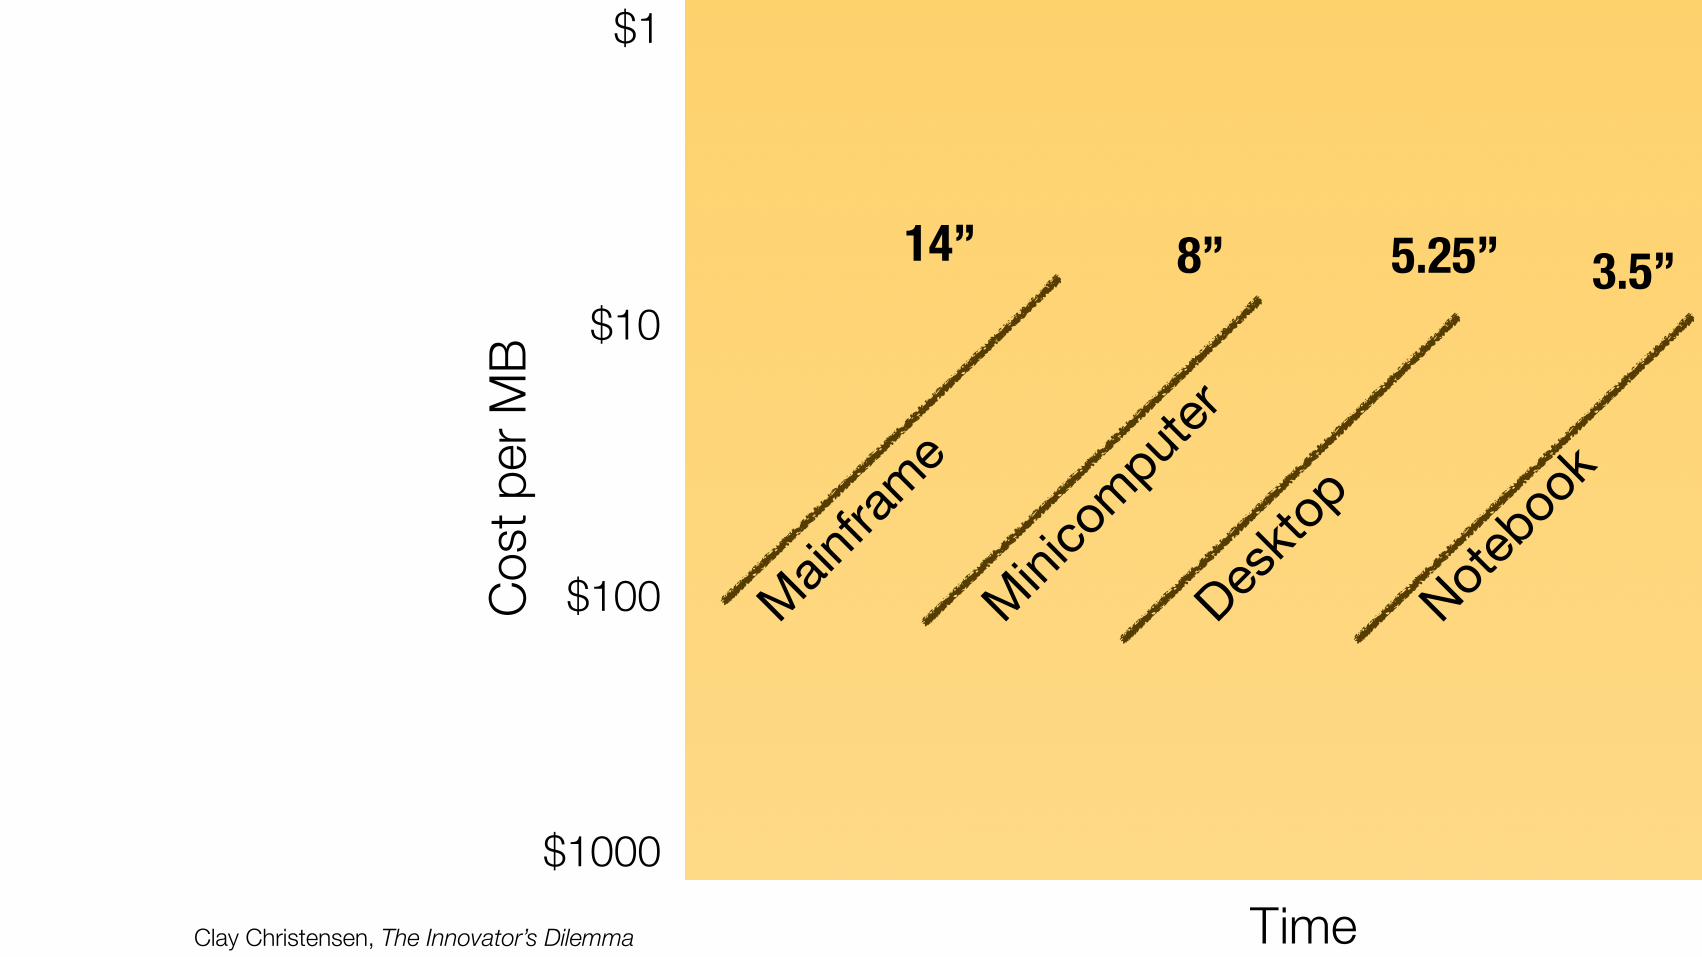
Clay Christensen, The Innovator’s Dilemma
Cost
per
MB
$1000
$100
$10
$1
Time
14”
Mainfra
me
8”
Minicom
puter
5.25”
Deskto
p
3.5”
Noteboo
k
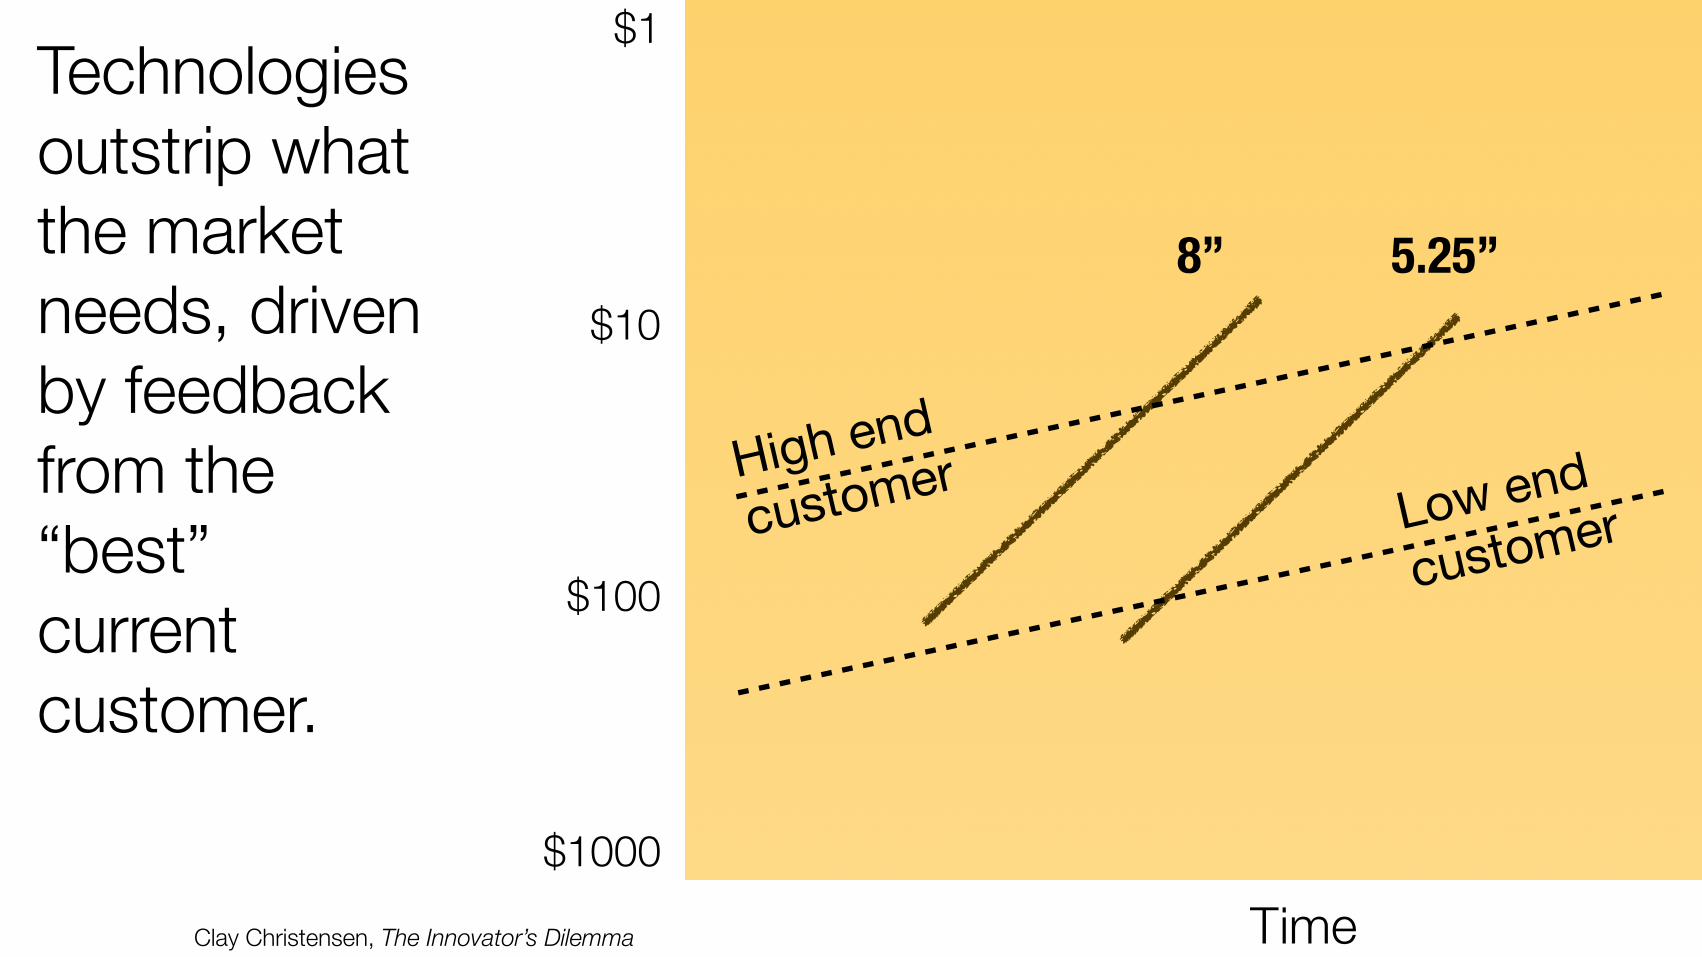
Technologies outstrip what the market needs, driven by feedback from the “best” current customer.
Clay Christensen, The Innovator’s Dilemma
$1000
$100
$10
$1
Time
8” 5.25”
High end
customerLow end
customer
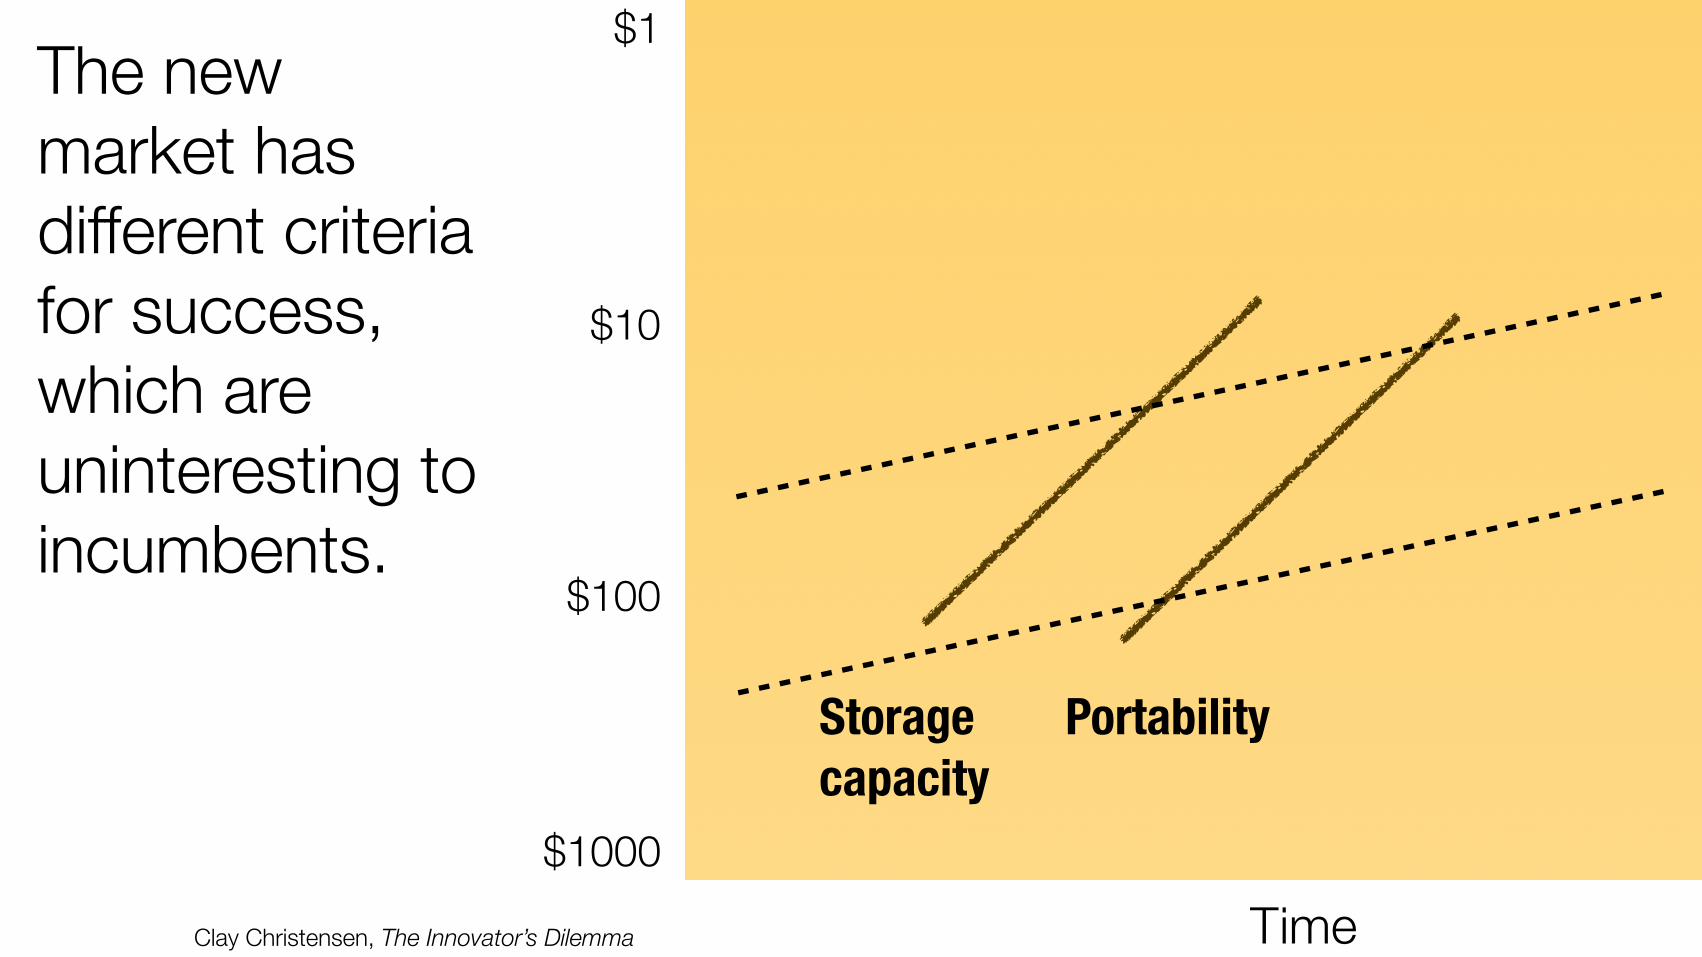
The new market has different criteria for success, which are uninteresting to incumbents.
Clay Christensen, The Innovator’s Dilemma
$1000
$100
$10
$1
Time
Storagecapacity
Portability
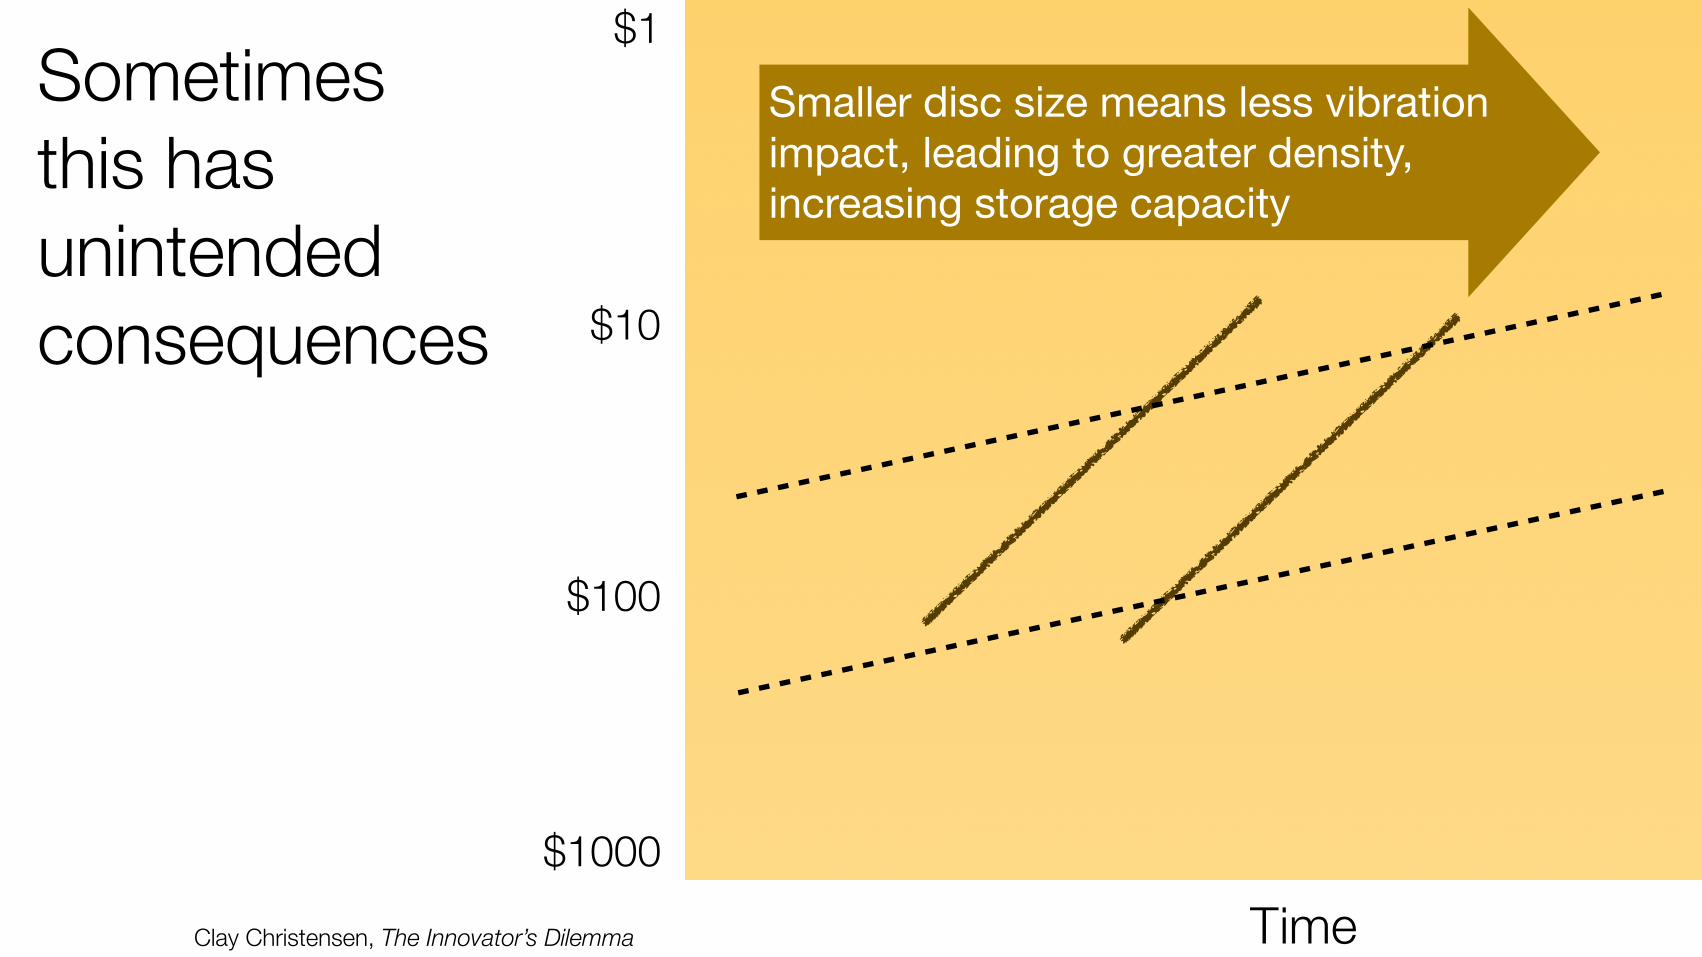
Sometimes this has unintended consequences
Clay Christensen, The Innovator’s Dilemma
$1000
$100
$10
$1
Time
Smaller disc size means less vibration impact, leading to greater density, increasing storage capacity
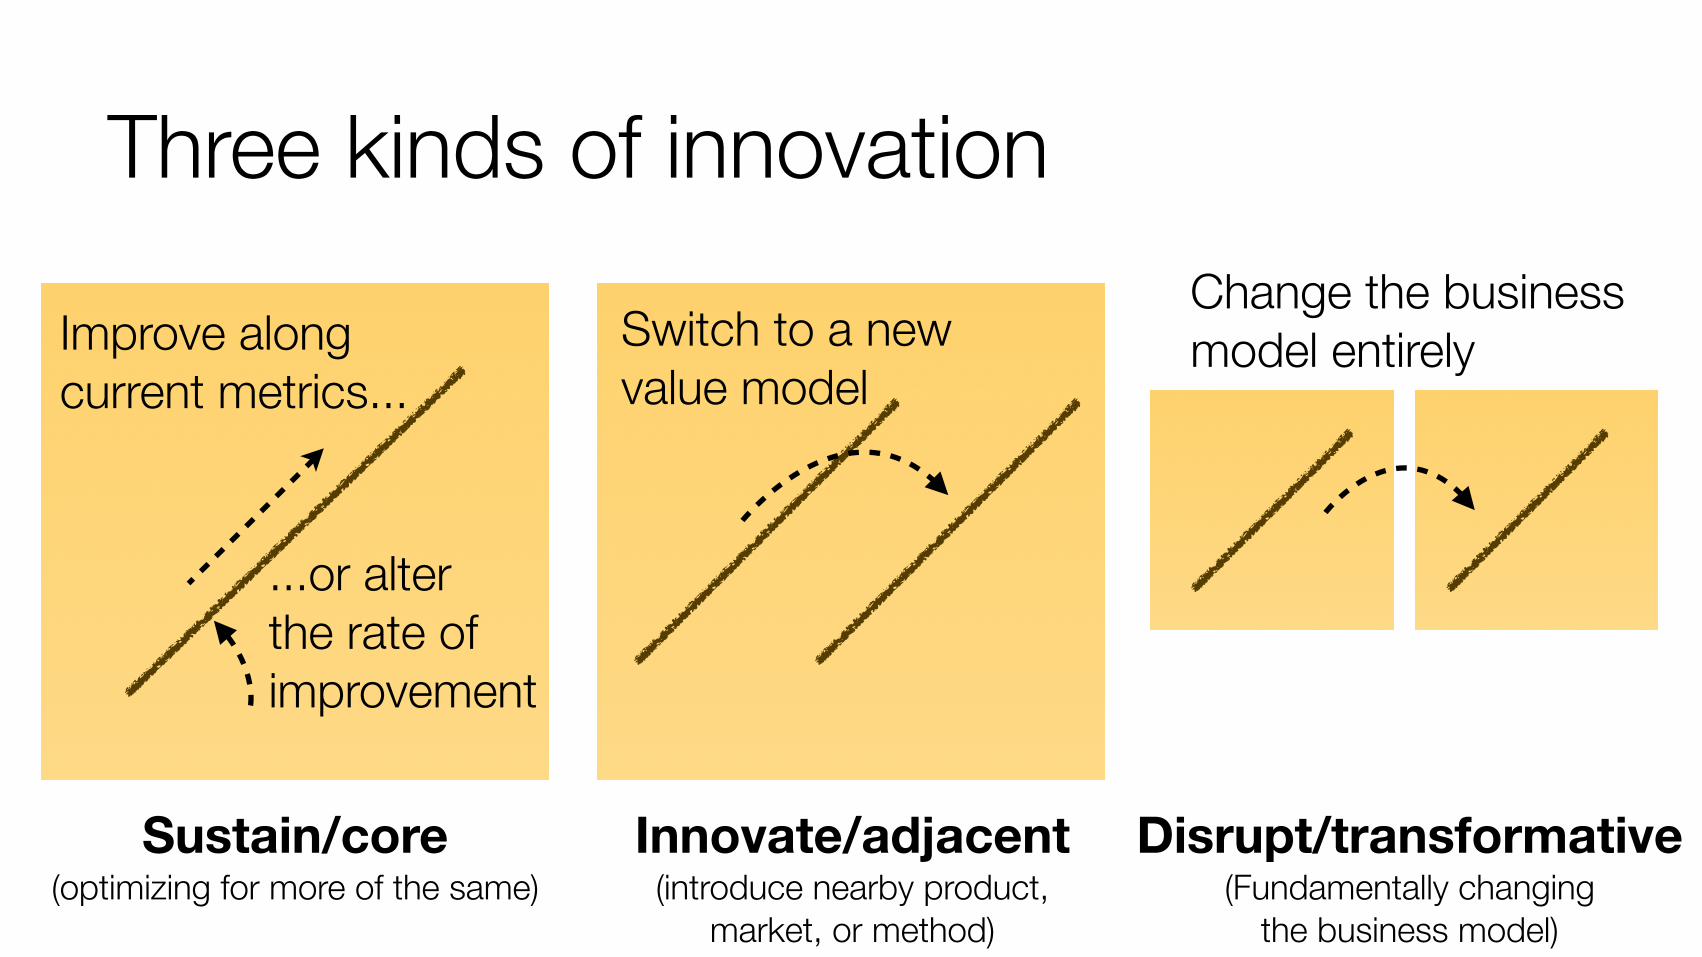
Three kinds of innovation
Sustain/core(optimizing for more of the same)
Innovate/adjacent(introduce nearby product,
market, or method)
Disrupt/transformative(Fundamentally changing
the business model)
Improve along current metrics...
...or alterthe rate of improvement
Switch to a new value model
Change the businessmodel entirely
Lesson two: The difference between a rogue agent and a special operative is permission.

It’s different when you’re big.
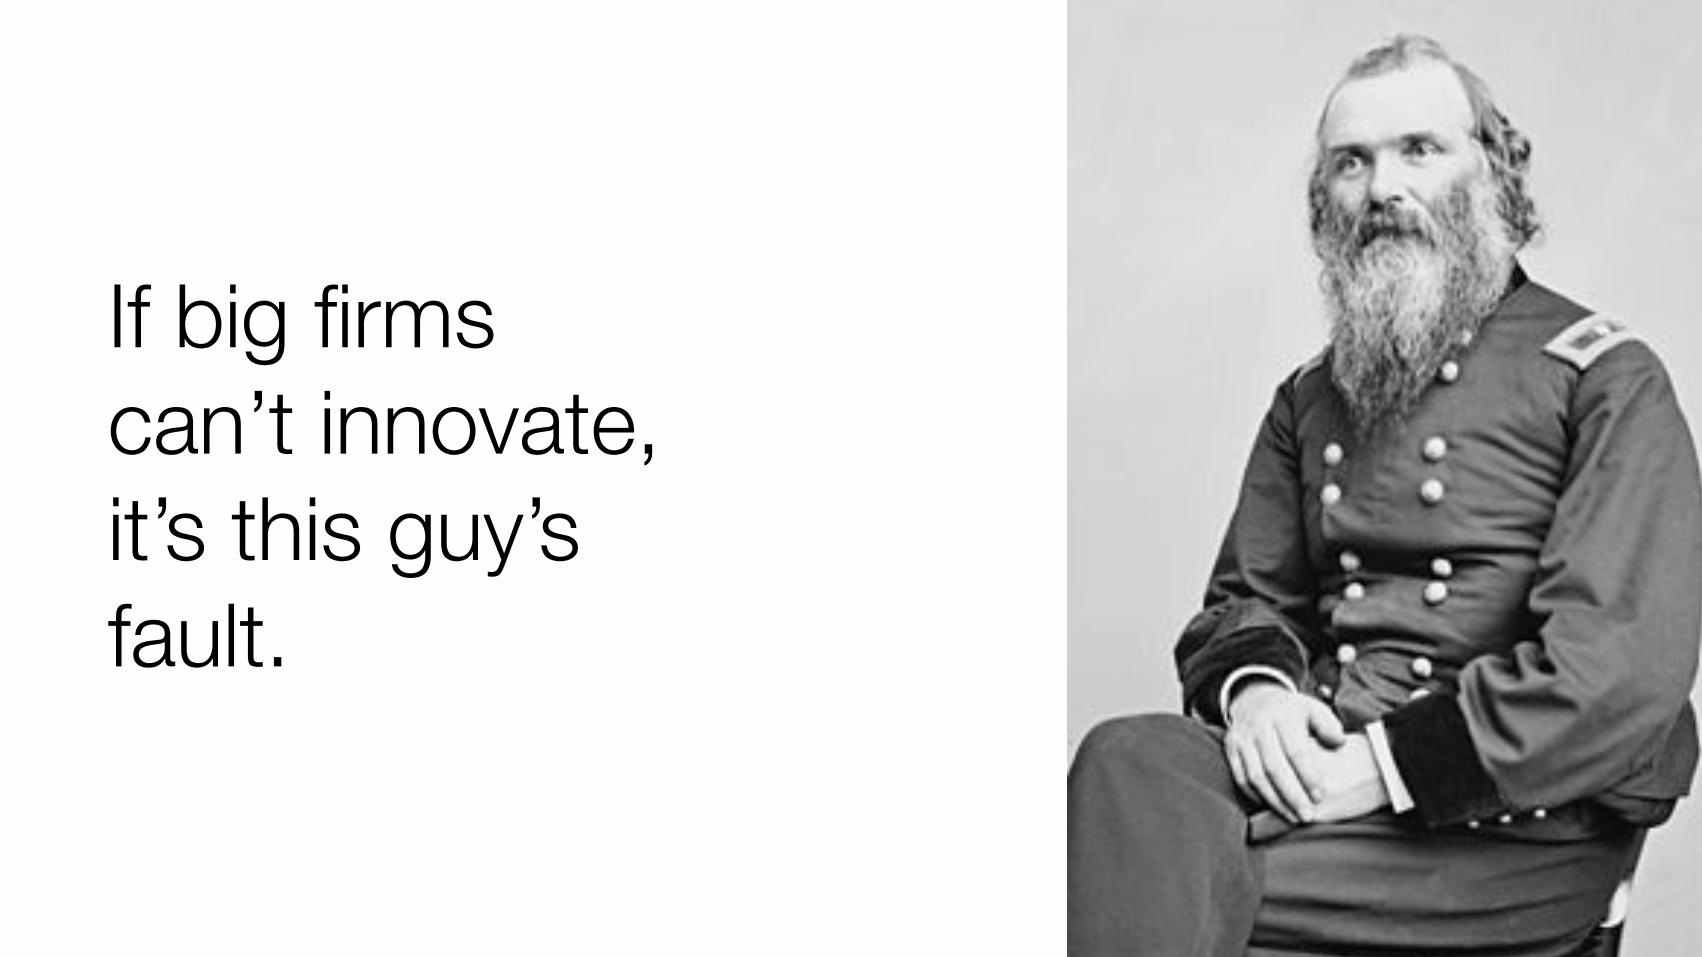
If big firms can’t innovate, it’s this guy’s fault.
When product and market are known, companies compete on how they do
things.
To get the incremental cost to zero, companies competed on scale.
(Literally, an economy of scale)
Scale comes from process, IP, org chart, capitalization.
All of these assume the future will be like the past, only more so.
If a startup is an organization designed to search for a sustainable, repeatable business model, then an established company is an organization designed
to perpetuate one.
Technology has radically changed the incremental cost of businesses.

http://www.flickr.com/photos/ebolasmallpox/3733059220/
Software is eating the world.
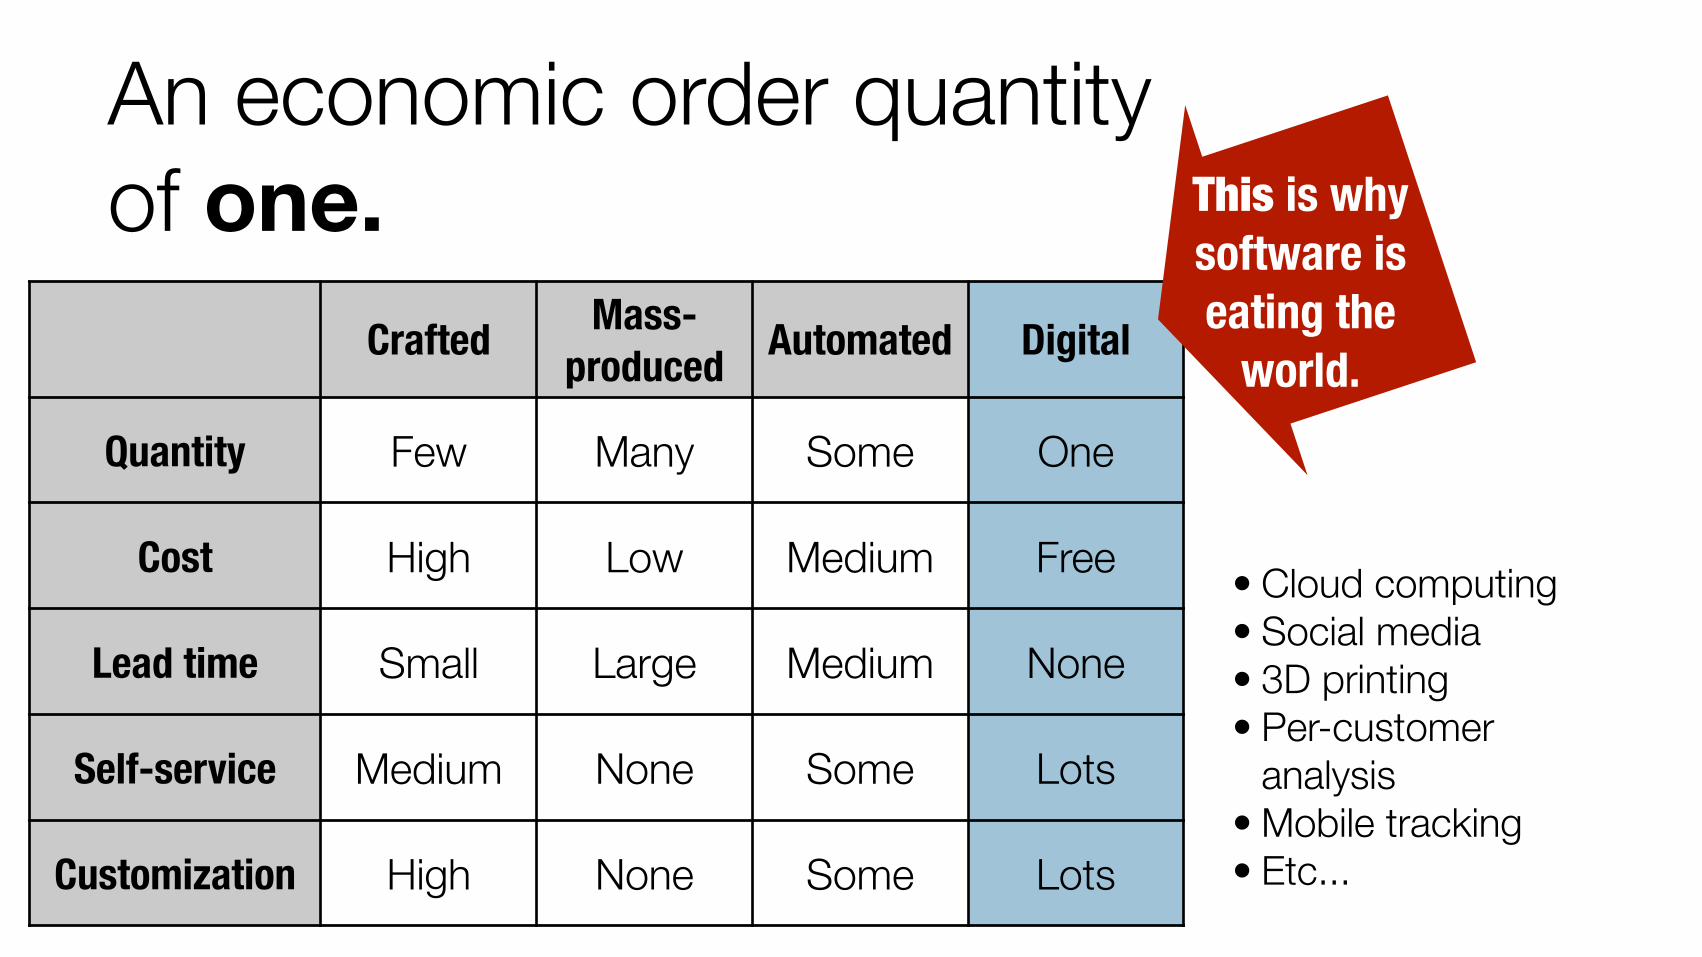
An economic order quantity of one.
Crafted Mass-produced Automated Digital
Quantity Few Many Some One
Cost High Low Medium Free
Lead time Small Large Medium None
Self-service Medium None Some Lots
Customization High None Some Lots
• Cloud computing • Social media • 3D printing • Per-customer
analysis • Mobile tracking • Etc...
This is why software is eating the
world.
Sustainable competitive advantage allows for inertia and power to build up along the lines of
an existing business model, which will soon die.
Instead, seek transient competitive advantage.
Rita Gunther McGrath, The End of Competitive Advantage
Scale is now a liability. Compete on cycle time.
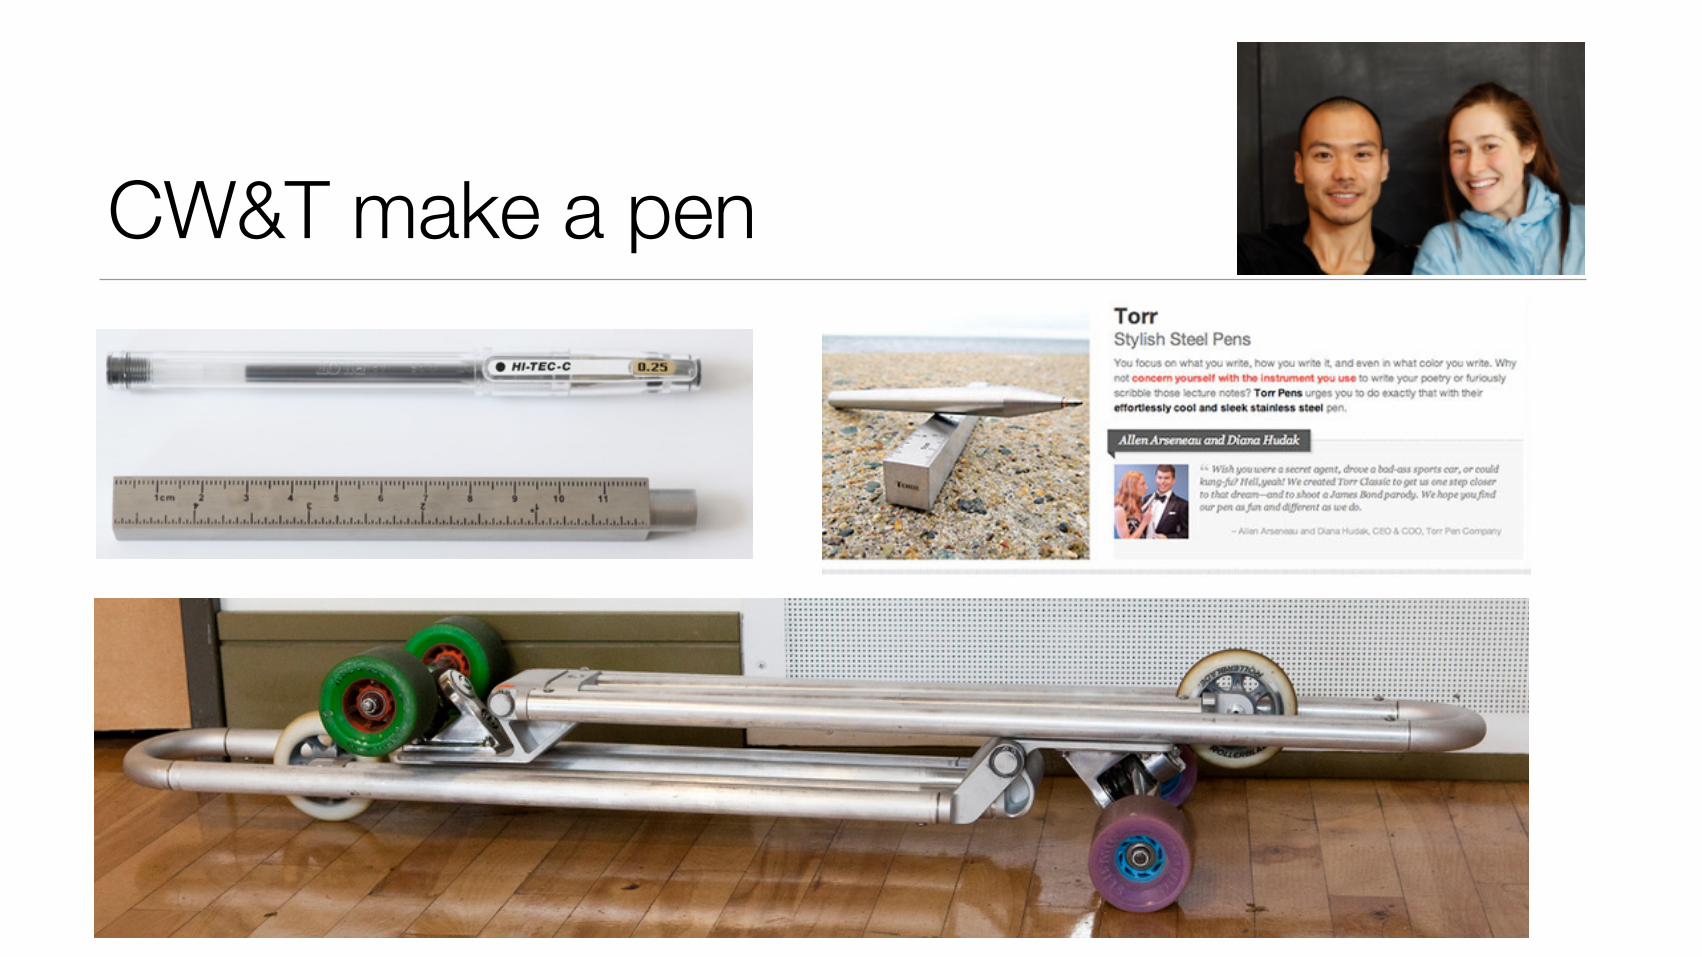
CW&T make a pen

http://www.flickr.com/photos/art_es_anna/288880795/

Optimizing the probable means discounting the possible.

This isn’t about a lack of resources.

http://www.flickr.com/photos/maladjusted/5207565912

Blockbuster had a lot going for it.

Plenty of inventory, of course. But that matters less than...
...market intelligence, customers, existing payment approval, and customer history.
The problem was framing:
Blockbuster thought it was in the video store management business. Netflix realized it was in the entertainment delivery business.

YOU ARE HERE

YOU ARE HERE
LOCALMAXIMUMOPTIMIZATION
OF CURRENT METRICS
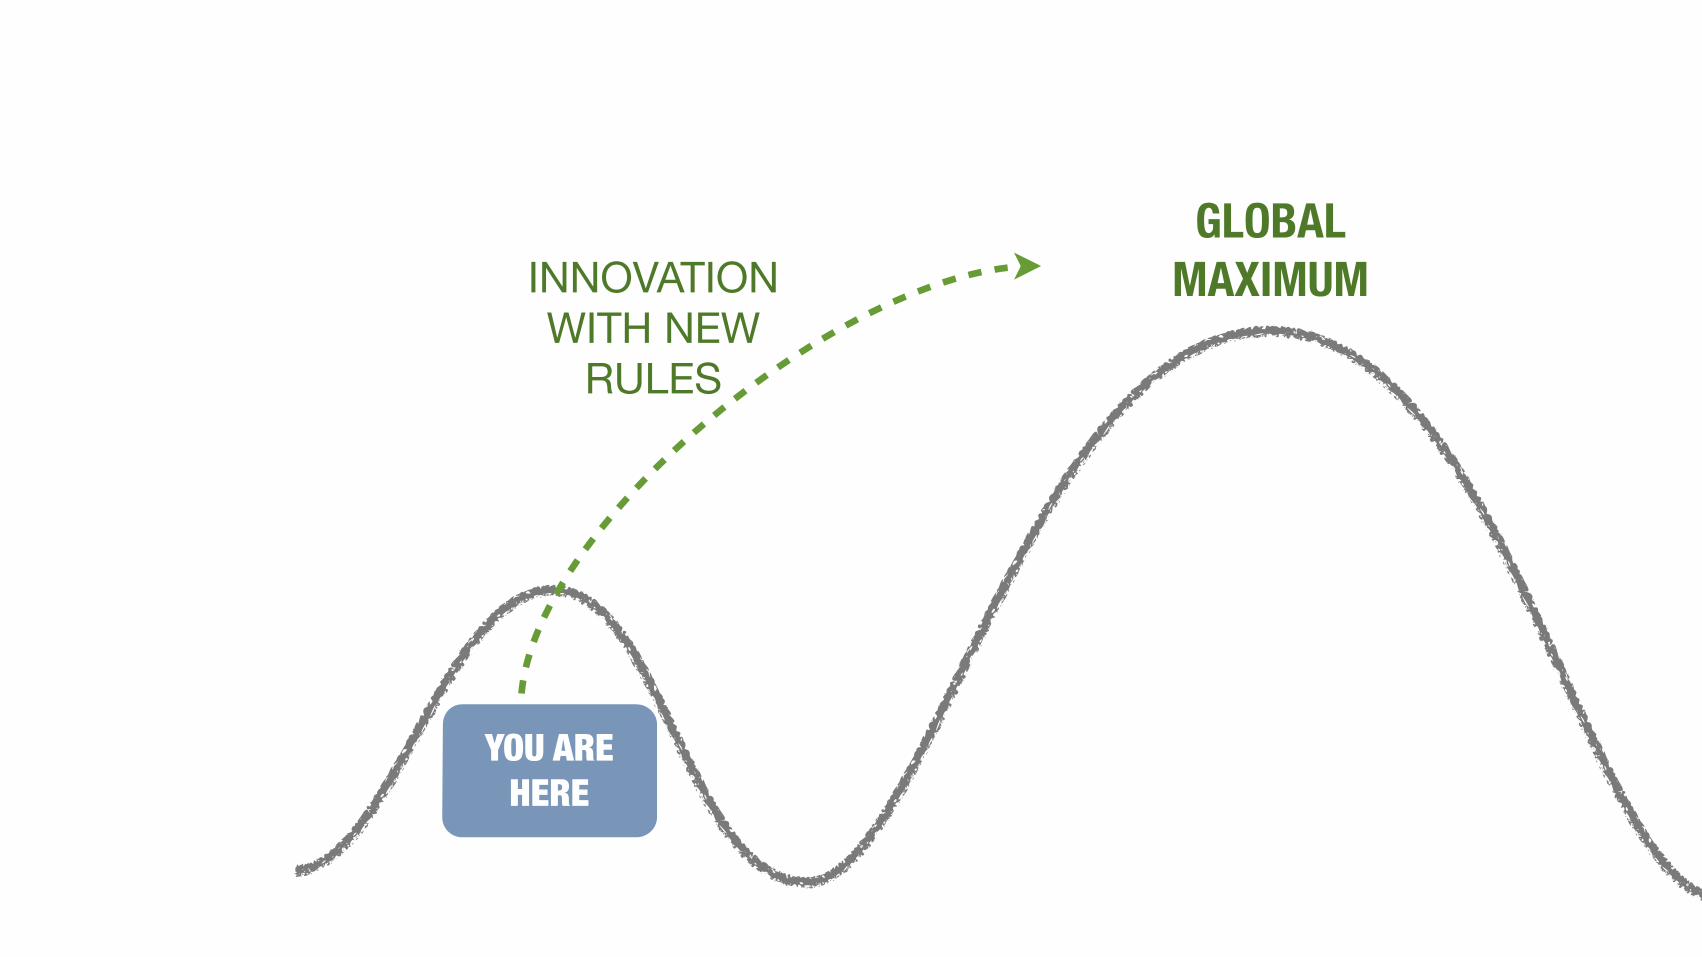
YOU ARE HERE
GLOBALMAXIMUMINNOVATION
WITH NEWRULES
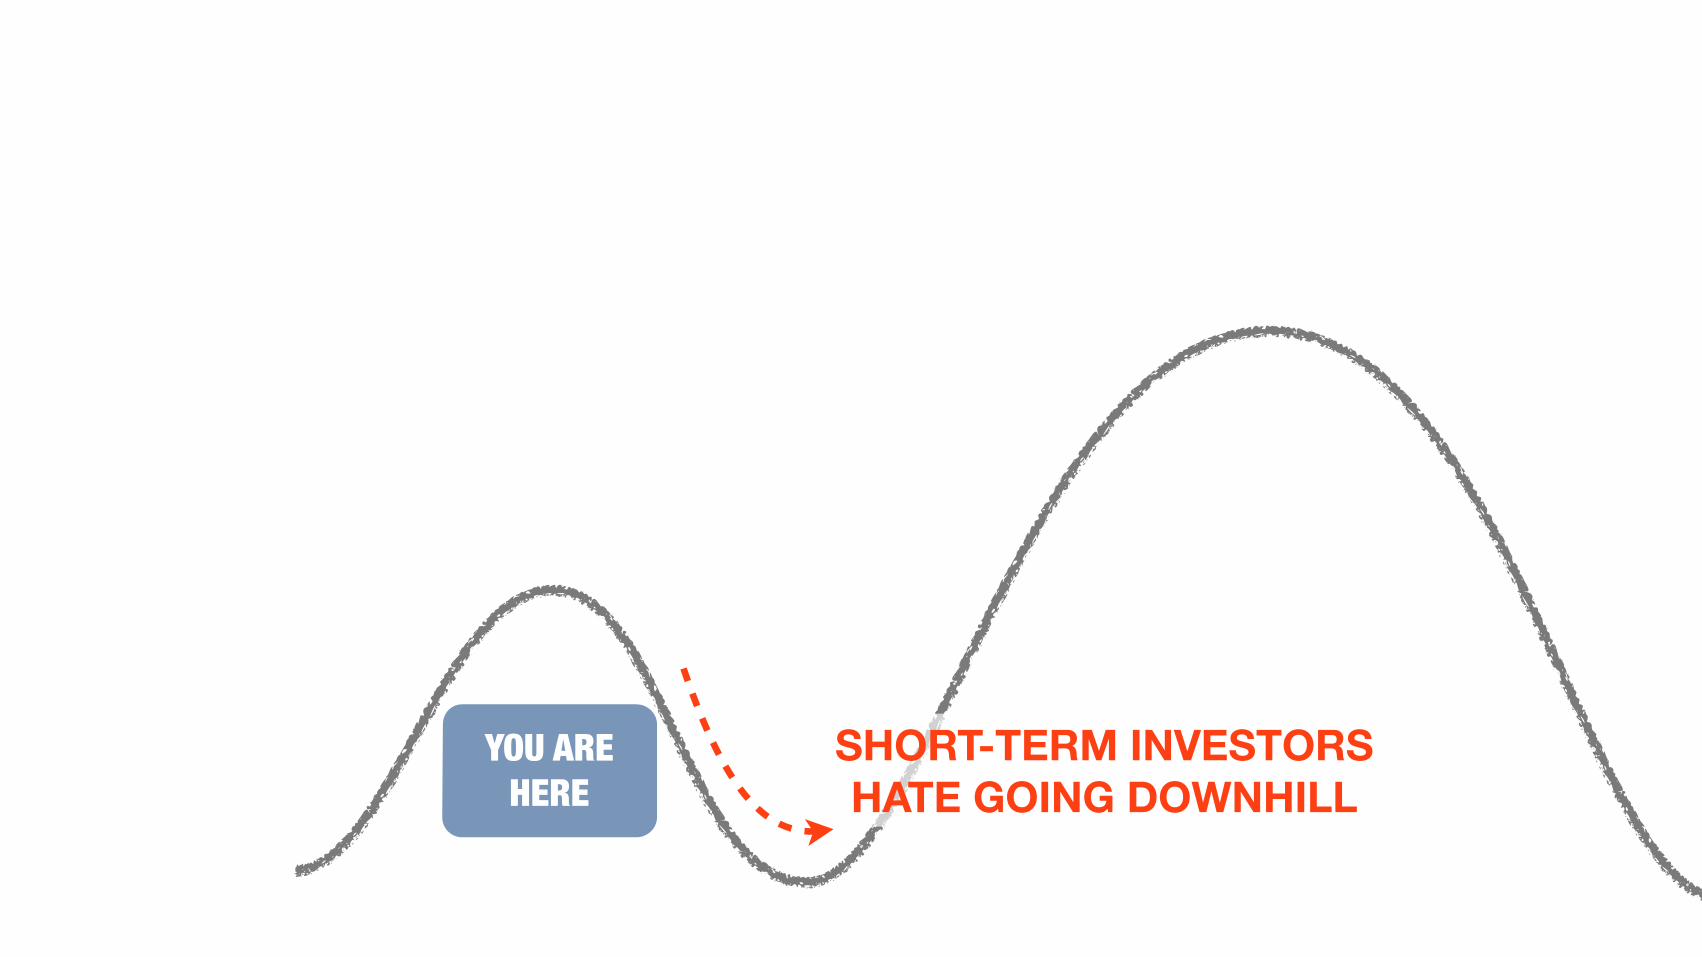
YOU ARE HERE
SHORT-TERM INVESTORSHATE GOING DOWNHILL
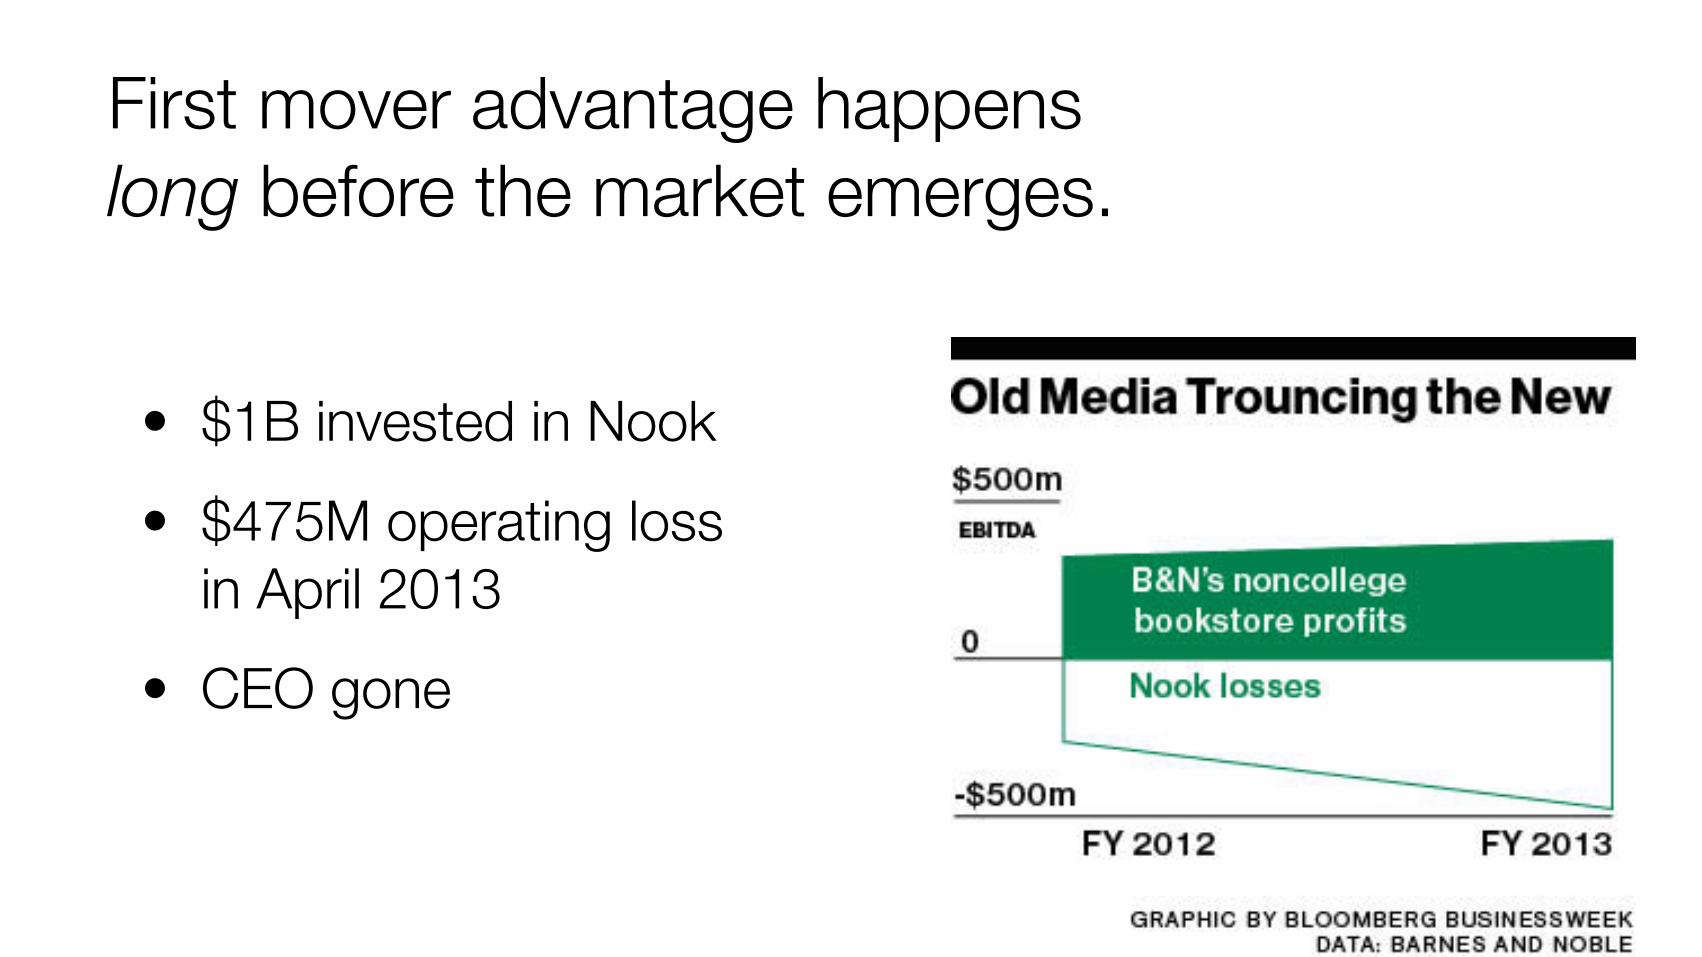
• $1B invested in Nook • $475M operating loss
in April 2013 • CEO gone
First mover advantage happens long before the market emerges.
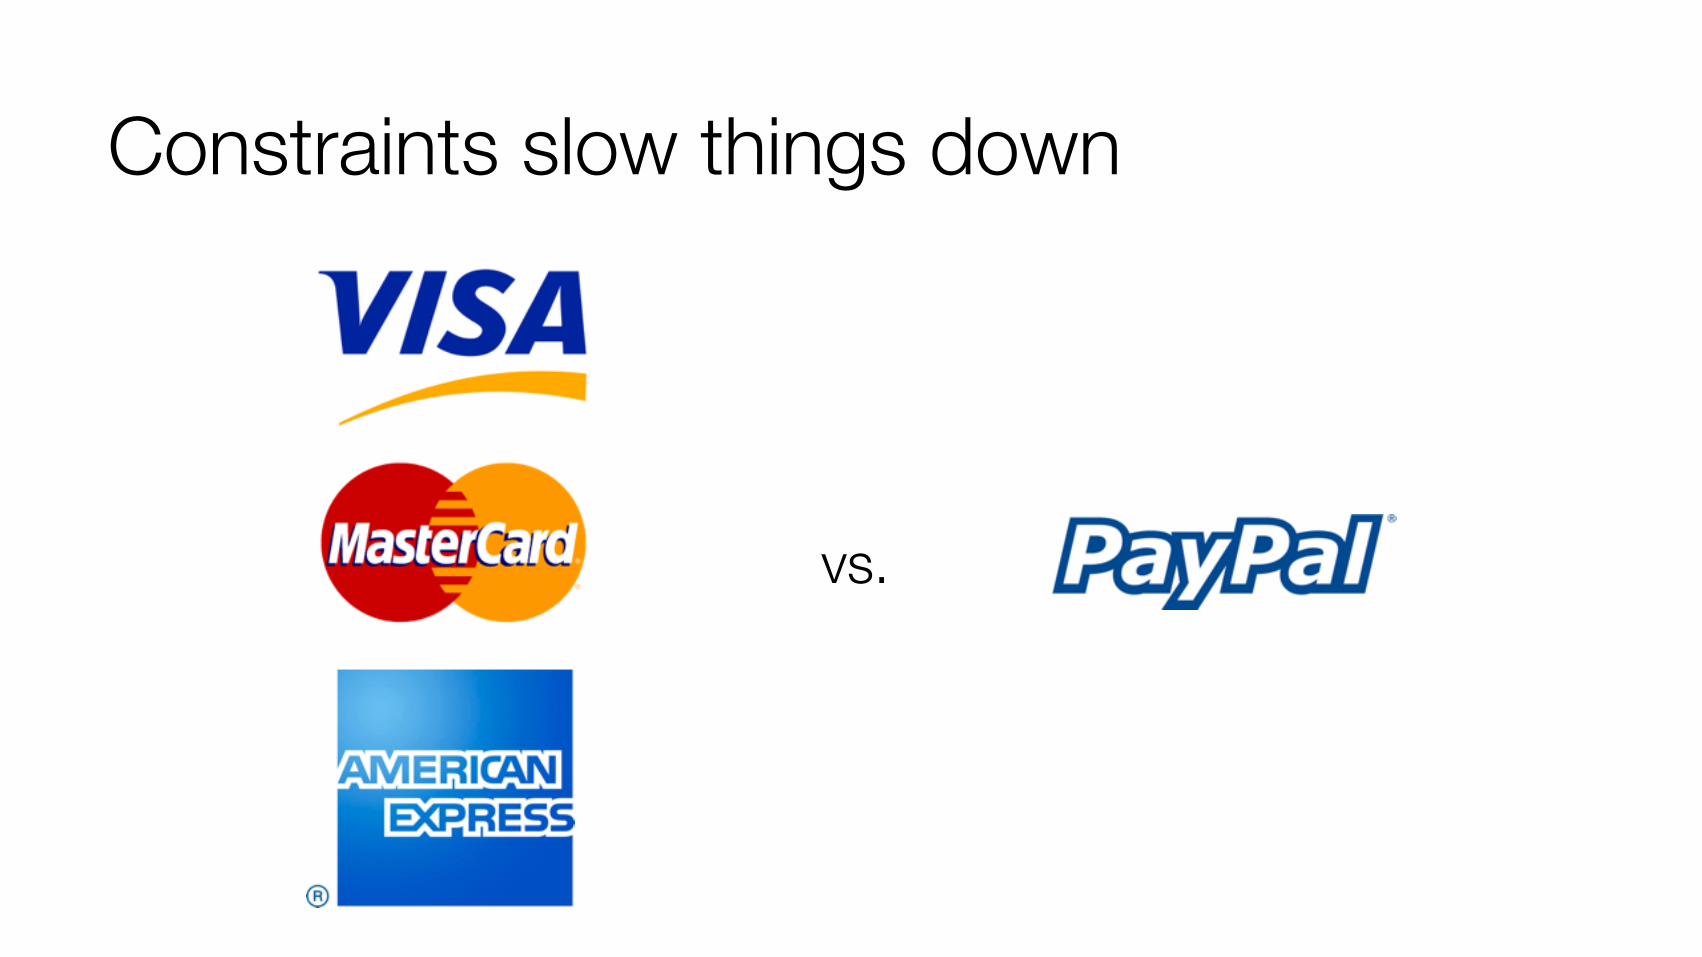
Constraints slow things down
vs.
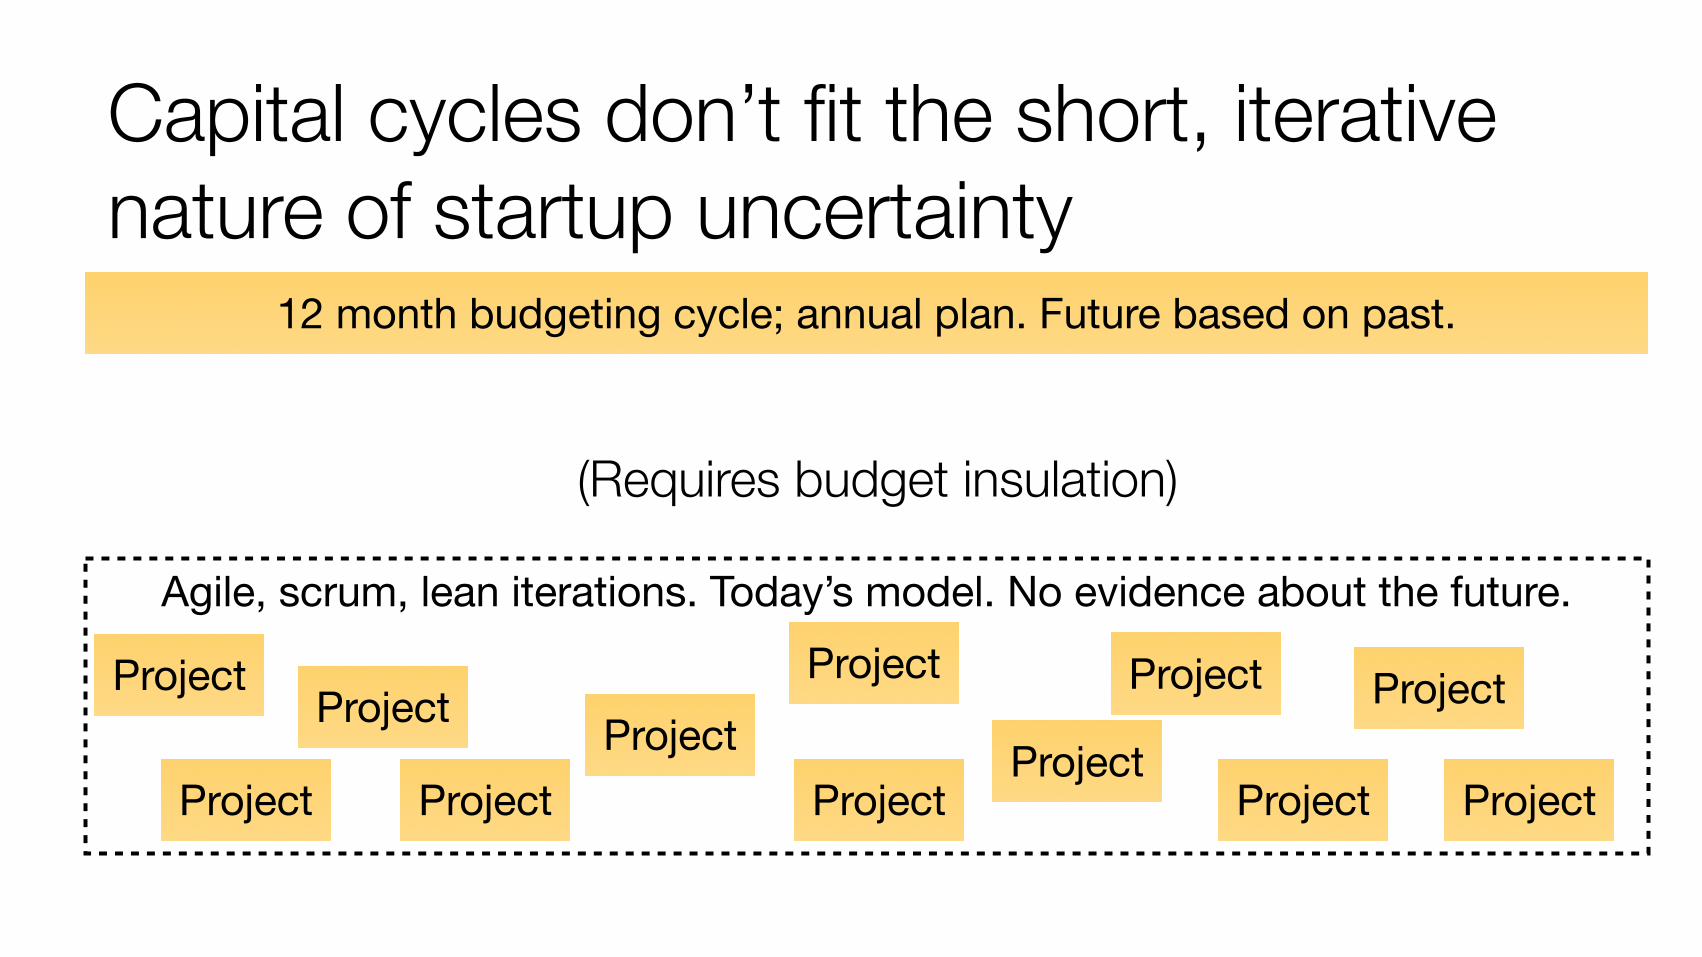
Capital cycles don’t fit the short, iterative nature of startup uncertainty
12 month budgeting cycle; annual plan. Future based on past.
Agile, scrum, lean iterations. Today’s model. No evidence about the future.
Project
Project
Project
ProjectProject
Project
Project
Project
Project
Project
Project
Project
(Requires budget insulation)
Everything to lose:Why big companies need innovation.
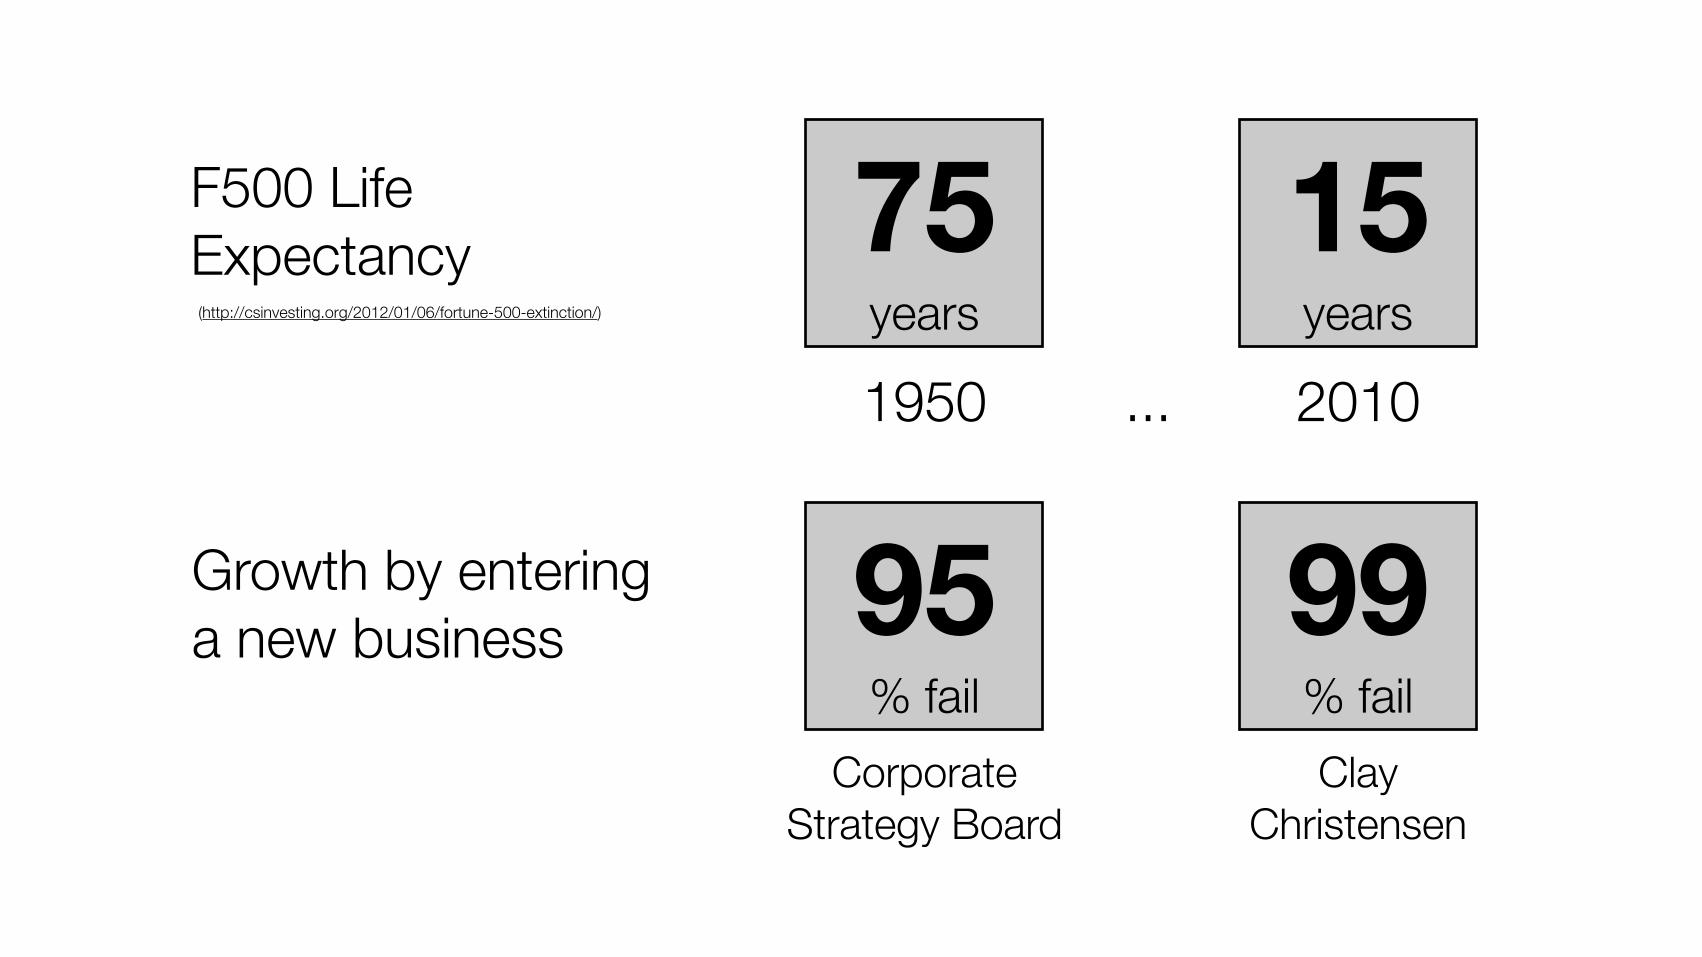
(http://csinvesting.org/2012/01/06/fortune-500-extinction/)
F500 Life Expectancy
Growth by entering a new business 95
% failCorporate
Strategy Board
99% failClay
Christensen
75 years
15 years
1950 2010...
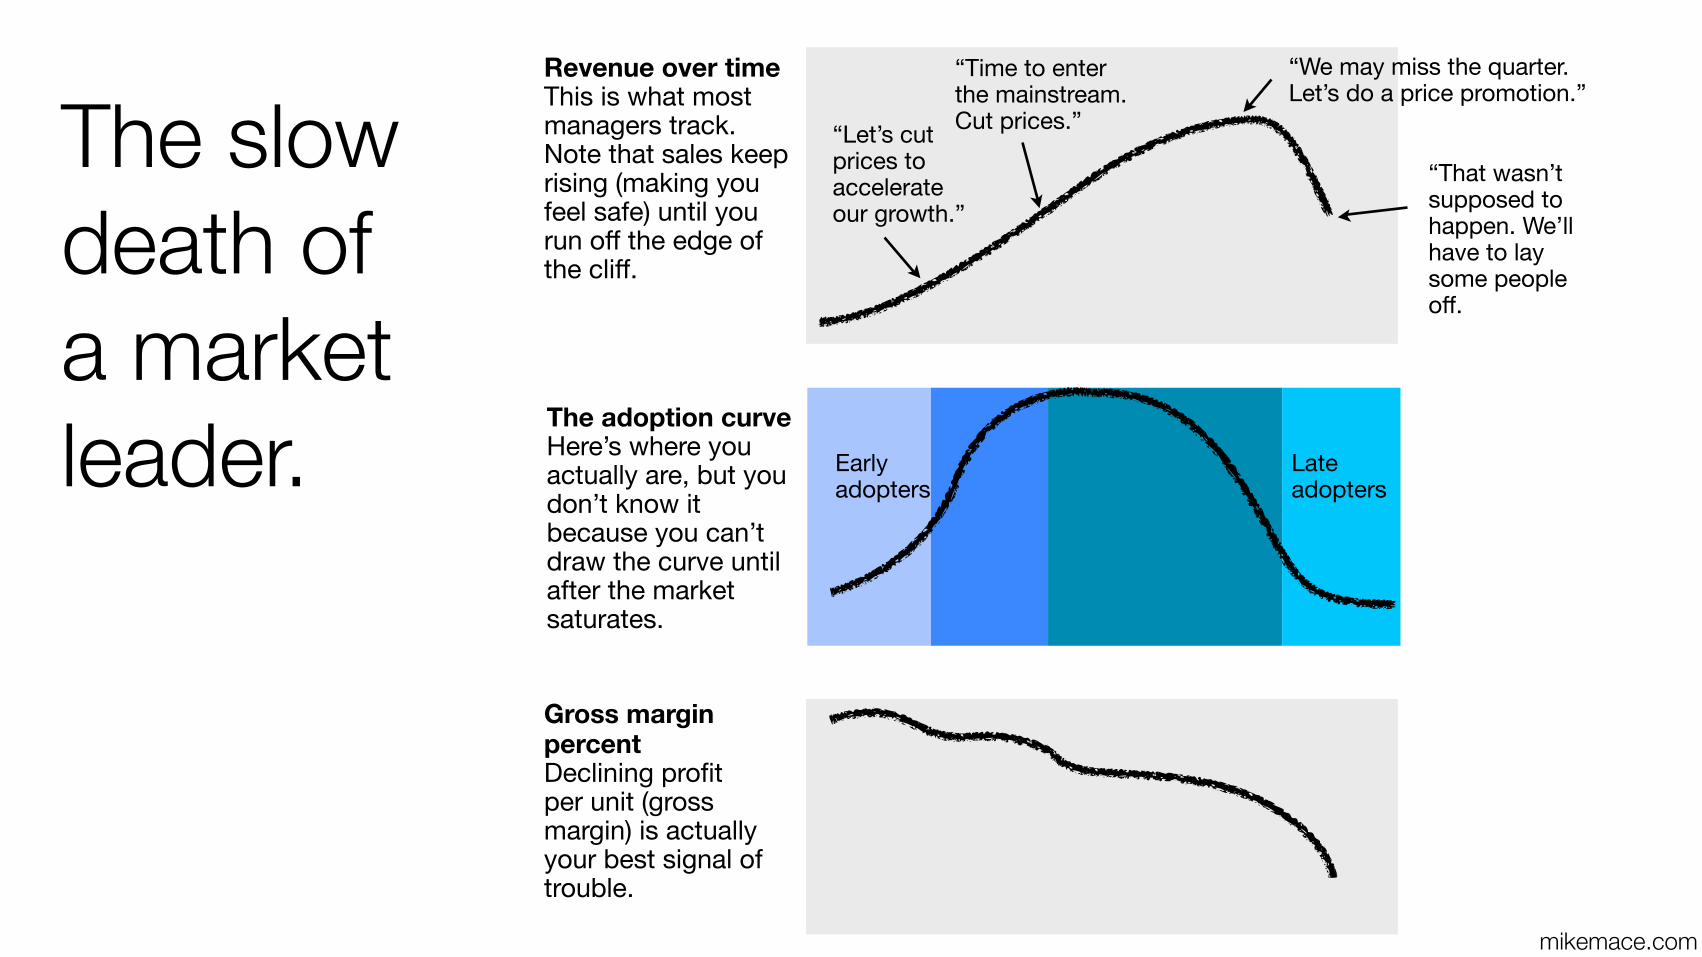
mikemace.com
The slow death of a market leader.
“Let’s cut prices to accelerate our growth.”
“Time to enter the mainstream. Cut prices.”
“We may miss the quarter. Let’s do a price promotion.”
“That wasn’t supposed to happen. We’ll have to lay some people off.
Revenue over timeThis is what most managers track. Note that sales keep rising (making you feel safe) until you run off the edge of the cliff.
The adoption curve Here’s where you actually are, but you don’t know it because you can’t draw the curve until after the market saturates.
Early adopters
Late adopters
Gross margin percentDeclining profit per unit (gross margin) is actually your best signal of trouble.

In other words, if your job is change you have your work cut out for you.

A dose of pragmatism
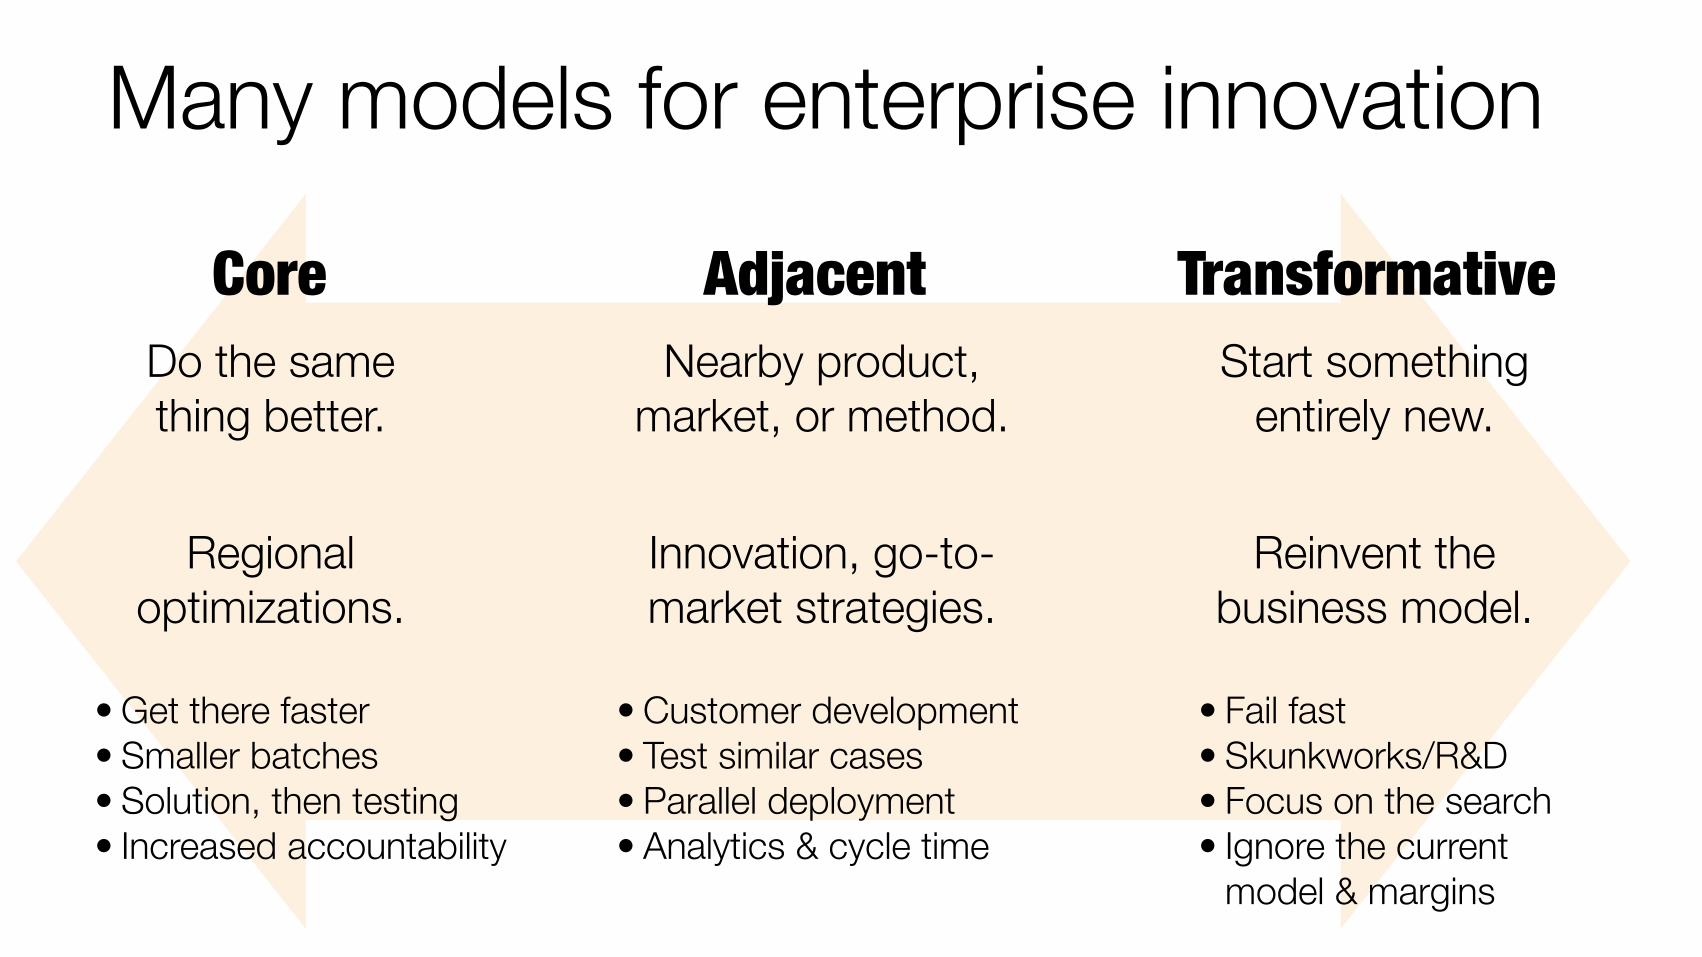
Many models for enterprise innovation
Core Adjacent TransformativeDo the same thing better.
Nearby product, market, or method.
Start something entirely new.
Regionaloptimizations.
Innovation, go-to-market strategies.
Reinvent the business model.
• Get there faster • Smaller batches • Solution, then testing • Increased accountability
• Customer development • Test similar cases • Parallel deployment • Analytics & cycle time
• Fail fast • Skunkworks/R&D • Focus on the search • Ignore the current
model & margins
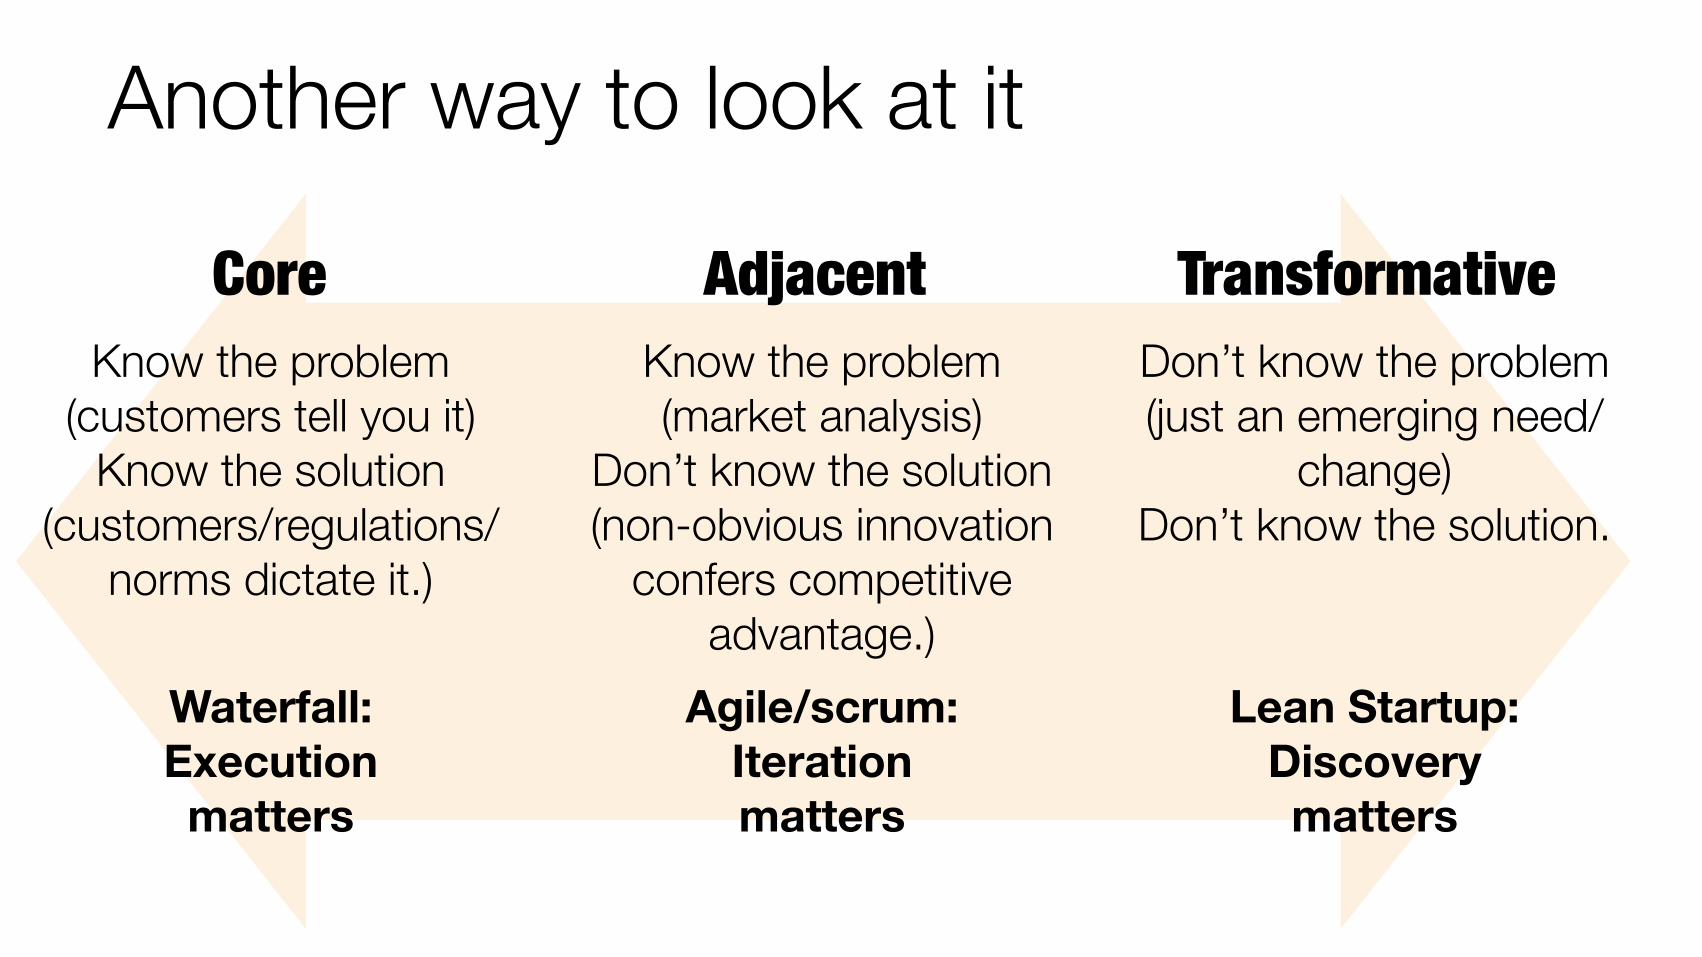
Another way to look at it
Core Adjacent TransformativeKnow the problem
(customers tell you it) Know the solution
(customers/regulations/norms dictate it.)
Know the problem (market analysis)
Don’t know the solution (non-obvious innovation
confers competitive advantage.)
Don’t know the problem (just an emerging need/
change) Don’t know the solution.
Waterfall:Execution matters
Agile/scrum:Iteration matters
Lean Startup: Discovery matters
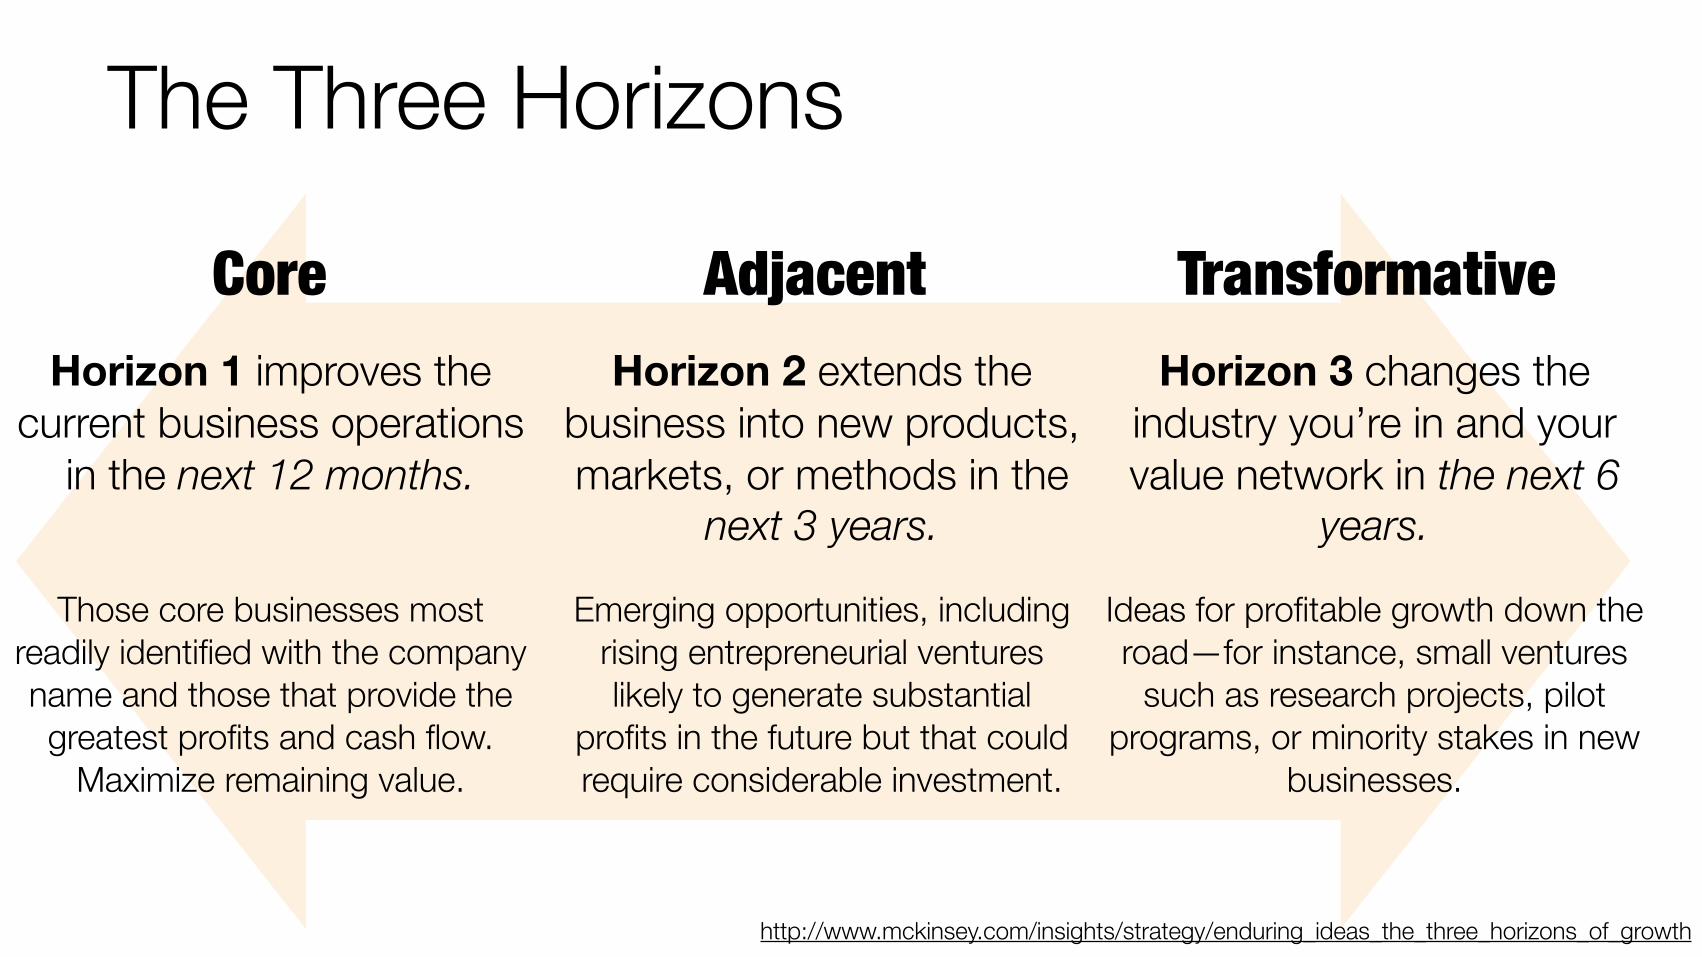
The Three Horizons
Core Adjacent Transformative
Those core businesses most readily identified with the company name and those that provide the greatest profits and cash flow.
Maximize remaining value.
Emerging opportunities, including rising entrepreneurial ventures likely to generate substantial
profits in the future but that could require considerable investment.
Ideas for profitable growth down the road—for instance, small ventures
such as research projects, pilot programs, or minority stakes in new
businesses.
Horizon 1 improves the current business operations
in the next 12 months.
Horizon 2 extends the business into new products, markets, or methods in the
next 3 years.
Horizon 3 changes the industry you’re in and your value network in the next 6
years.
http://www.mckinsey.com/insights/strategy/enduring_ideas_the_three_horizons_of_growth
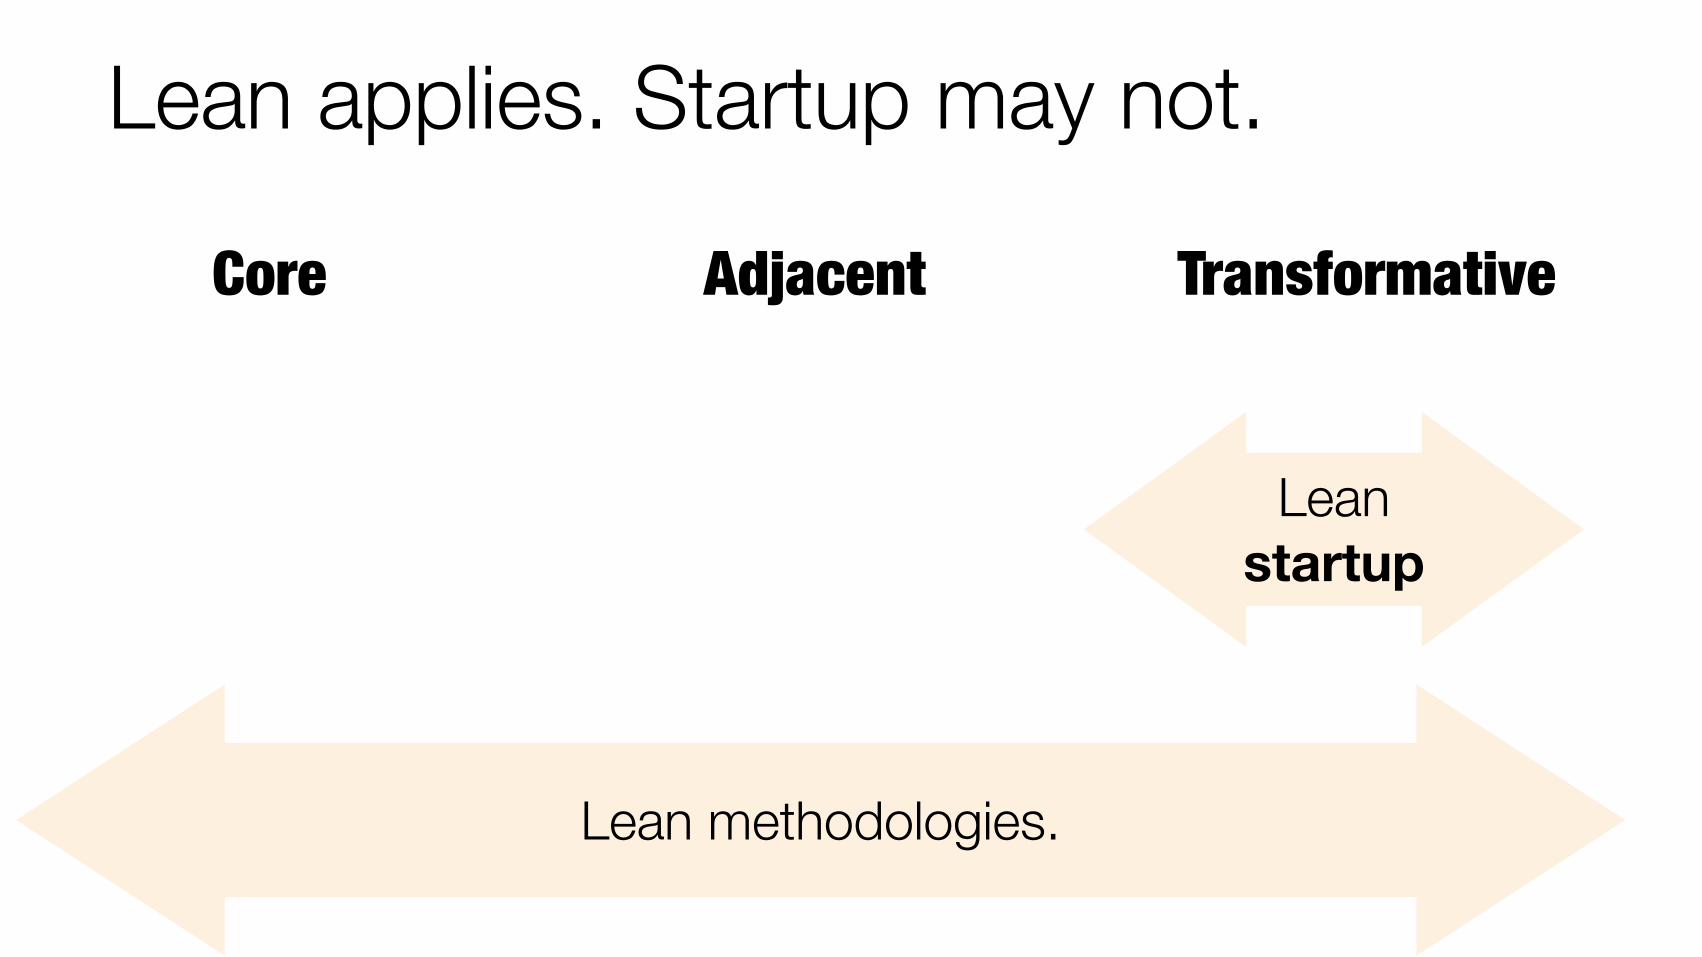
Lean applies. Startup may not.
Lean methodologies.
Leanstartup
Core Adjacent Transformative
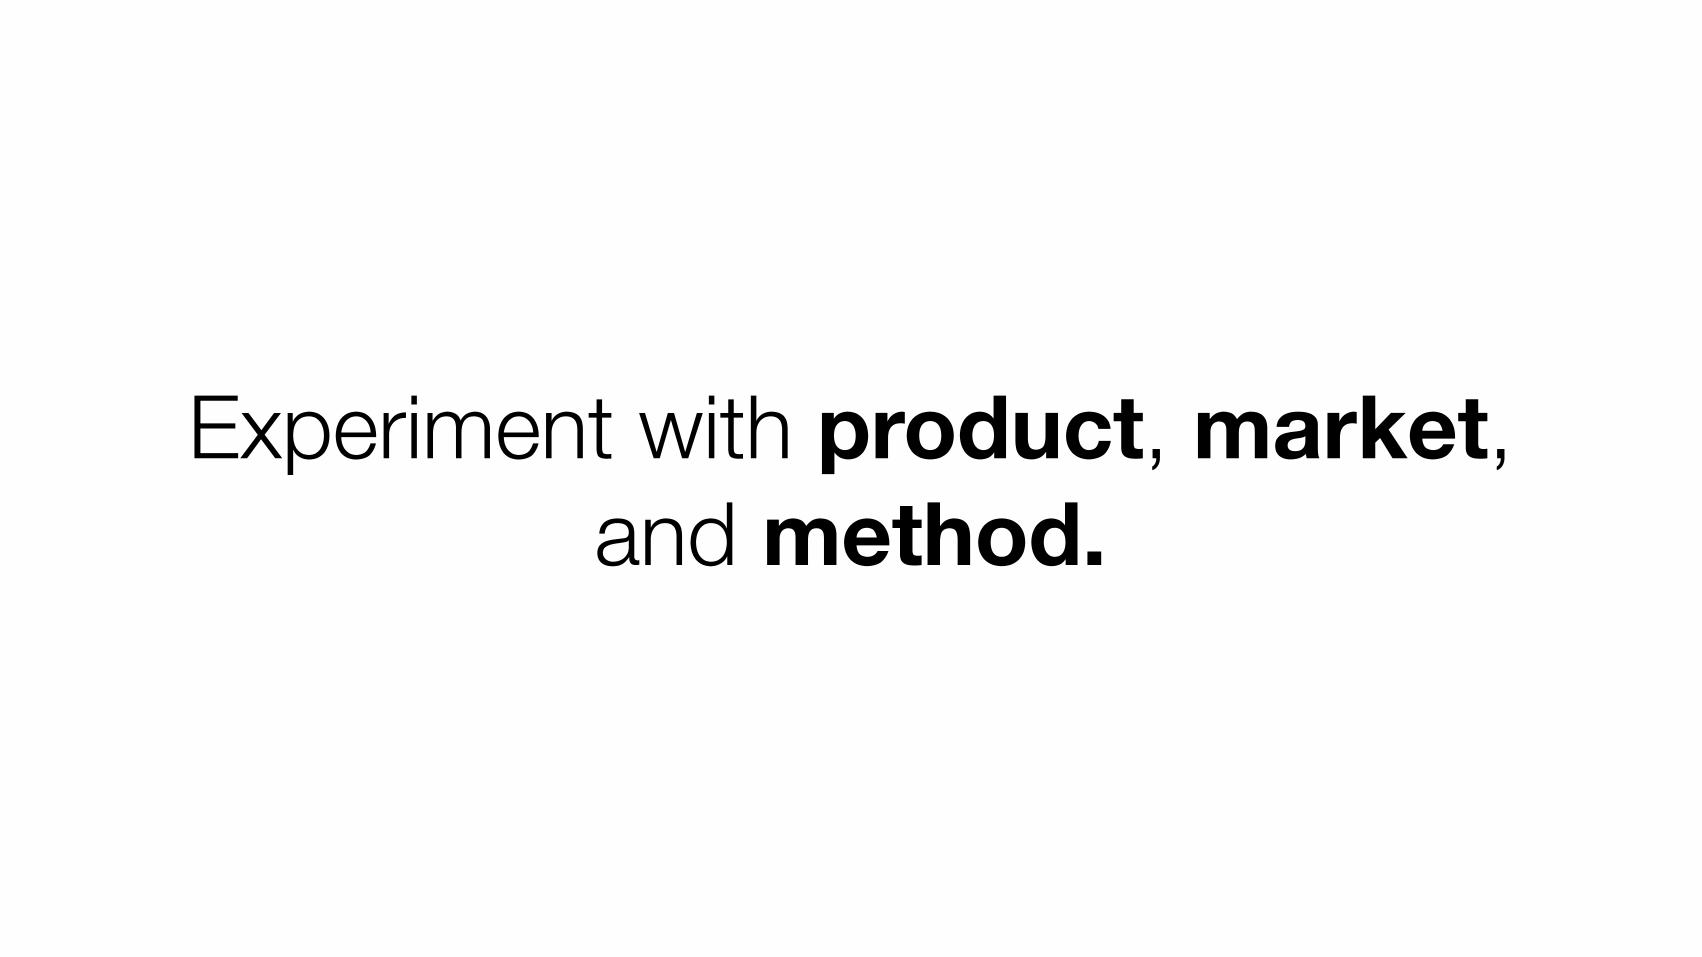
Experiment with product, market, and method.
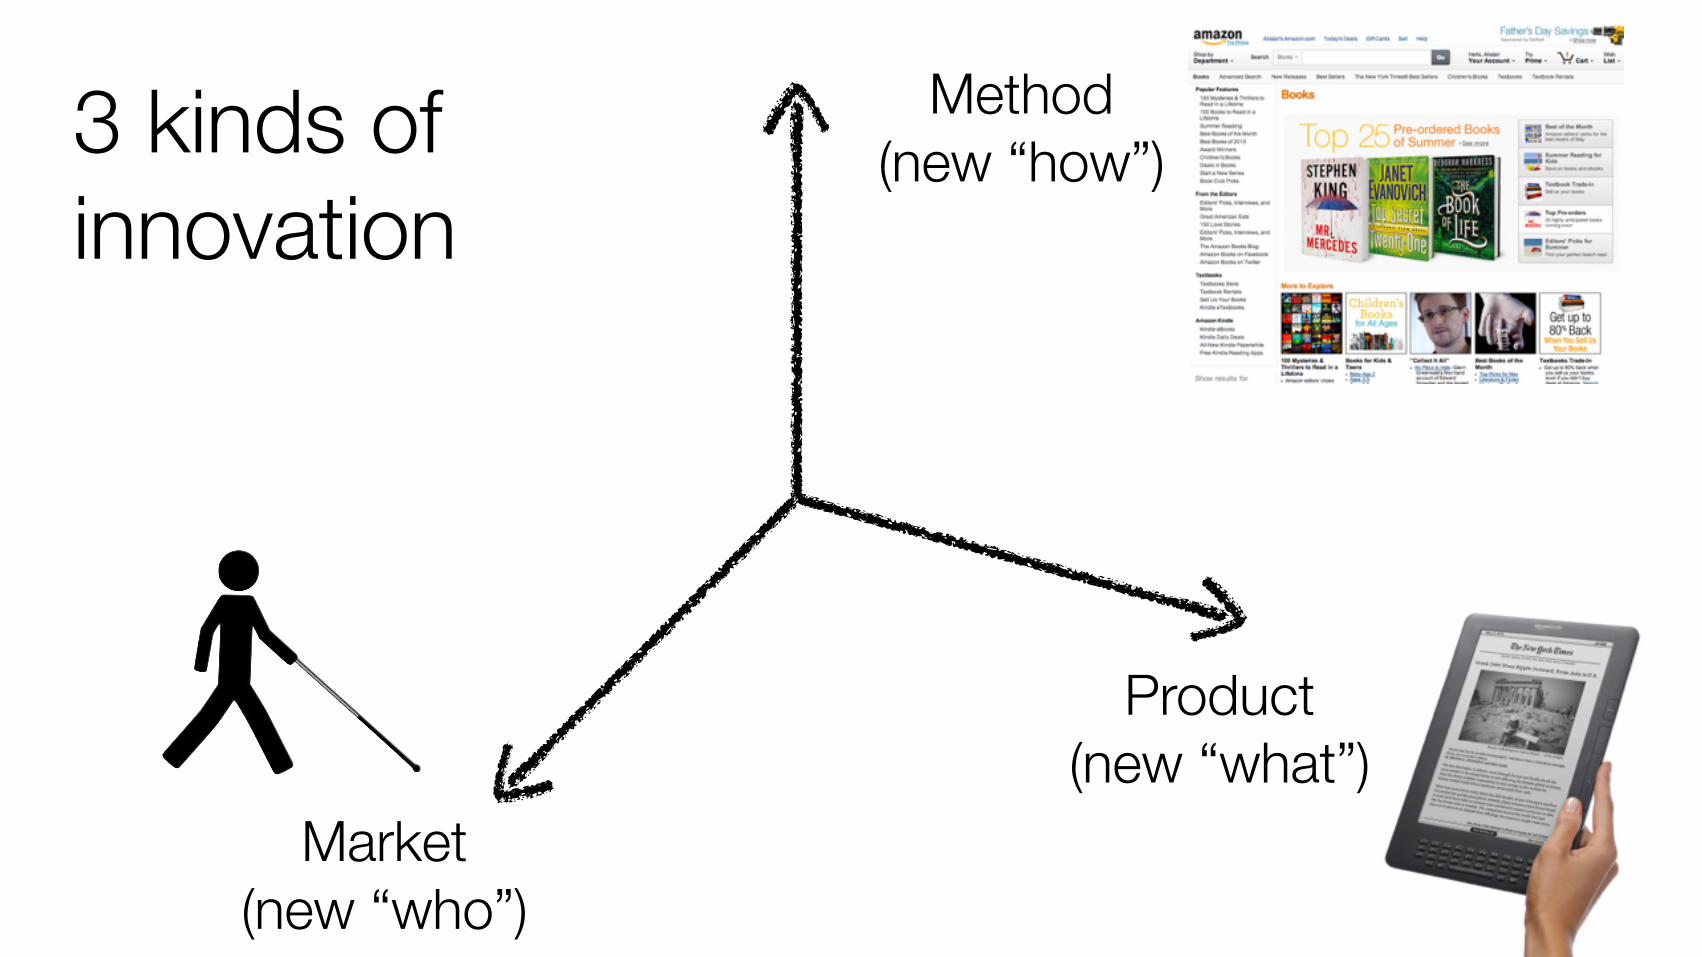
Product (new “what”)
Market (new “who”)
Method (new “how”)3 kinds of
innovation
Product (new “what”)
Market (new “who”)
Method (new “how”)
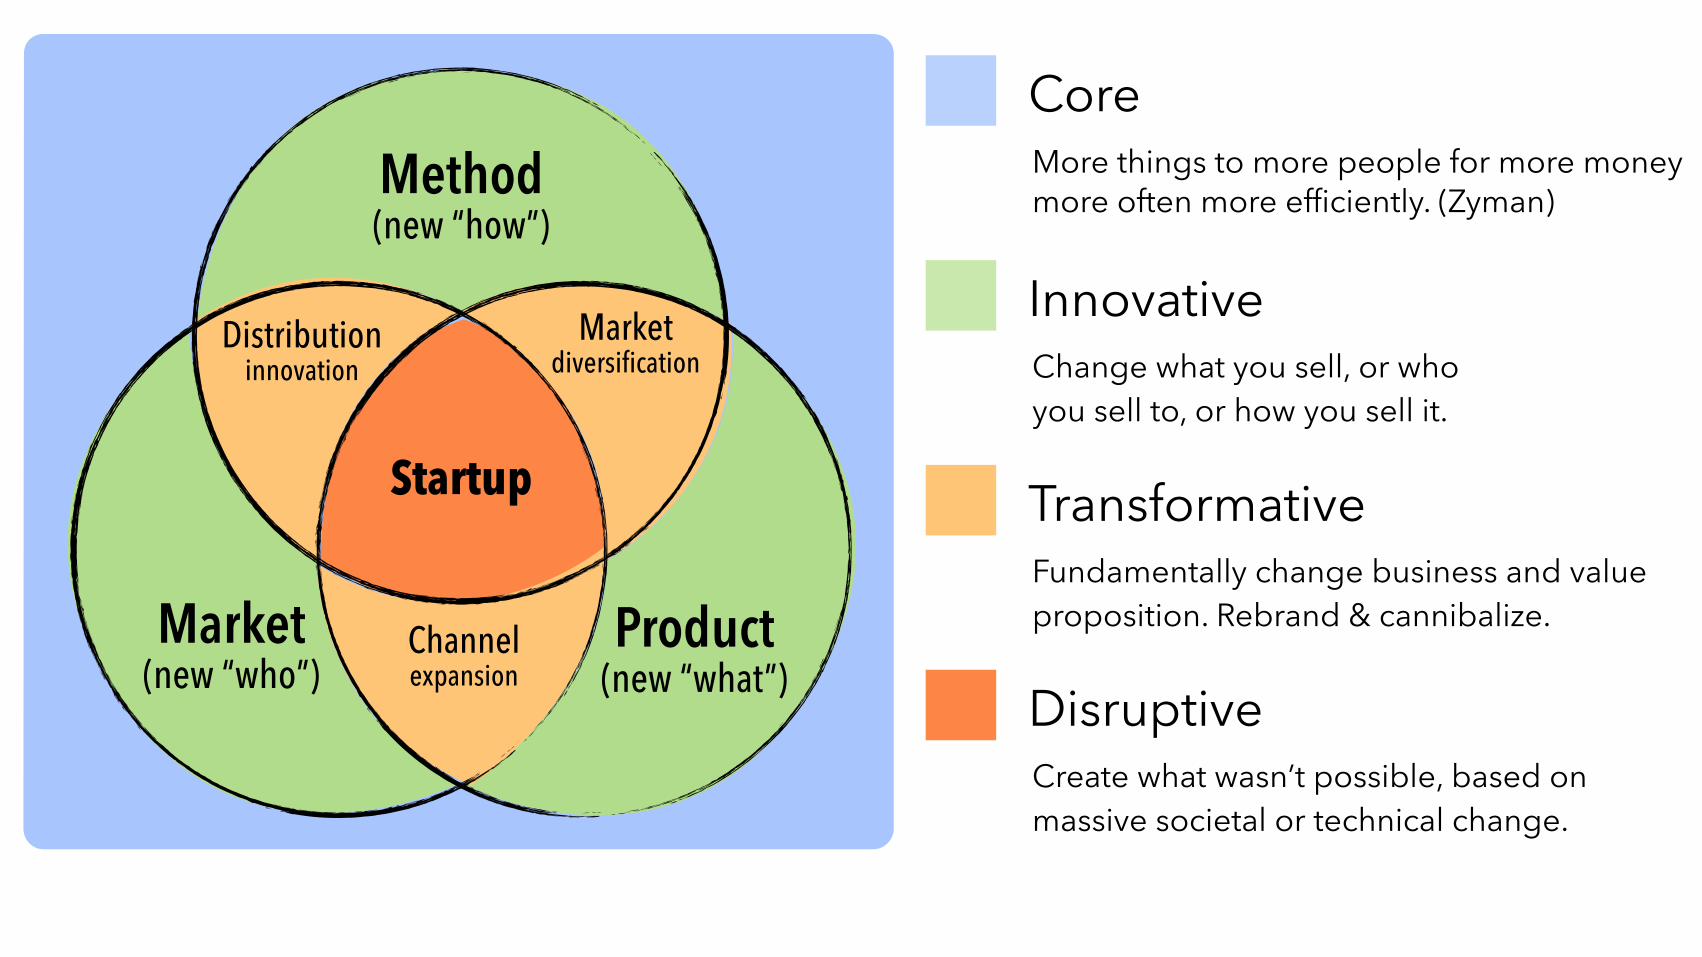
Startup
Distributioninnovation
Marketdiversification
Channelexpansion
Disruptive
Innovative
Transformative
CoreMore things to more people for more money more often more efficiently. (Zyman)
Change what you sell, or who you sell to, or how you sell it.
Fundamentally change business and value proposition. Rebrand & cannibalize.
Create what wasn’t possible, based on massive societal or technical change.

Engine as a service

http://www.nasa.gov/images/content/365835main_airplane_noise_qtd2_3024x2016.jpgEngine as a service
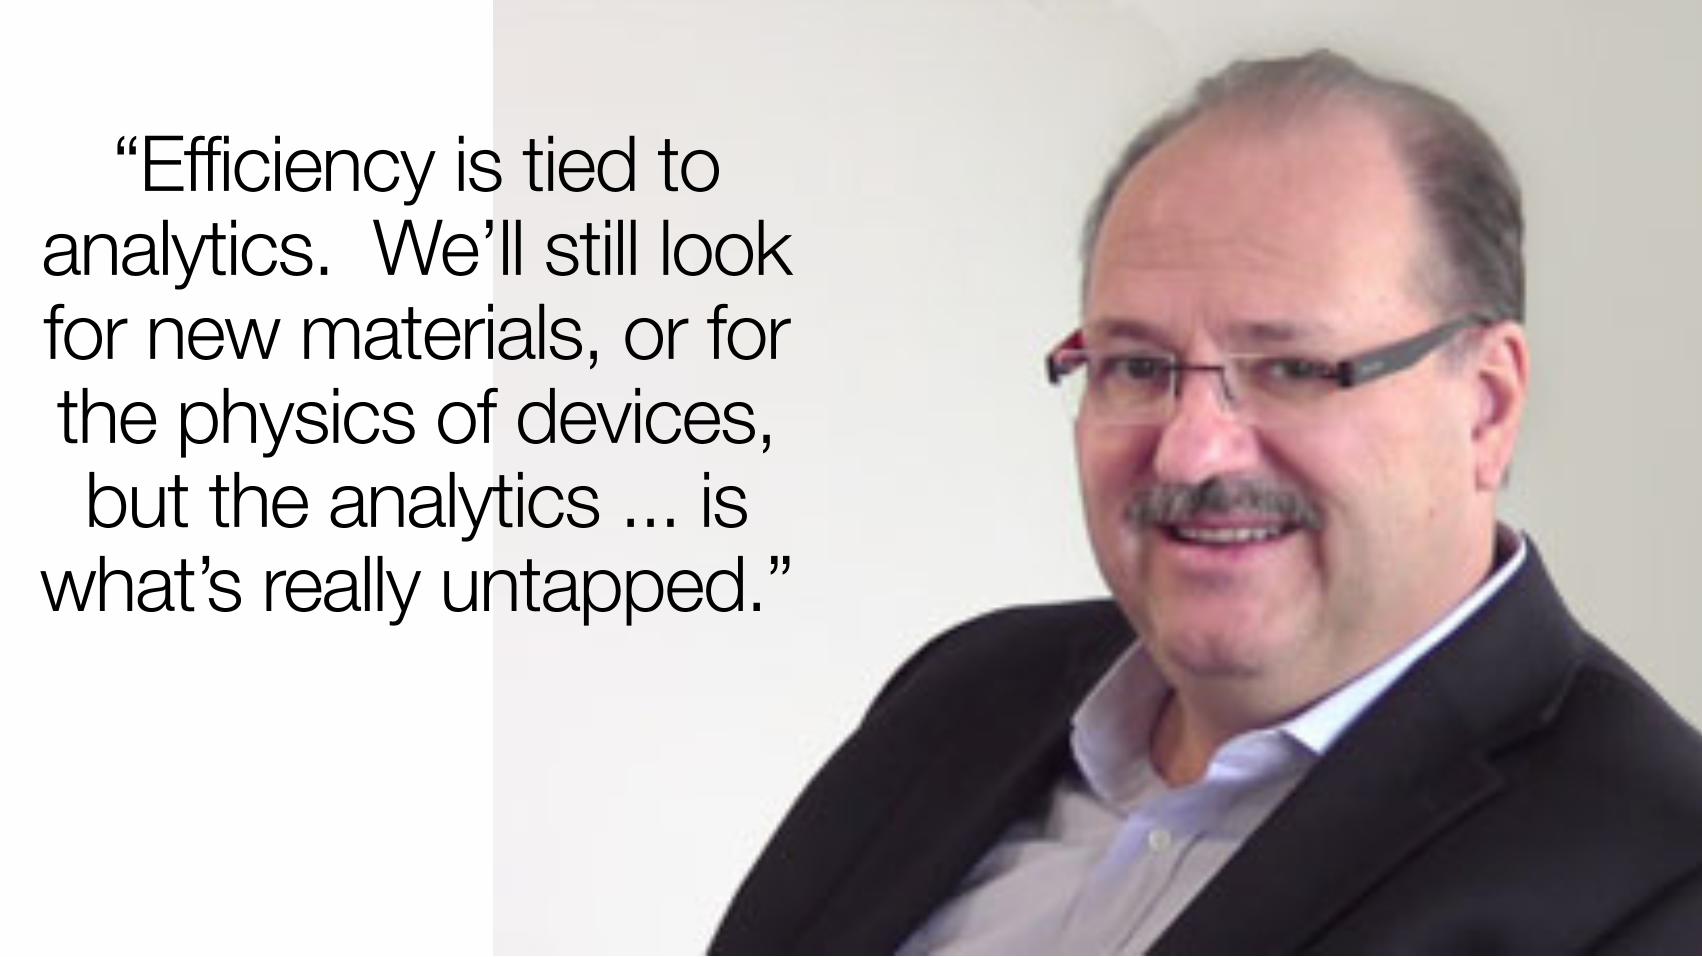
“Efficiency is tied to analytics. We’ll still look for new materials, or for the physics of devices, but the analytics ... is
what’s really untapped.”
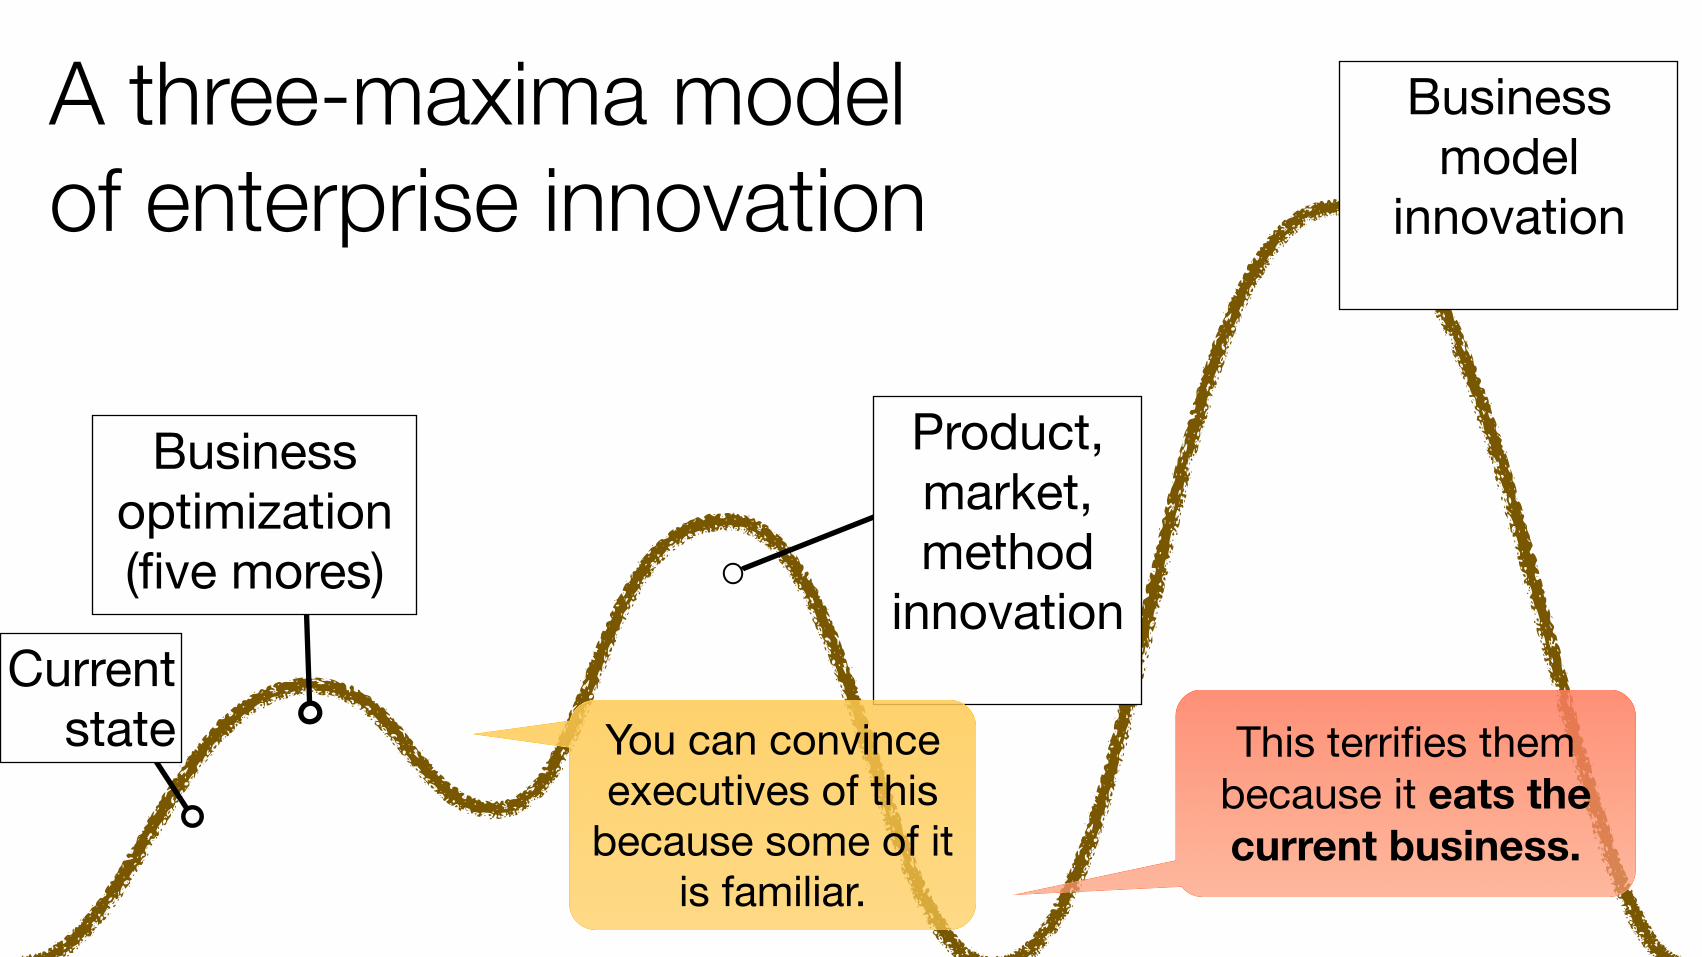
Currentstate
Business optimization (five mores)
Product,market,method
innovation
Business model
innovation
You can convince executives of this
because some of it is familiar.
This terrifies them because it eats the current business.
A three-maxima model of enterprise innovation
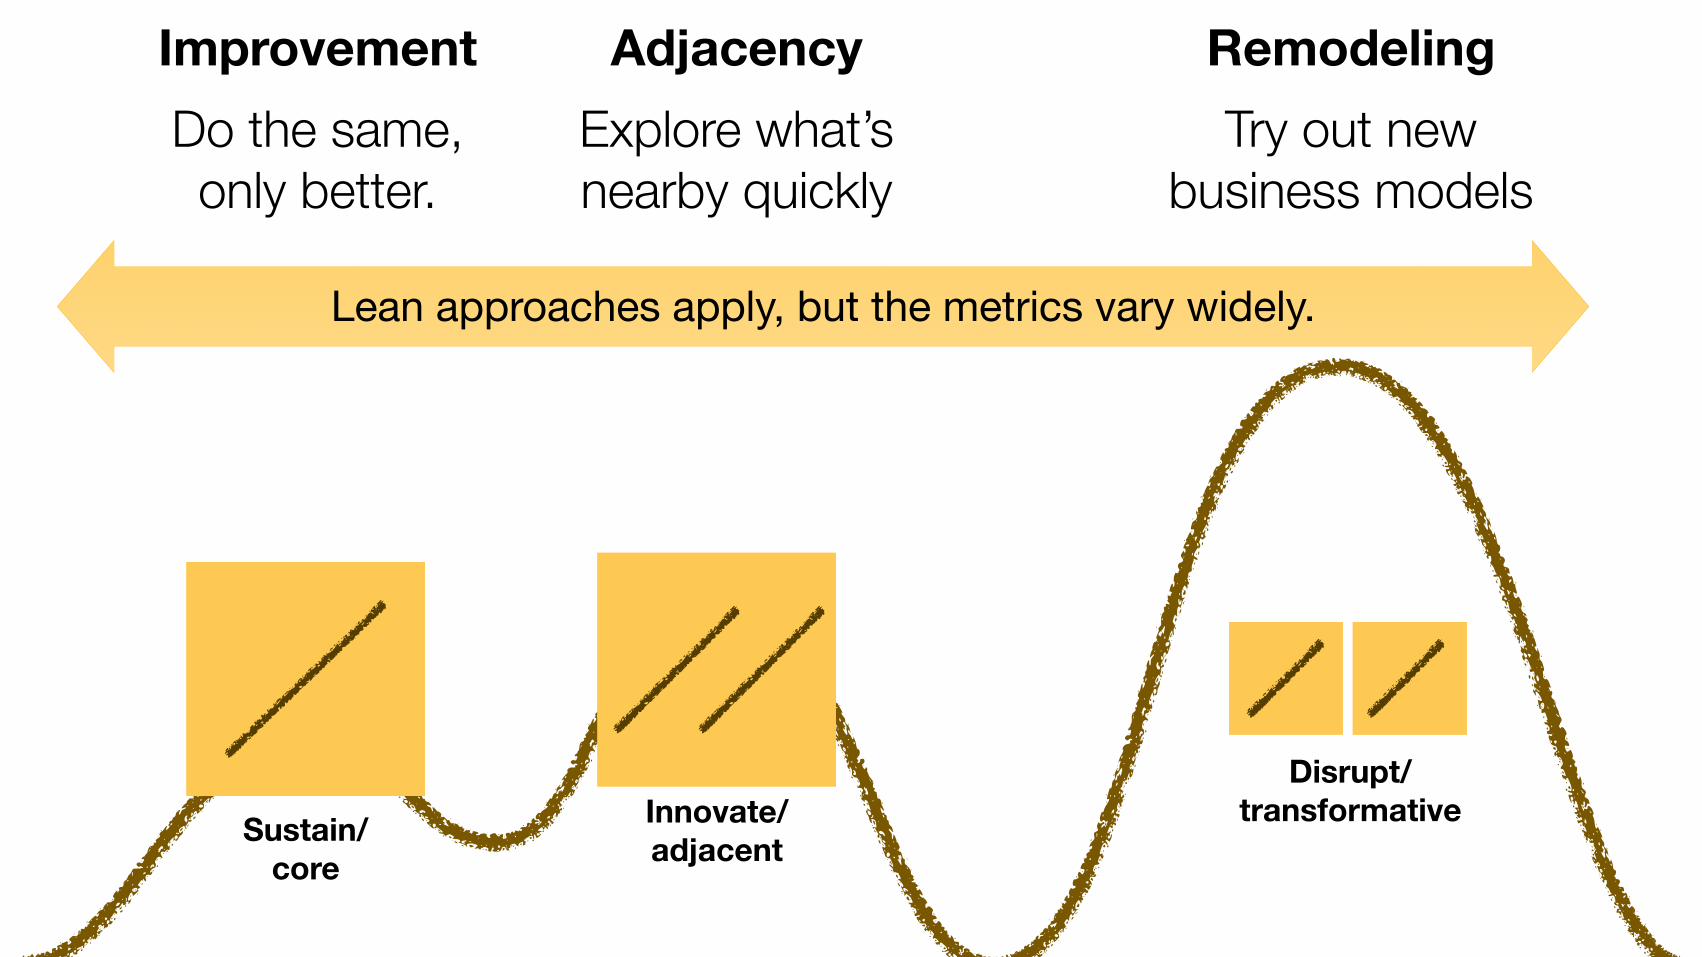
Improvement Adjacency RemodelingDo the same,only better.
Explore what’snearby quickly
Try out newbusiness models
Lean approaches apply, but the metrics vary widely.
Sustain/core
Innovate/adjacent
Disrupt/transformative
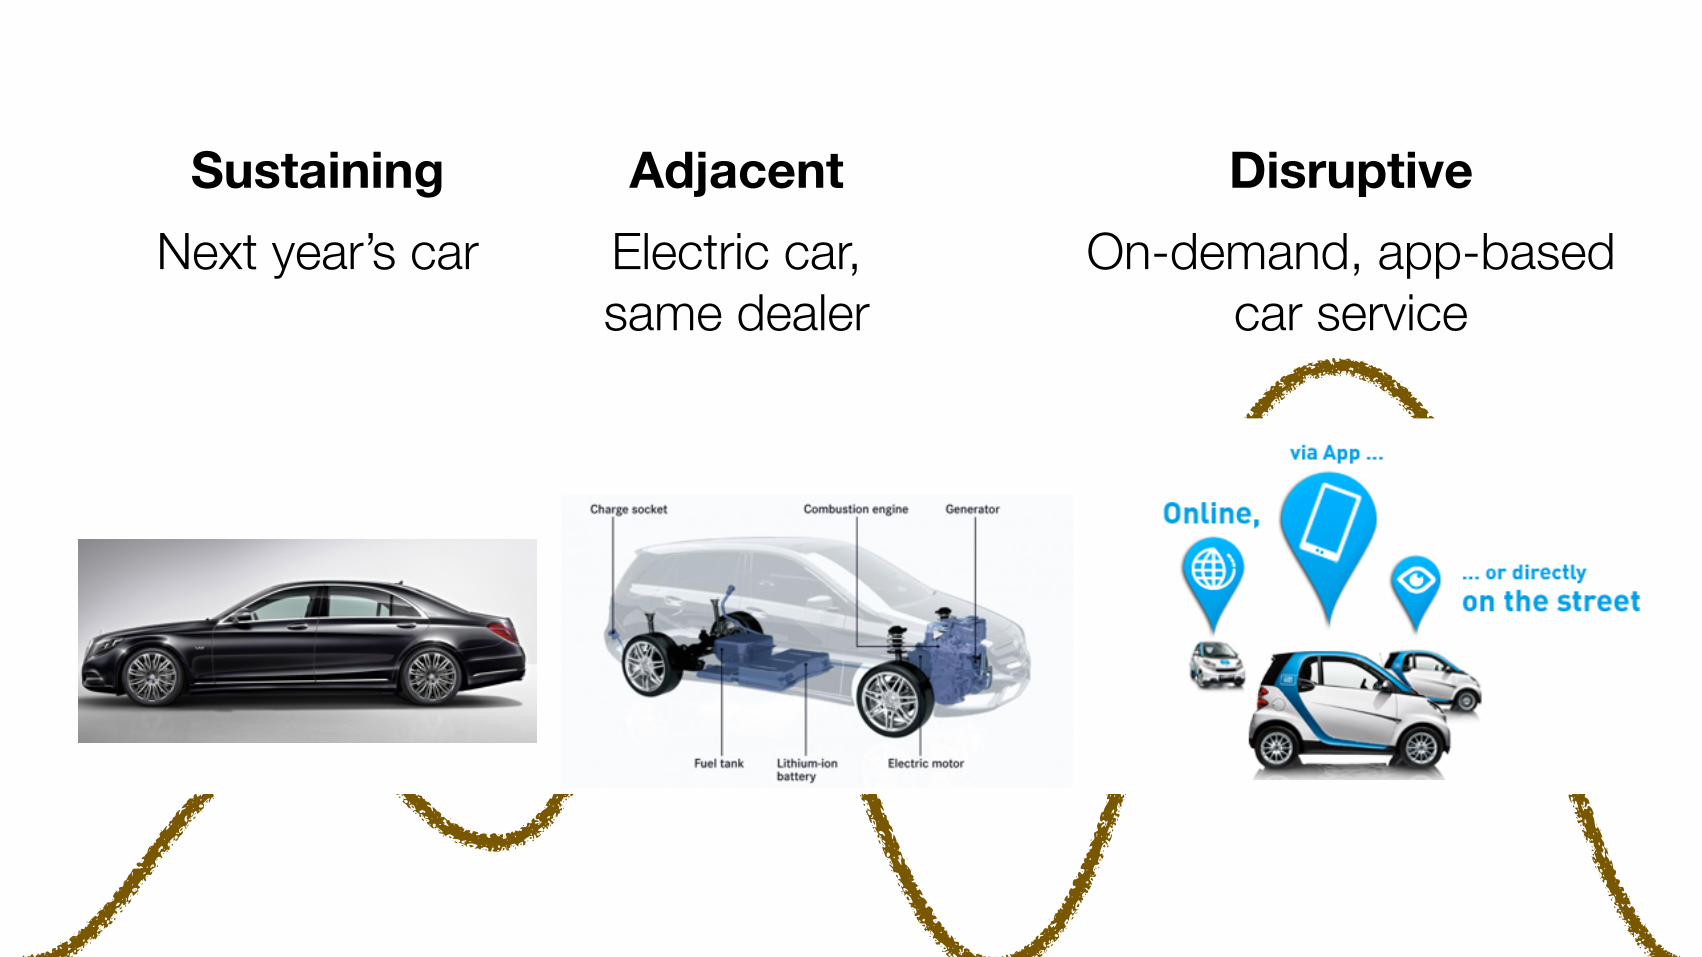
Sustaining Adjacent DisruptiveNext year’s car Electric car,
same dealerOn-demand, app-based
car service
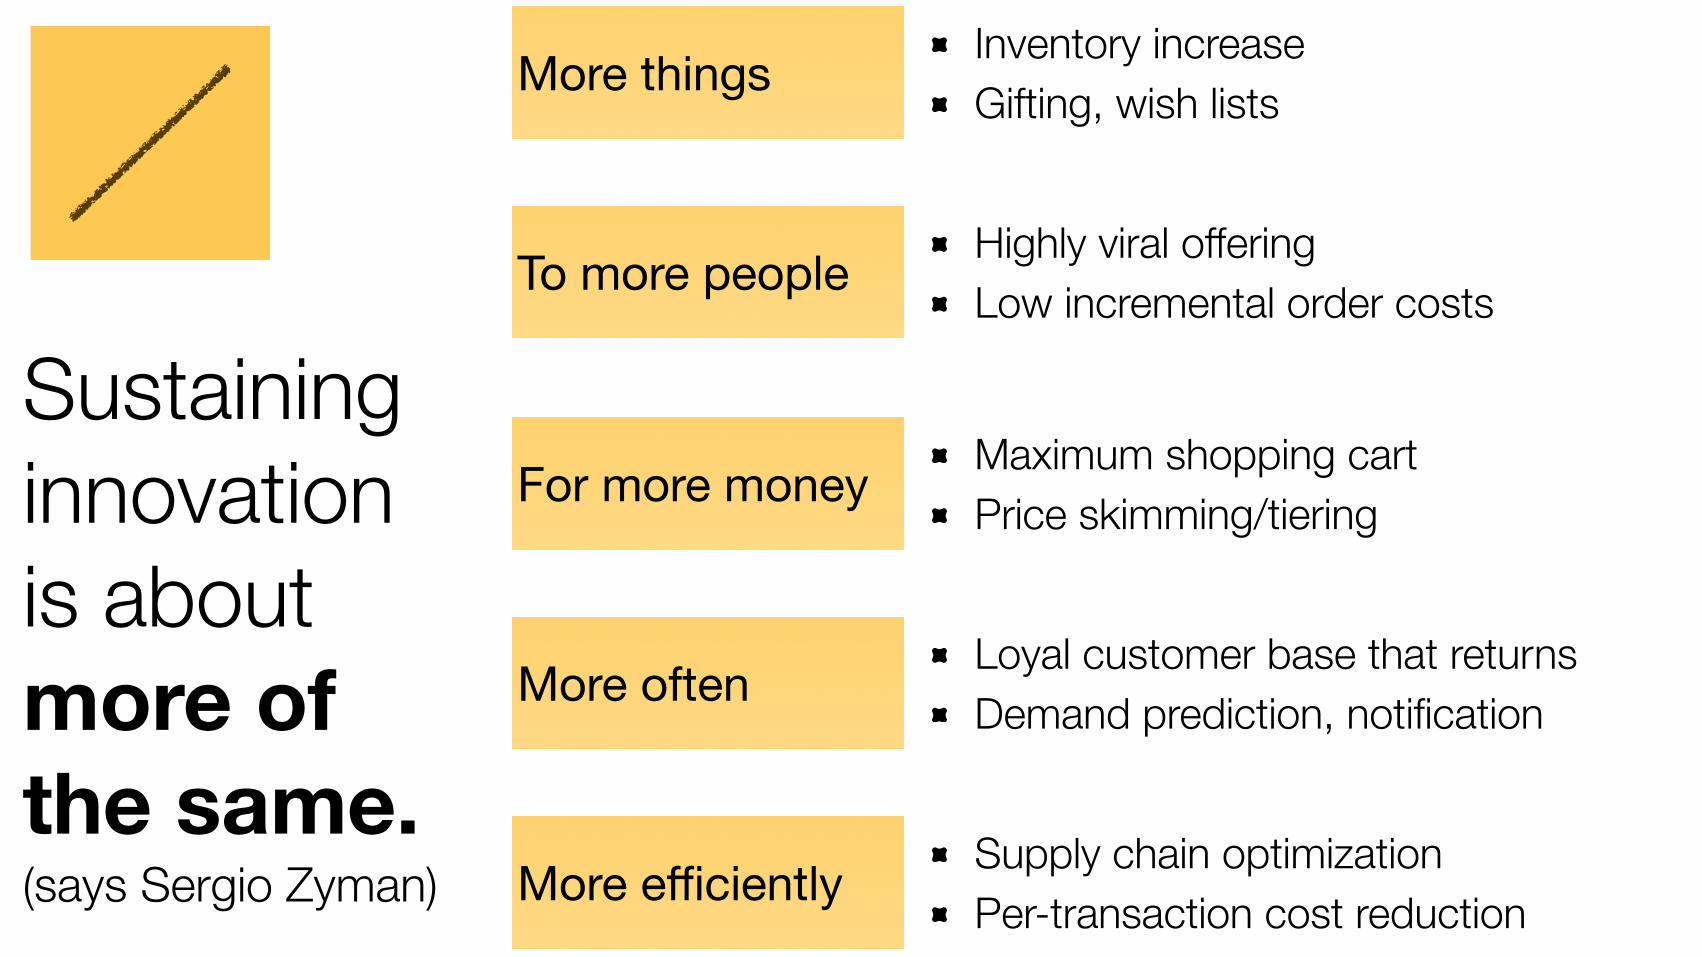
Sustaining innovation is about more of the same. (says Sergio Zyman)
More things
To more people
For more money
More often
More efficiently Supply chain optimization Per-transaction cost reduction
Loyal customer base that returns Demand prediction, notification
Maximum shopping cart Price skimming/tiering
Highly viral offering Low incremental order costs
Inventory increase Gifting, wish lists
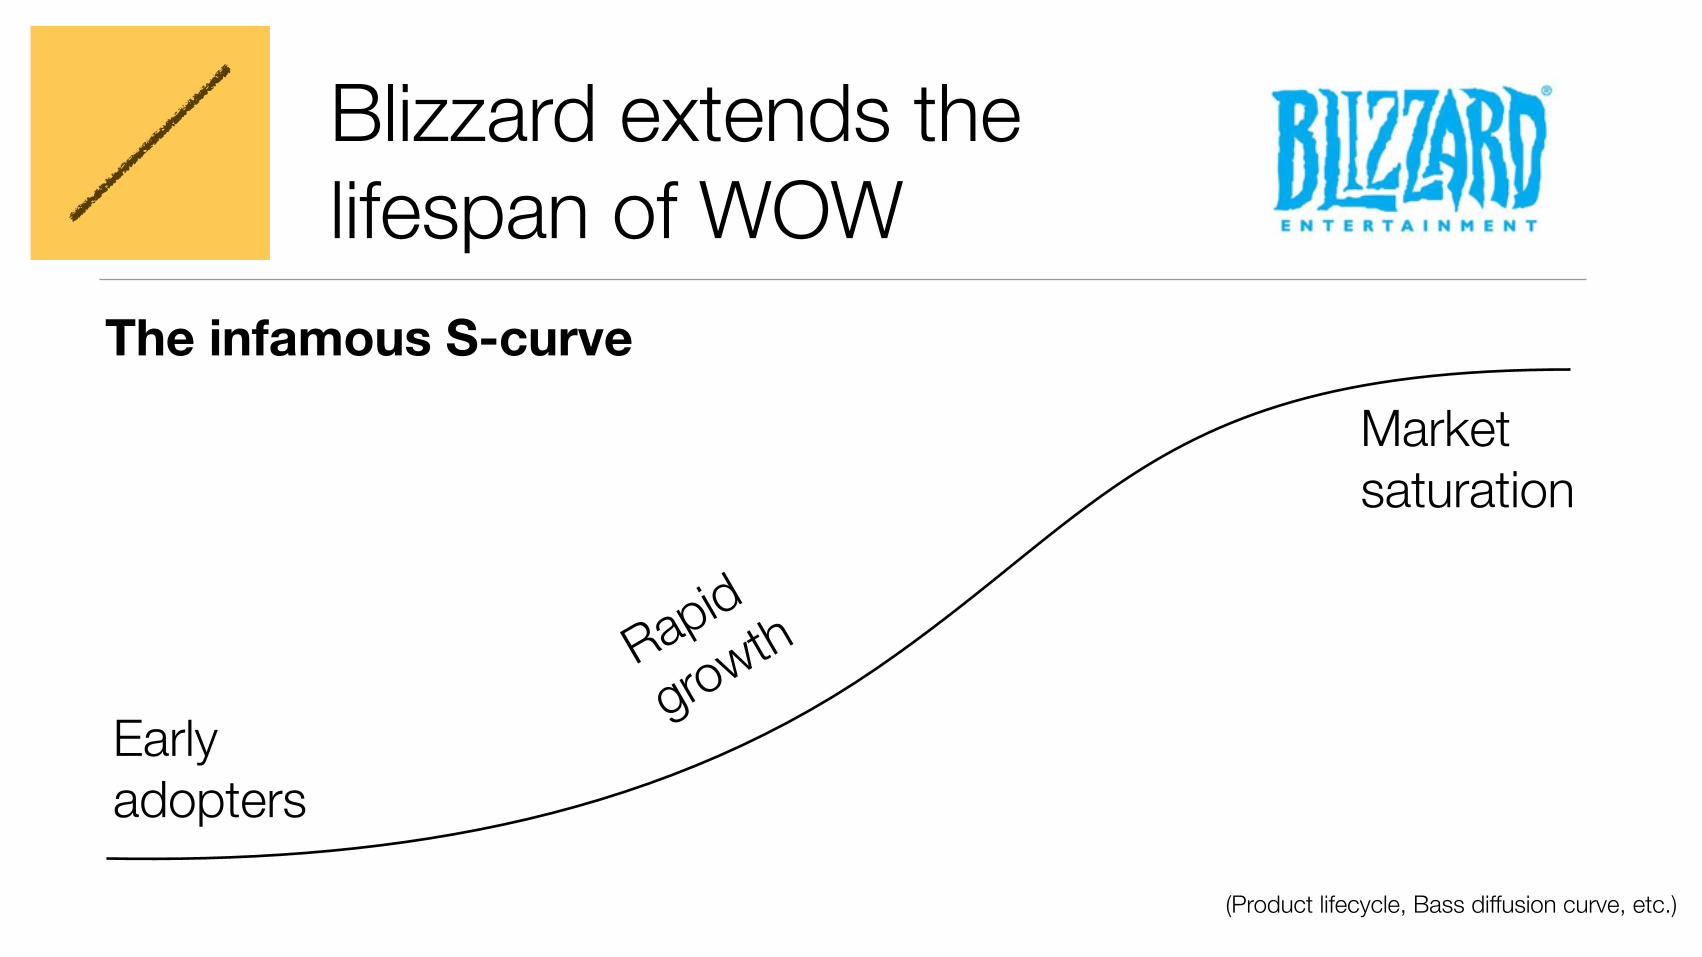
Blizzard extends the lifespan of WOW
Earlyadopters
Rapid
growth
Marketsaturation
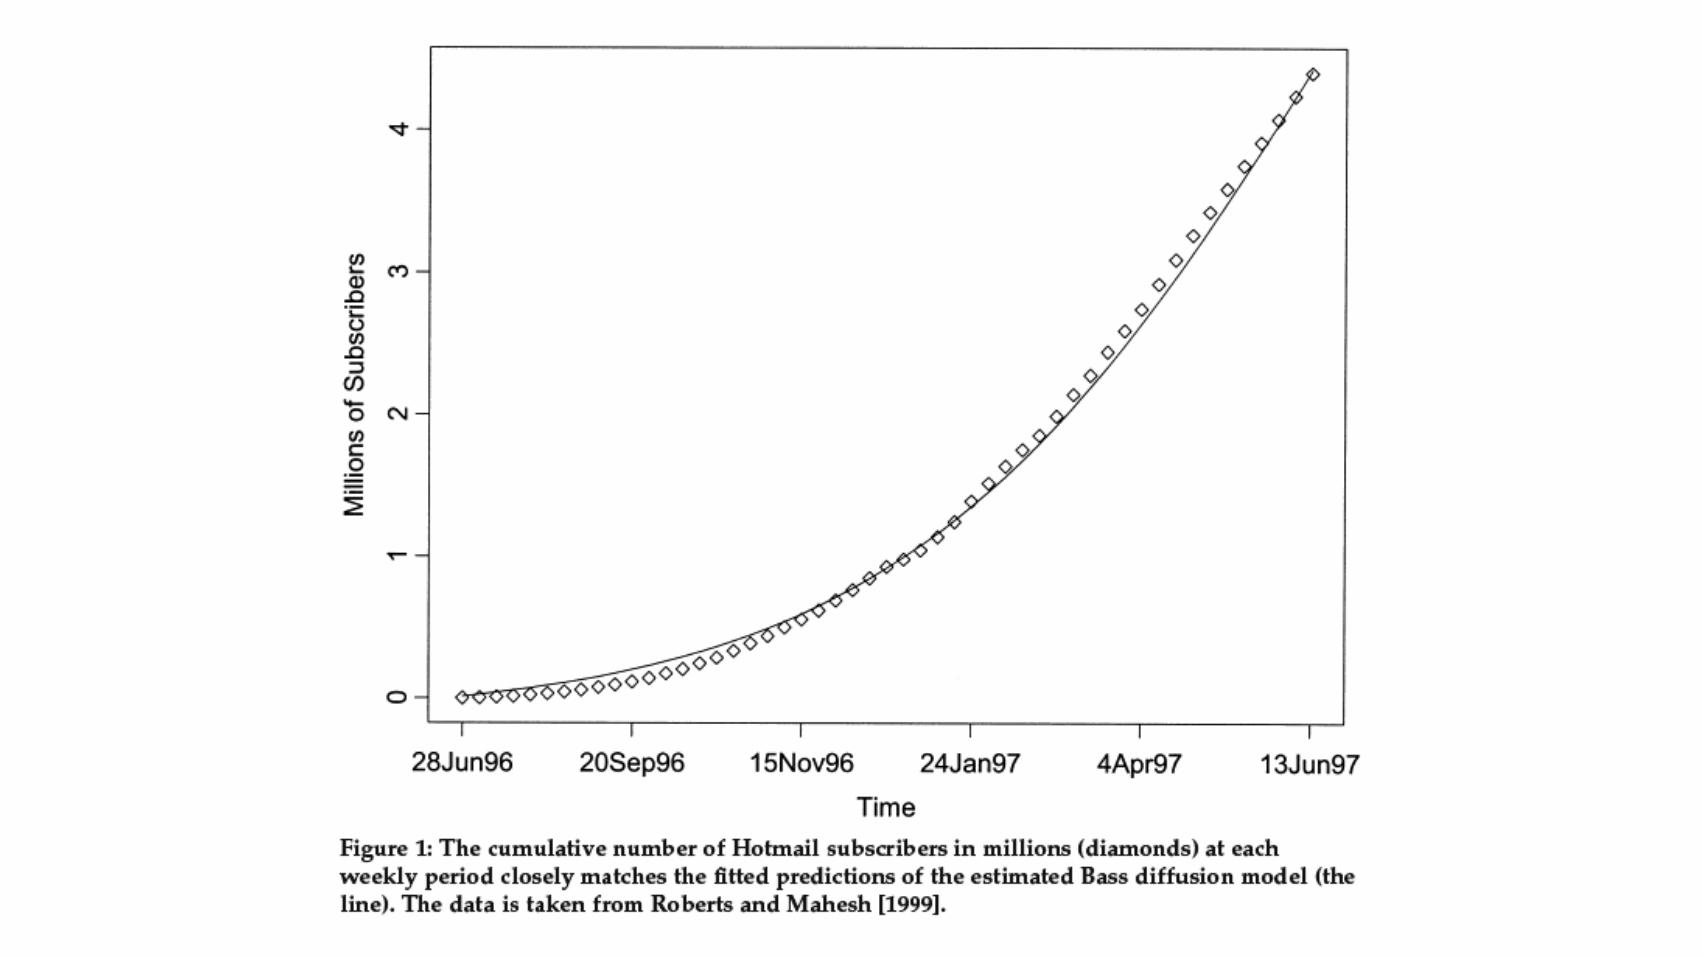
The infamous S-curve
(Product lifecycle, Bass diffusion curve, etc.)
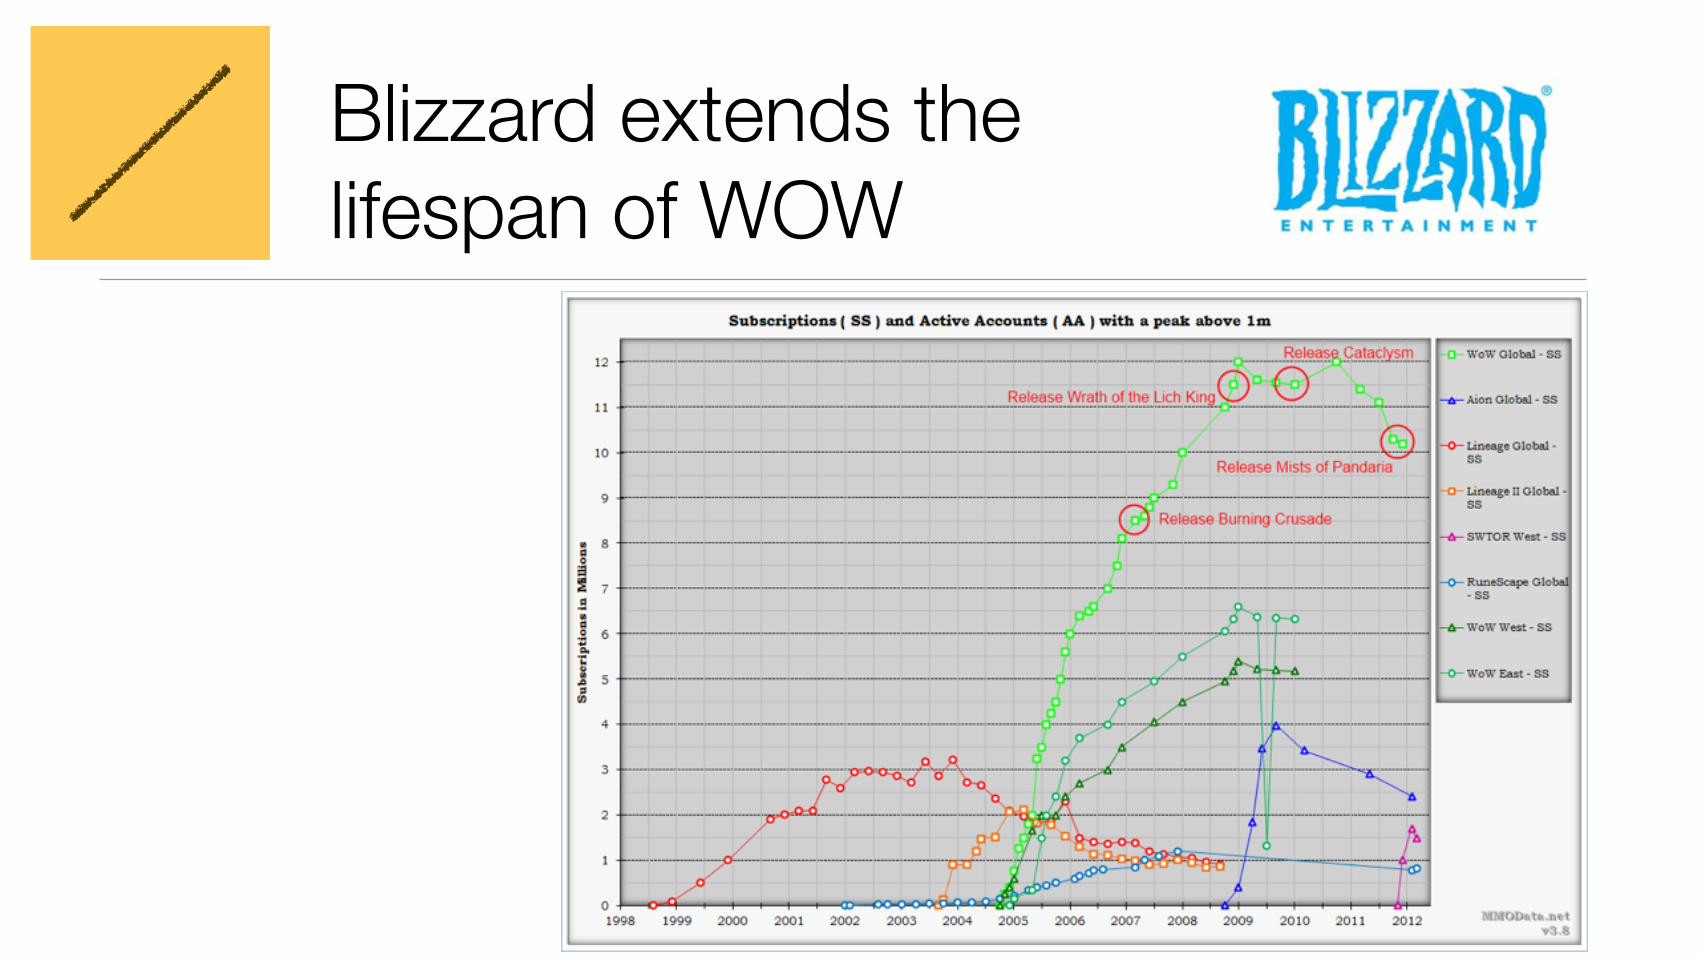
Blizzard extends the lifespan of WOW
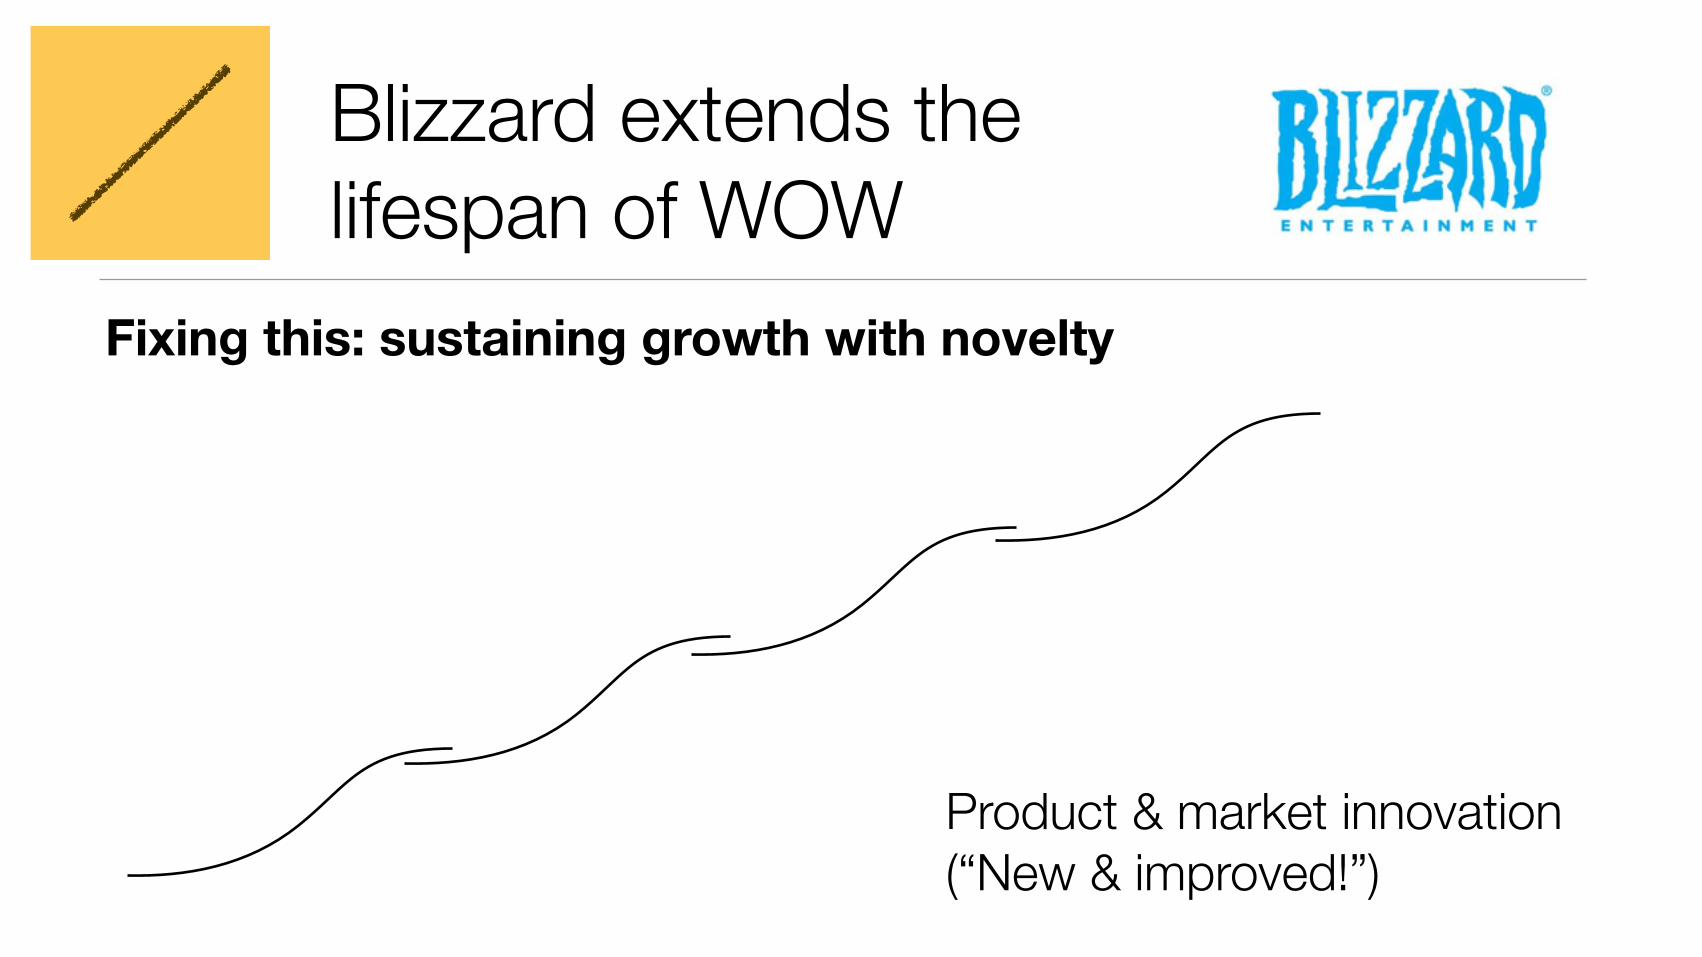
Blizzard extends the lifespan of WOW
Fixing this: sustaining growth with novelty
Product & market innovation (“New & improved!”)
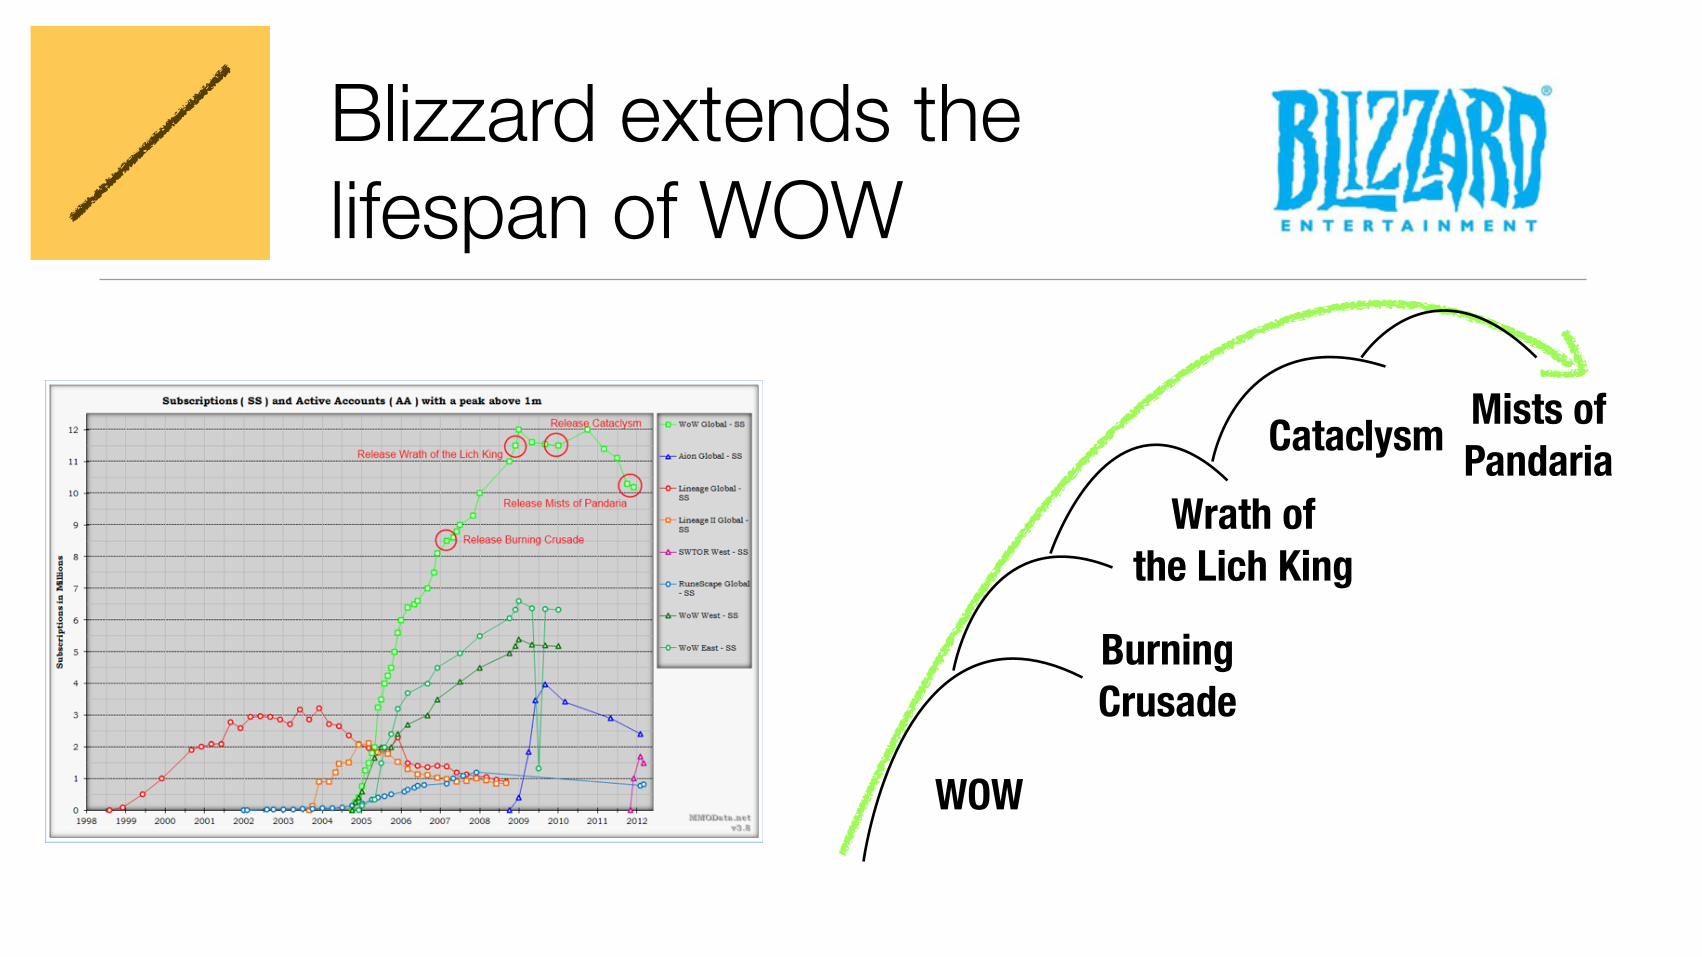
Blizzard extends the lifespan of WOW
WOW
BurningCrusade
Wrath ofthe Lich King
Mists ofPandariaCataclysm
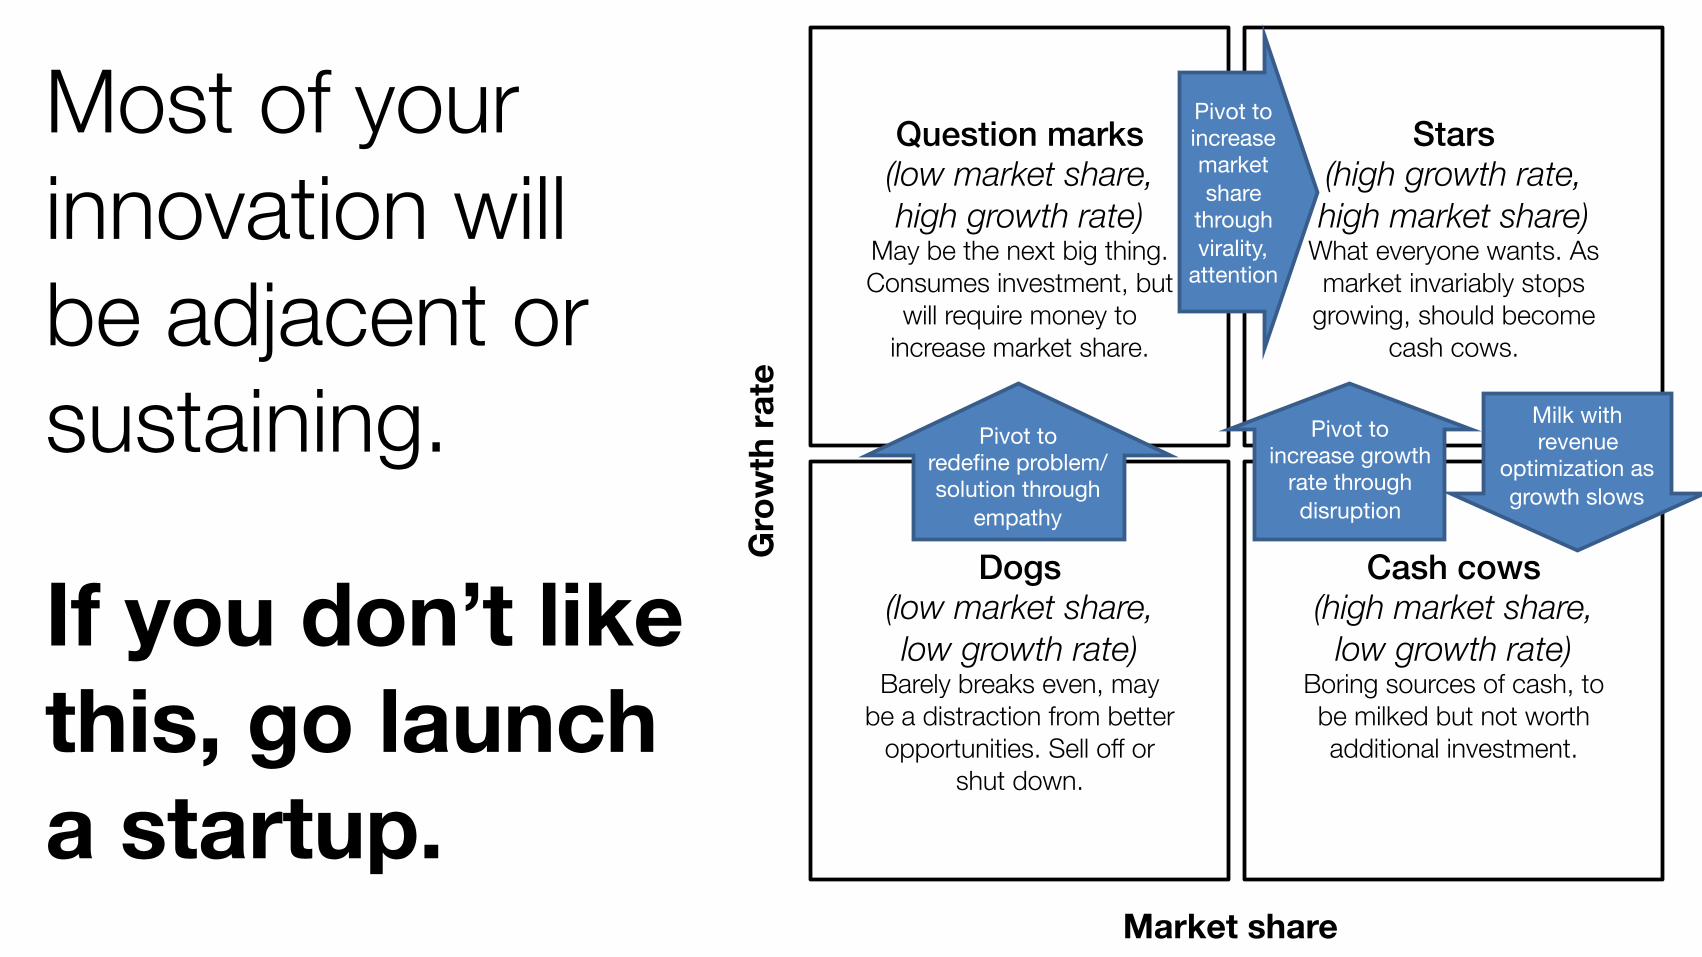
Most of your innovation will be adjacent or sustaining.
Question marks!(low market share, high growth rate)
May be the next big thing. Consumes investment, but
will require money to increase market share.
Stars!(high growth rate, high market share)
What everyone wants. As market invariably stops
growing, should become cash cows.
Dogs!(low market share, low growth rate)
Barely breaks even, may be a distraction from better
opportunities. Sell off or shut down.
Cash cows!(high market share,
low growth rate) Boring sources of cash, to be milked but not worth additional investment.
G
row
th ra
te
Market share
Pivot to increasemarketshare
throughvirality,
attention
Pivot toincrease growth
rate throughdisruption
Pivot toredefine problem/solution through
empathy
Milk withrevenue
optimization asgrowth slows
If you don’t like this, go launch a startup.
Software, experimentation, and iterative cycles of learning help you
get to the local maximum better and faster. That’s a good thing.
But it’s not the only thing.
Adjacent innovation is about changing one part of the model in a way that
alters the value network.
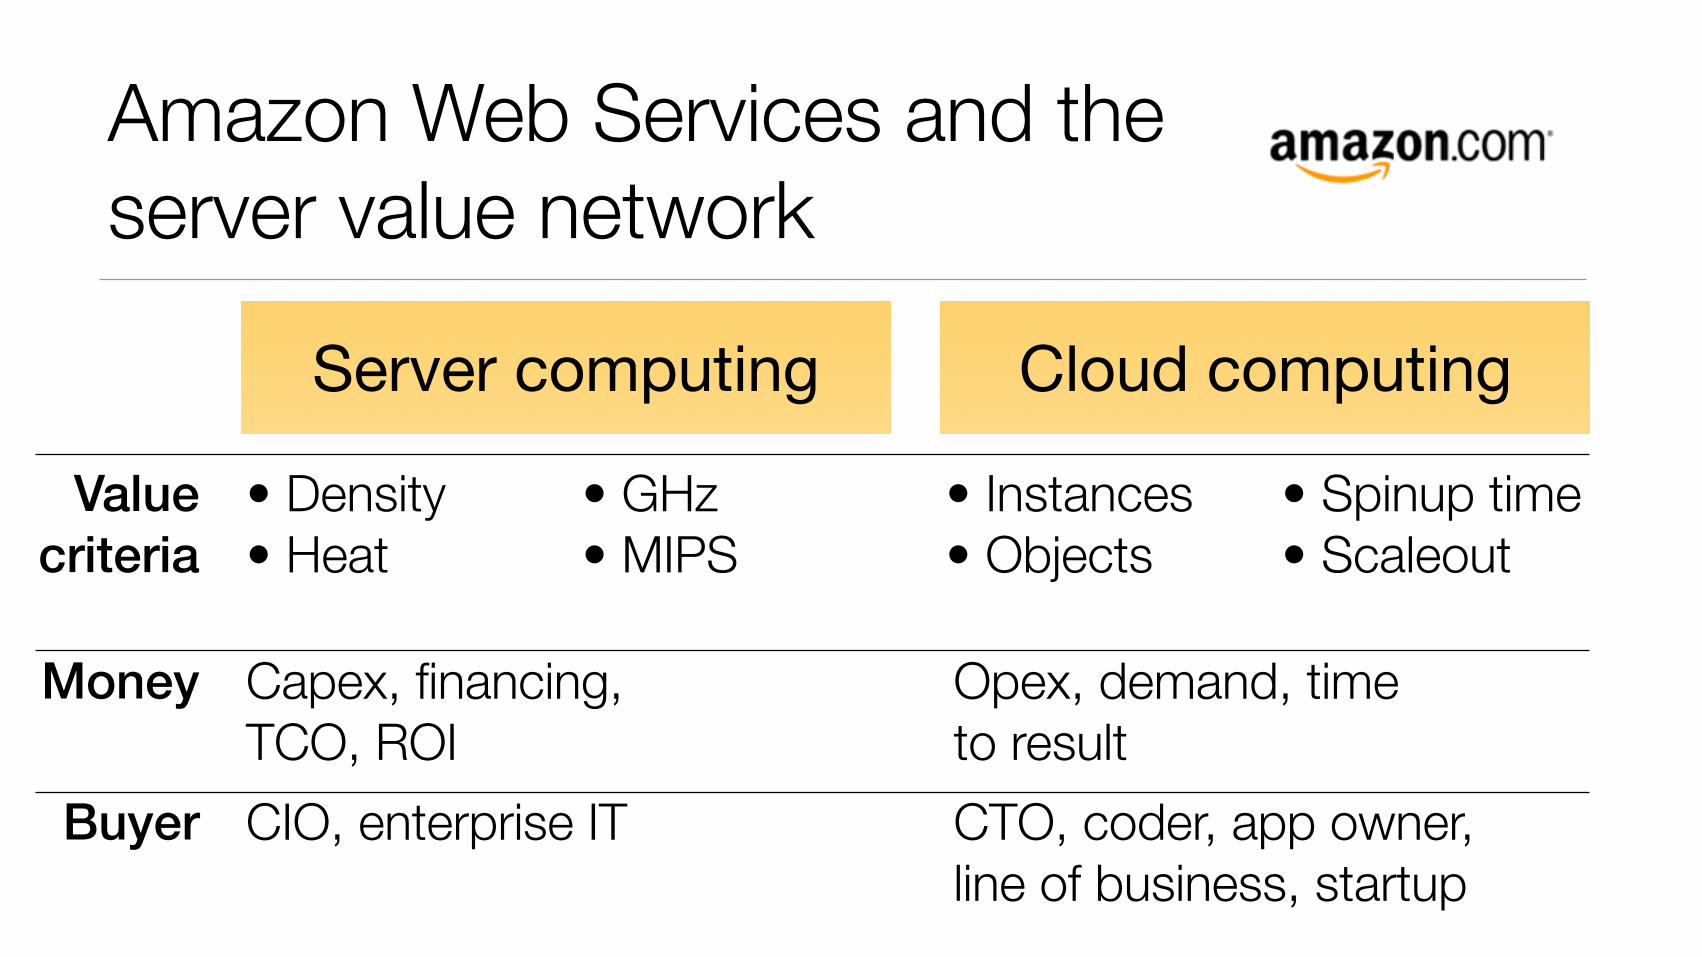
Amazon Web Services and the server value network
Server computing
• Density • Heat
• GHz • MIPS
Cloud computing
• Instances • Objects
• Spinup time • Scaleout
Capex, financing, TCO, ROI
Opex, demand, time to result
CIO, enterprise IT CTO, coder, app owner, line of business, startup
Valuecriteria
Money
Buyer
Adjacent product to the same market in the same way
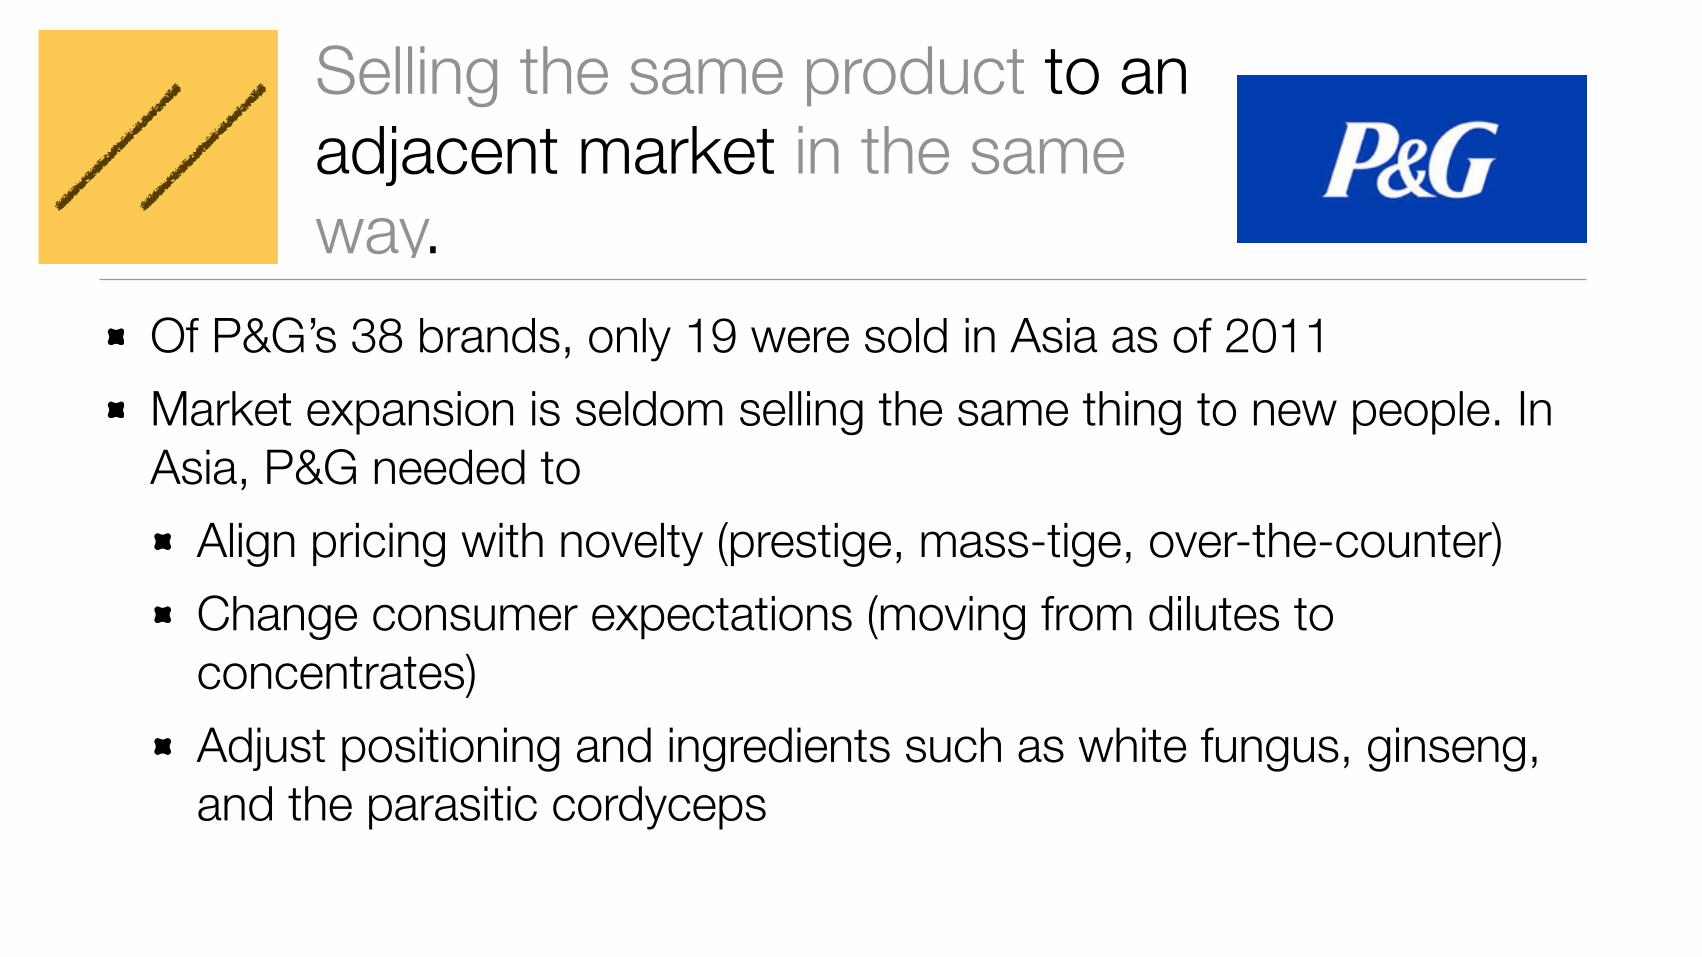
Selling the same product to an adjacent market in the same way.
Of P&G’s 38 brands, only 19 were sold in Asia as of 2011 Market expansion is seldom selling the same thing to new people. In Asia, P&G needed to
Align pricing with novelty (prestige, mass-tige, over-the-counter) Change consumer expectations (moving from dilutes to concentrates) Adjust positioning and ingredients such as white fungus, ginseng, and the parasitic cordyceps

Selling the same product to the same market in a new way.
The biggest innovation in logistics of the 20th century.
http://www.flickr.com/photos/photohome_uk/1494590209
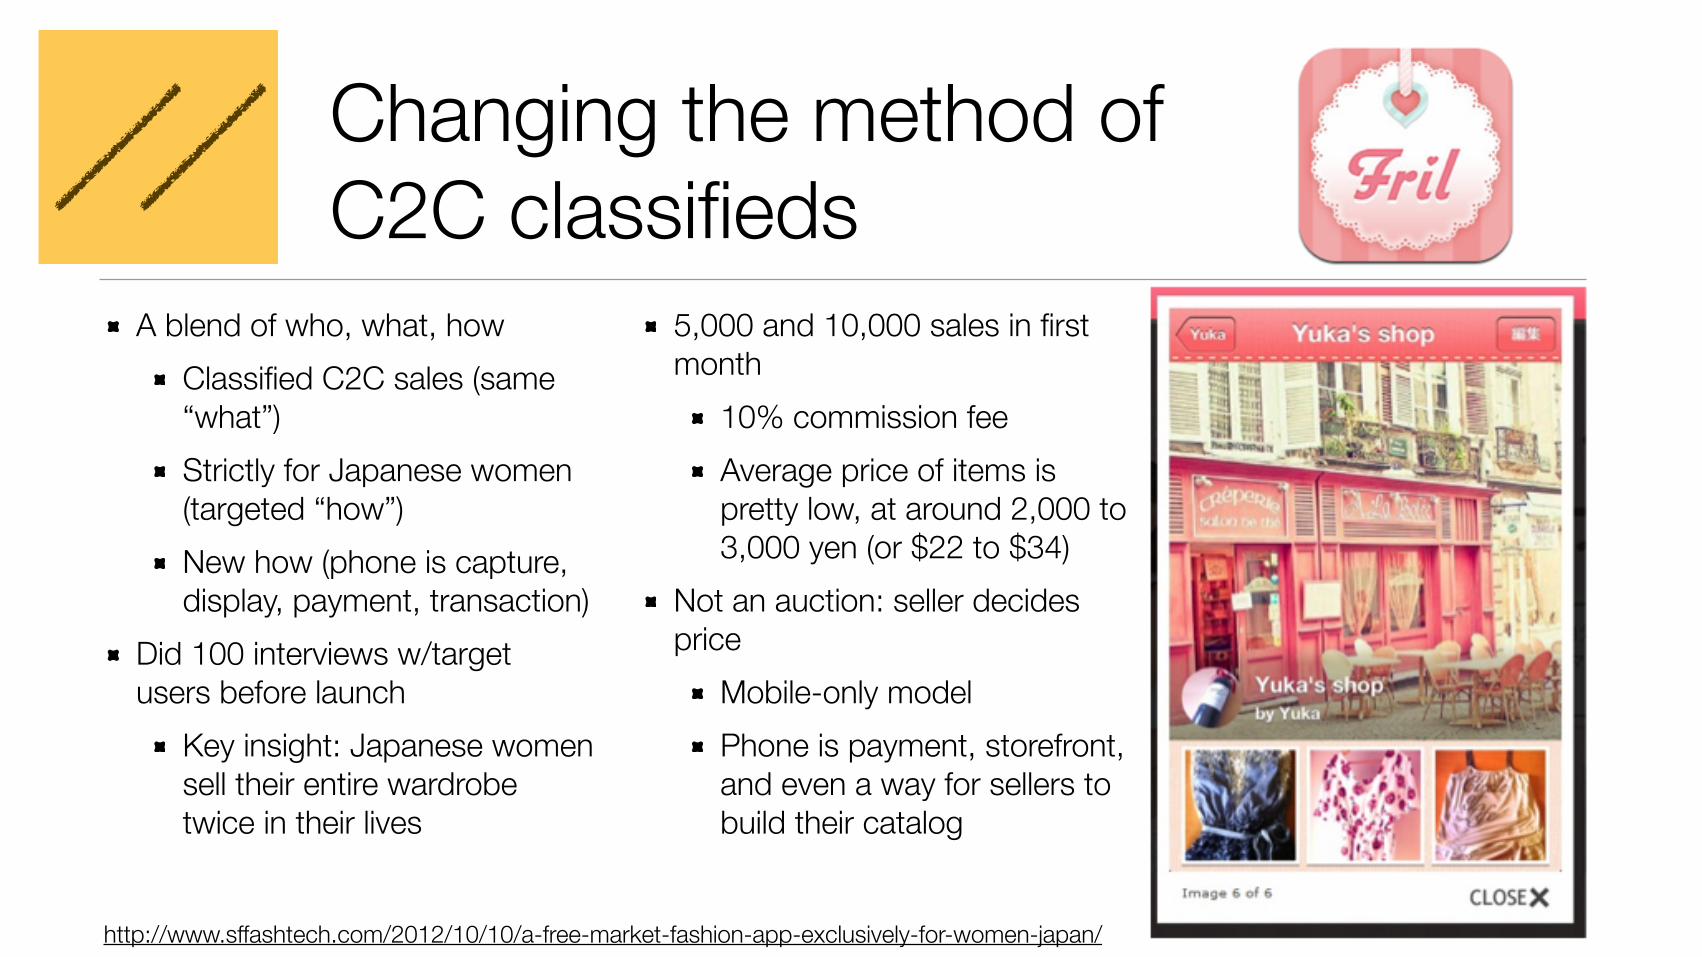
Changing the method of C2C classifieds
A blend of who, what, how Classified C2C sales (same “what”) Strictly for Japanese women (targeted “how”) New how (phone is capture, display, payment, transaction)
Did 100 interviews w/target users before launch
Key insight: Japanese women sell their entire wardrobe twice in their lives
5,000 and 10,000 sales in first month
10% commission fee Average price of items is pretty low, at around 2,000 to 3,000 yen (or $22 to $34)
Not an auction: seller decides price
Mobile-only model Phone is payment, storefront, and even a way for sellers to build their catalog
http://www.sffashtech.com/2012/10/10/a-free-market-fashion-app-exclusively-for-women-japan/

Selling the same product to the same market in a new way.
(At this point, observant Intrapreneurs should be asking, should P&G be in
the house cleaning business?
And that would be transformative.)
Transformative innovation is about taking a leap, changing more than one dimension simultaneously in search of
a new business model.
If sustaining, incremental innovation produces linear growth, then
disruptive, transformative innovation produces exponential growth.

Transformative isolation: Skunkworks
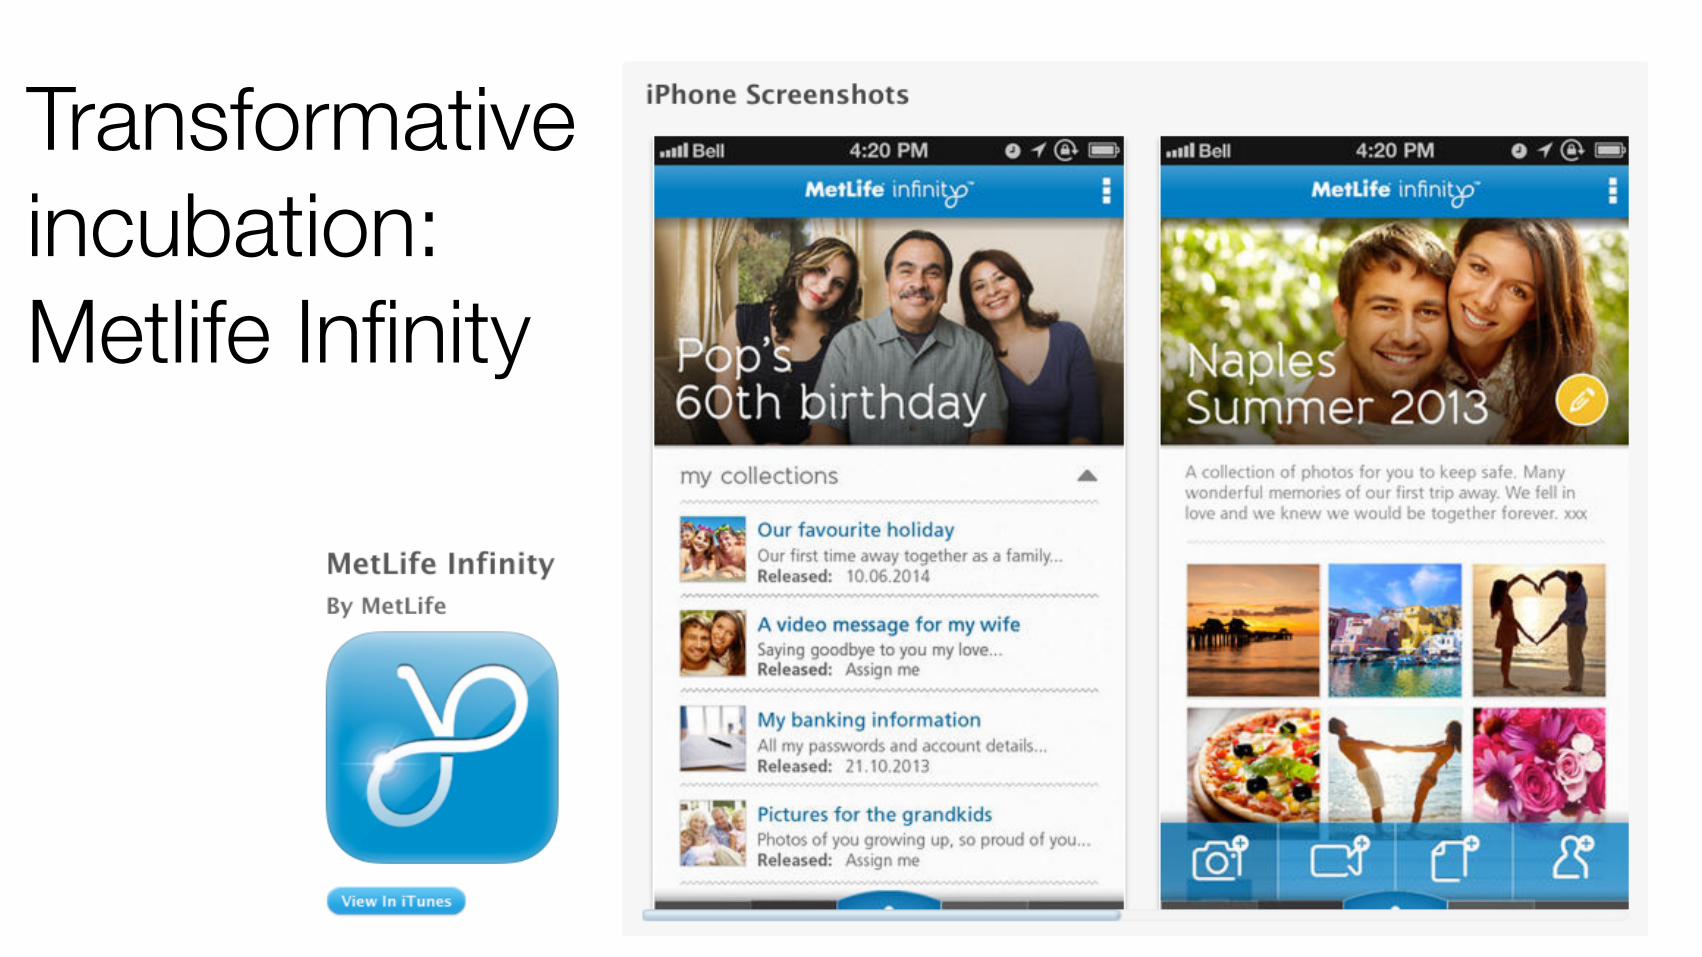
Transformative incubation: Metlife Infinity
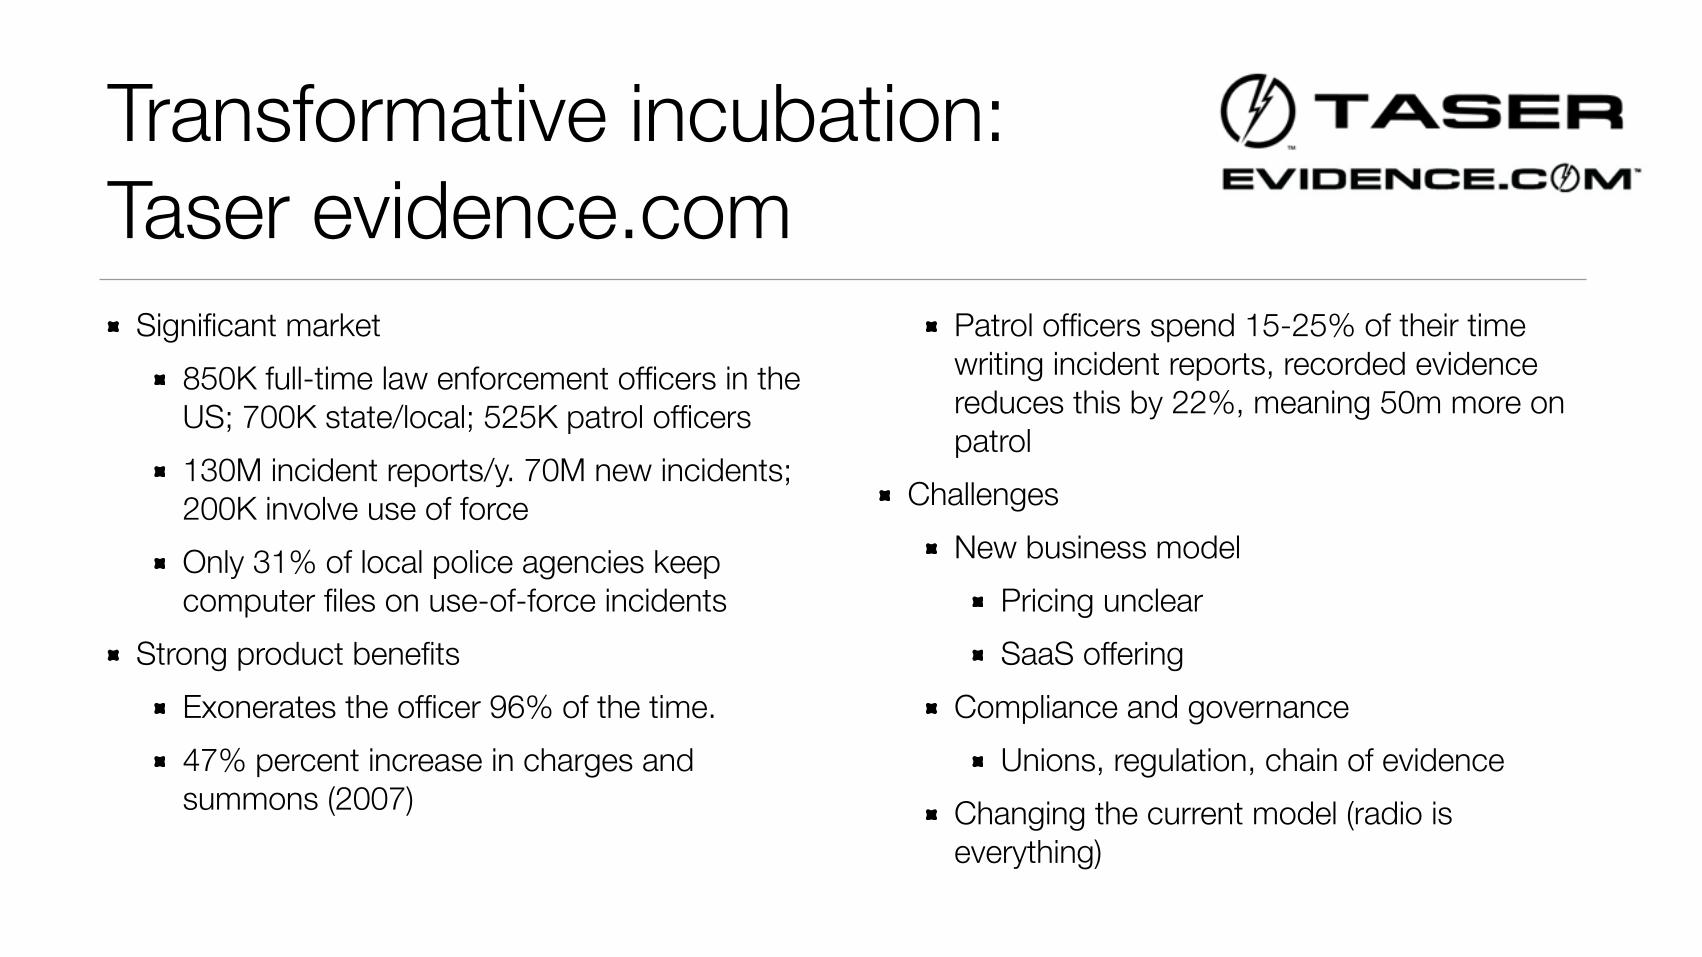
Significant market 850K full-time law enforcement officers in the US; 700K state/local; 525K patrol officers 130M incident reports/y. 70M new incidents; 200K involve use of force Only 31% of local police agencies keep computer files on use-of-force incidents
Strong product benefits Exonerates the officer 96% of the time. 47% percent increase in charges and summons (2007)
Patrol officers spend 15-25% of their time writing incident reports, recorded evidence reduces this by 22%, meaning 50m more on patrol
Challenges New business model
Pricing unclear SaaS offering
Compliance and governance Unions, regulation, chain of evidence
Changing the current model (radio is everything)
Transformative incubation: Taser evidence.com
When it’s you vs. the world.
(A bagful of tricks from agitators in companies of all sizes.)

The Lean Analytics lifecycle of an Intrapreneur
Empathy Find problems; don’t test demand. Skip the business case, do analytics
Entitled, aggrieved customers
Stickiness Know your real minimum based on expectations, regulations
Hidden “must haves”, feature creep
Virality Build inherent virality in from the start; attention is the new currency
Luddites who don’t understand sharing
Revenue Consider the ecosystem, channels, and established agreements
Channel conflict, resistance, contracts
Scale Hand the baton to others gracefully Hating what happens to your baby
BeforehandGet buy-in Political fallout
The Zero Overhead principle
A central theme to this new wave of innovation is the application of core product tenets from the consumer space to the enterprise. In particular, a universal lesson that I keep sharing with all entrepreneurs building for the enterprise is the Zero Overhead Principle: no feature may add training costs to the user.
DJ Patil
The job of an intrapreneur is to identify an adjacent market, product,
or method that conforms to organizational filters.
It is not to improve the current product, market, or method.
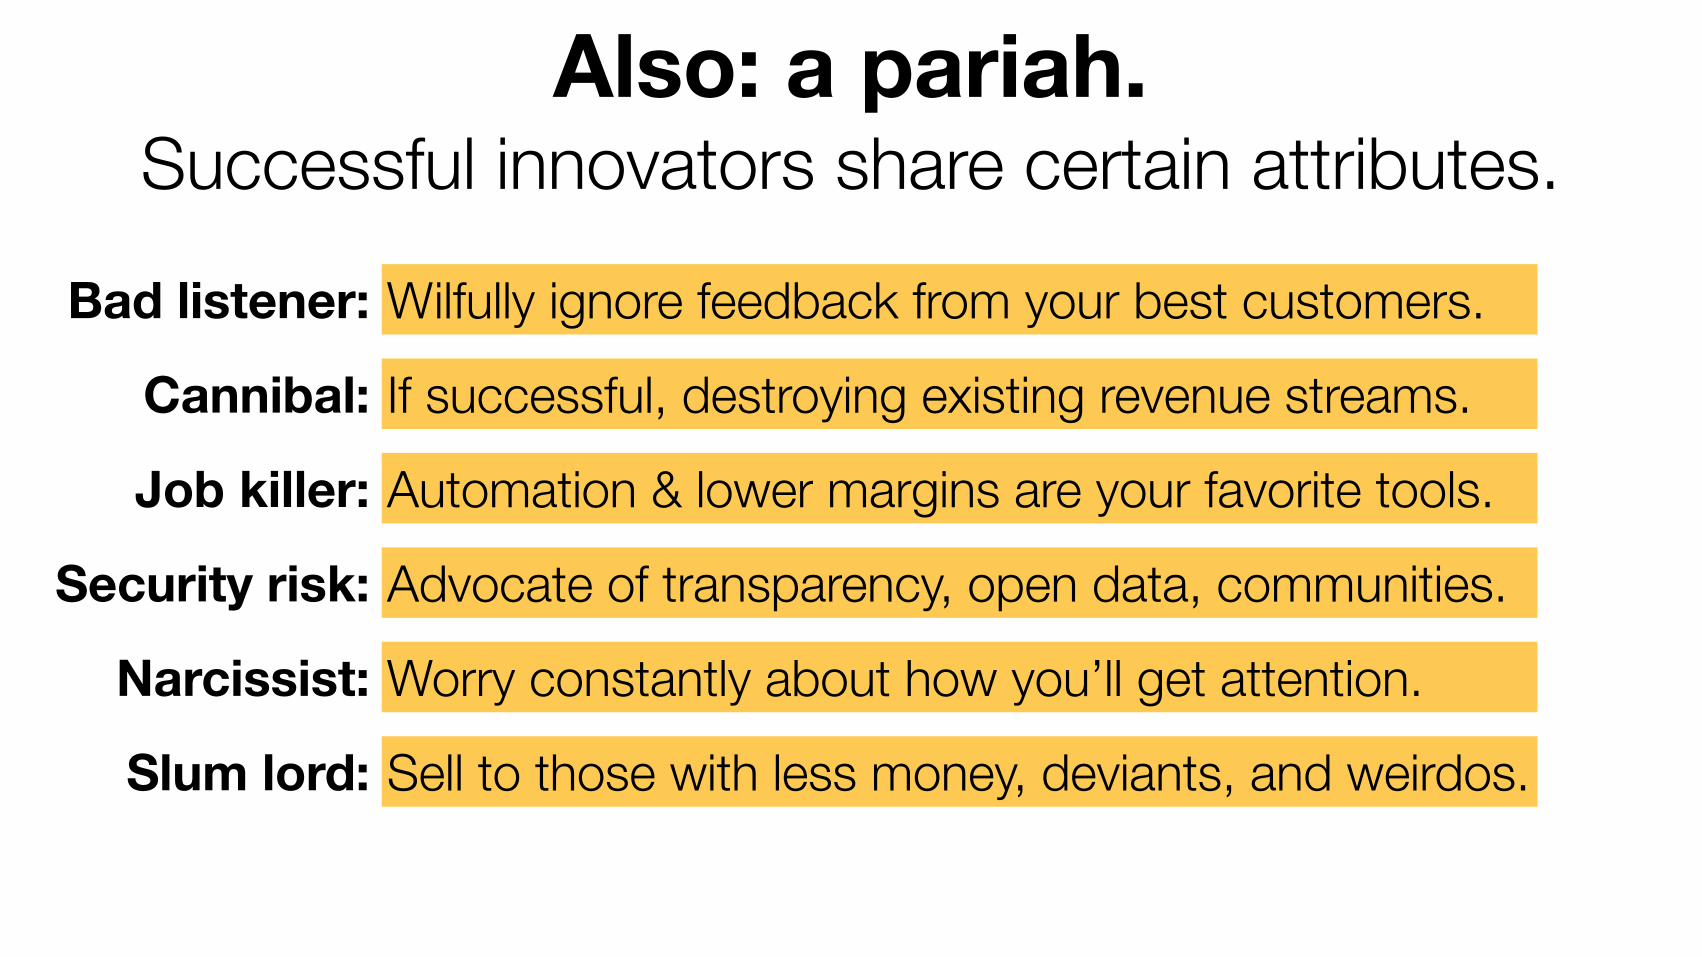
Also: a pariah. Successful innovators share certain attributes.
Bad listener: Wilfully ignore feedback from your best customers.
Cannibal: If successful, destroying existing revenue streams.
Job killer: Automation & lower margins are your favorite tools.
Security risk: Advocate of transparency, open data, communities.
Narcissist: Worry constantly about how you’ll get attention.
Slum lord: Sell to those with less money, deviants, and weirdos.
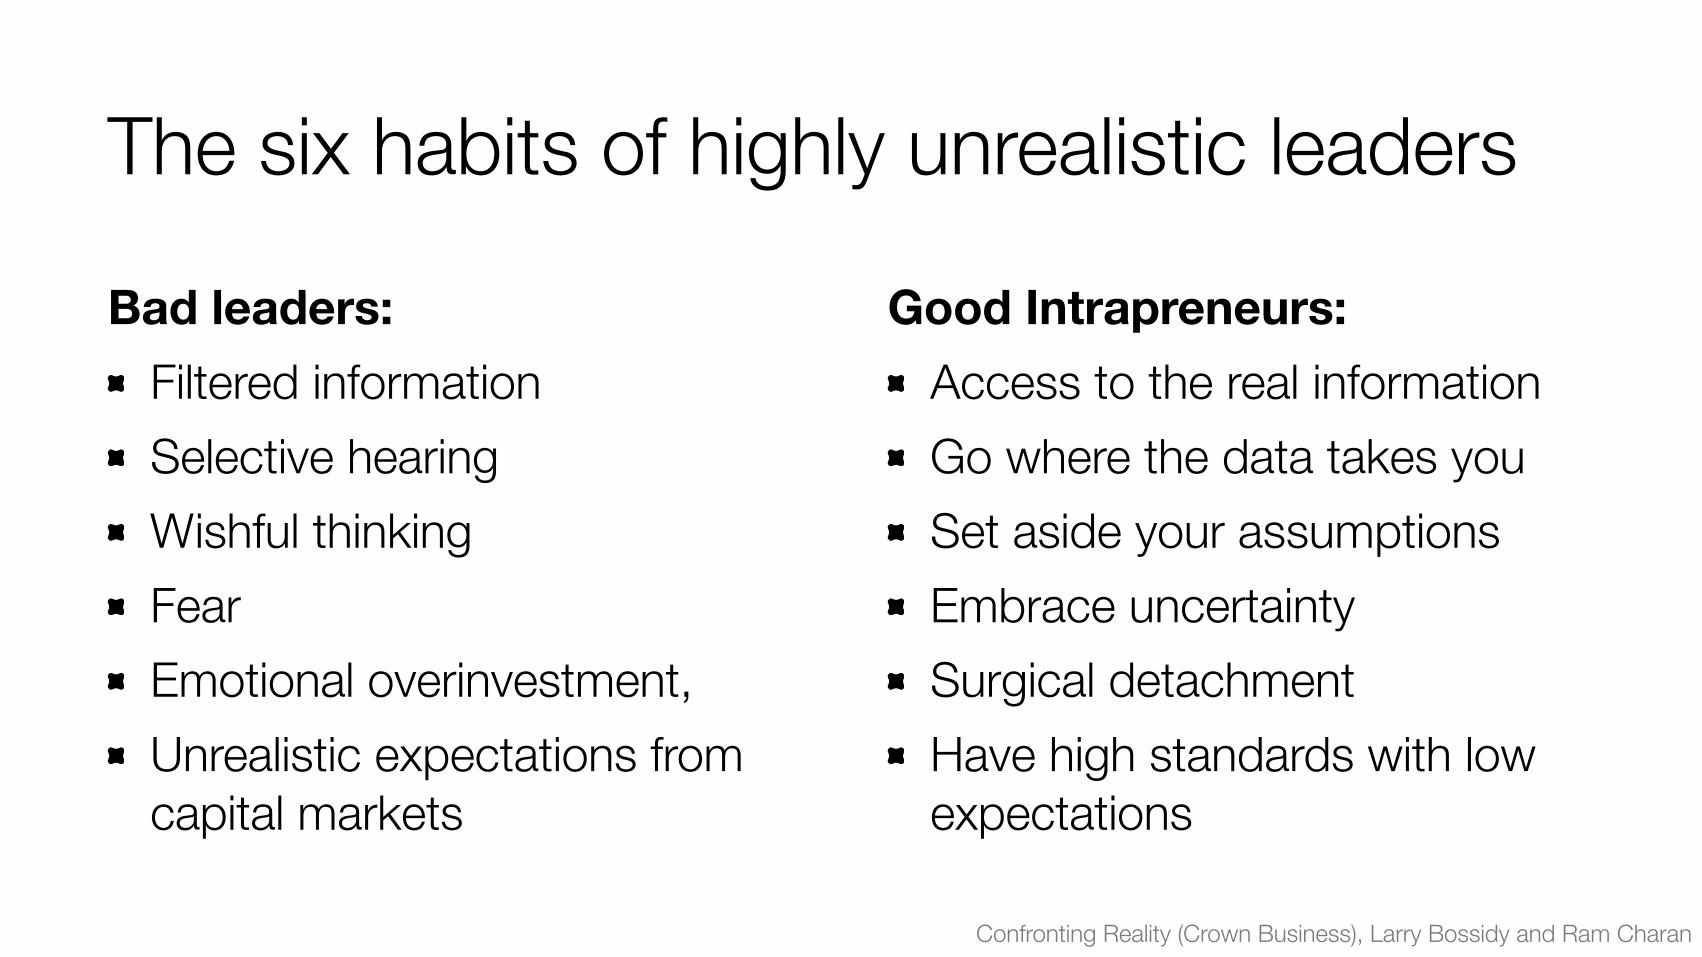
The six habits of highly unrealistic leaders
Bad leaders: Filtered information Selective hearing Wishful thinking Fear Emotional overinvestment, Unrealistic expectations from capital markets
Good Intrapreneurs: Access to the real information Go where the data takes you Set aside your assumptions Embrace uncertainty Surgical detachment Have high standards with low expectations
Confronting Reality (Crown Business), Larry Bossidy and Ram Charan
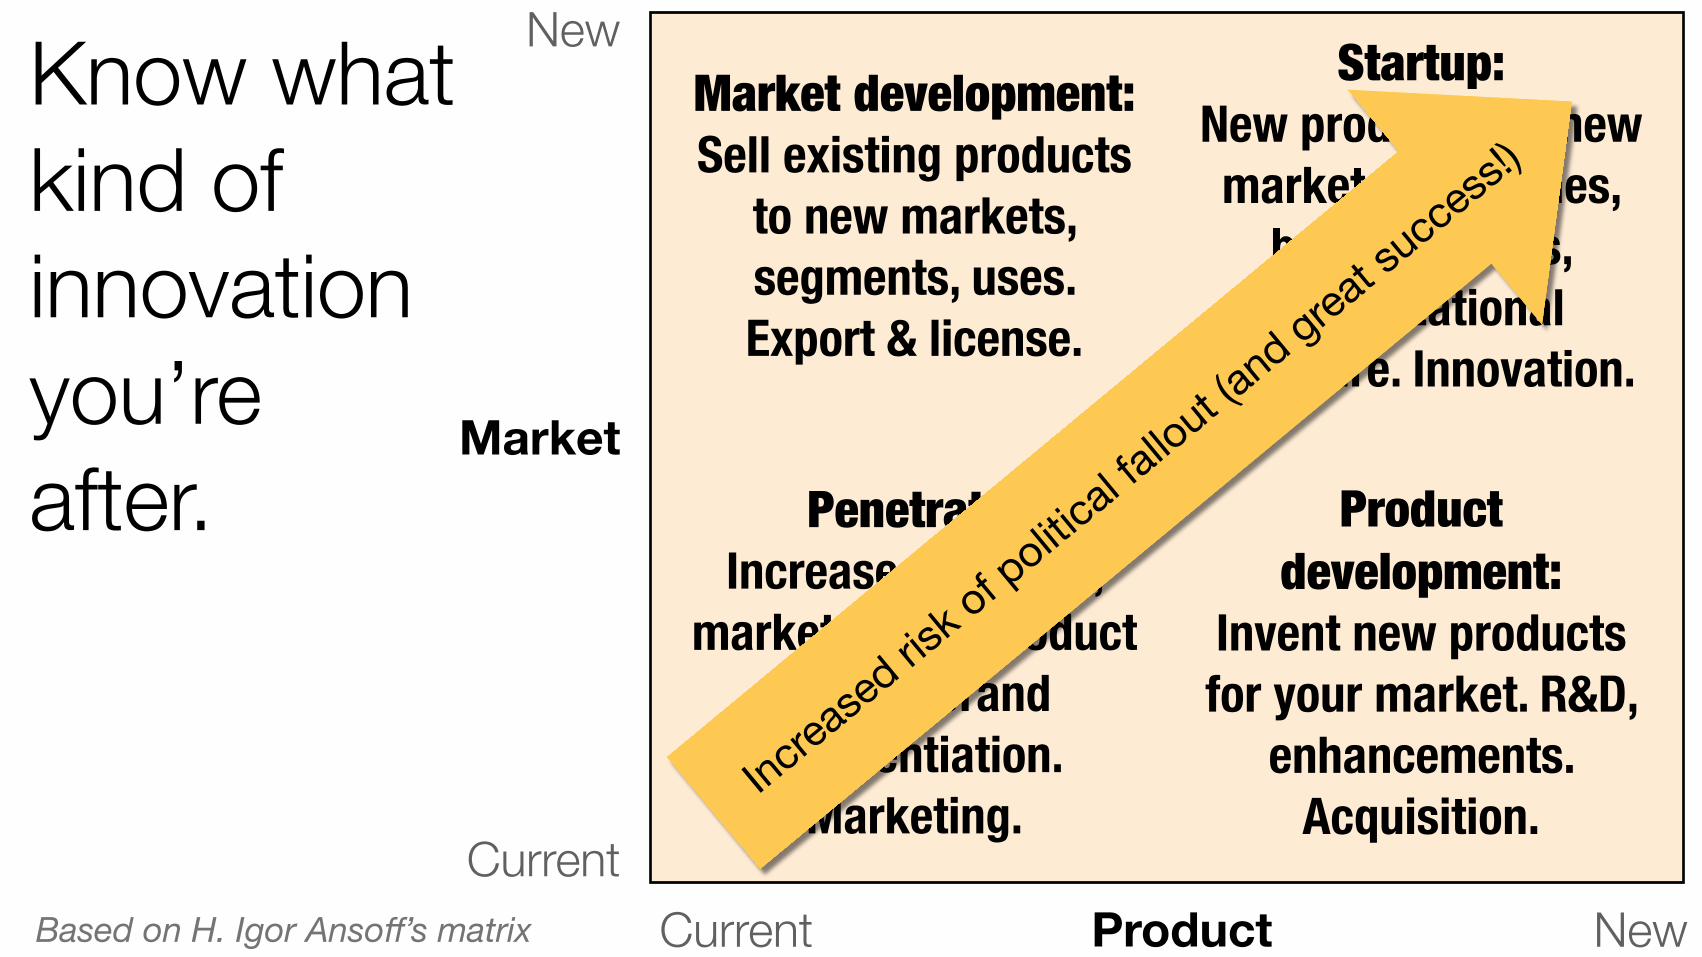
Know what kind of innovation you’re after.
New
CurrentCurrent New
Market
Product
Penetrate:Increase revenues,
market share, product quality, brand differentiation.
Marketing.
Market development: Sell existing products
to new markets, segments, uses. Export & license.
Product development:
Invent new products for your market. R&D,
enhancements. Acquisition.
Startup:New products for new markets. New rules,
business units, organizational
structure. Innovation.
Based on H. Igor Ansoff’s matrix
Increase
d risk o
f politic
al fallo
ut (and grea
t succe
ss!)
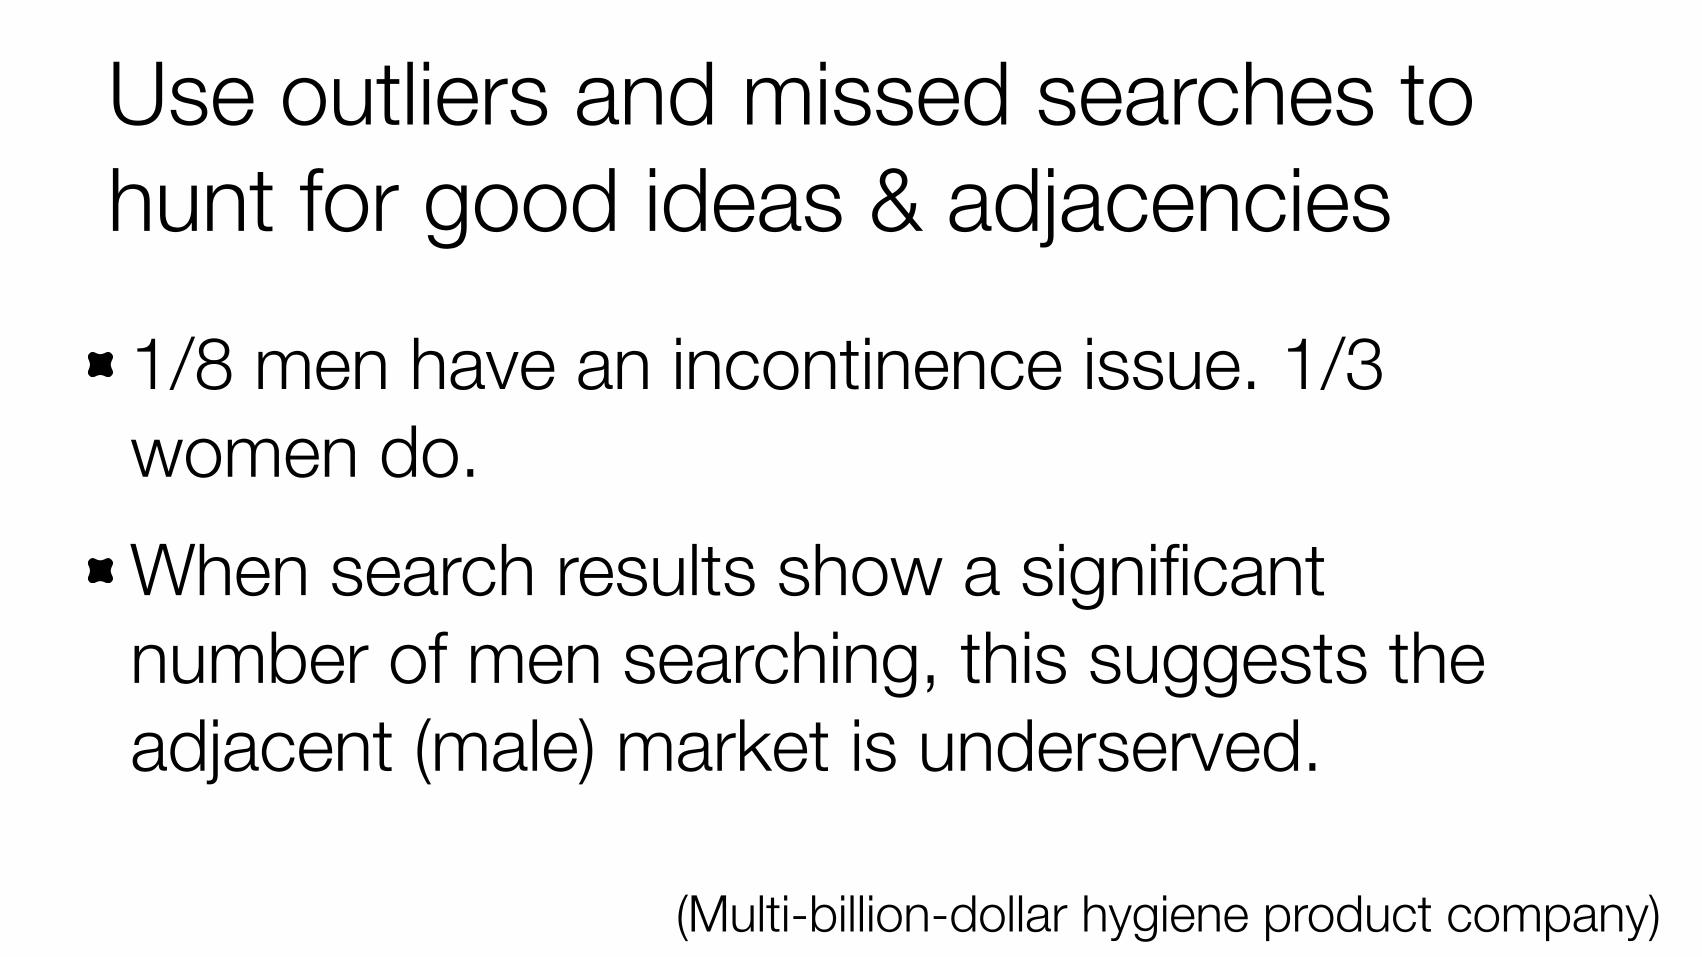
Use outliers and missed searches to hunt for good ideas & adjacencies
(Multi-billion-dollar hygiene product company)
1/8 men have an incontinence issue. 1/3 women do. When search results show a significant number of men searching, this suggests the adjacent (male) market is underserved.
Frame it like a studyProduct creation is almost accidental. Unlike a VC or startup, when the initiative fails the organization still learns.
http://www.flickr.com/photos/creative_tools/8544475139
When in doubt, collect dataFrom tackling the FTA rate to visualizing the criminal justice supply chain.
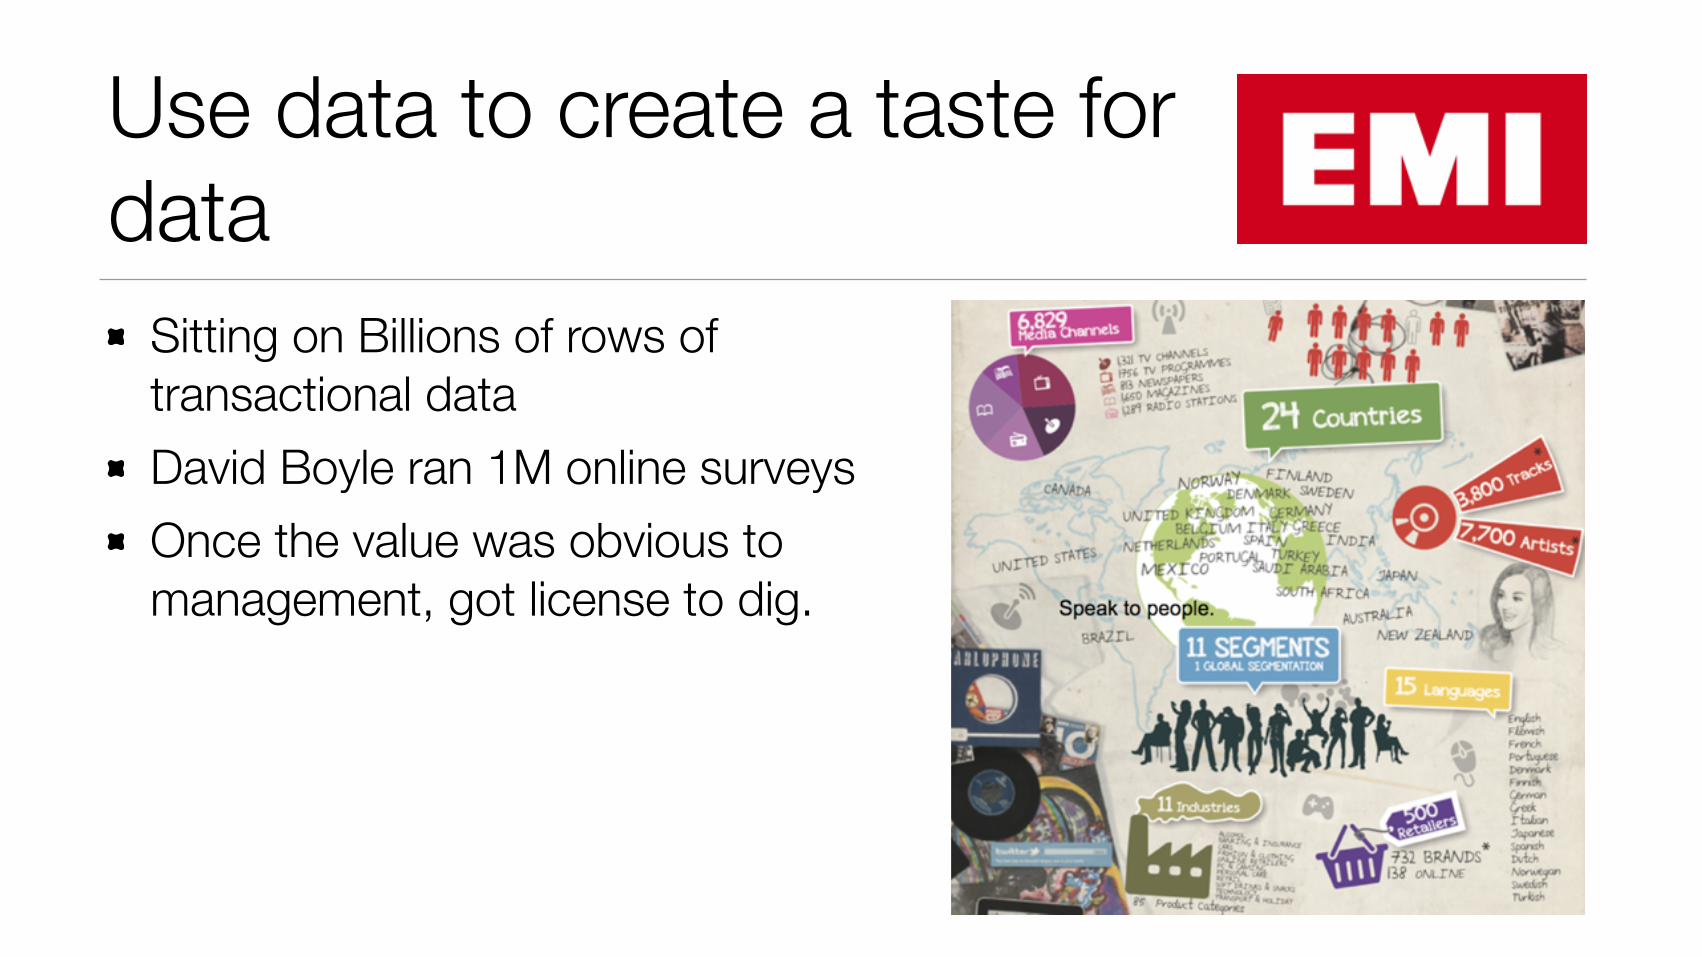
Use data to create a taste for data
Sitting on Billions of rows of transactional data David Boyle ran 1M online surveys Once the value was obvious to management, got license to dig.
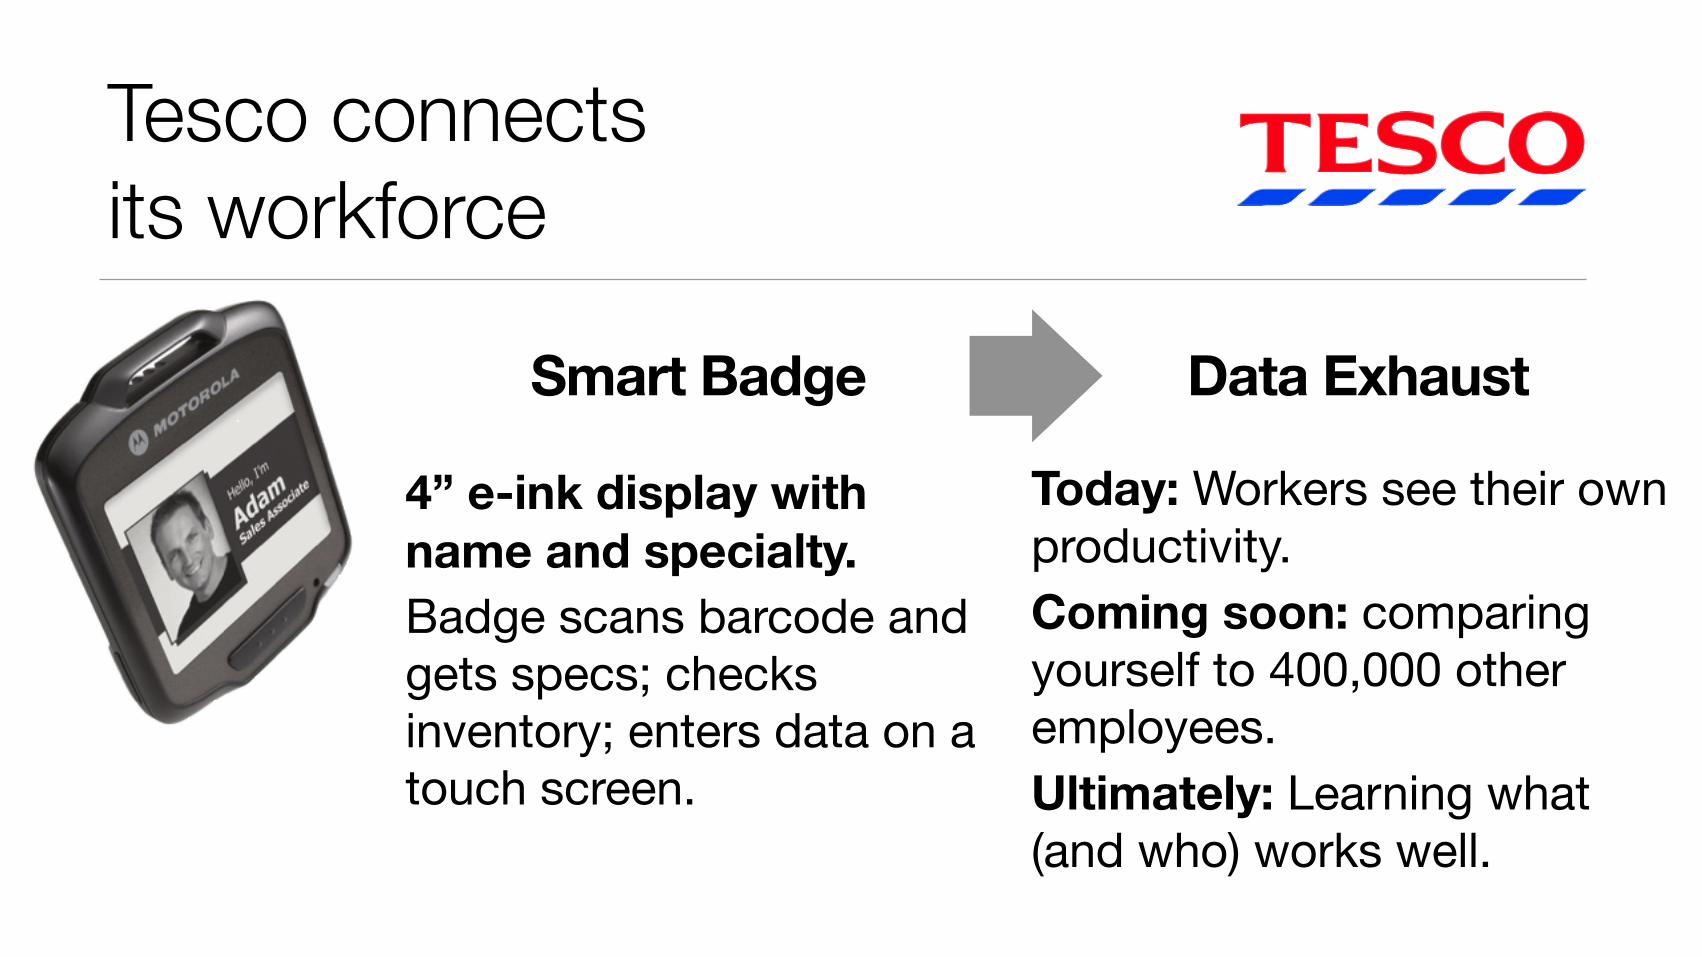
4” e-ink display with name and specialty. Badge scans barcode and gets specs; checks inventory; enters data on a touch screen.
Smart Badge
Today: Workers see their own productivity.Coming soon: comparing yourself to 400,000 other employees.Ultimately: Learning what (and who) works well.
Data Exhaust
Tesco connects its workforce
Don’t just collect data, chase it.
Understand hidden constraints
That pencil story is a myth. Graphite is conductive and explosive. The Minimum Viable Product is Viable for a reason.
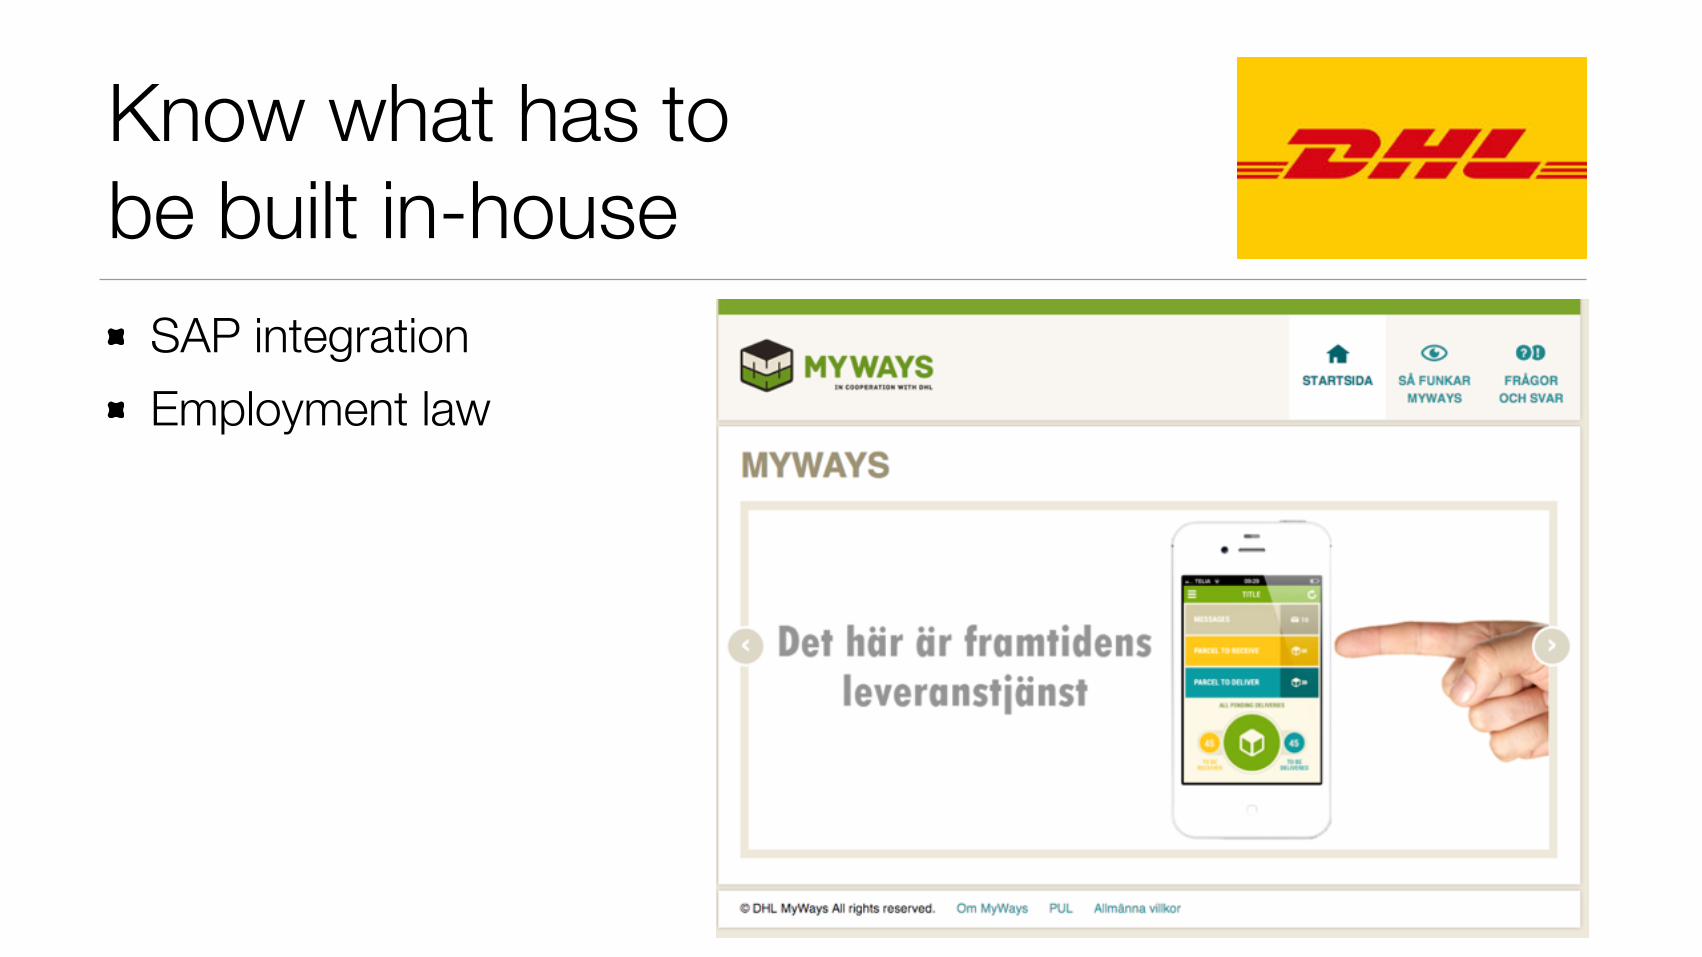
Know what has to be built in-house
SAP integration Employment law

http://www.flickr.com/photos/bootbearwdc/1243690099/
Think subversively.
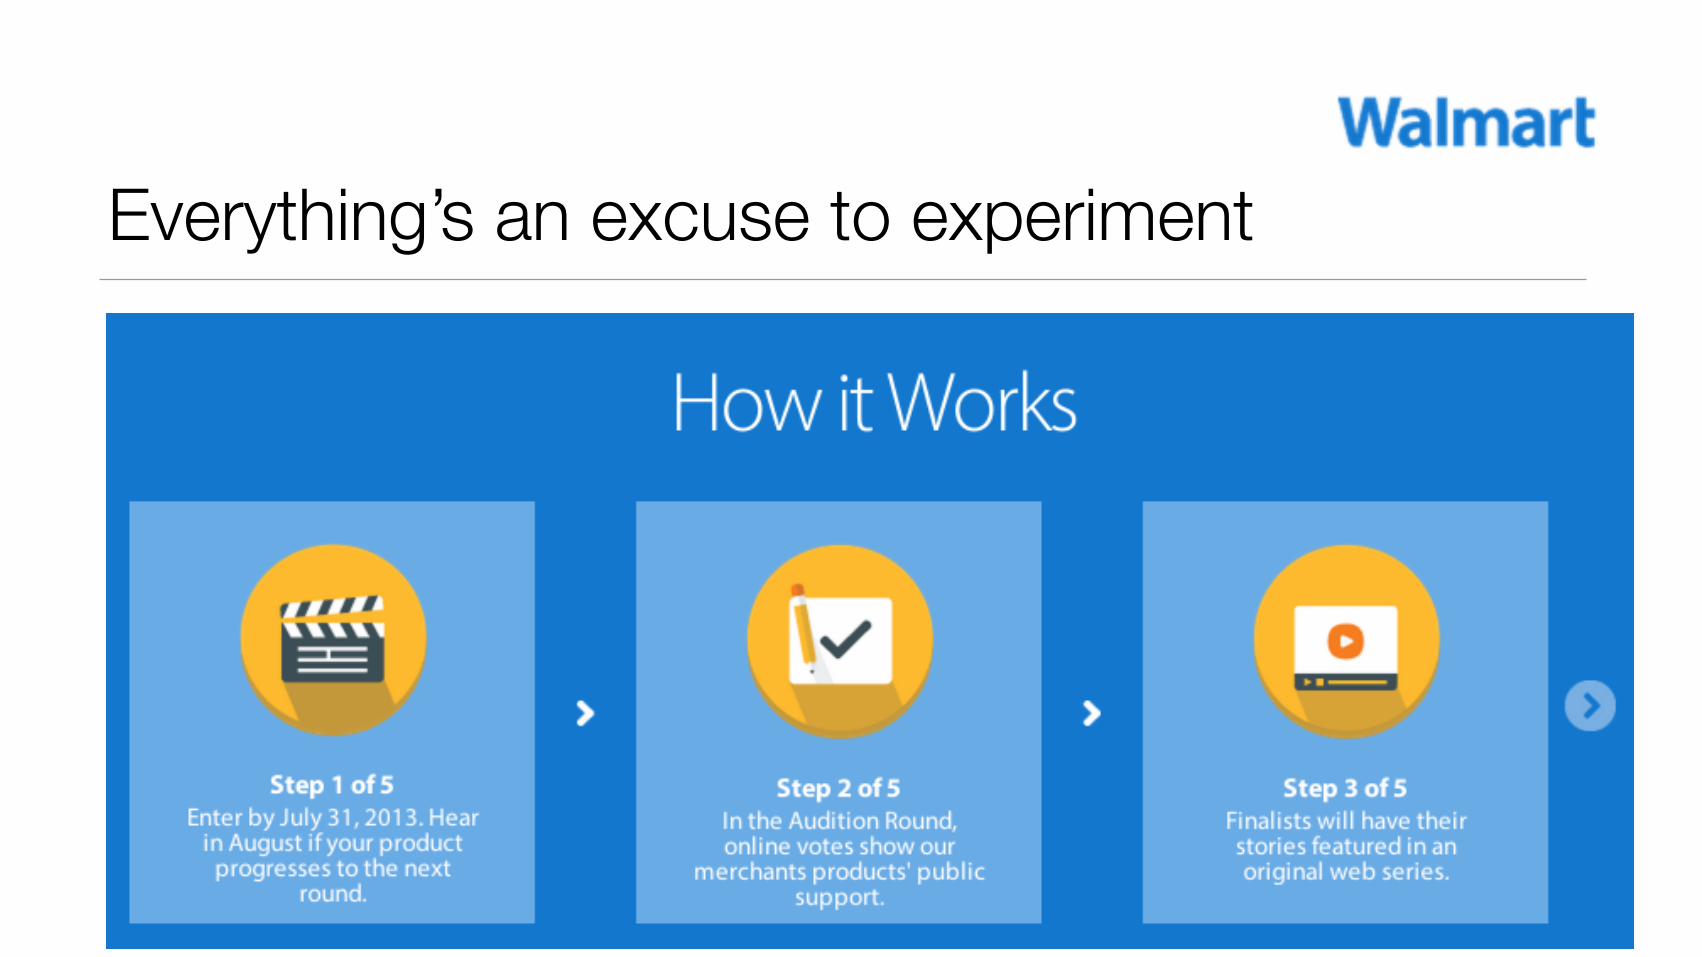
Everything’s an excuse to experiment
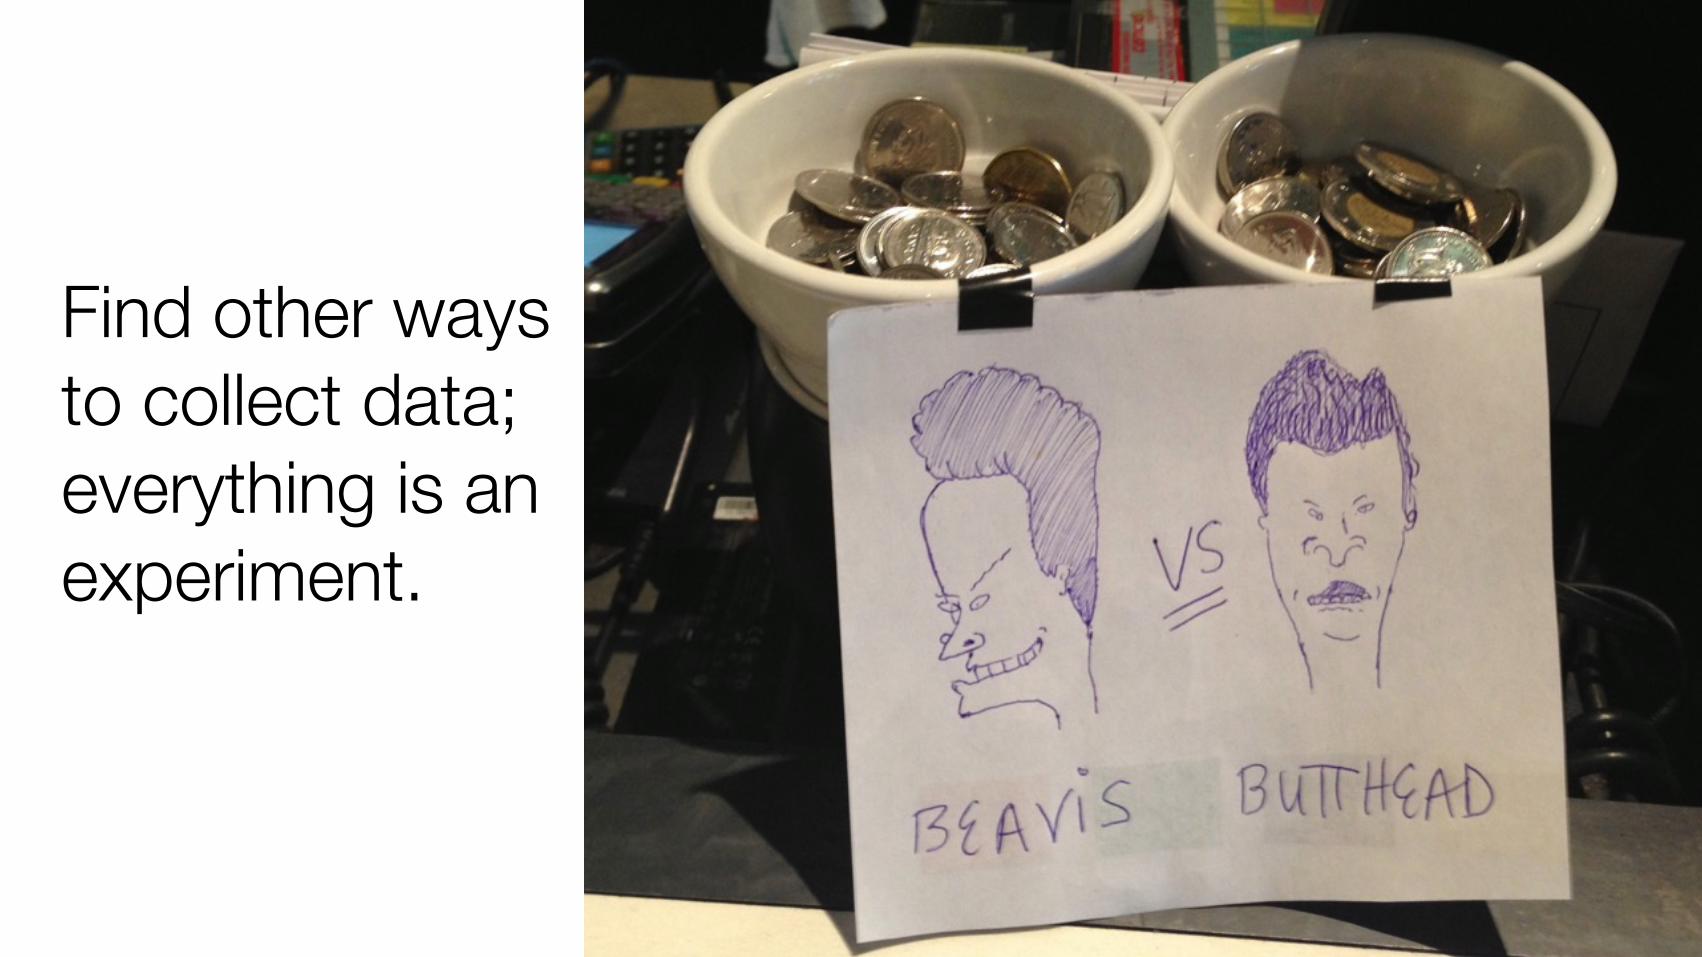
Find other ways to collect data; everything is an experiment.
Run it as a consulting business first.
(Just don’t get addicted to it. Your goal is to learn and overcome integration challenges and find the 20% of features that 80% of the market
will pay for.)
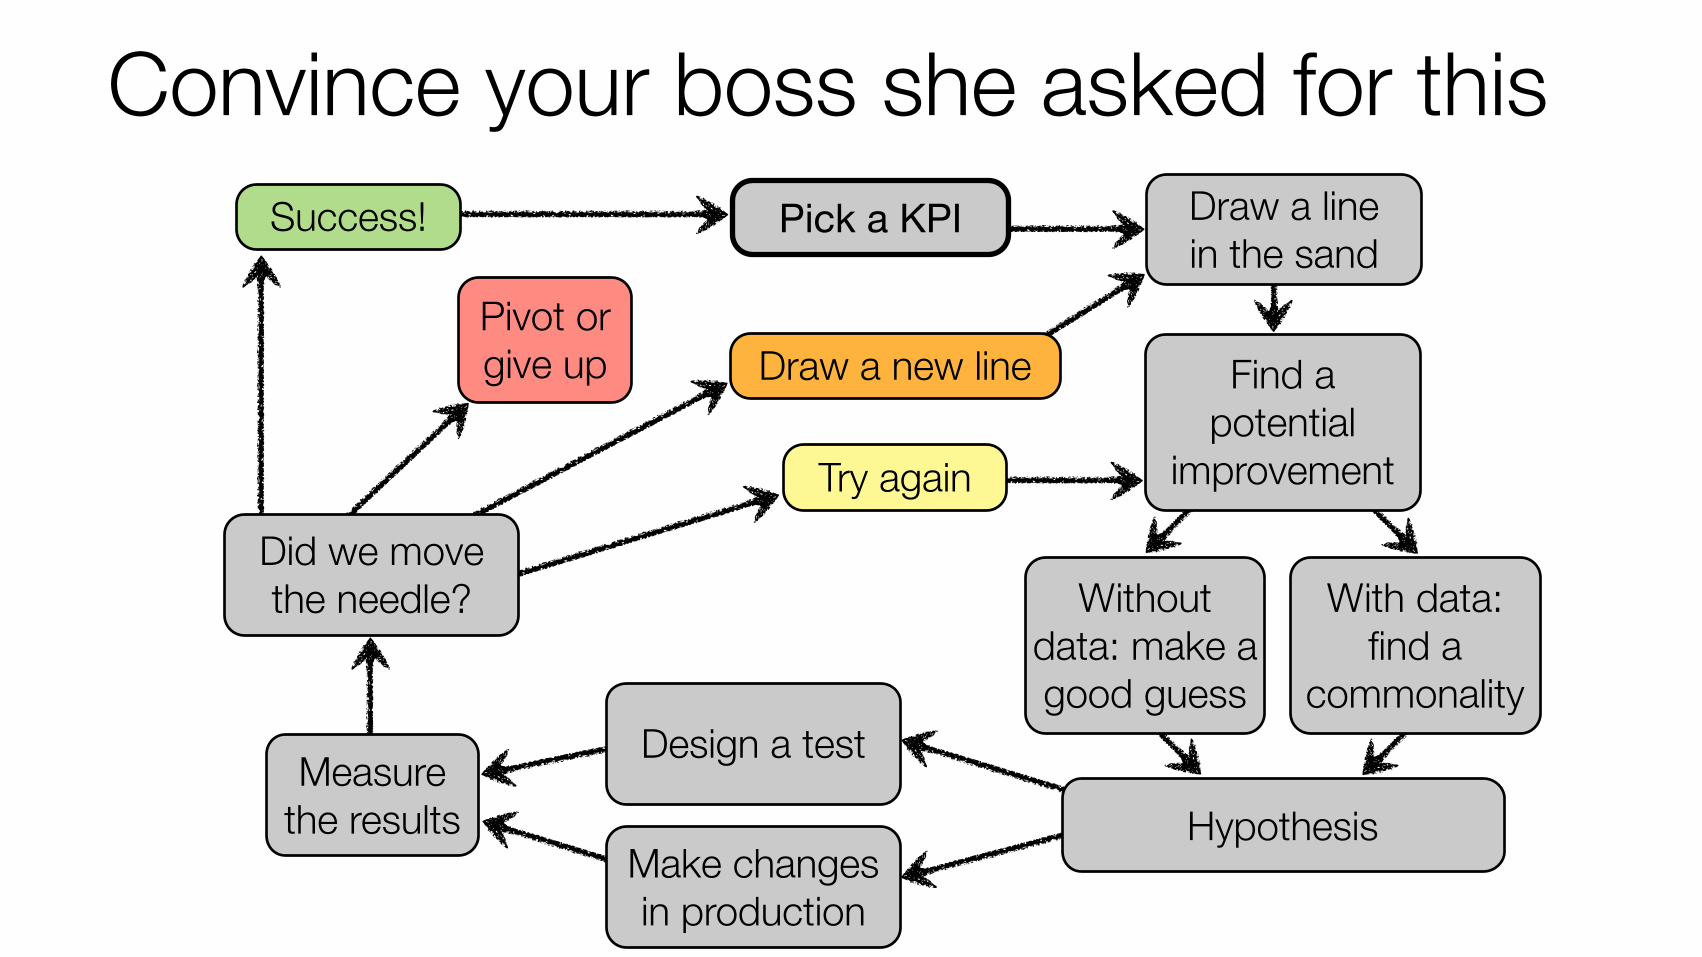
Convince your boss she asked for this
Draw a new linePivot orgive up
Try again
Success!
Did we move the needle?
Measure the results
Make changes in production
Design a test
Hypothesis
With data:find a
commonality
Without data: make a good guess
Find a potential
improvement
Draw a linein the sand
Pick a KPI
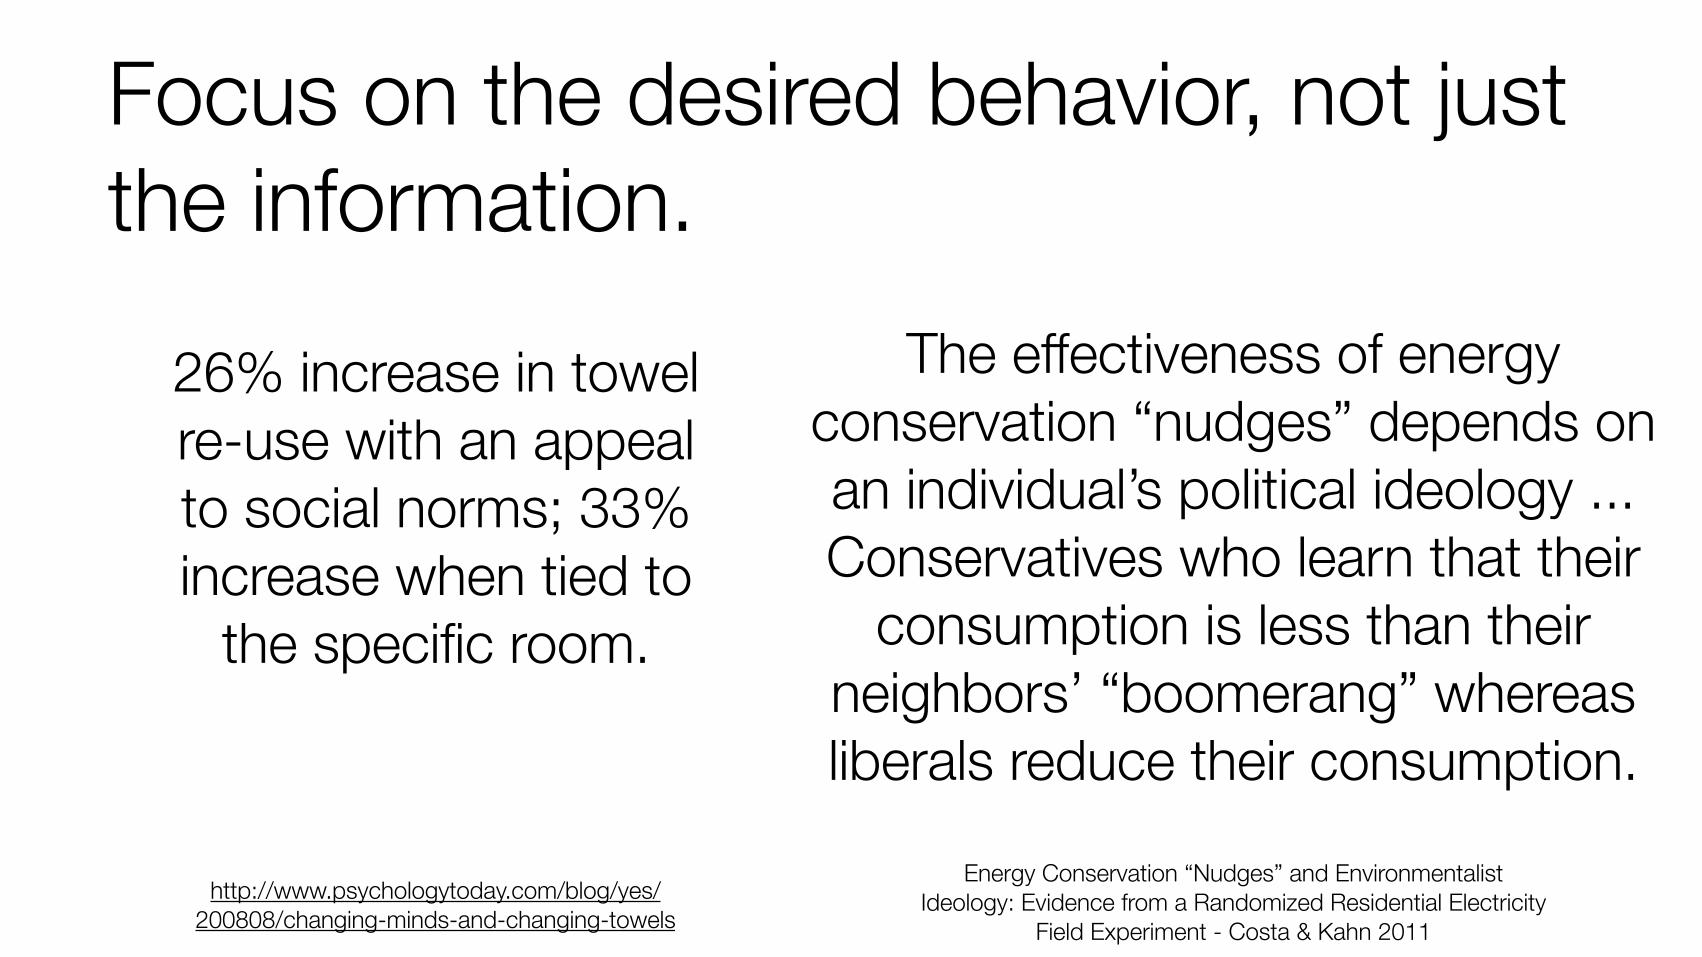
Focus on the desired behavior, not just the information.
http://www.psychologytoday.com/blog/yes/200808/changing-minds-and-changing-towels
26% increase in towel re-use with an appeal to social norms; 33% increase when tied to
the specific room.
Energy Conservation “Nudges” and Environmentalist Ideology: Evidence from a Randomized Residential Electricity
Field Experiment - Costa & Kahn 2011
The effectiveness of energy conservation “nudges” depends on an individual’s political ideology ... Conservatives who learn that their
consumption is less than their neighbors’ “boomerang” whereas liberals reduce their consumption.
Slaughter a sacred cow: Prove a long-held assumption is wrong and you’ve got people’s
attention.
Know what you’ll do with it ahead of time.

Take baby steps.
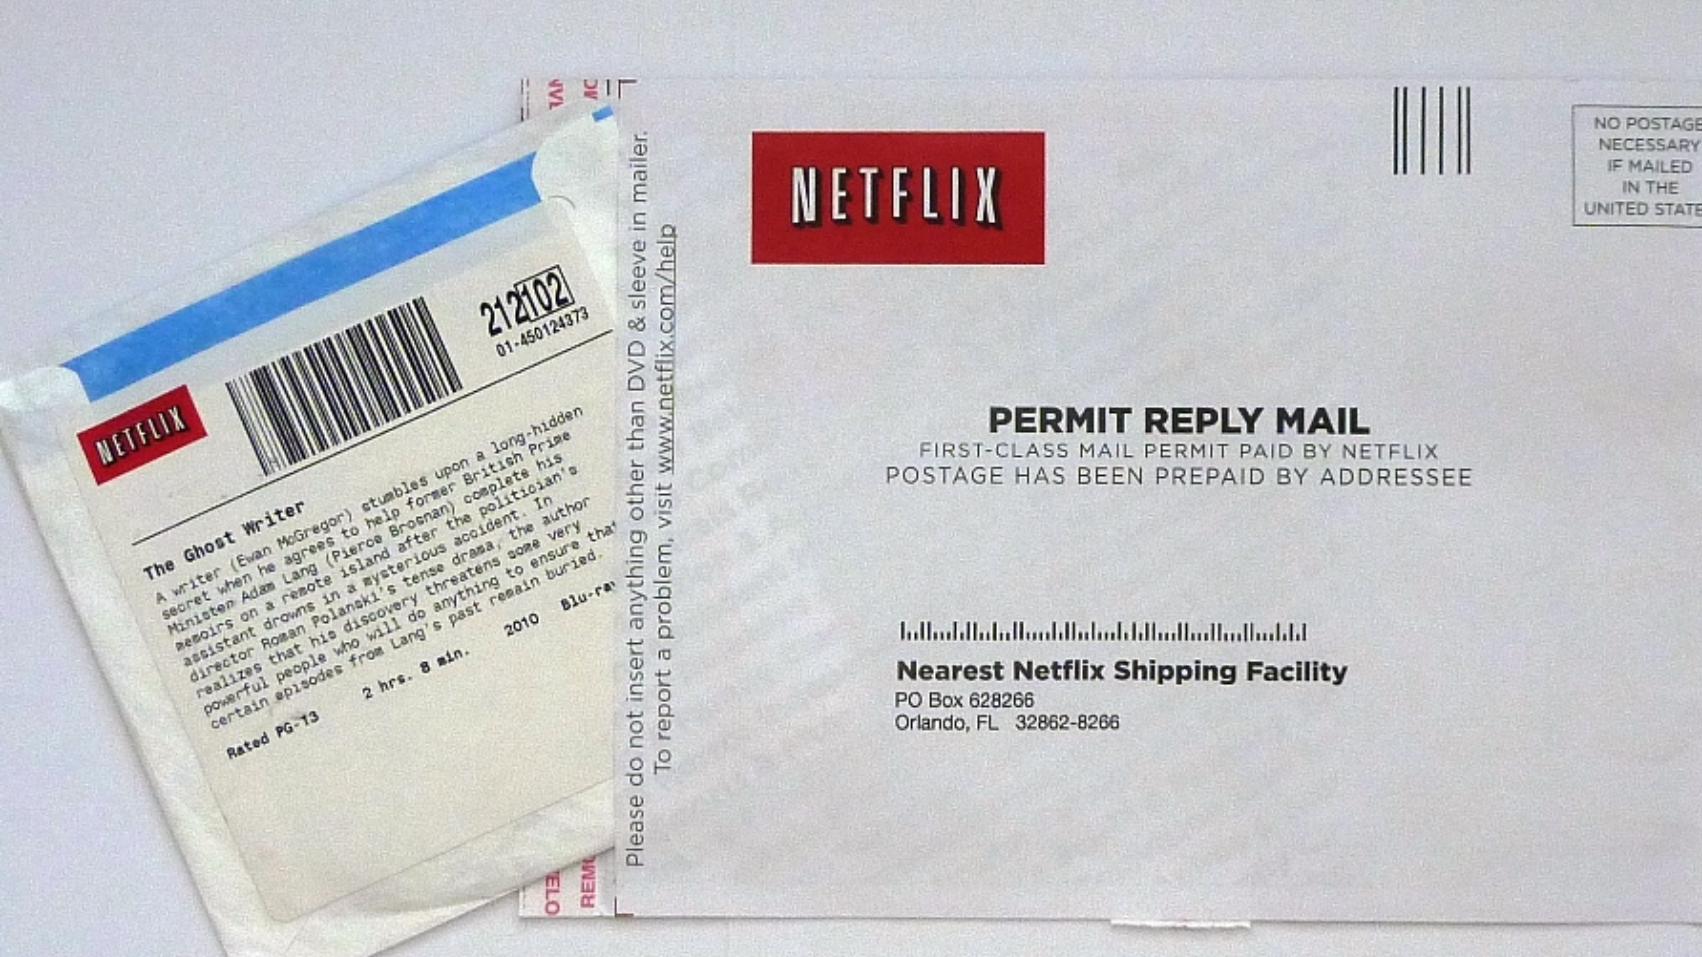
Netflix

Tesla
http://www.hdwallpapersinn.com/wp-content/uploads/2012/12/600-tesla.jpg
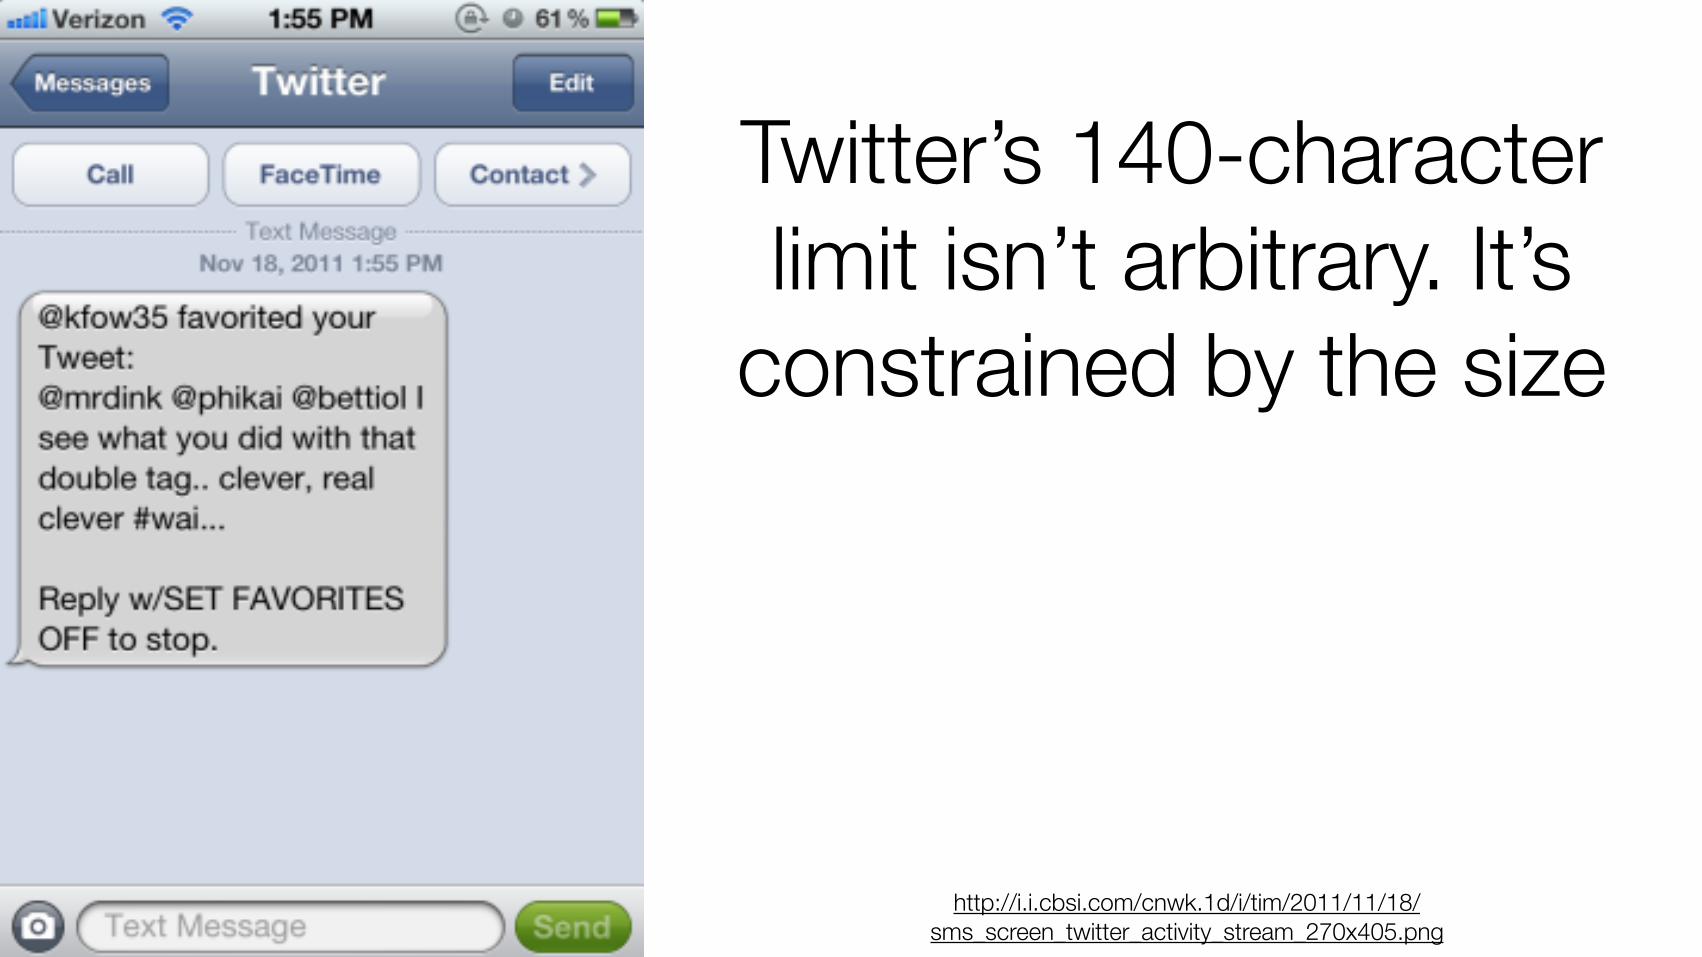
Twitter’s 140-character limit isn’t arbitrary. It’s
constrained by the size
http://i.i.cbsi.com/cnwk.1d/i/tim/2011/11/18/sms_screen_twitter_activity_stream_270x405.png
Figure out how to translate it back to a simple model that fits the company’s
existing value model.
If your company dies, this is why.
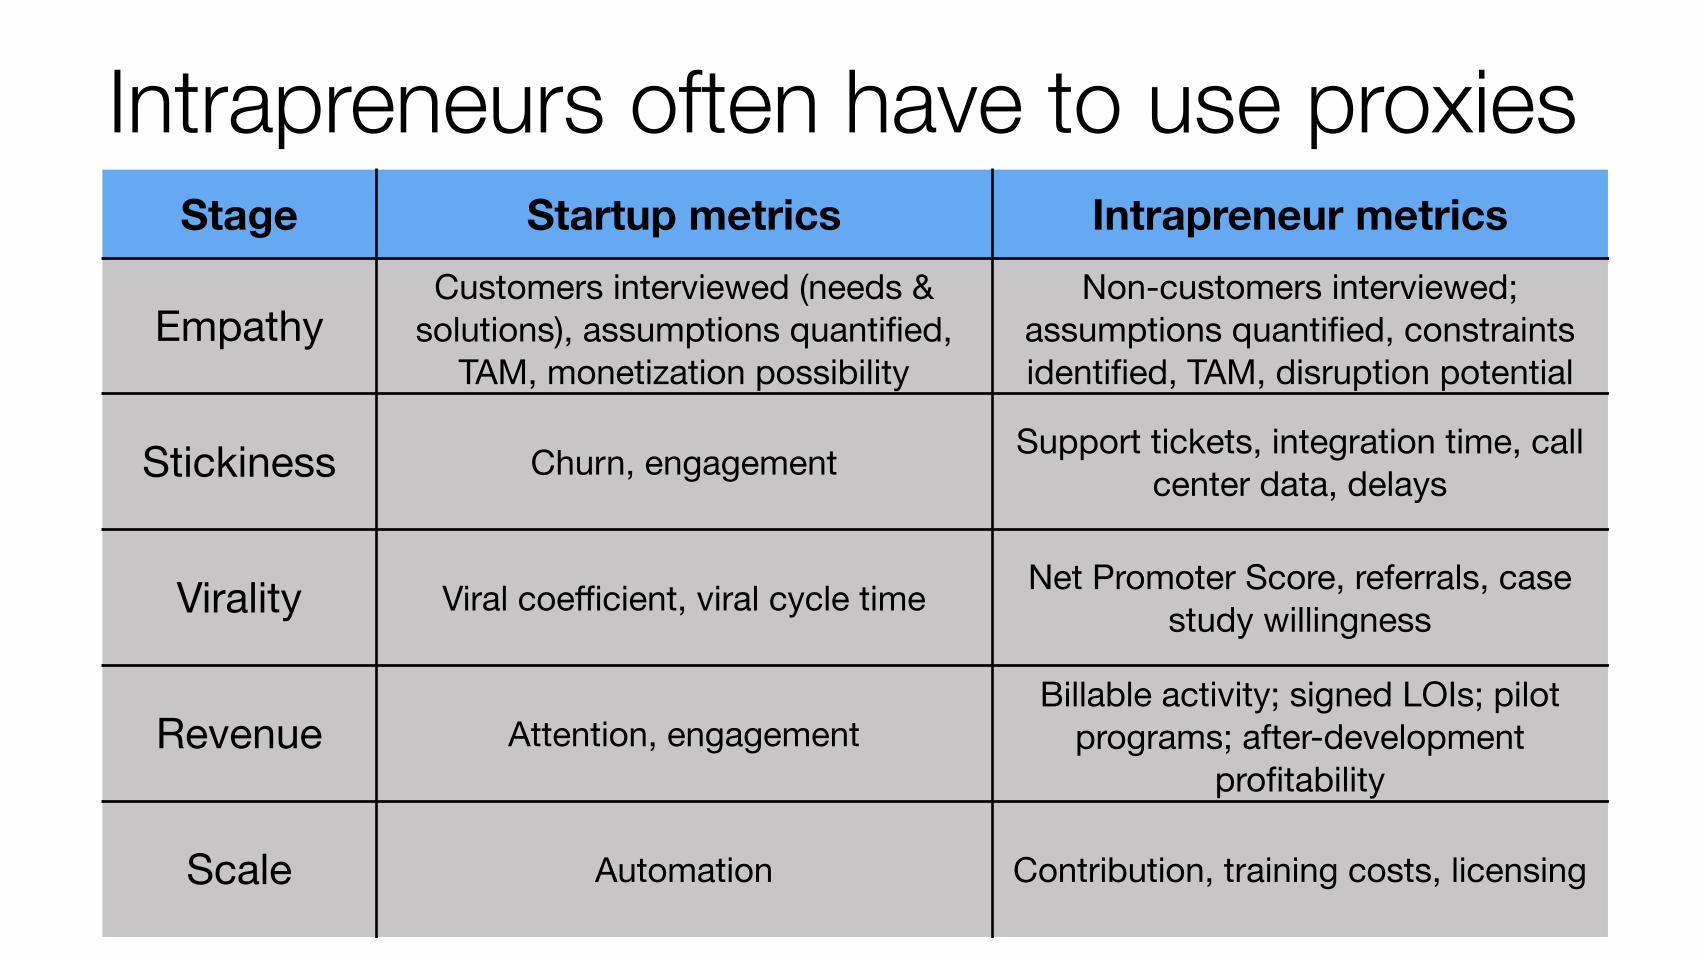
Intrapreneurs often have to use proxiesStage Startup metrics Intrapreneur metrics
EmpathyCustomers interviewed (needs &
solutions), assumptions quantified, TAM, monetization possibility
Non-customers interviewed; assumptions quantified, constraints identified, TAM, disruption potential
Stickiness Churn, engagement Support tickets, integration time, call center data, delays
Virality Viral coefficient, viral cycle time Net Promoter Score, referrals, case study willingness
Revenue Attention, engagementBillable activity; signed LOIs; pilot
programs; after-development profitability
Scale Automation Contribution, training costs, licensing
When you have support.
(What companies like P&G, Cognizant, GE, and Motorola do with a formal innovation program.)
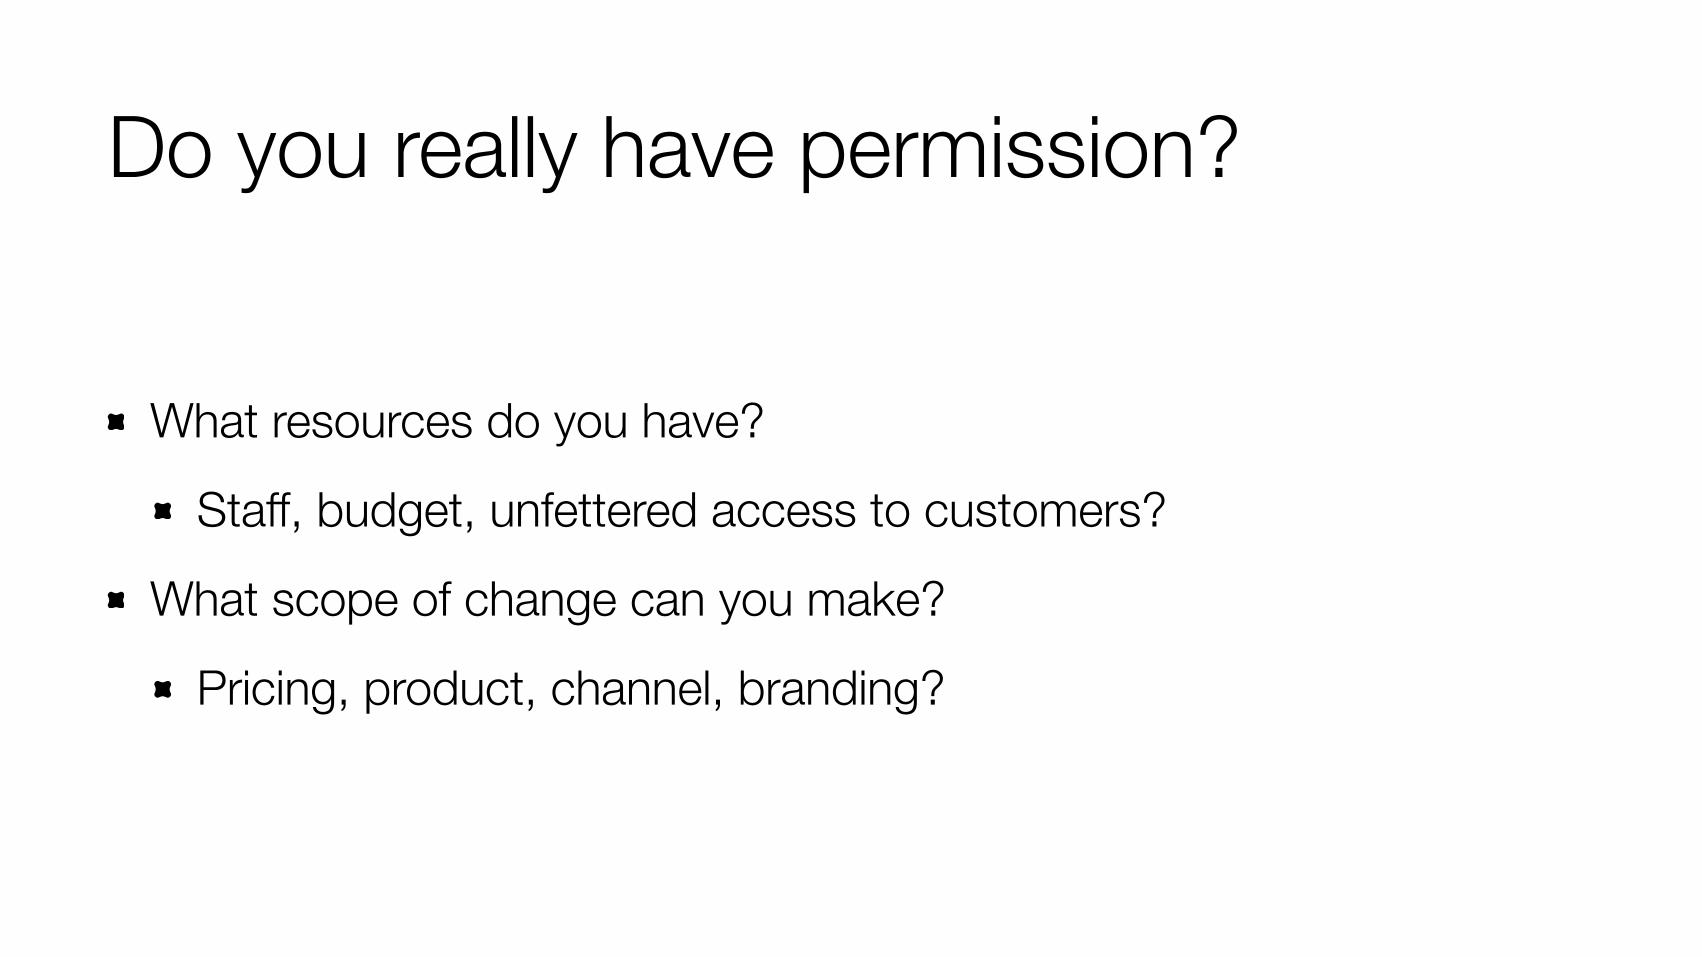
Do you really have permission?
What resources do you have?
Staff, budget, unfettered access to customers?
What scope of change can you make?
Pricing, product, channel, branding?
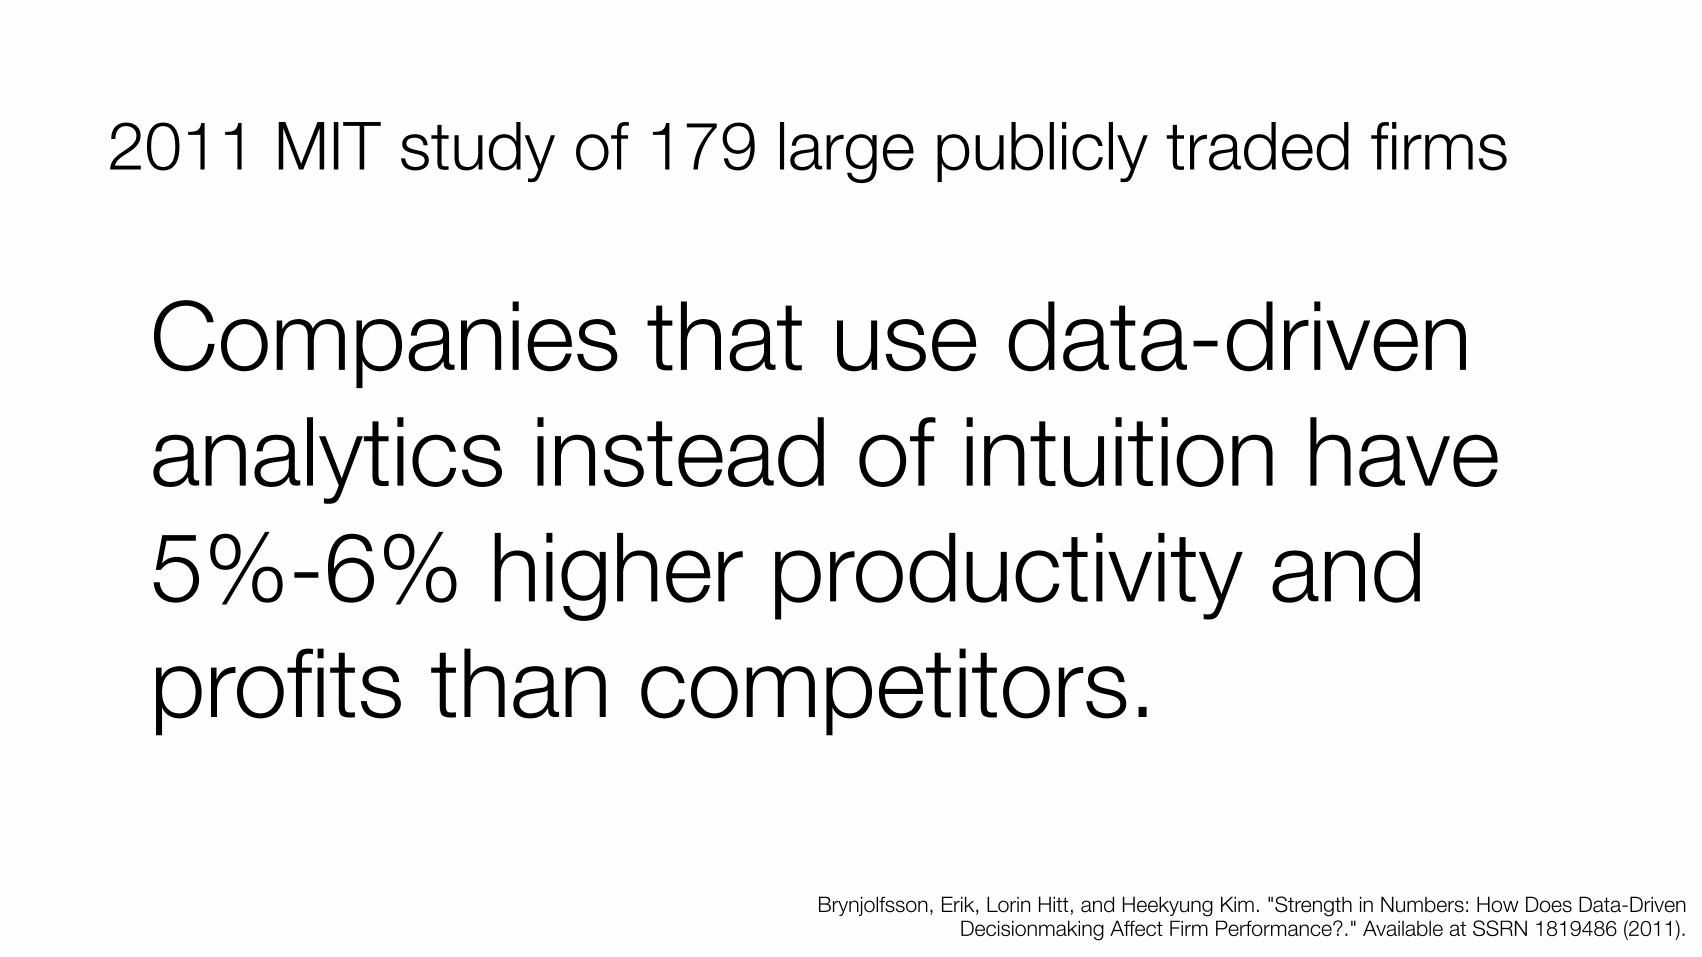
Companies that use data-driven analytics instead of intuition have 5%-6% higher productivity and profits than competitors.
Brynjolfsson, Erik, Lorin Hitt, and Heekyung Kim. "Strength in Numbers: How Does Data-Driven Decisionmaking Affect Firm Performance?." Available at SSRN 1819486 (2011).
2011 MIT study of 179 large publicly traded firms
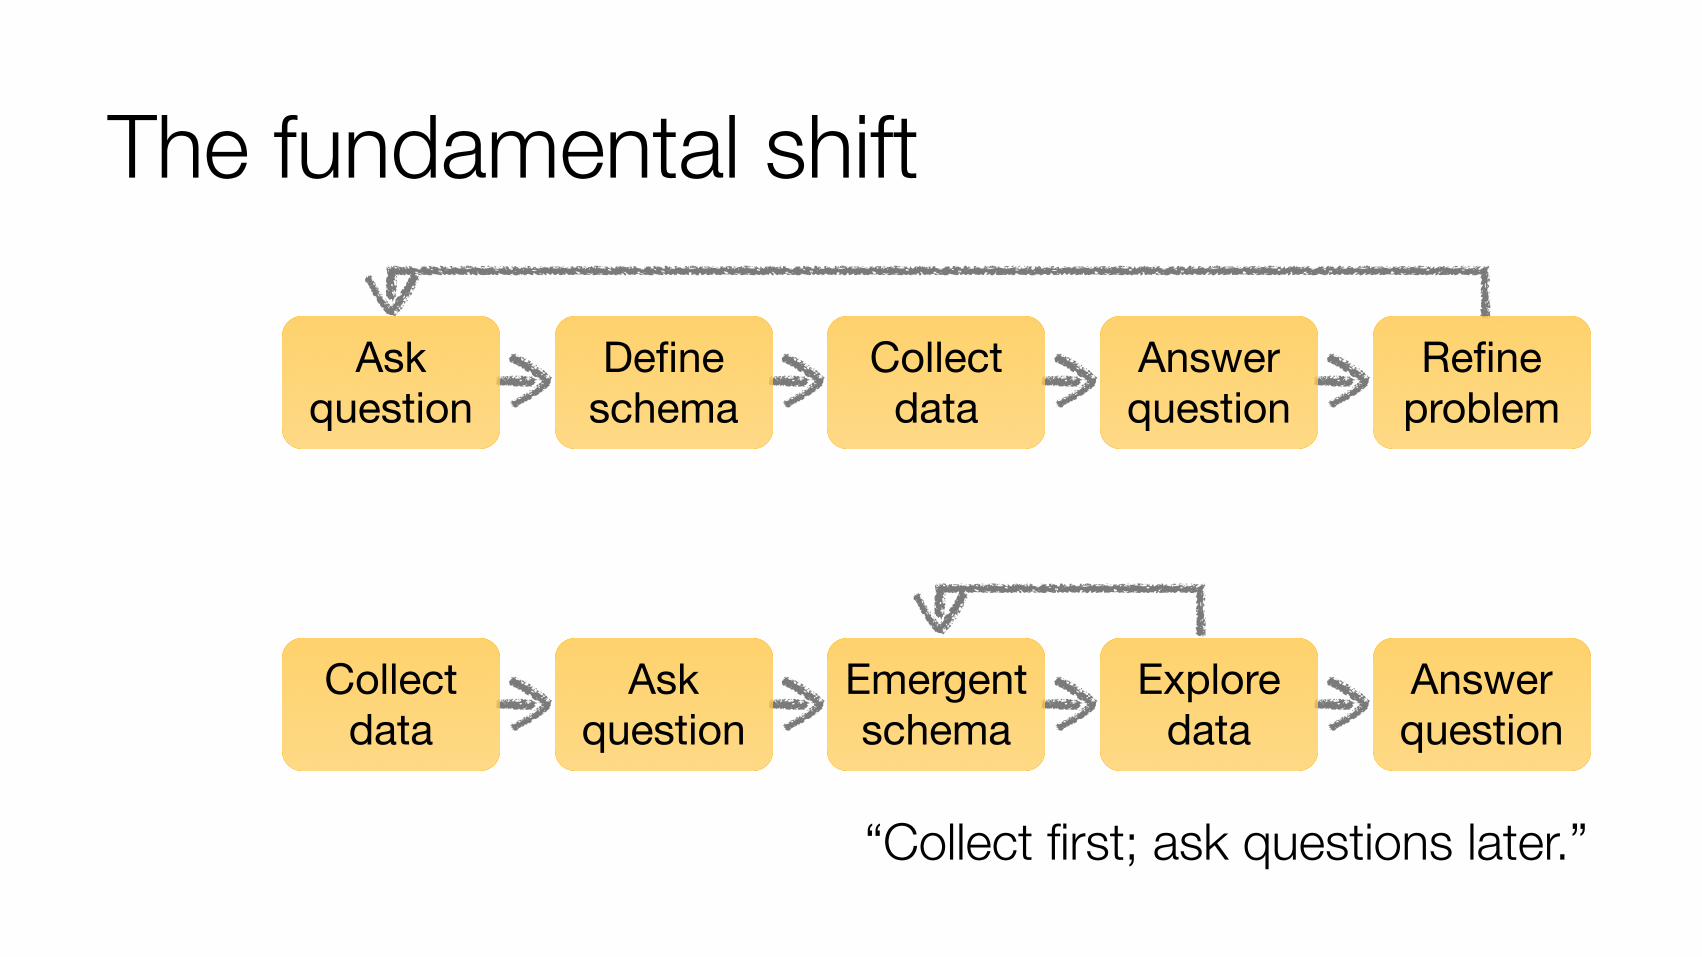
The fundamental shift
Ask question
Defineschema
Collectdata
Answerquestion
Refine problem
Collect data
Ask question
Emergent schema
Explore data
Answerquestion
“Collect first; ask questions later.”
What kind of mandate do you have?

Step one: Develop a portfolio approach.
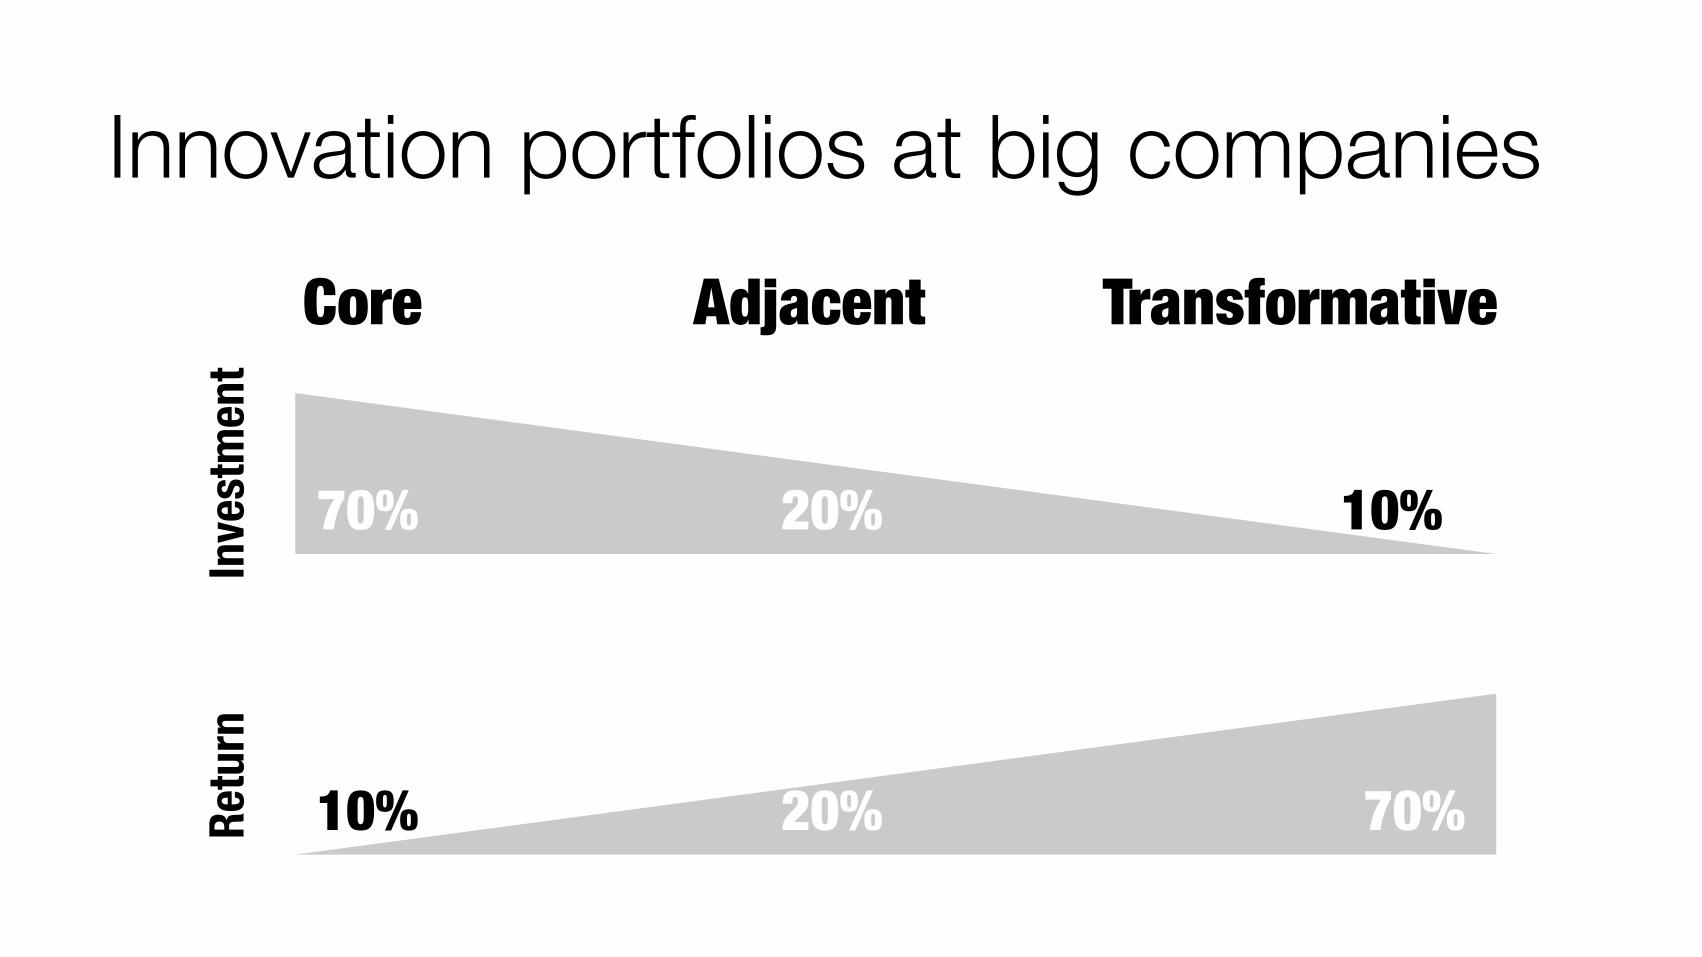
Innovation portfolios at big companiesCore Adjacent Transformative
70% 20% 10%
Inve
stm
ent
70%20%10%Retu
rn
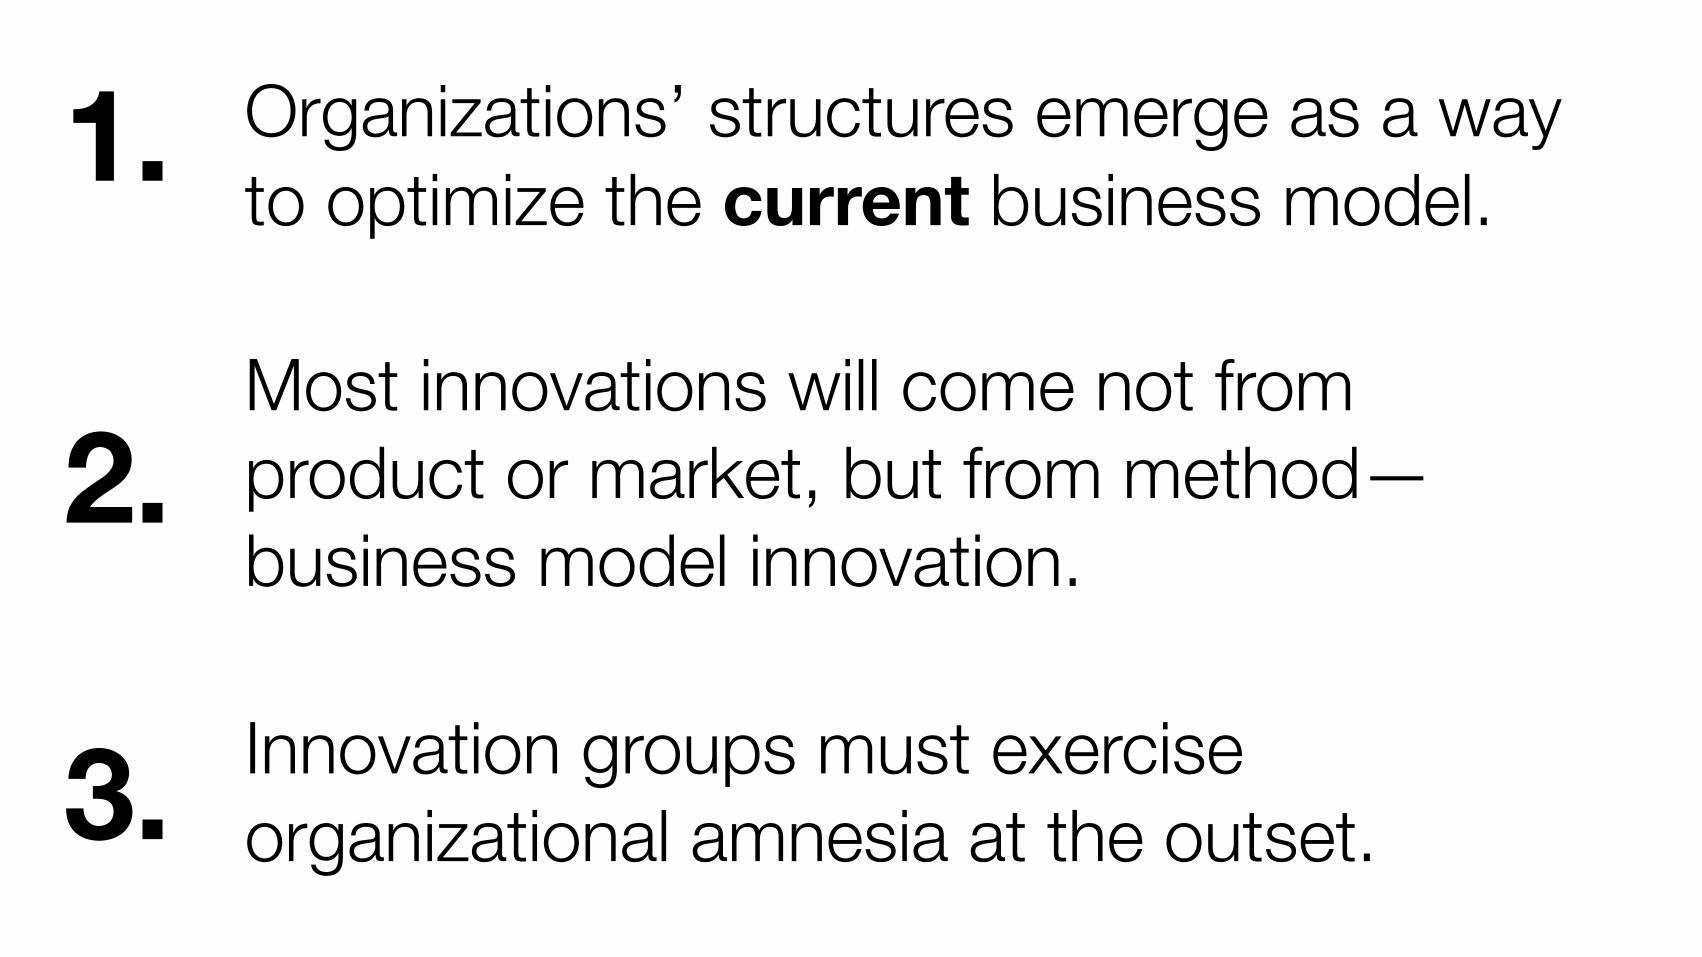
Organizations’ structures emerge as a way to optimize the current business model.
Most innovations will come not from product or market, but from method—business model innovation.
Innovation groups must exercise organizational amnesia at the outset.
1.
2.
3.
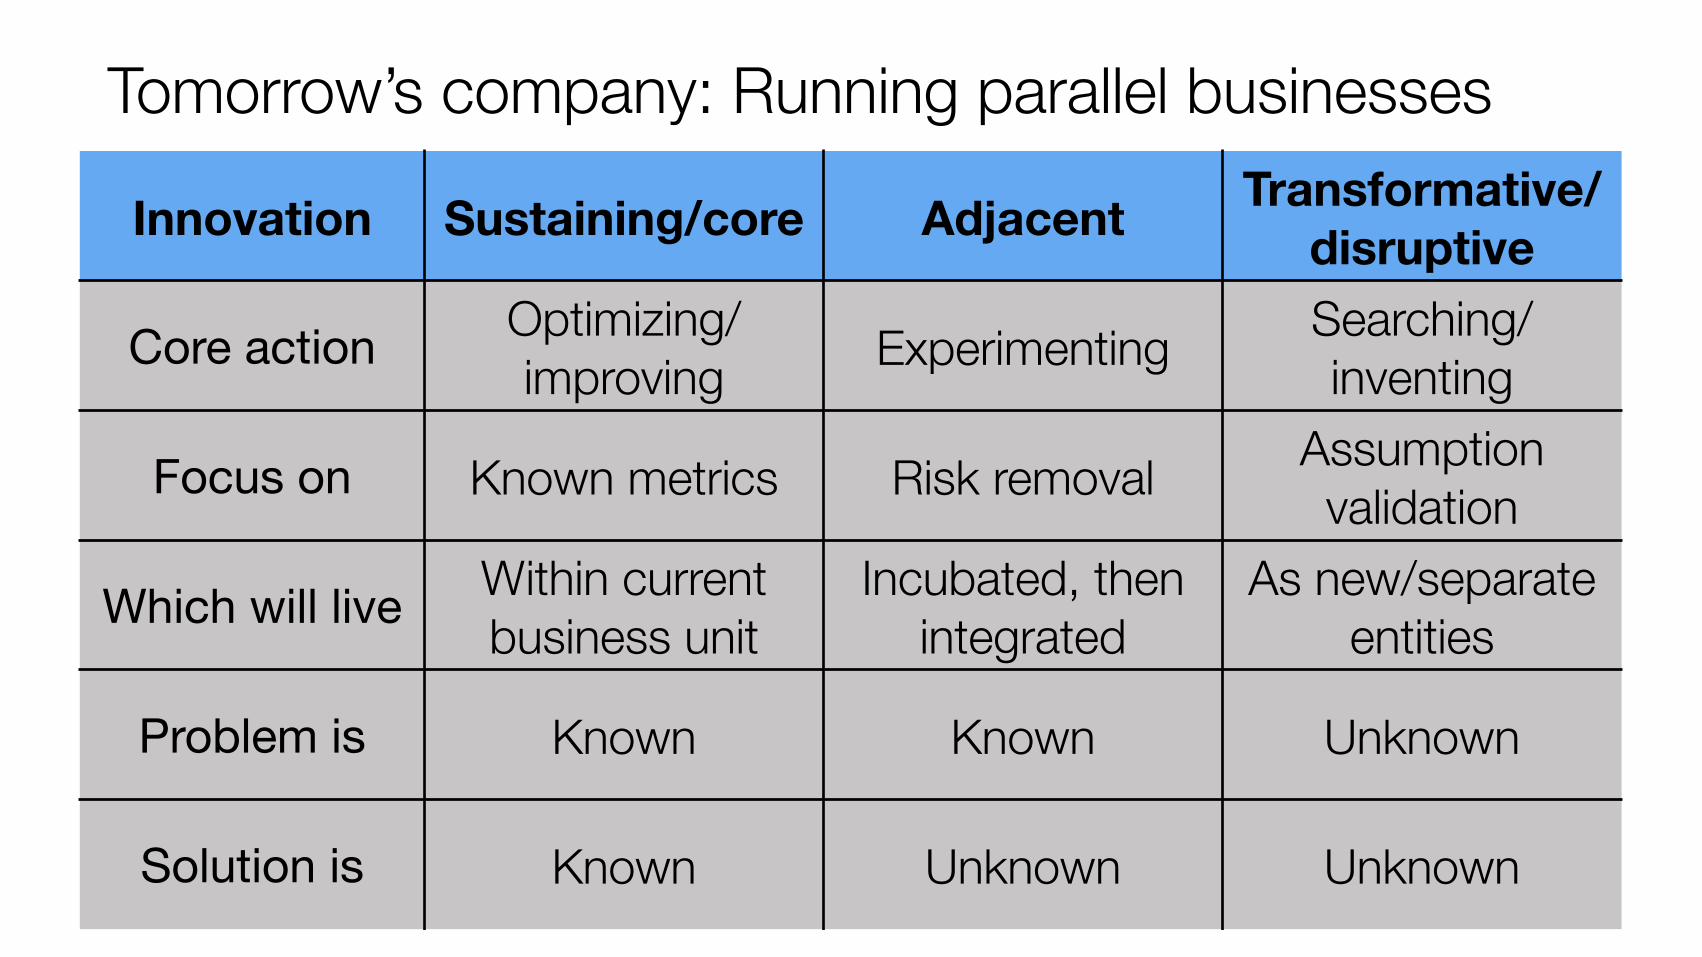
Tomorrow’s company: Running parallel businesses
Innovation Sustaining/core Adjacent Transformative/disruptive
Core action Optimizing/improving Experimenting Searching/
inventing
Focus on Known metrics Risk removal Assumption validation
Which will live Within current business unit
Incubated, then integrated
As new/separate entities
Problem is Known Known Unknown
Solution is Known Unknown Unknown

Step one: Frame your problems.
(See also: Christensen’s Jobs to be done.)
Step two: Define your gates and filters.
These may lead to myopia.They are also your unfair advantages.
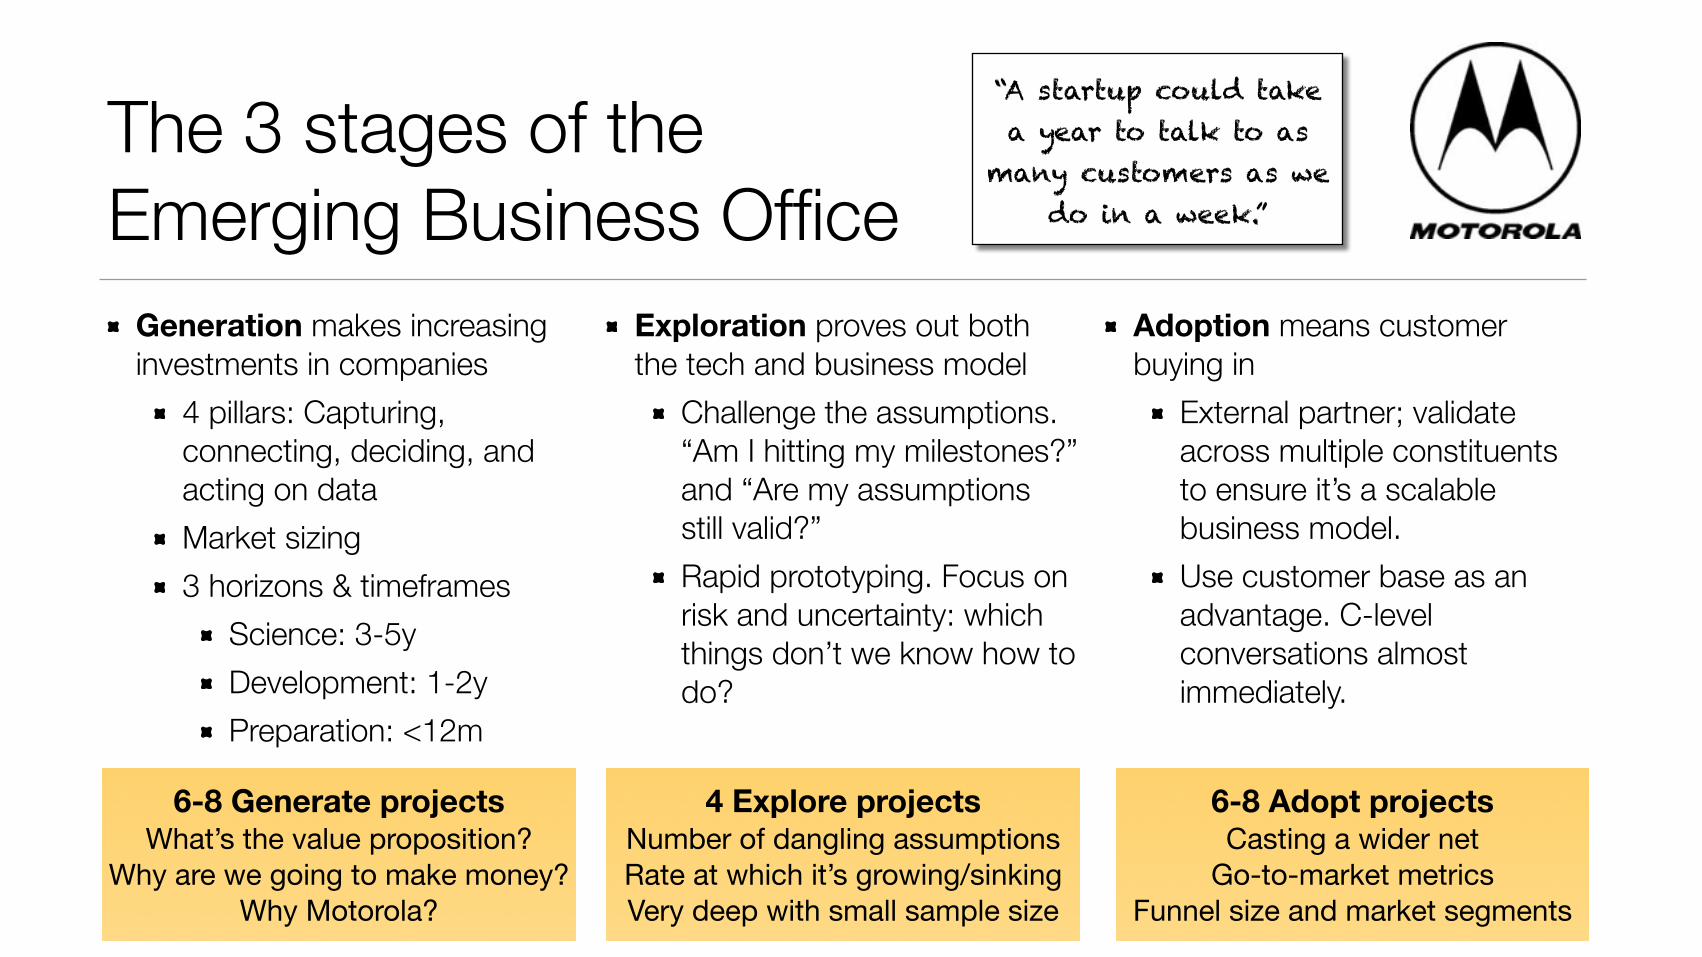
The 3 stages of the Emerging Business Office
Generation makes increasing investments in companies
4 pillars: Capturing, connecting, deciding, and acting on data Market sizing 3 horizons & timeframes
Science: 3-5y Development: 1-2y Preparation: <12m
Exploration proves out both the tech and business model
Challenge the assumptions. “Am I hitting my milestones?” and “Are my assumptions still valid?” Rapid prototyping. Focus on risk and uncertainty: which things don’t we know how to do?
Adoption means customer buying in
External partner; validate across multiple constituents to ensure it’s a scalable business model. Use customer base as an advantage. C-level conversations almost immediately.
“A startup could take a year to talk to as
many customers as we do in a week.”
6-8 Generate projects What’s the value proposition?
Why are we going to make money?Why Motorola?
4 Explore projects Number of dangling assumptionsRate at which it’s growing/sinkingVery deep with small sample size
6-8 Adopt projects Casting a wider net
Go-to-market metricsFunnel size and market segments
Step three: Secure funding, resources, and executive backing.
ReinvestingFor every $100 they cut, Metlife reinvests $66 in new projects.

Step four: Generate new ideas.
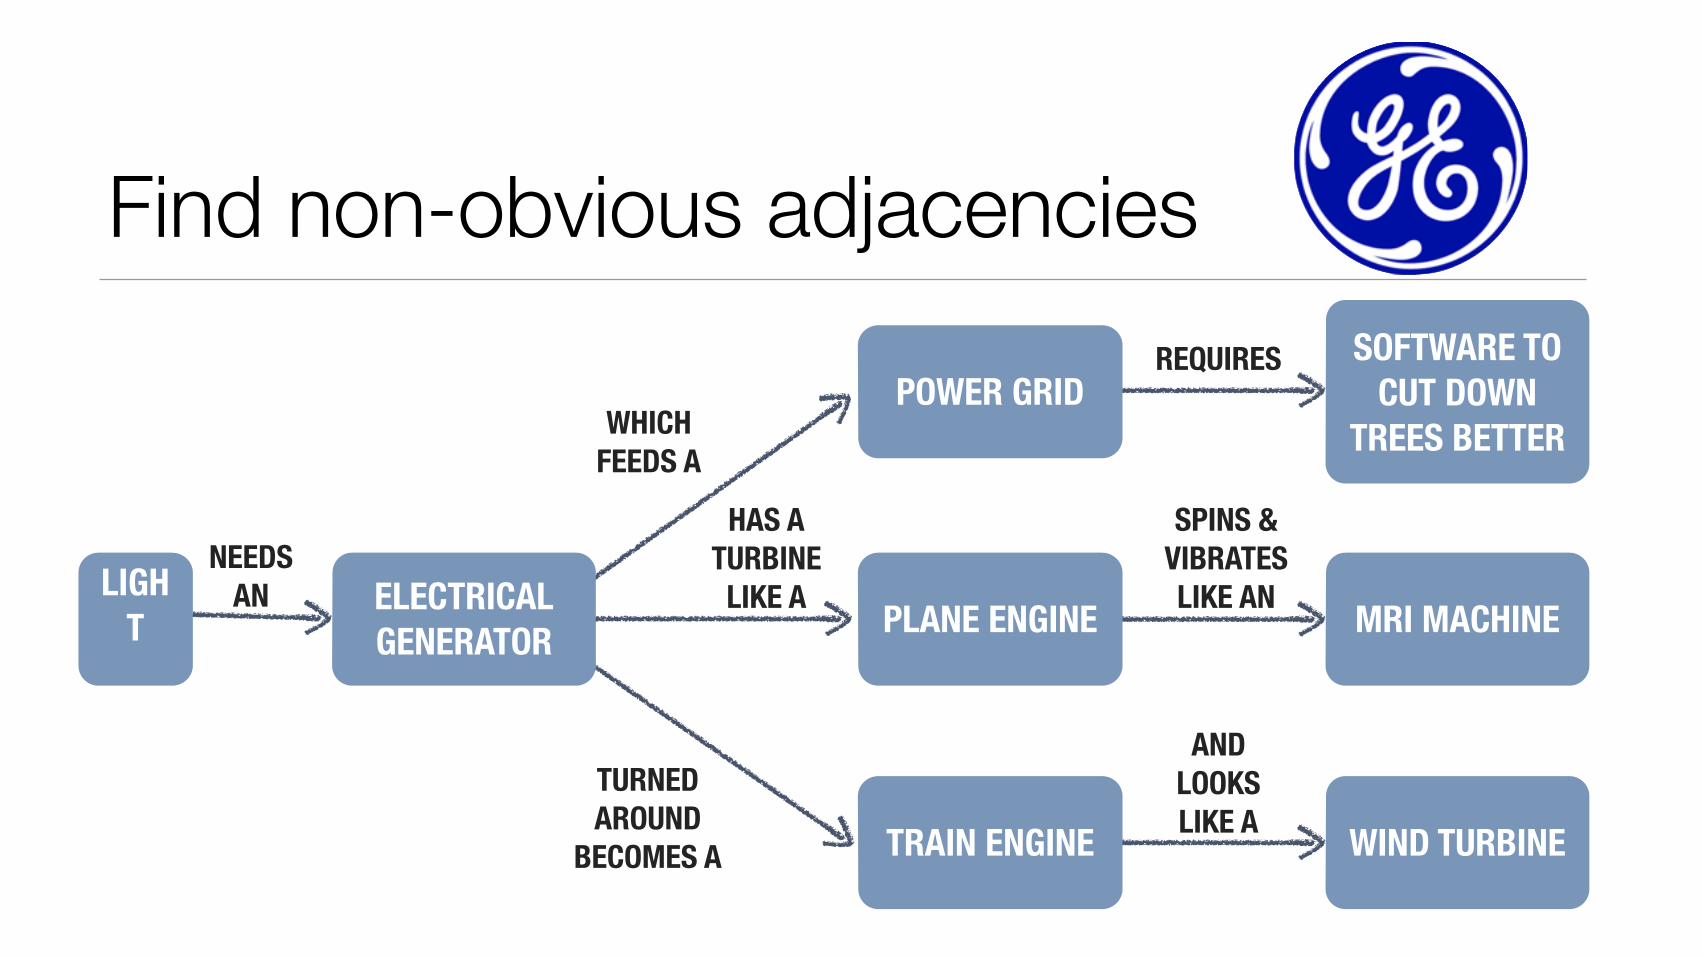
Find non-obvious adjacencies
LIGHT
ELECTRICAL GENERATOR
TRAIN ENGINE WIND TURBINE
MRI MACHINE
POWER GRIDSOFTWARE TO
CUT DOWN TREES BETTER
PLANE ENGINENEEDS
AN
WHICH FEEDS A
HAS A TURBINE LIKE A
TURNED AROUND
BECOMES A
SPINS & VIBRATES LIKE AN
REQUIRES
AND LOOKS LIKE A
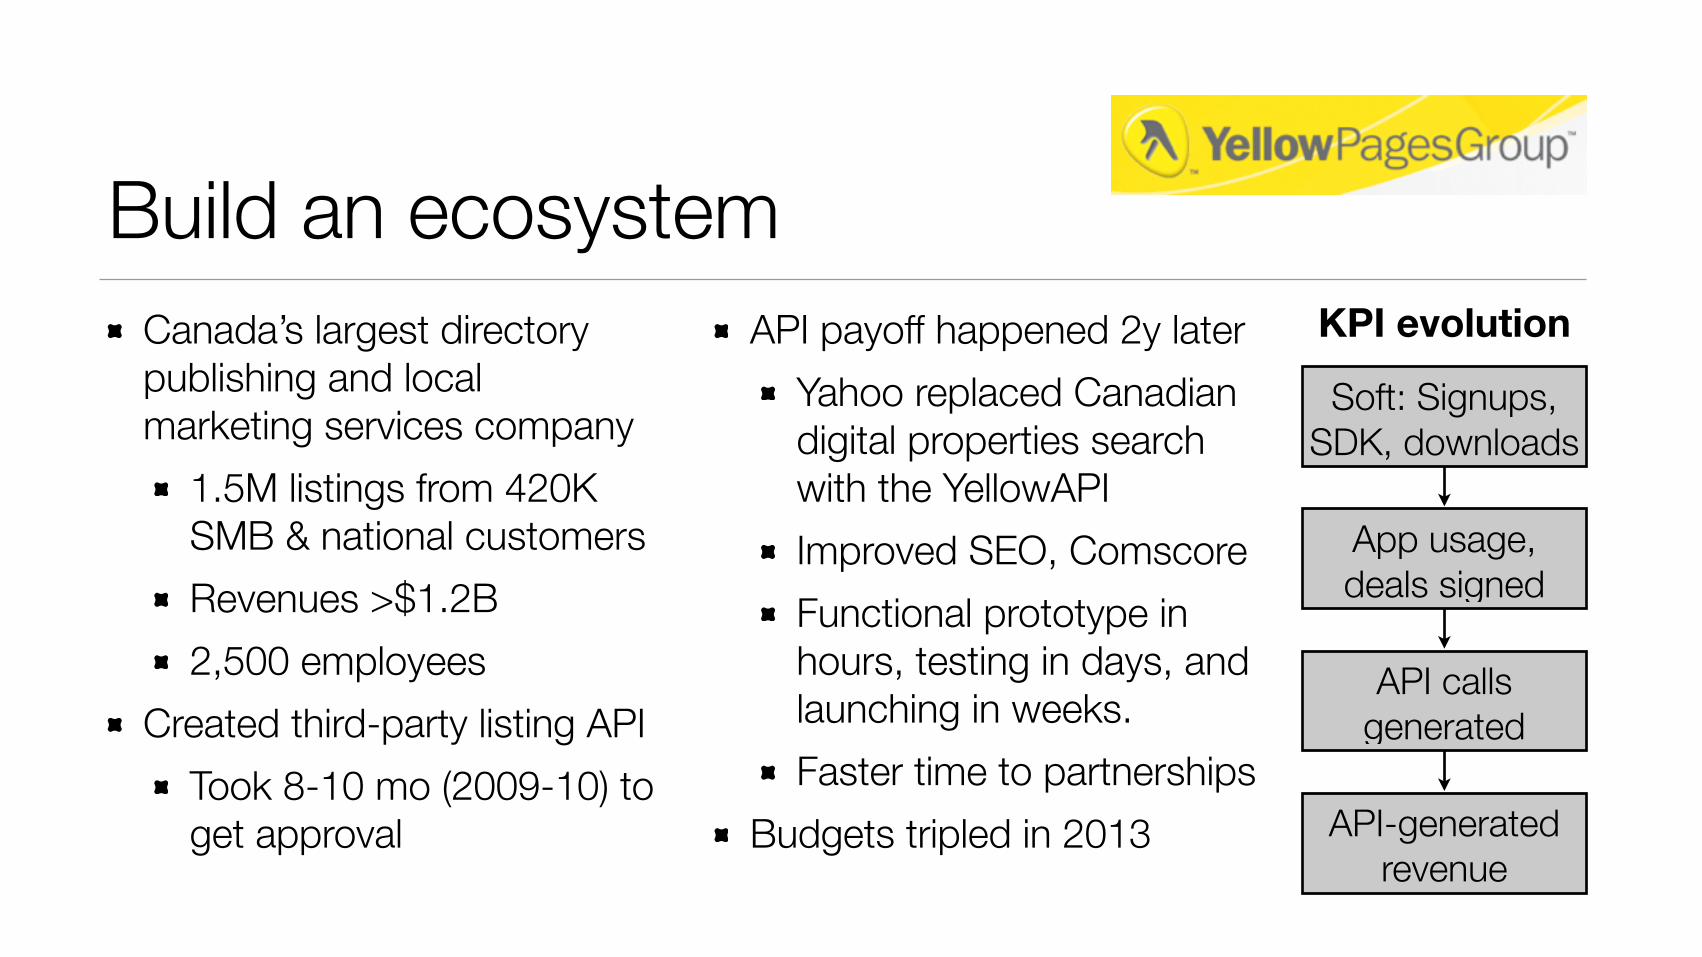
Build an ecosystemCanada’s largest directory publishing and local marketing services company
1.5M listings from 420K SMB & national customers Revenues >$1.2B 2,500 employees
Created third-party listing API Took 8-10 mo (2009-10) to get approval
API payoff happened 2y later Yahoo replaced Canadian digital properties search with the YellowAPI Improved SEO, Comscore Functional prototype in hours, testing in days, and launching in weeks. Faster time to partnerships
Budgets tripled in 2013
Soft: Signups, SDK, downloads
App usage, deals signed
API calls generated
API-generated revenue
KPI evolution
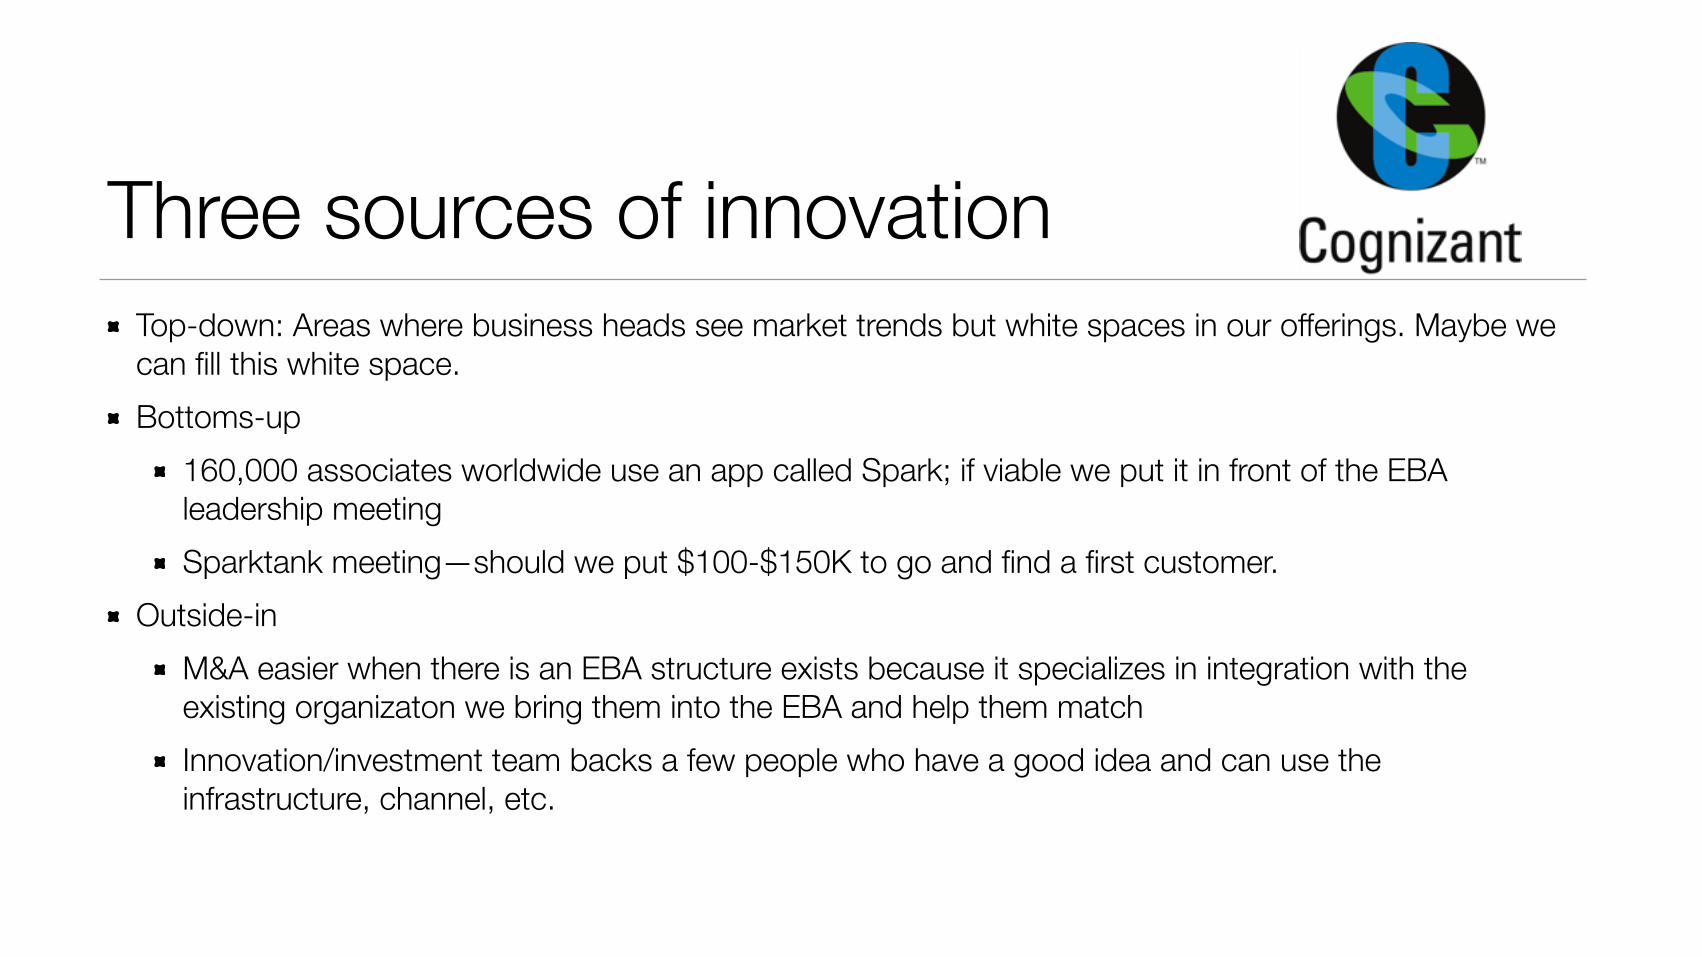
Three sources of innovationTop-down: Areas where business heads see market trends but white spaces in our offerings. Maybe we can fill this white space. Bottoms-up
160,000 associates worldwide use an app called Spark; if viable we put it in front of the EBA leadership meeting Sparktank meeting—should we put $100-$150K to go and find a first customer.
Outside-in M&A easier when there is an EBA structure exists because it specializes in integration with the existing organizaton we bring them into the EBA and help them match Innovation/investment team backs a few people who have a good idea and can use the infrastructure, channel, etc.
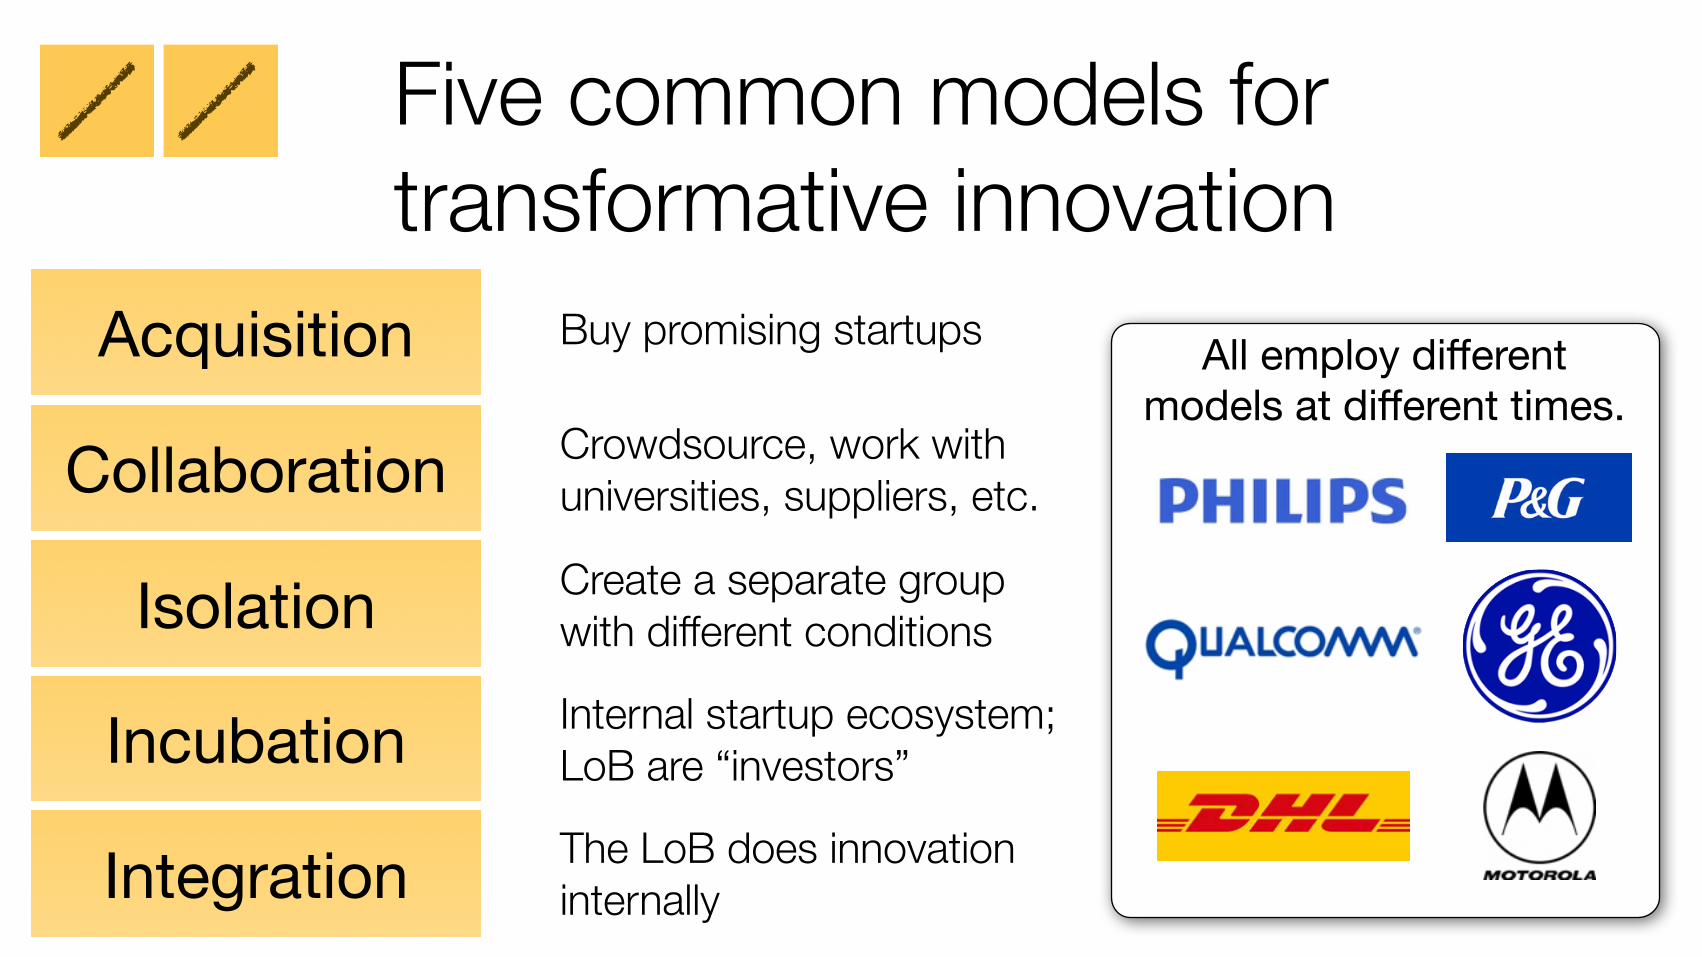
All employ different models at different times.
Five common models for transformative innovation
Isolation
Acquisition
Integration
Incubation
Collaboration
Buy promising startups
Crowdsource, work with universities, suppliers, etc.
Create a separate group with different conditions
Internal startup ecosystem; LoB are “investors”
The LoB does innovation internally
Step five: Test by doing: Experimentation beats projection.
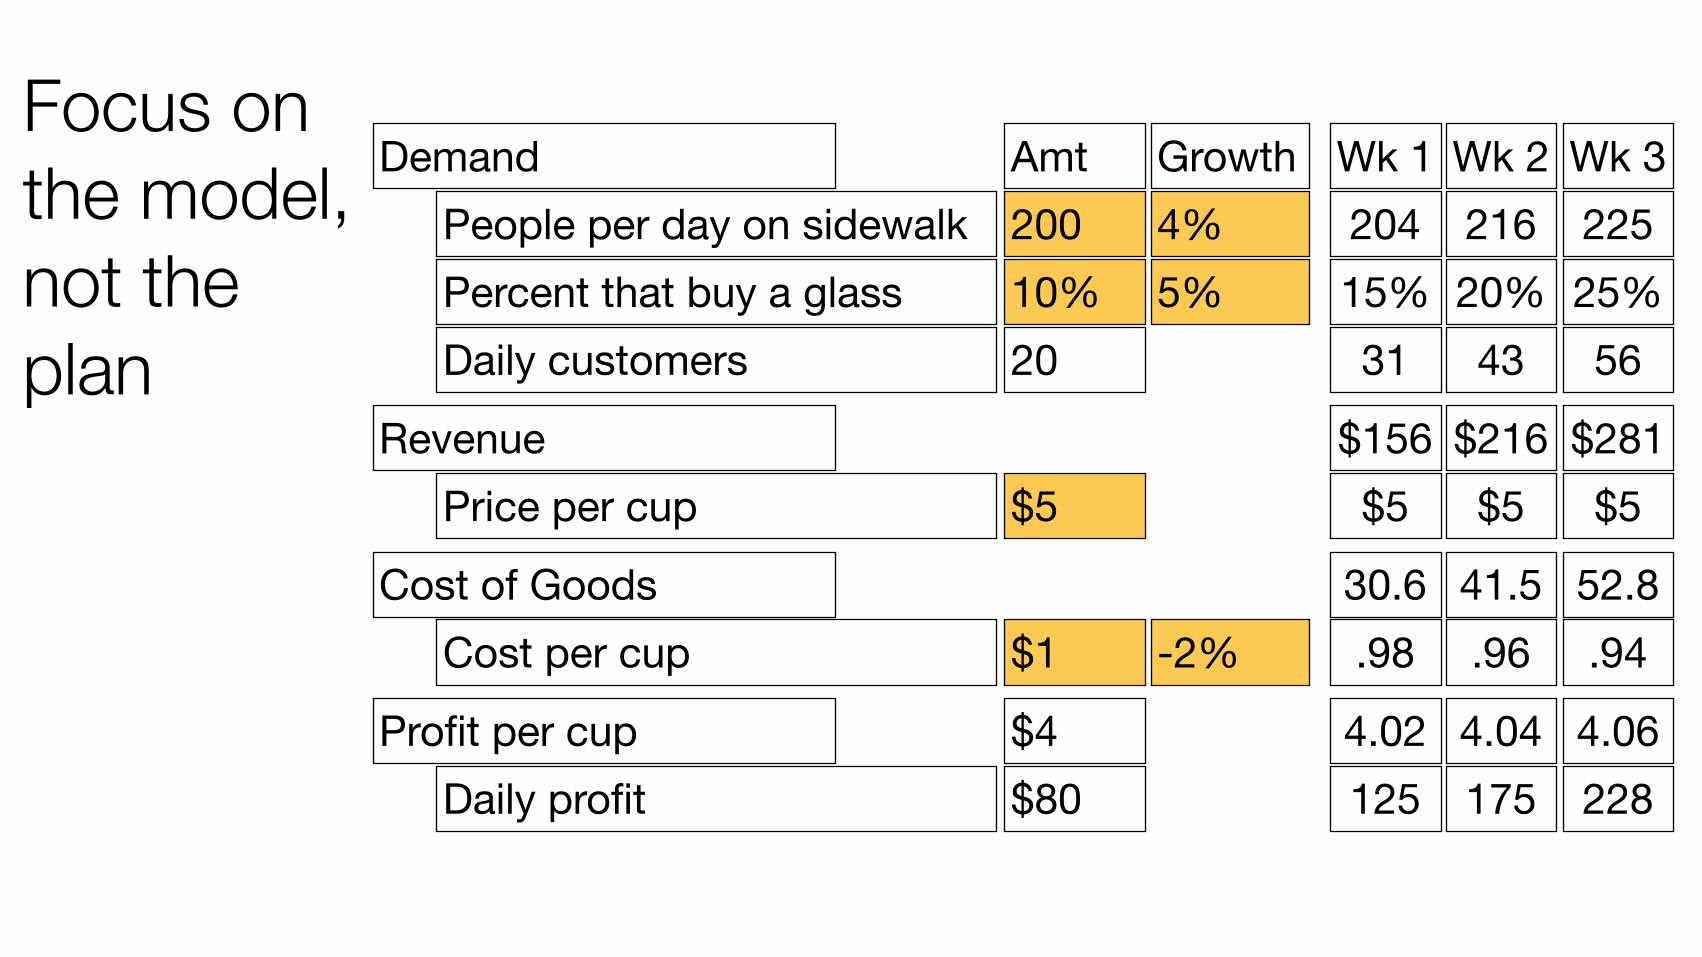
Focus on the model, not the plan
Cost of Goods
Demand
Cost per cup
People per day on sidewalkPercent that buy a glass
RevenuePrice per cup
Profit per cupDaily profit
Daily customers
Amt20010%20
$5
$1
$80$4
Growth4%5%
-2%
Wk 120415%
.98
Wk 221620%
.96
Wk 322525%
.94
$156
30.6
$216
41.5
$281
52.8
125 175 2284.02 4.04 4.06
31 43 56
$5 $5 $5
A business plan is just what happens when you drag the business model to the right.
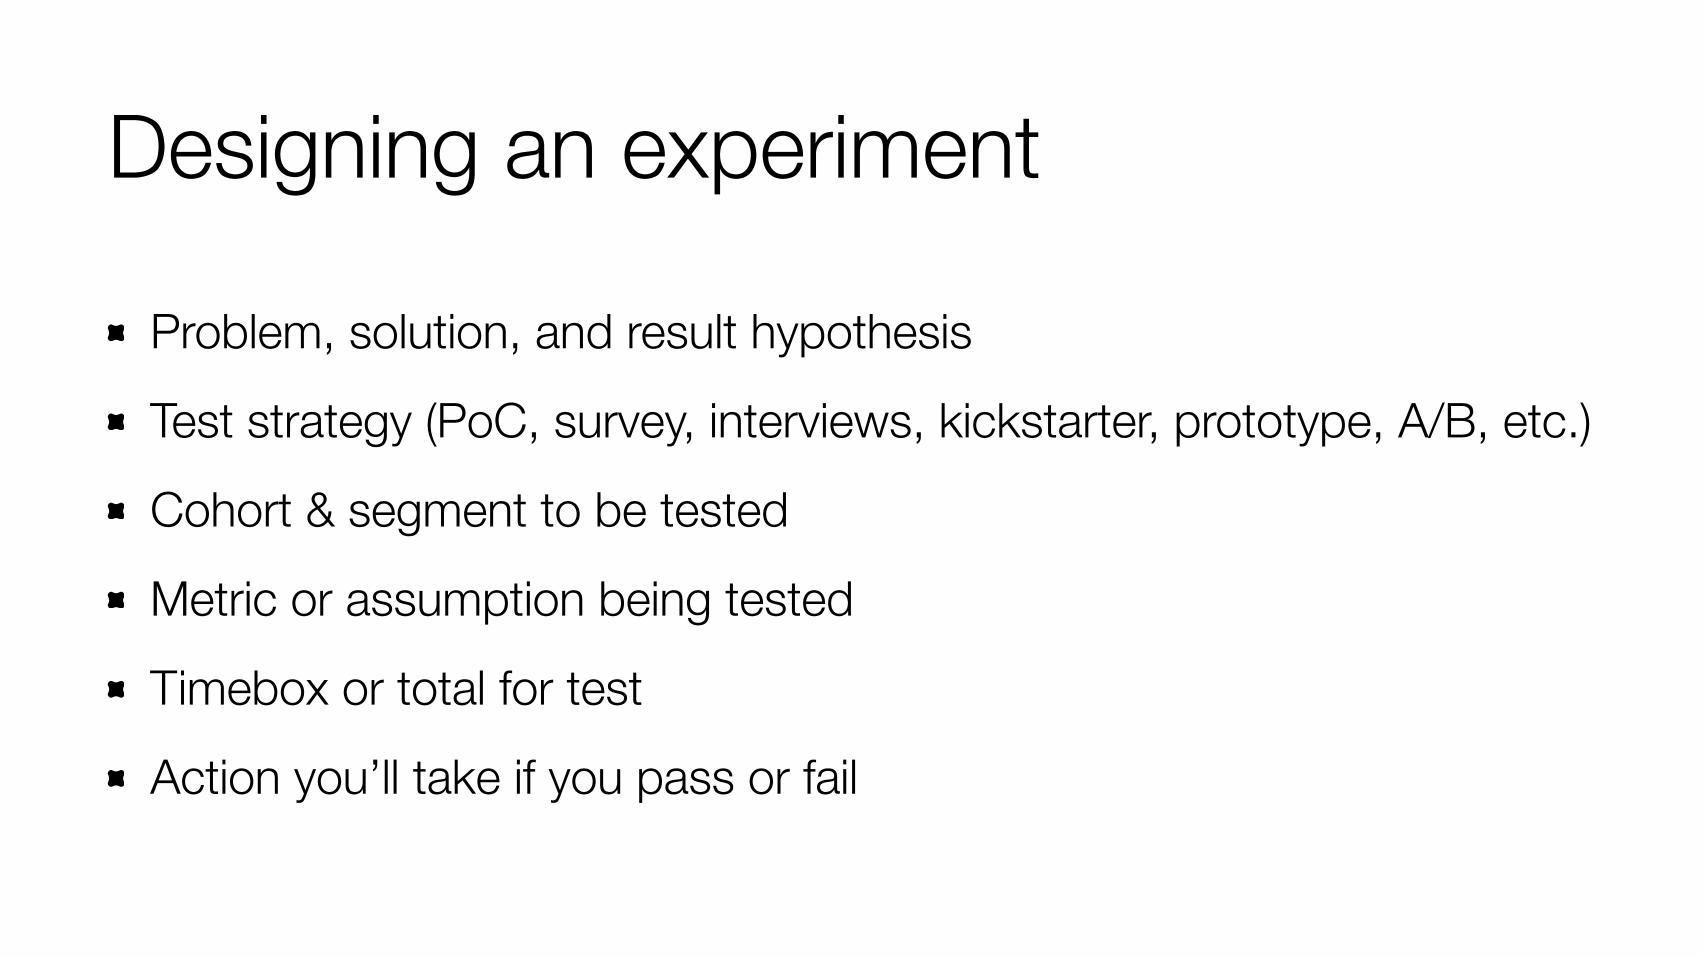
Designing an experiment
Problem, solution, and result hypothesis
Test strategy (PoC, survey, interviews, kickstarter, prototype, A/B, etc.)
Cohort & segment to be tested
Metric or assumption being tested
Timebox or total for test
Action you’ll take if you pass or fail
Step six: Know what happens afterwards
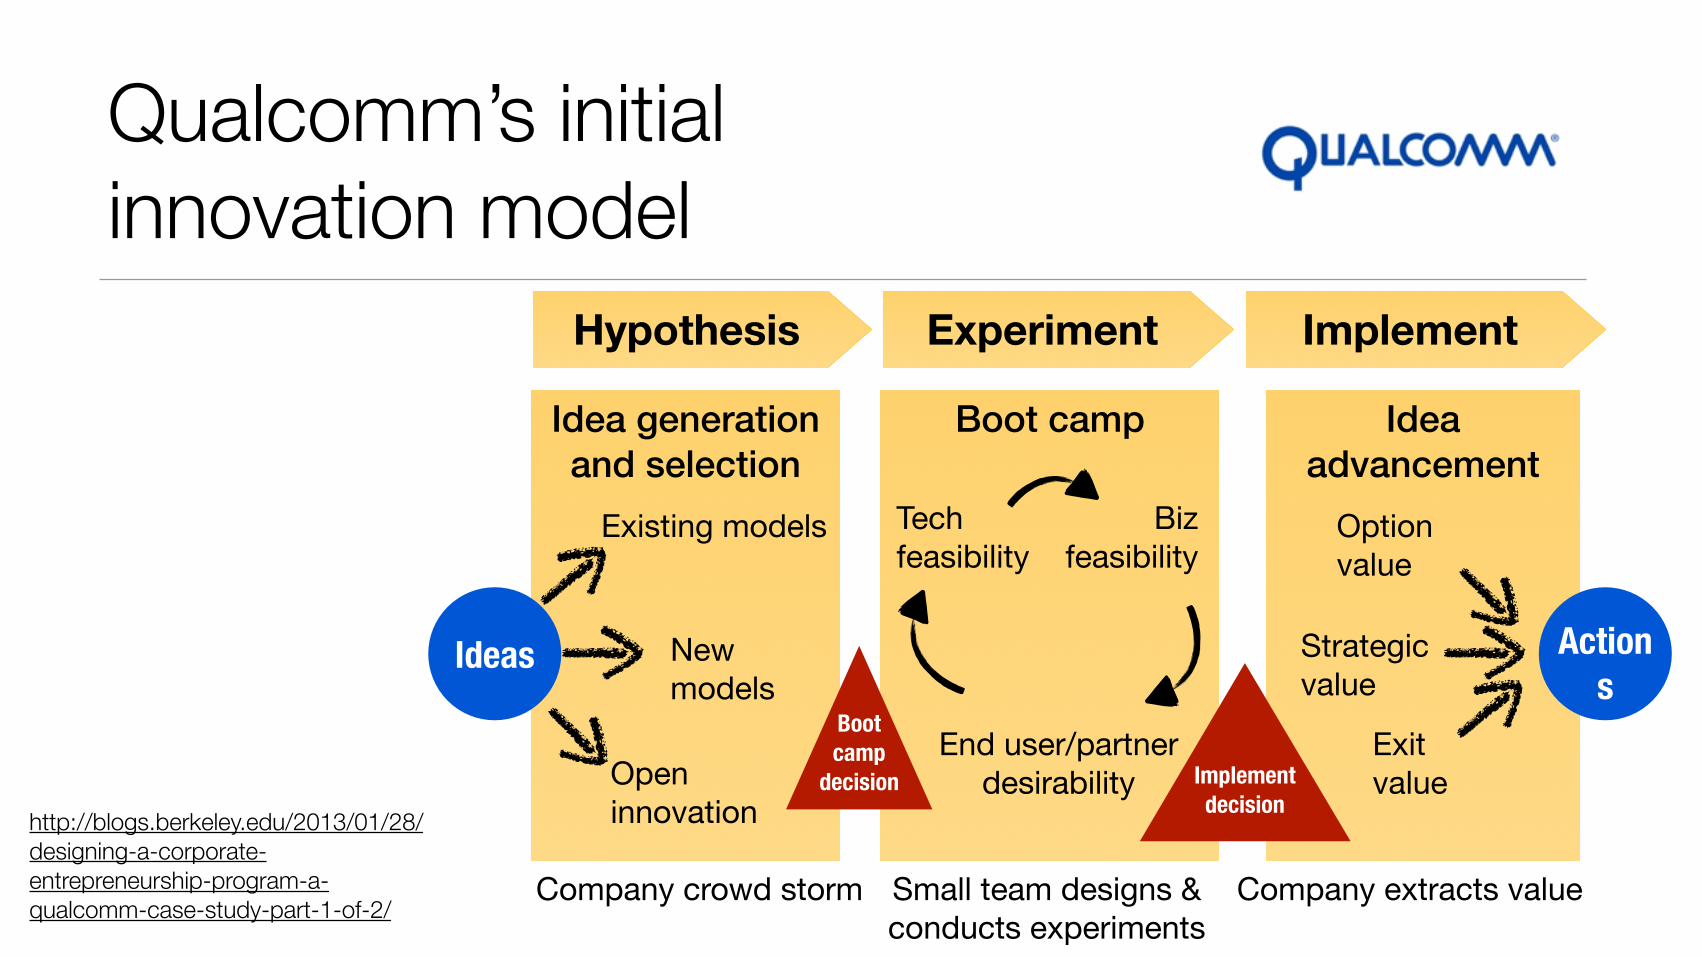
Qualcomm’s initial innovation model
http://blogs.berkeley.edu/2013/01/28/designing-a-corporate-entrepreneurship-program-a-qualcomm-case-study-part-1-of-2/
Idea generation and selection
Boot camp Idea advancement
Ideas
Existing models
Newmodels
Openinnovation
Techfeasibility
Bizfeasibility
End user/partnerdesirability
Actions
Optionvalue
Strategicvalue
Exitvalue
Hypothesis Experiment Implement
Company crowd storm Small team designs &conducts experiments
Company extracts value
Boot camp
decision Implement decision
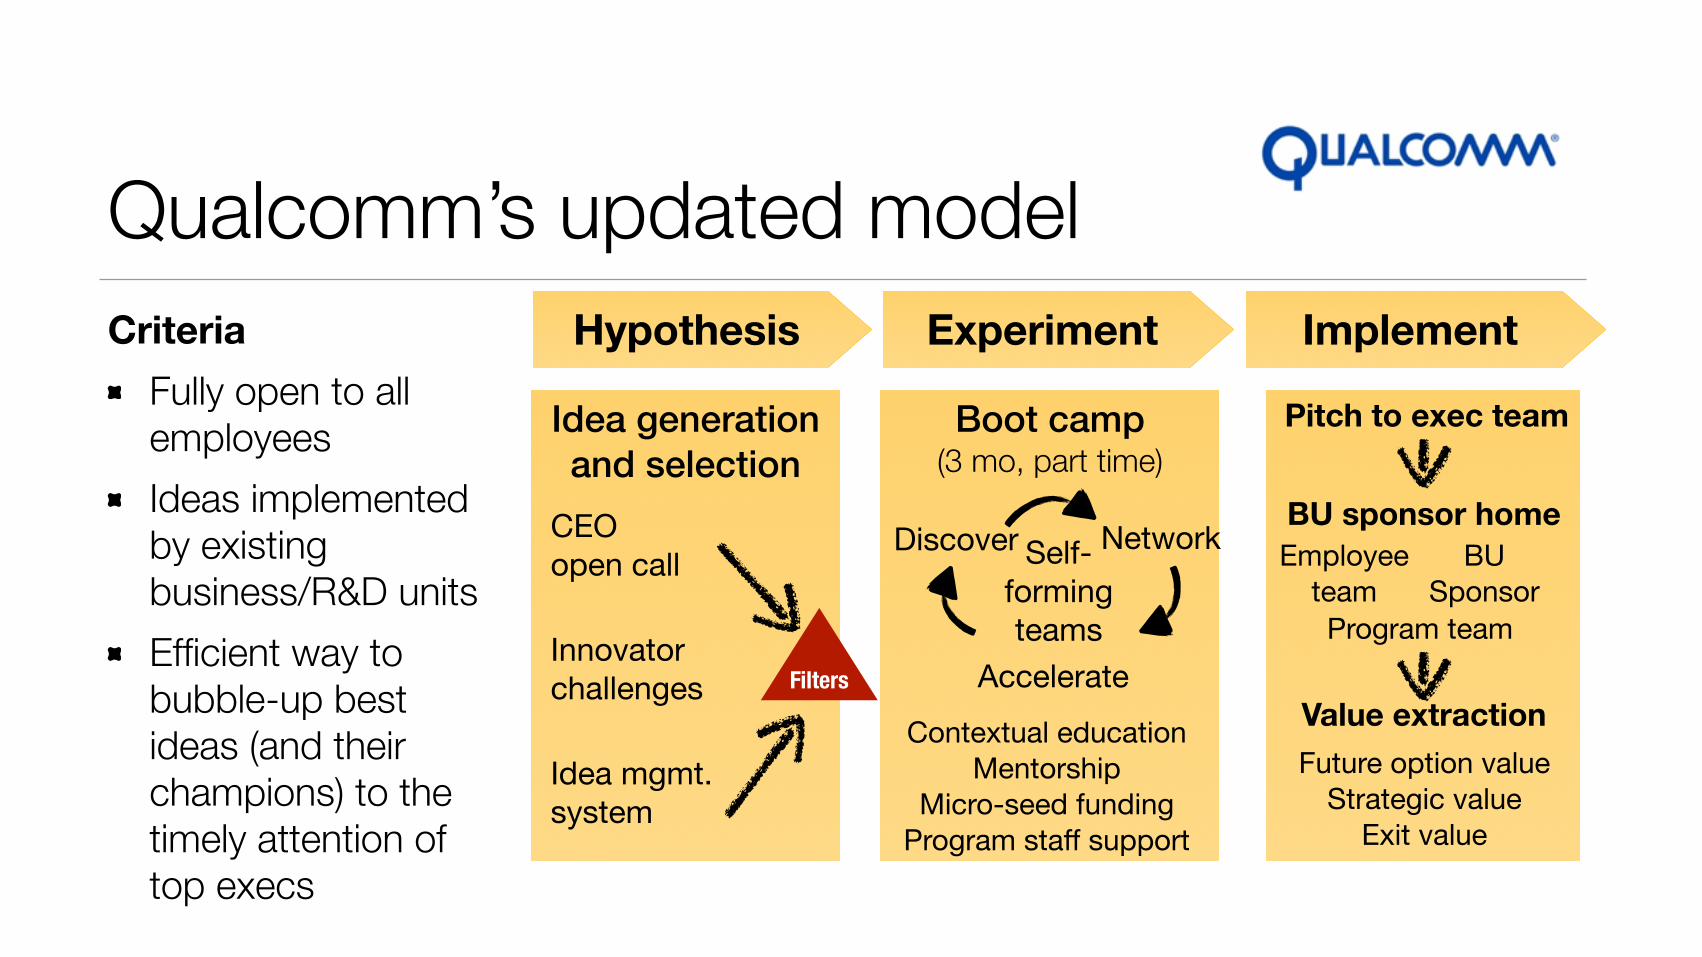
Qualcomm’s updated modelCriteria
Fully open to all employees Ideas implemented by existing business/R&D units Efficient way to bubble-up best ideas (and their champions) to the timely attention of top execs
Idea generation and selection
Boot camp (3 mo, part time)
CEOopen call
Innovatorchallenges
Idea mgmt.system
Discover Network
Accelerate
Pitch to exec team
Hypothesis Experiment Implement
Self-formingteams
Filters
Contextual educationMentorship
Micro-seed fundingProgram staff support
Employeeteam
BU sponsor homeBU
SponsorProgram team
Future option valueStrategic value
Exit value
Value extraction
POC
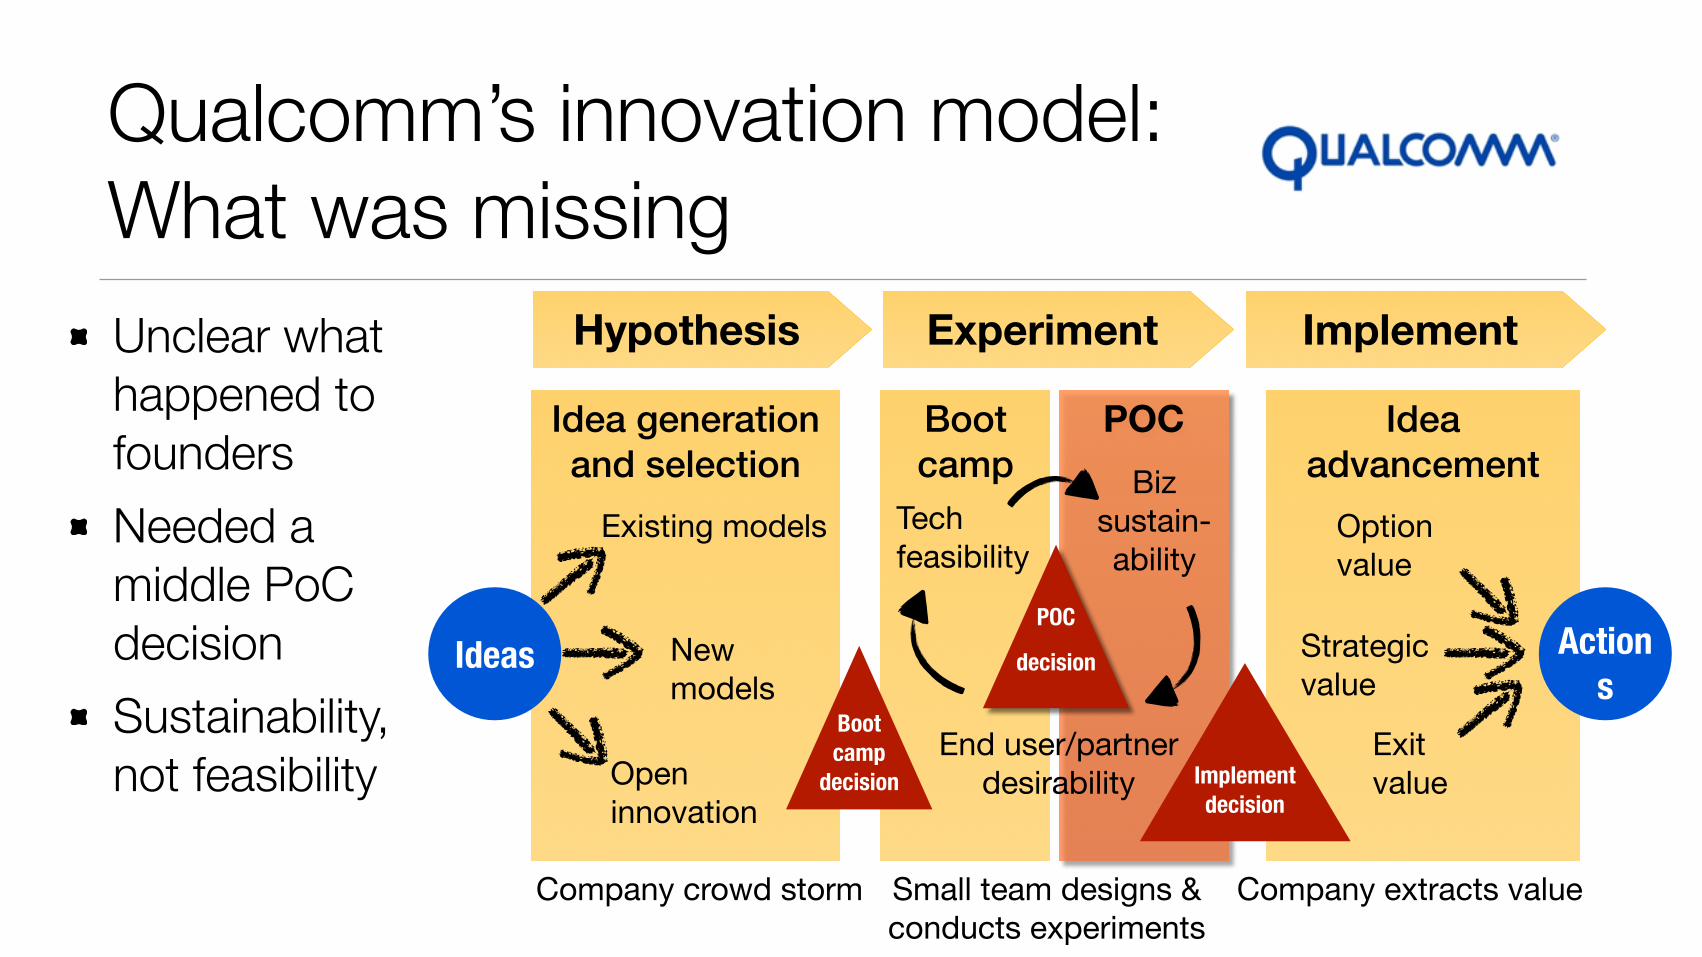
Qualcomm’s innovation model: What was missing
Idea generation and selection
Bootcamp
Idea advancement
Ideas
Existing models
Newmodels
Openinnovation
Techfeasibility
Bizsustain-ability
End user/partnerdesirability
Actions
Optionvalue
Strategicvalue
Exitvalue
Hypothesis Experiment Implement
Company crowd storm Small team designs &conducts experiments
Company extracts value
Boot camp
decision Implement decision
POC
decision
Unclear what happened to founders Needed a middle PoC decision Sustainability, not feasibility

Step seven: Rinse, repeat.
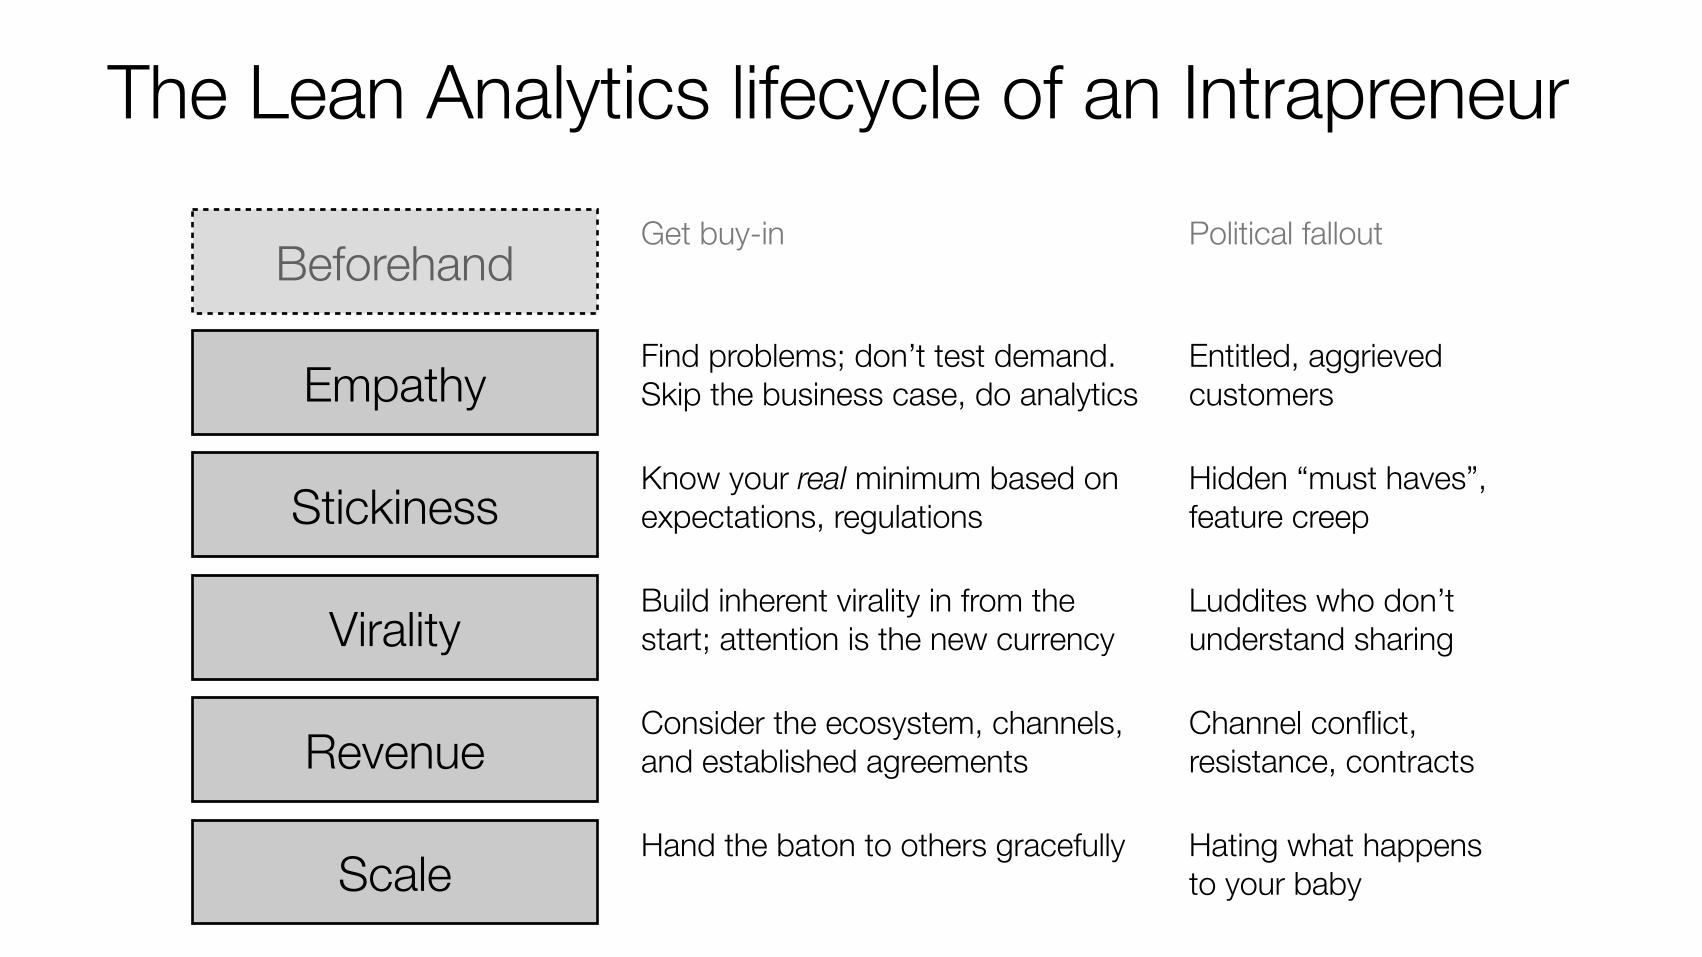
The Lean Analytics lifecycle of an Intrapreneur
Empathy Find problems; don’t test demand. Skip the business case, do analytics
Entitled, aggrieved customers
Stickiness Know your real minimum based on expectations, regulations
Hidden “must haves”, feature creep
Virality Build inherent virality in from the start; attention is the new currency
Luddites who don’t understand sharing
Revenue Consider the ecosystem, channels, and established agreements
Channel conflict, resistance, contracts
Scale Hand the baton to others gracefully Hating what happens to your baby
BeforehandGet buy-in Political fallout

Metrics for innovation portfolios.
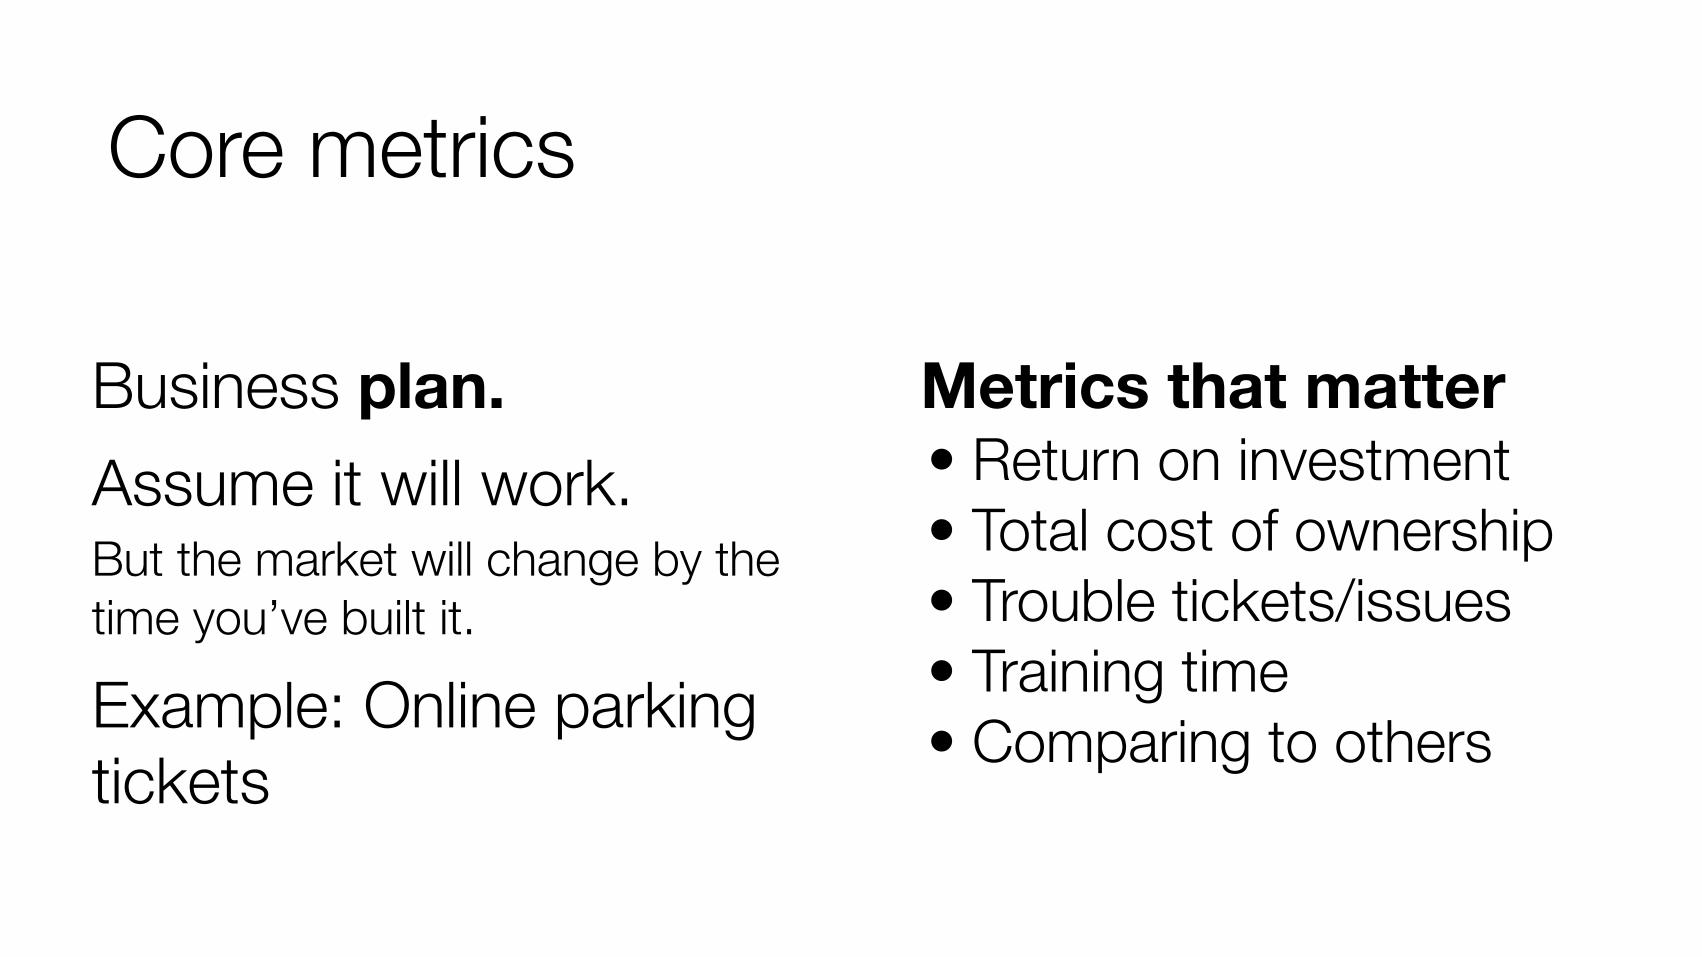
Core metrics
Metrics that matter • Return on investment • Total cost of ownership • Trouble tickets/issues • Training time • Comparing to others
Business plan. Assume it will work. But the market will change by the time you’ve built it.
Example: Online parking tickets
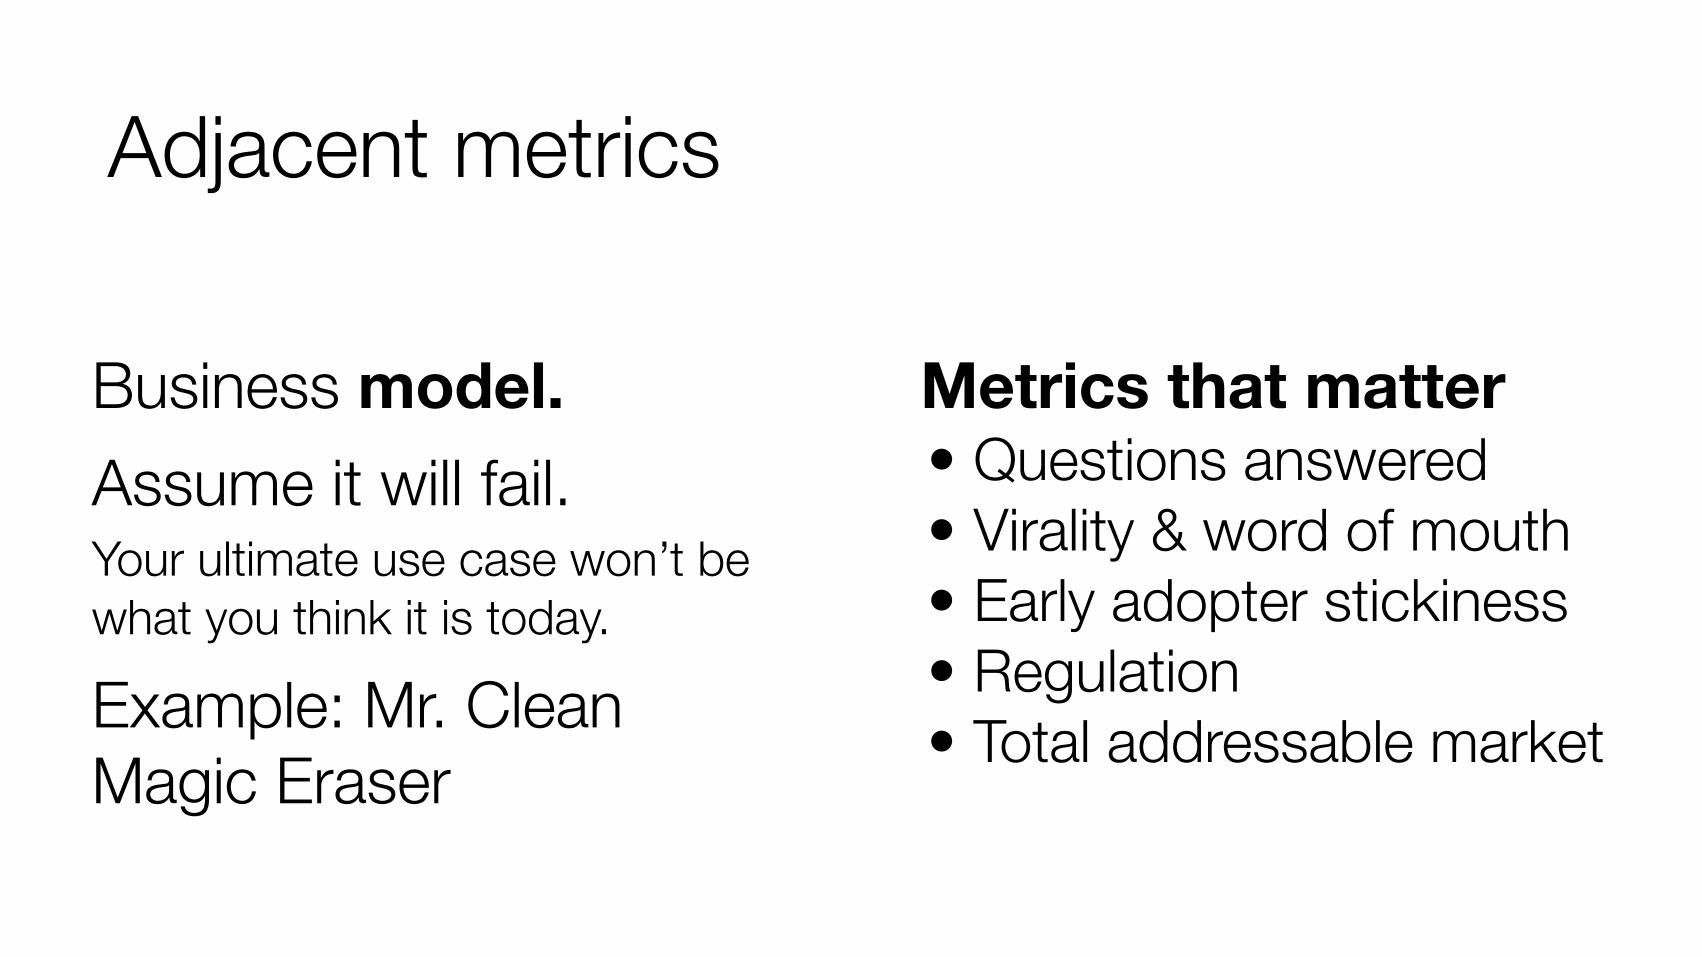
Adjacent metrics
Metrics that matter • Questions answered • Virality & word of mouth • Early adopter stickiness • Regulation • Total addressable market
Business model. Assume it will fail. Your ultimate use case won’t be what you think it is today.
Example: Mr. Clean Magic Eraser
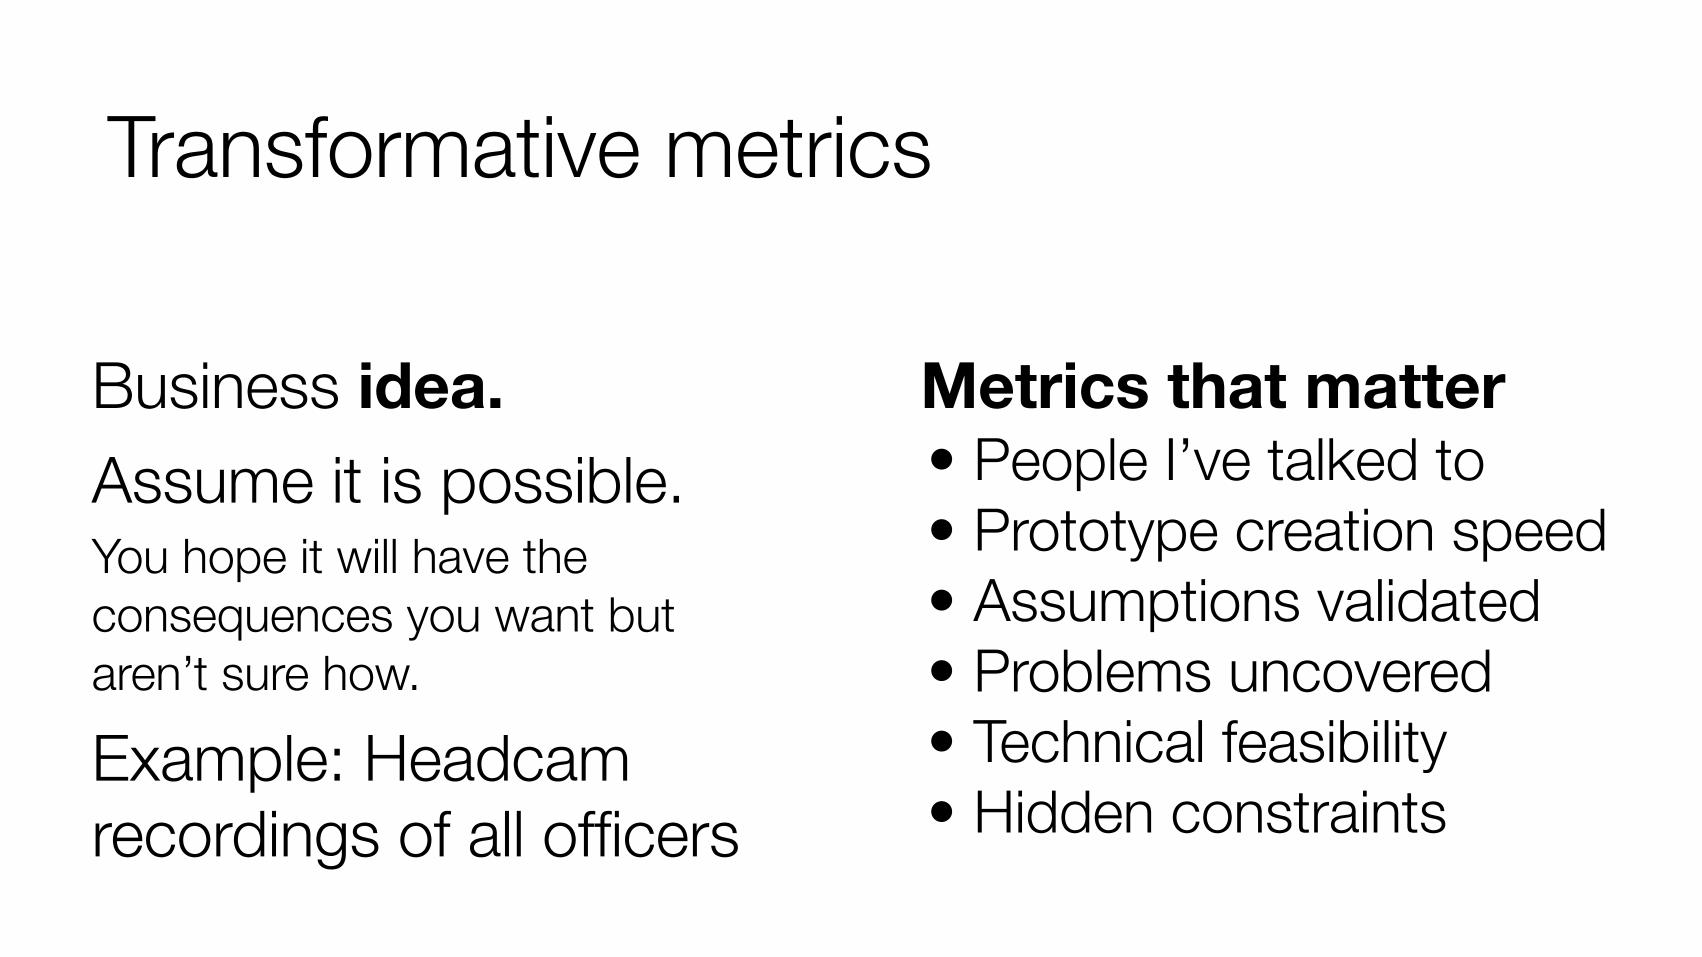
Transformative metrics
Metrics that matter • People I’ve talked to • Prototype creation speed • Assumptions validated • Problems uncovered • Technical feasibility • Hidden constraints
Business idea. Assume it is possible. You hope it will have the consequences you want but aren’t sure how.
Example: Headcam recordings of all officers
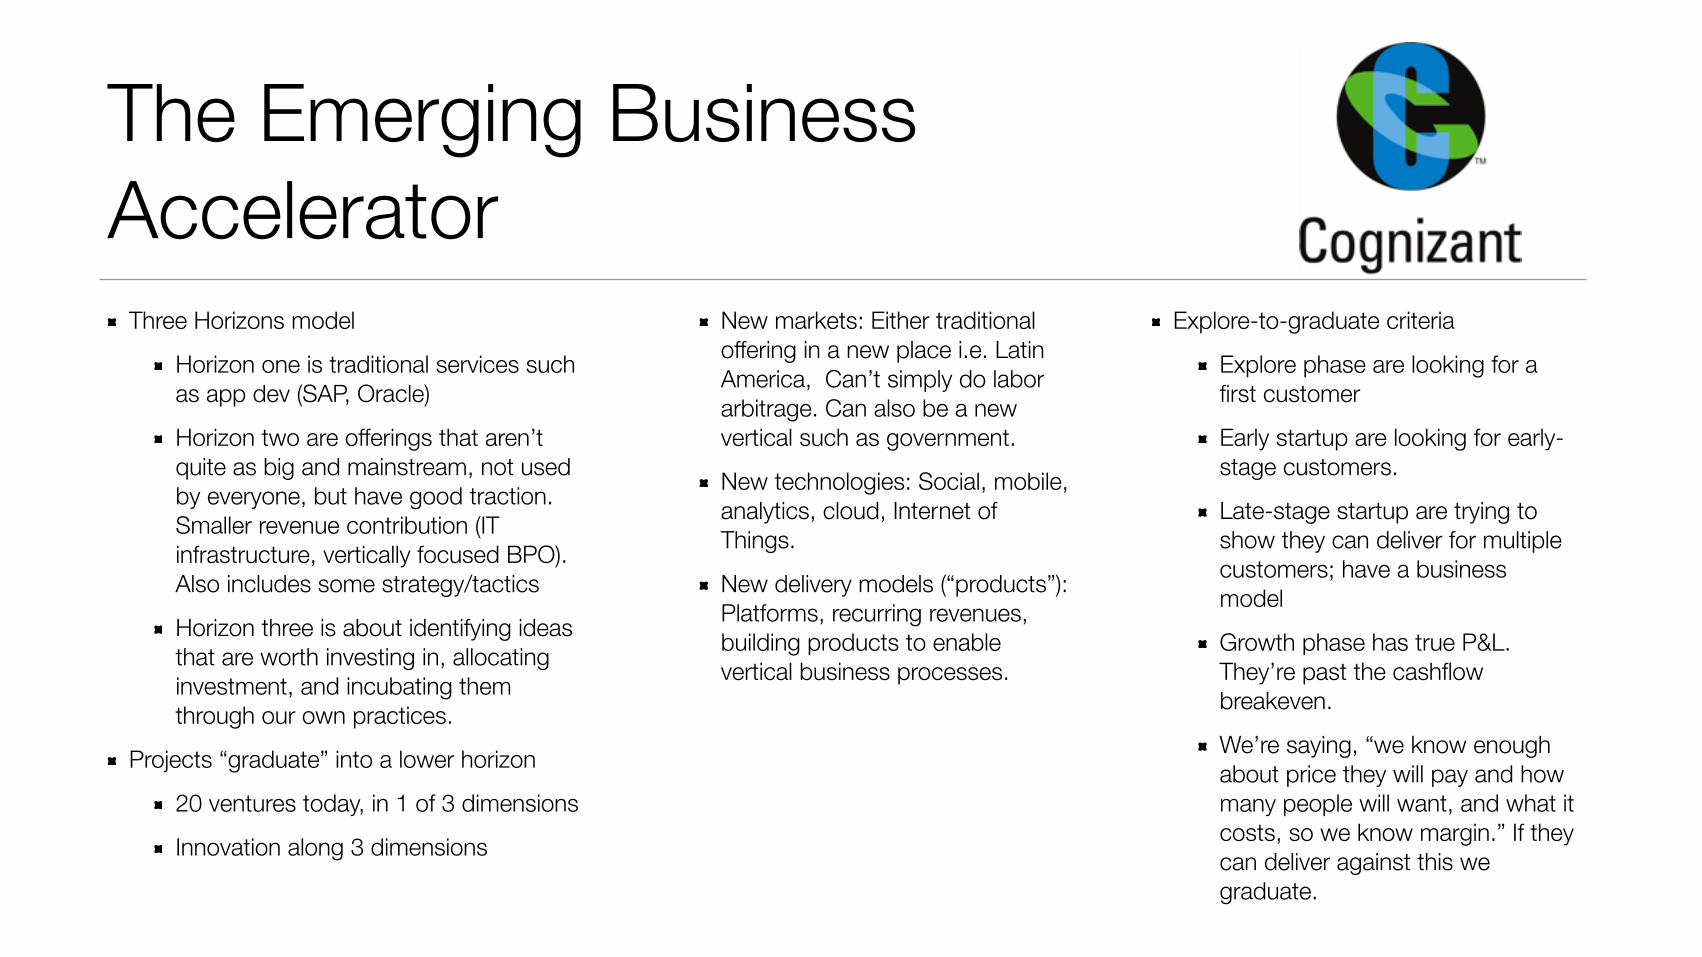
The Emerging Business Accelerator
Three Horizons model
Horizon one is traditional services such as app dev (SAP, Oracle)
Horizon two are offerings that aren’t quite as big and mainstream, not used by everyone, but have good traction. Smaller revenue contribution (IT infrastructure, vertically focused BPO). Also includes some strategy/tactics
Horizon three is about identifying ideas that are worth investing in, allocating investment, and incubating them through our own practices.
Projects “graduate” into a lower horizon
20 ventures today, in 1 of 3 dimensions
Innovation along 3 dimensions
New markets: Either traditional offering in a new place i.e. Latin America, Can’t simply do labor arbitrage. Can also be a new vertical such as government.
New technologies: Social, mobile, analytics, cloud, Internet of Things.
New delivery models (“products”): Platforms, recurring revenues, building products to enable vertical business processes.
Explore-to-graduate criteria
Explore phase are looking for a first customer
Early startup are looking for early-stage customers.
Late-stage startup are trying to show they can deliver for multiple customers; have a business model
Growth phase has true P&L. They’re past the cashflow breakeven.
We’re saying, “we know enough about price they will pay and how many people will want, and what it costs, so we know margin.” If they can deliver against this we graduate.
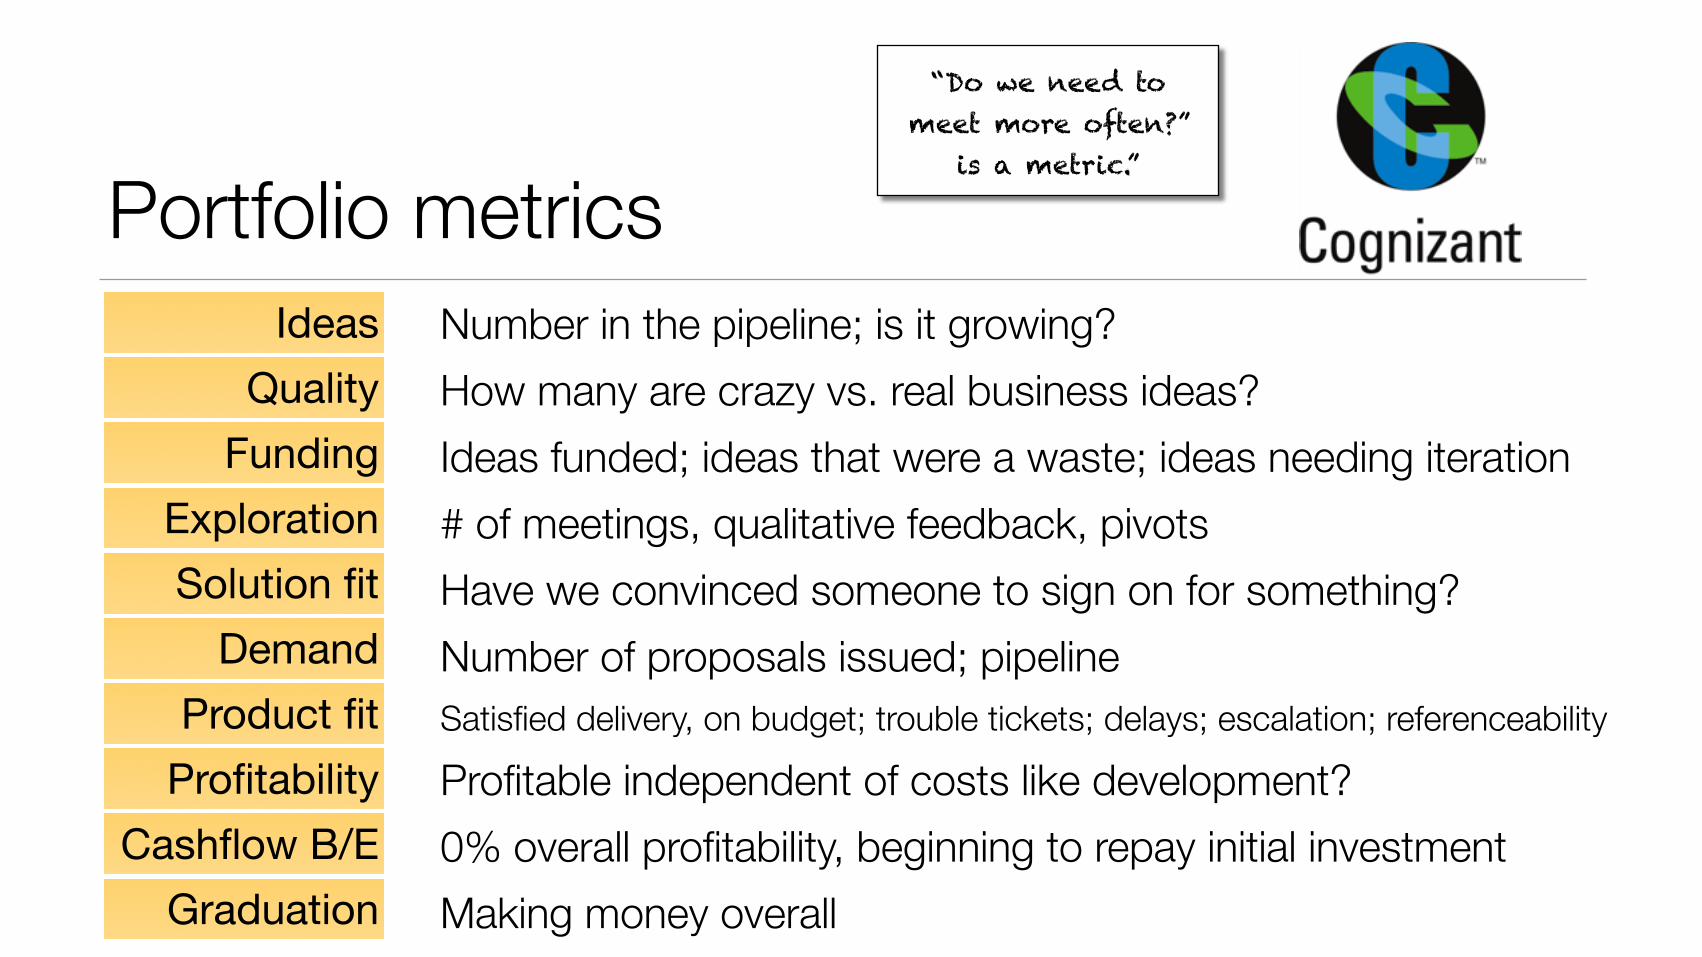
Portfolio metricsNumber in the pipeline; is it growing?How many are crazy vs. real business ideas?Ideas funded; ideas that were a waste; ideas needing iteration# of meetings, qualitative feedback, pivotsHave we convinced someone to sign on for something?Number of proposals issued; pipelineSatisfied delivery, on budget; trouble tickets; delays; escalation; referenceability
Profitable independent of costs like development?
IdeasQuality
FundingExplorationSolution fit
DemandProduct fit
ProfitabilityCashflow B/E 0% overall profitability, beginning to repay initial investment
Graduation Making money overall
“Do we need to meet more often?”
is a metric.”
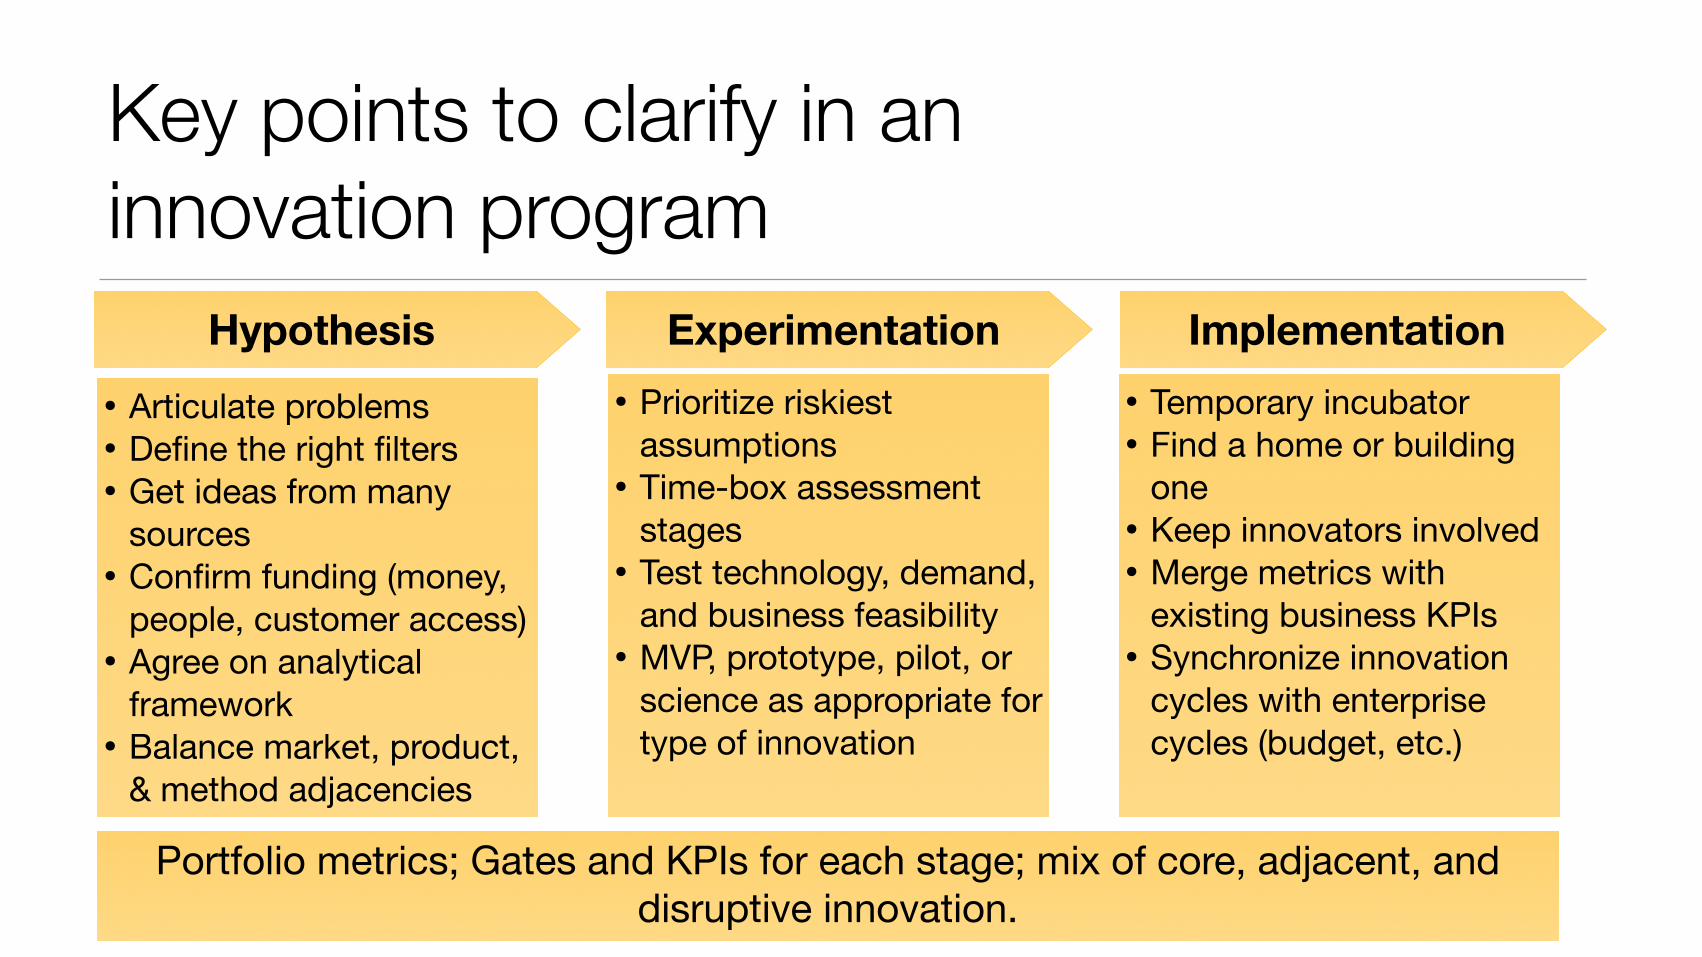
Key points to clarify in an innovation program
Hypothesis Experimentation Implementation
• Articulate problems• Define the right filters• Get ideas from many
sources• Confirm funding (money,
people, customer access)• Agree on analytical
framework• Balance market, product,
& method adjacencies
• Prioritize riskiest assumptions
• Time-box assessment stages
• Test technology, demand, and business feasibility
• MVP, prototype, pilot, or science as appropriate for type of innovation
• Temporary incubator• Find a home or building
one• Keep innovators involved• Merge metrics with
existing business KPIs• Synchronize innovation
cycles with enterprise cycles (budget, etc.)
Portfolio metrics; Gates and KPIs for each stage; mix of core, adjacent, and disruptive innovation.
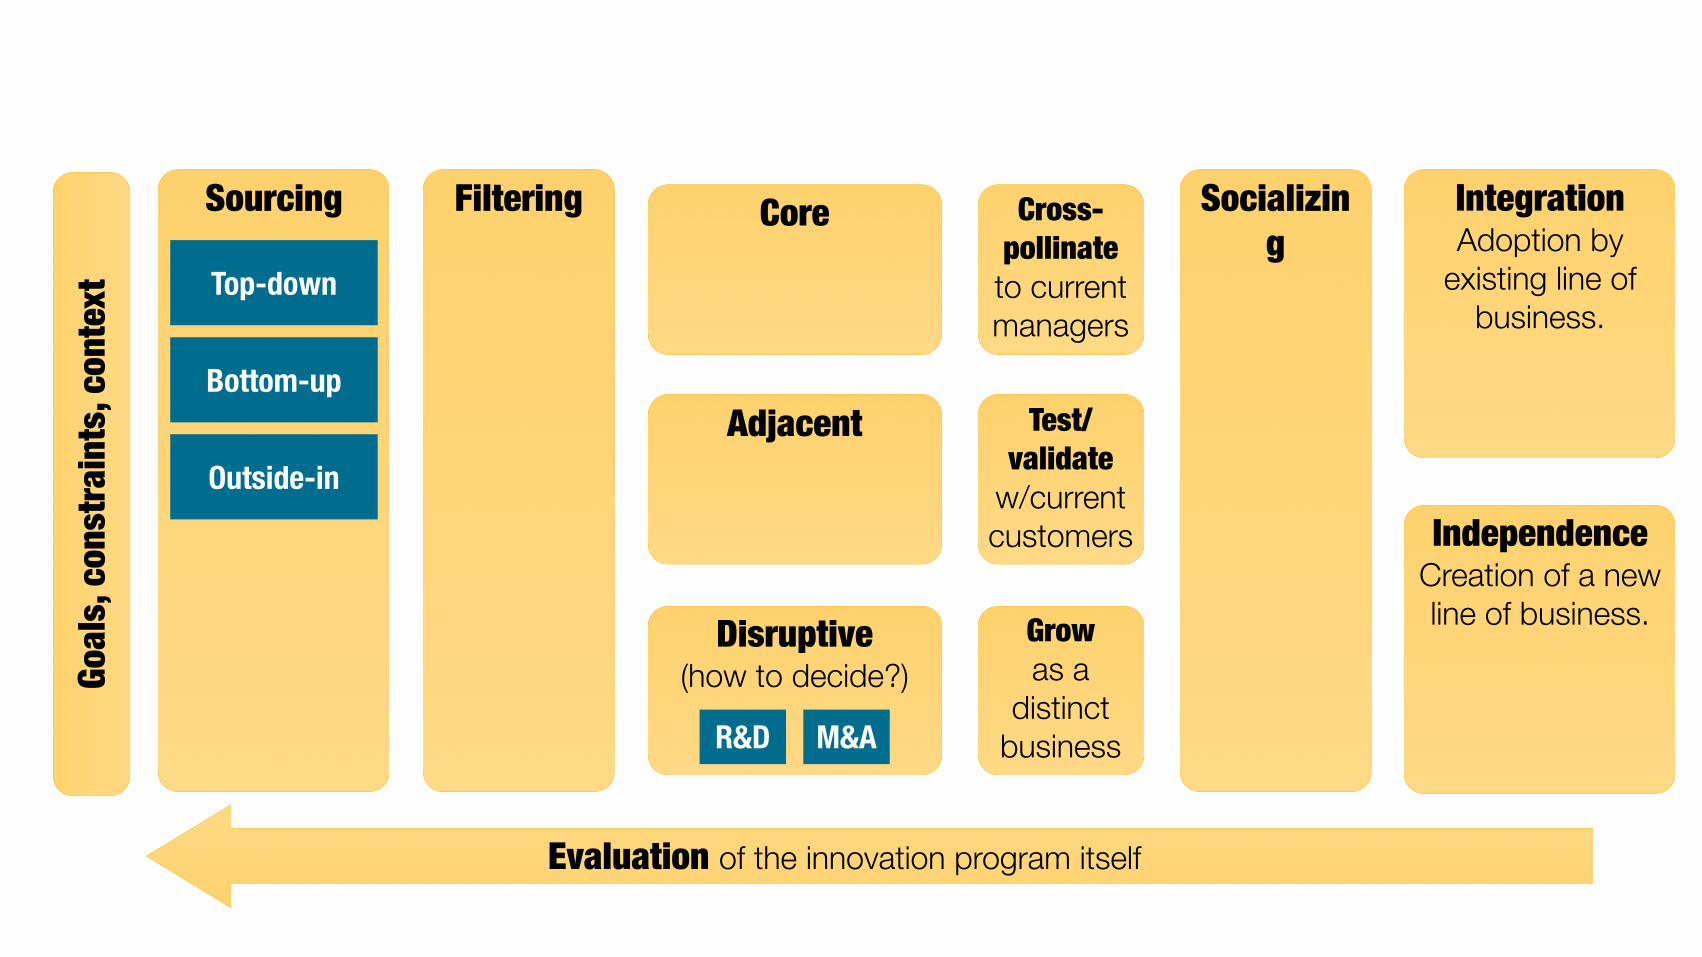
Goal
s, co
nstra
ints
, con
text
Sourcing Filtering
Adjacent
Disruptive (how to decide?)
Core Integration Adoption by
existing line of business.
Independence Creation of a new line of business.
Evaluation of the innovation program itself
Socializing
Test/validate
w/current customers
Grow as a
distinct business
Cross-pollinate to current managers
Top-down
Bottom-up
Outside-in
R&D M&A

Some tools and traps
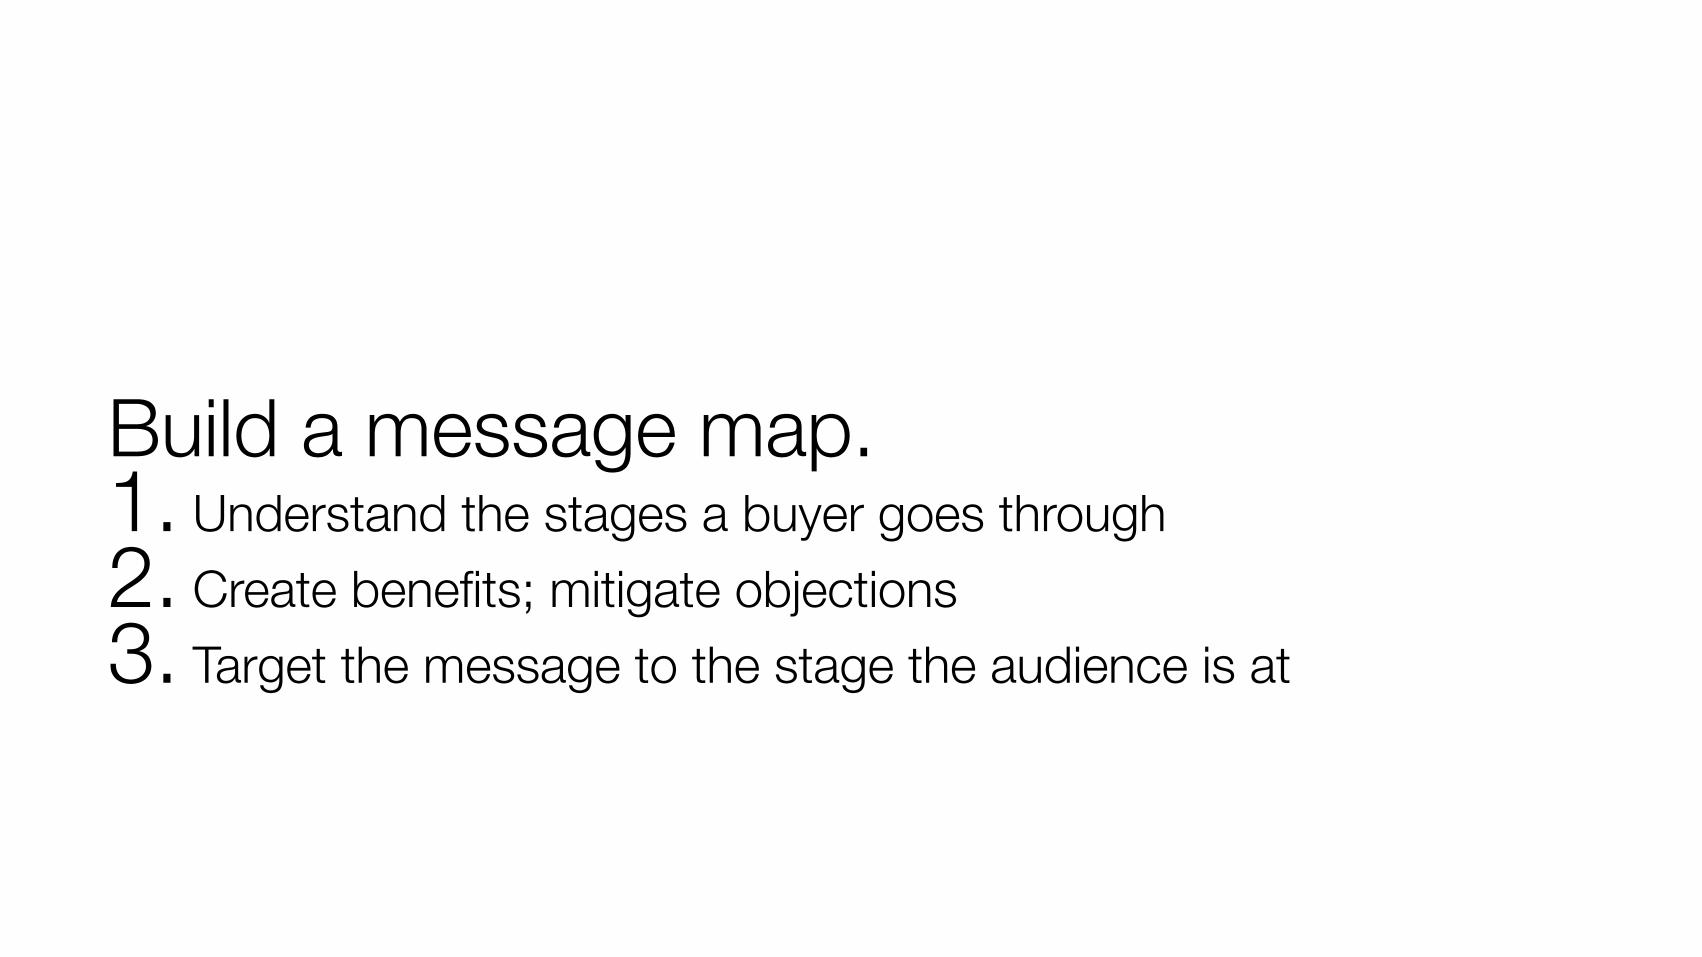
Build a message map.1. Understand the stages a buyer goes through 2. Create benefits; mitigate objections 3. Target the message to the stage the audience is at
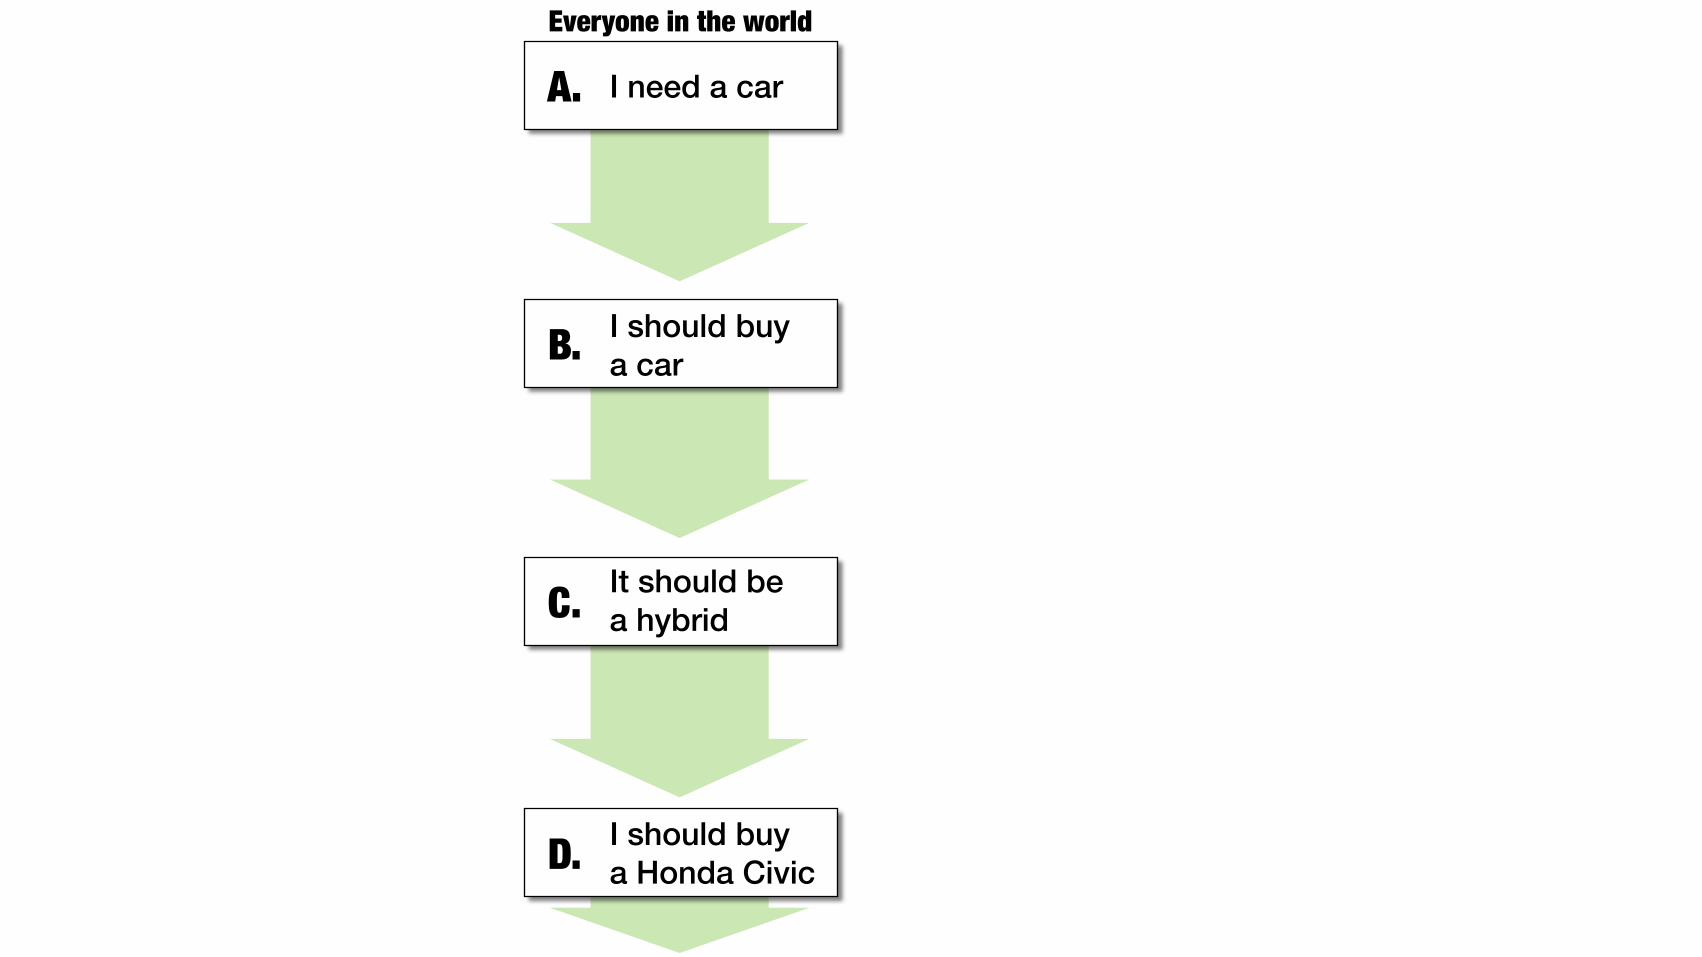
I need a carA.
I should buya carB.
It should bea hybridC.
I should buya Honda CivicD.
Everyone in the world
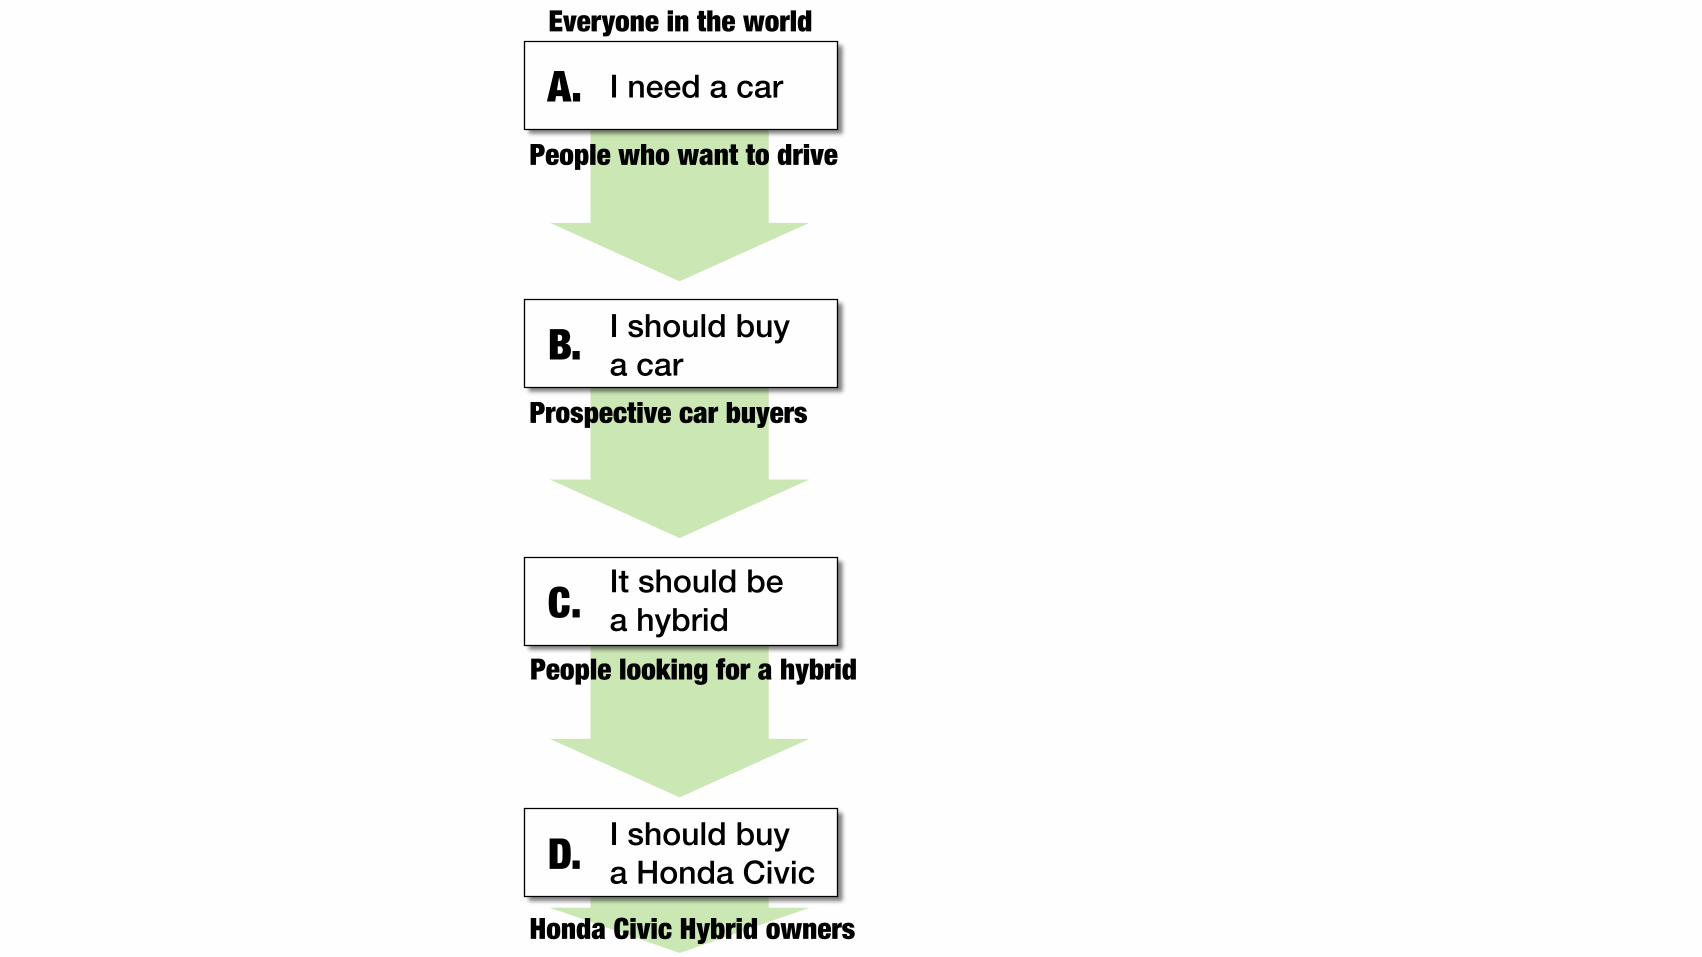
People who want to drive
Prospective car buyers
People looking for a hybrid
Honda Civic Hybrid owners
I need a carA.
I should buya carB.
It should bea hybridC.
I should buya Honda CivicD.
Everyone in the world
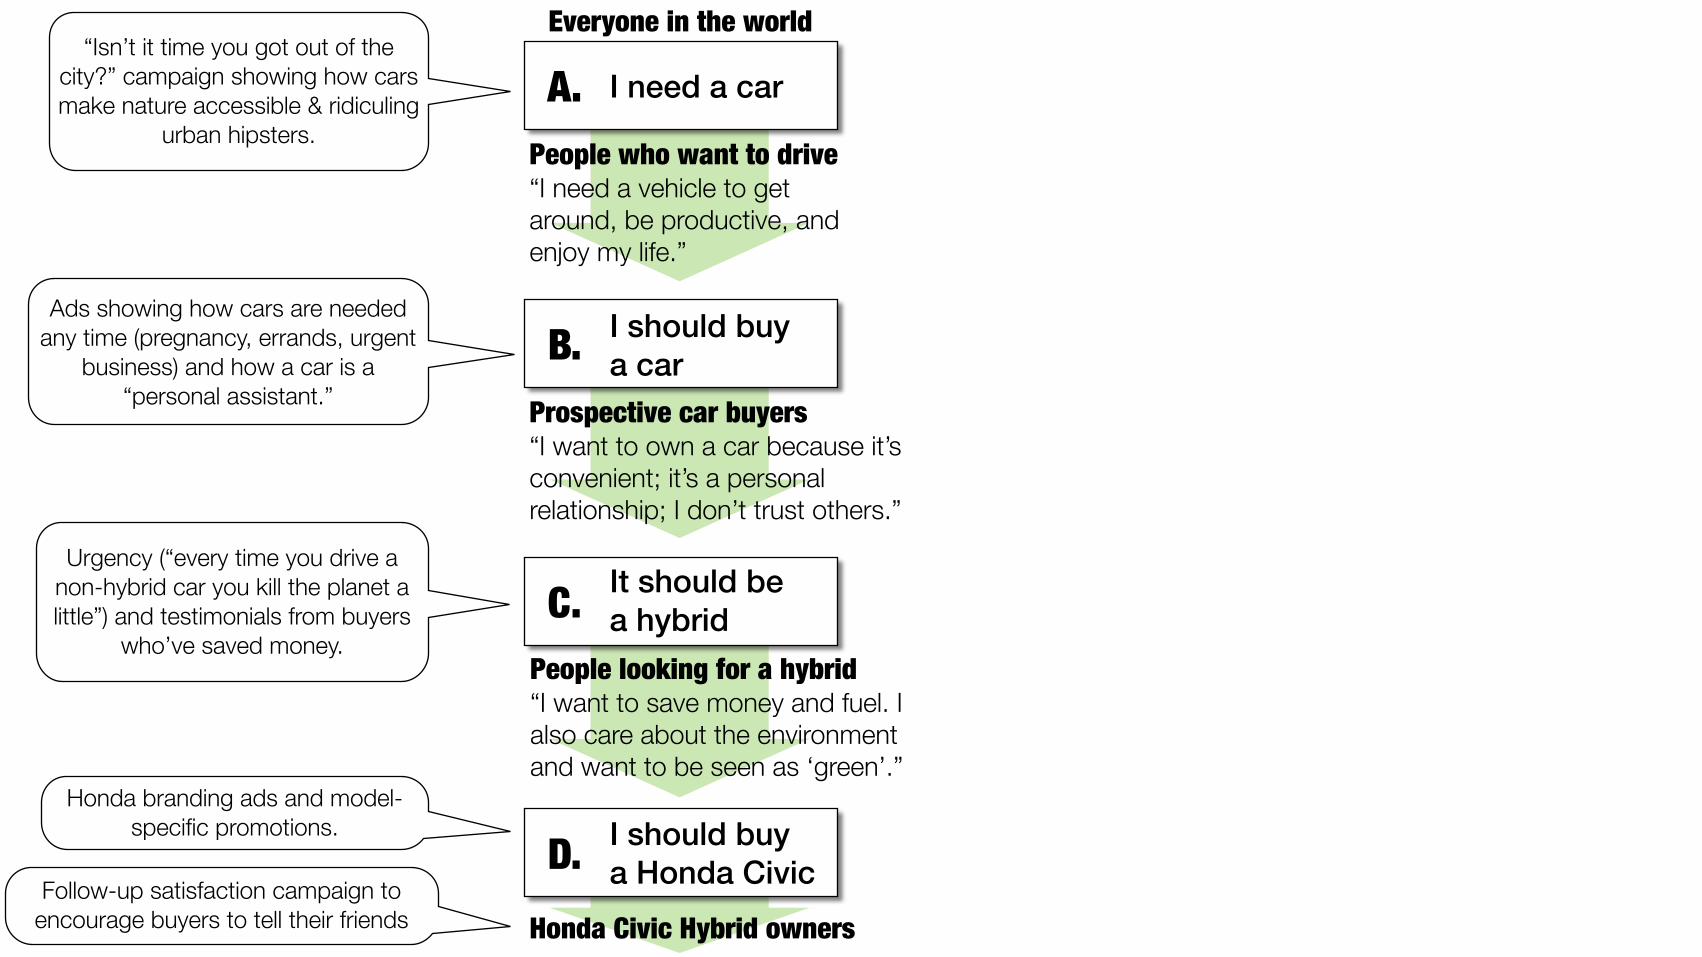
“Isn’t it time you got out of the city?” campaign showing how cars make nature accessible & ridiculing
urban hipsters.
Ads showing how cars are needed any time (pregnancy, errands, urgent
business) and how a car is a “personal assistant.”
Urgency (“every time you drive a non-hybrid car you kill the planet a little”) and testimonials from buyers
who’ve saved money.
Honda branding ads and model-specific promotions.
Follow-up satisfaction campaign to encourage buyers to tell their friends
People who want to drive “I need a vehicle to get around, be productive, and enjoy my life.”
Prospective car buyers “I want to own a car because it’s convenient; it’s a personal relationship; I don’t trust others.”
People looking for a hybrid “I want to save money and fuel. I also care about the environment and want to be seen as ‘green’.”
Honda Civic Hybrid owners
I need a carA.
I should buya carB.
It should bea hybridC.
I should buya Honda CivicD.
Everyone in the world
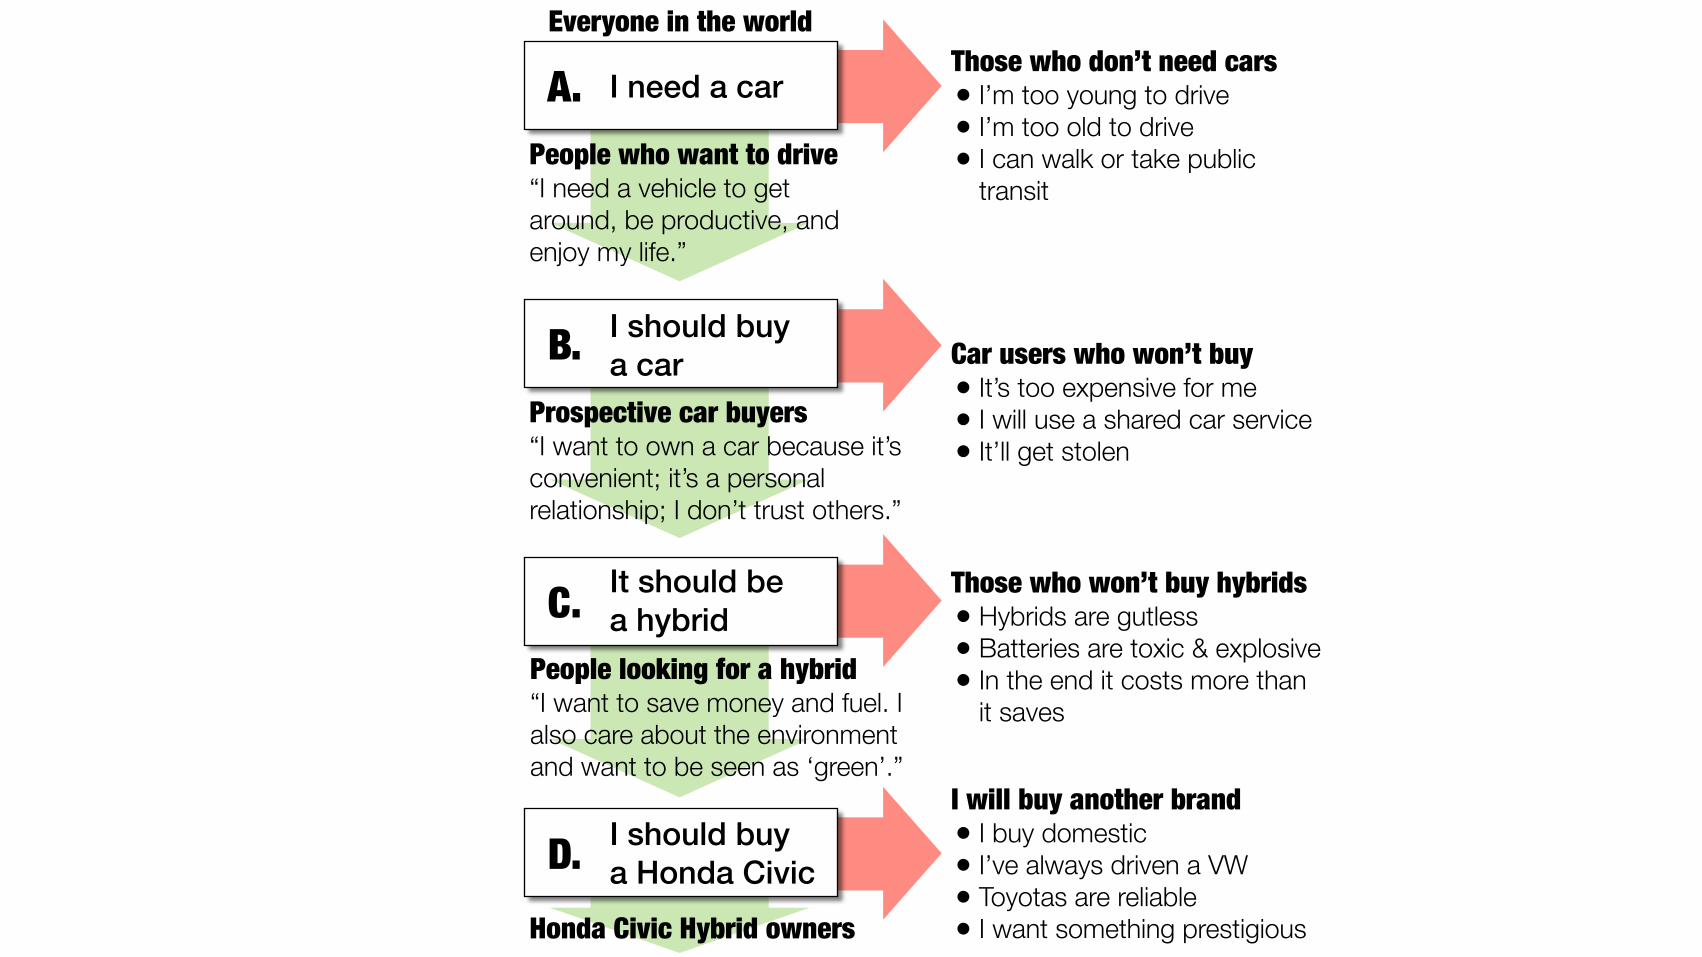
People who want to drive “I need a vehicle to get around, be productive, and enjoy my life.”
Prospective car buyers “I want to own a car because it’s convenient; it’s a personal relationship; I don’t trust others.”
People looking for a hybrid “I want to save money and fuel. I also care about the environment and want to be seen as ‘green’.”
Honda Civic Hybrid owners
Those who don’t need cars • I’m too young to drive • I’m too old to drive • I can walk or take public
transit
Car users who won’t buy • It’s too expensive for me • I will use a shared car service • It’ll get stolen
Those who won’t buy hybrids • Hybrids are gutless • Batteries are toxic & explosive • In the end it costs more than
it saves
I will buy another brand • I buy domestic • I’ve always driven a VW • Toyotas are reliable • I want something prestigious
I need a carA.
I should buya carB.
It should bea hybridC.
I should buya Honda CivicD.
Everyone in the world
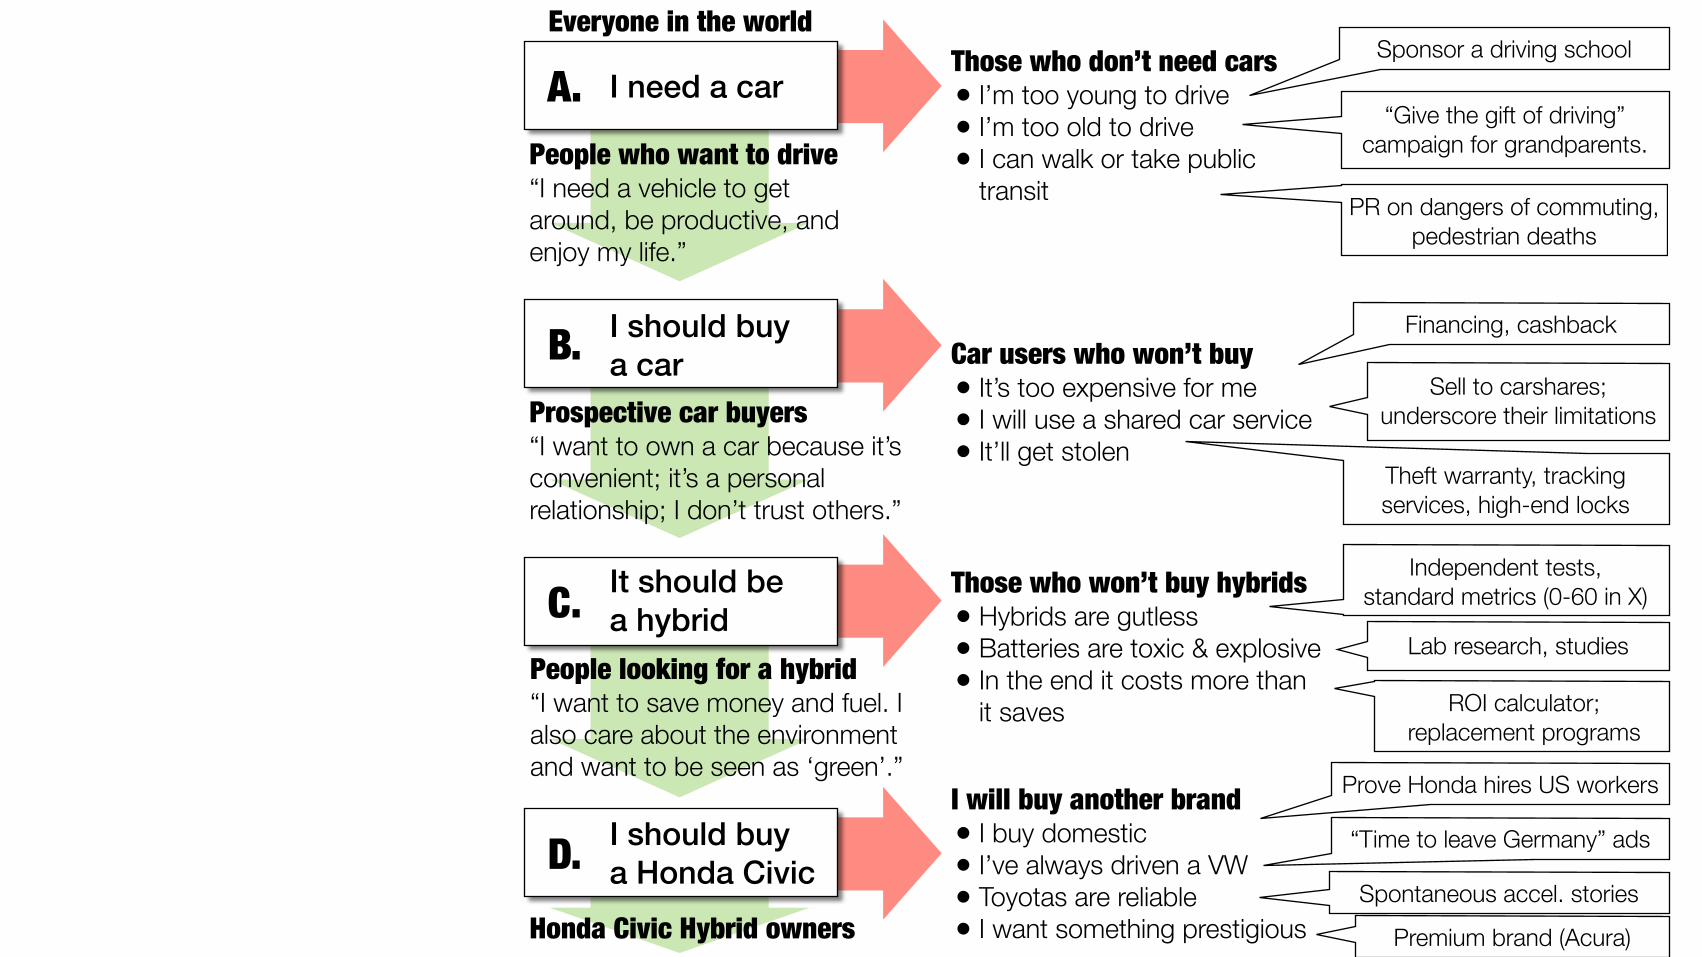
People who want to drive “I need a vehicle to get around, be productive, and enjoy my life.”
Prospective car buyers “I want to own a car because it’s convenient; it’s a personal relationship; I don’t trust others.”
People looking for a hybrid “I want to save money and fuel. I also care about the environment and want to be seen as ‘green’.”
Honda Civic Hybrid owners
Those who don’t need cars • I’m too young to drive • I’m too old to drive • I can walk or take public
transit
Car users who won’t buy • It’s too expensive for me • I will use a shared car service • It’ll get stolen
Those who won’t buy hybrids • Hybrids are gutless • Batteries are toxic & explosive • In the end it costs more than
it saves
I will buy another brand • I buy domestic • I’ve always driven a VW • Toyotas are reliable • I want something prestigious
Sponsor a driving school
“Give the gift of driving” campaign for grandparents.
Financing, cashback
Sell to carshares; underscore their limitations
PR on dangers of commuting, pedestrian deaths
Theft warranty, tracking services, high-end locks
Independent tests, standard metrics (0-60 in X)
Lab research, studies
ROI calculator; replacement programs
Prove Honda hires US workers
“Time to leave Germany” ads
Spontaneous accel. stories
Premium brand (Acura)
I need a carA.
I should buya carB.
It should bea hybridC.
I should buya Honda CivicD.
Everyone in the world
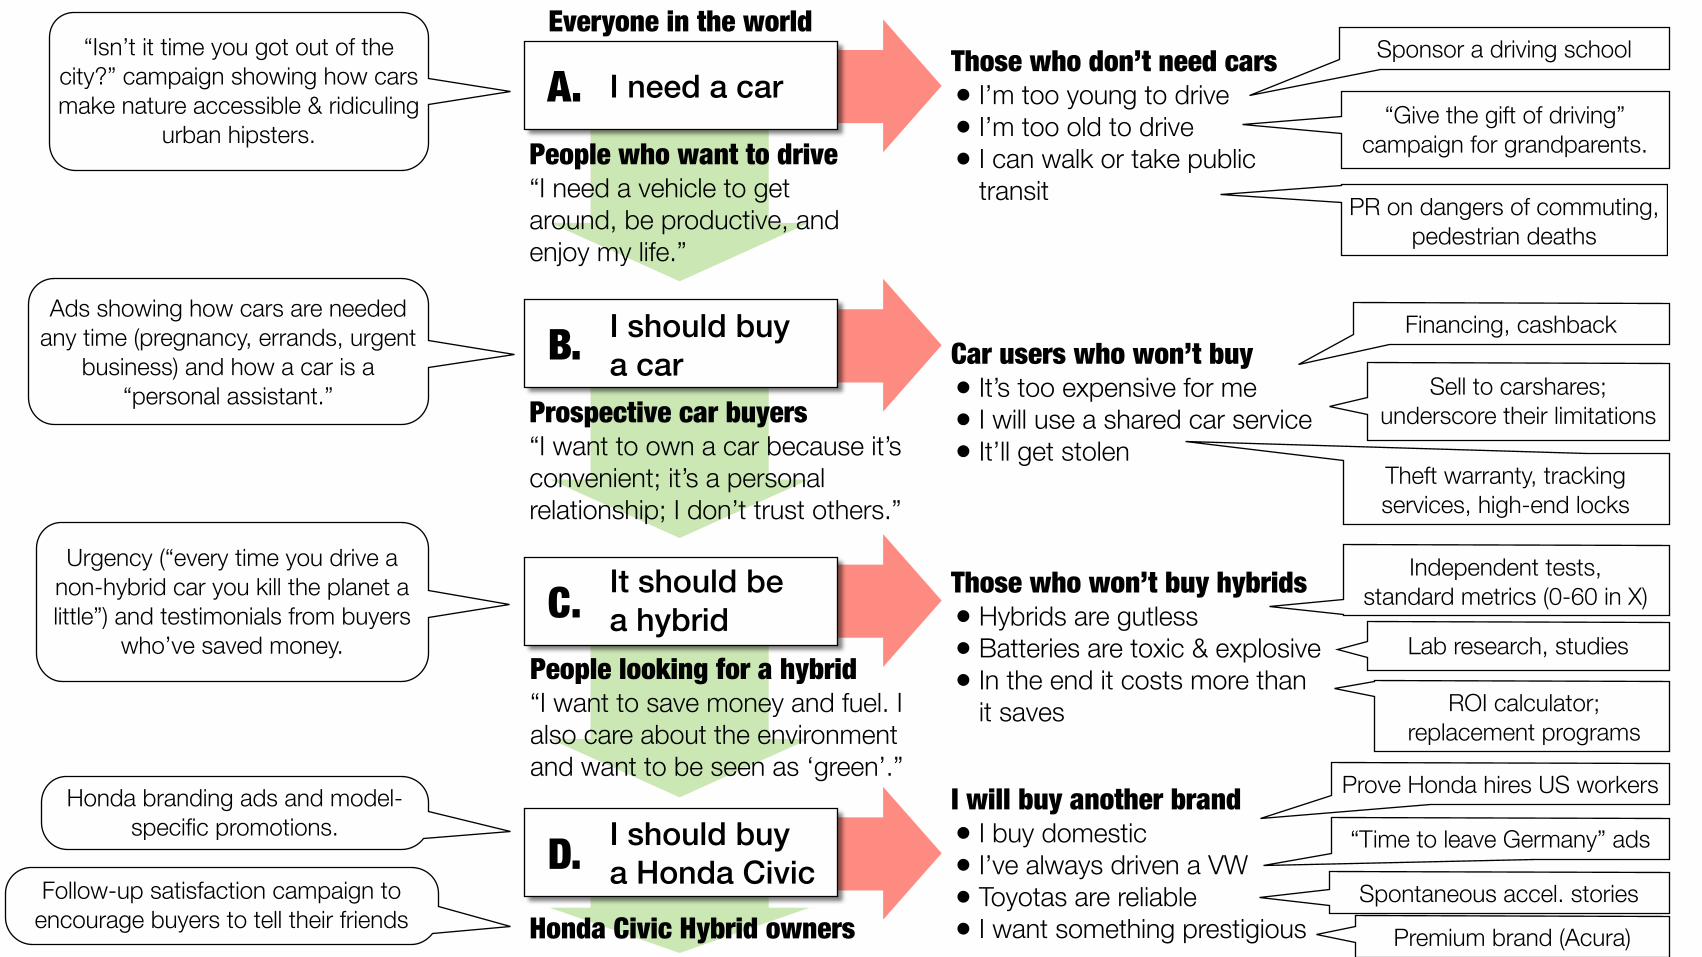
“Isn’t it time you got out of the city?” campaign showing how cars make nature accessible & ridiculing
urban hipsters.
Ads showing how cars are needed any time (pregnancy, errands, urgent
business) and how a car is a “personal assistant.”
Urgency (“every time you drive a non-hybrid car you kill the planet a little”) and testimonials from buyers
who’ve saved money.
Honda branding ads and model-specific promotions.
Follow-up satisfaction campaign to encourage buyers to tell their friends
People who want to drive “I need a vehicle to get around, be productive, and enjoy my life.”
Prospective car buyers “I want to own a car because it’s convenient; it’s a personal relationship; I don’t trust others.”
People looking for a hybrid “I want to save money and fuel. I also care about the environment and want to be seen as ‘green’.”
Honda Civic Hybrid owners
Those who don’t need cars • I’m too young to drive • I’m too old to drive • I can walk or take public
transit
Car users who won’t buy • It’s too expensive for me • I will use a shared car service • It’ll get stolen
Those who won’t buy hybrids • Hybrids are gutless • Batteries are toxic & explosive • In the end it costs more than
it saves
I will buy another brand • I buy domestic • I’ve always driven a VW • Toyotas are reliable • I want something prestigious
Sponsor a driving school
“Give the gift of driving” campaign for grandparents.
Financing, cashback
Sell to carshares; underscore their limitations
PR on dangers of commuting, pedestrian deaths
Theft warranty, tracking services, high-end locks
Independent tests, standard metrics (0-60 in X)
Lab research, studies
ROI calculator; replacement programs
Prove Honda hires US workers
“Time to leave Germany” ads
Spontaneous accel. stories
Premium brand (Acura)
I need a carA.
I should buya carB.
It should bea hybridC.
I should buya Honda CivicD.
Everyone in the world
The good news: The harsh light of data changes everything.
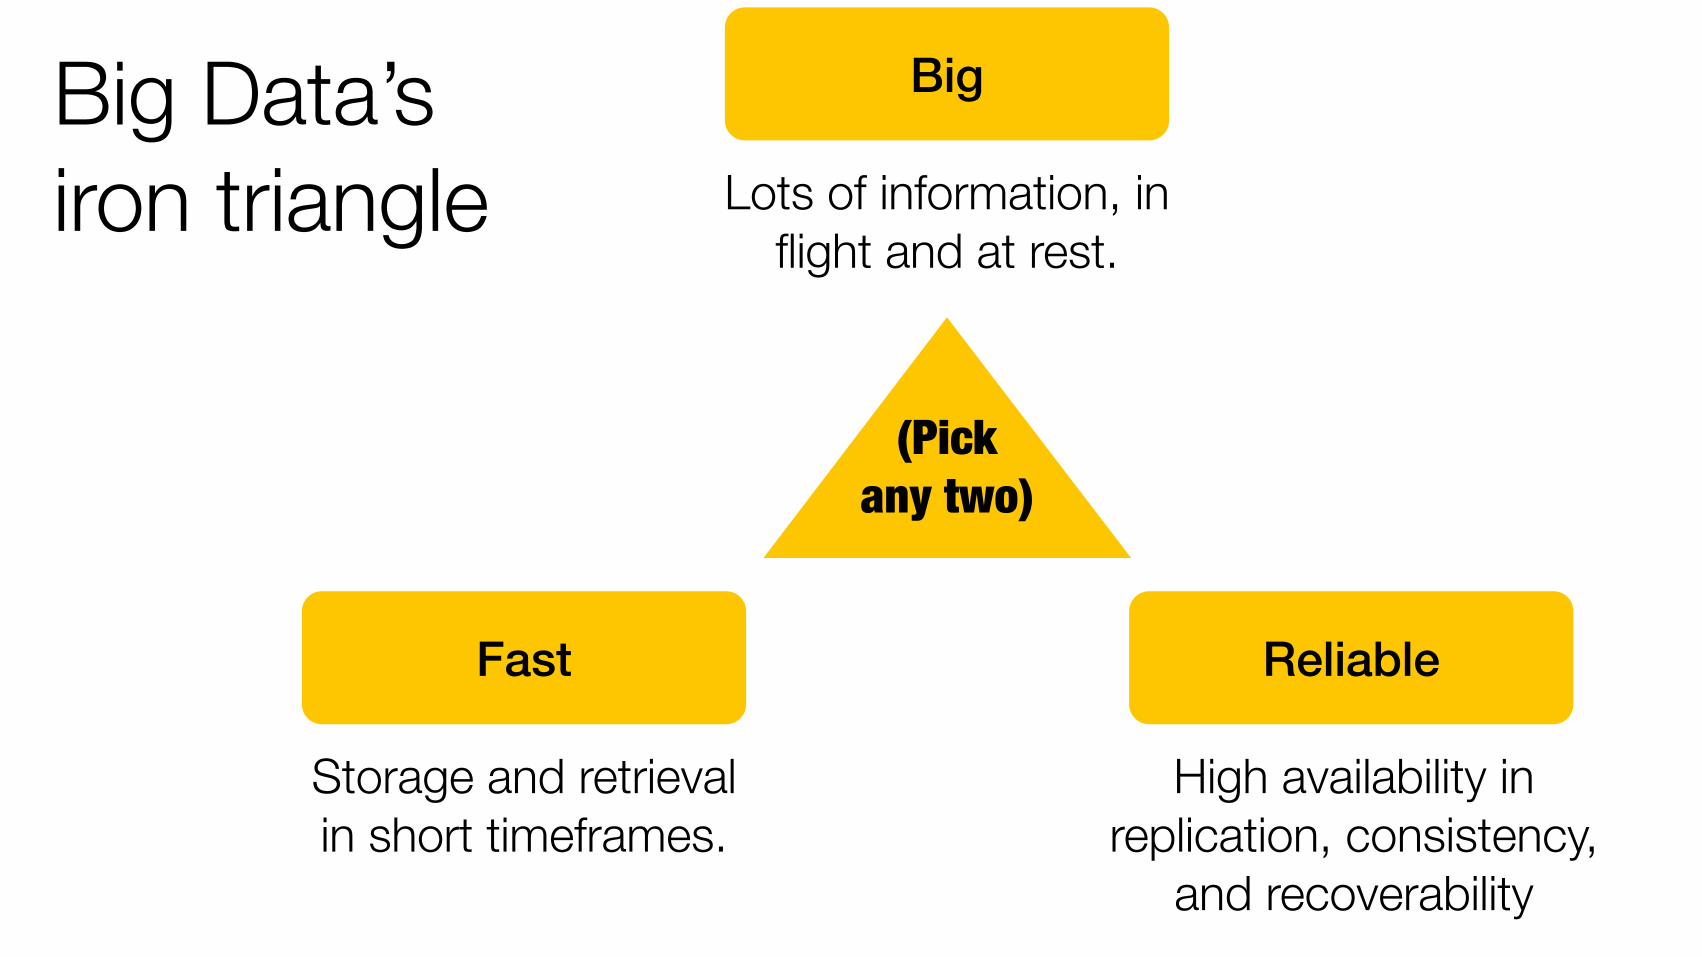
Big
Fast Reliable
Lots of information, in flight and at rest.
Storage and retrieval in short timeframes.
High availability in replication, consistency,
and recoverability
(Pick any two)
Big Data’s iron triangle

Some tools and traps
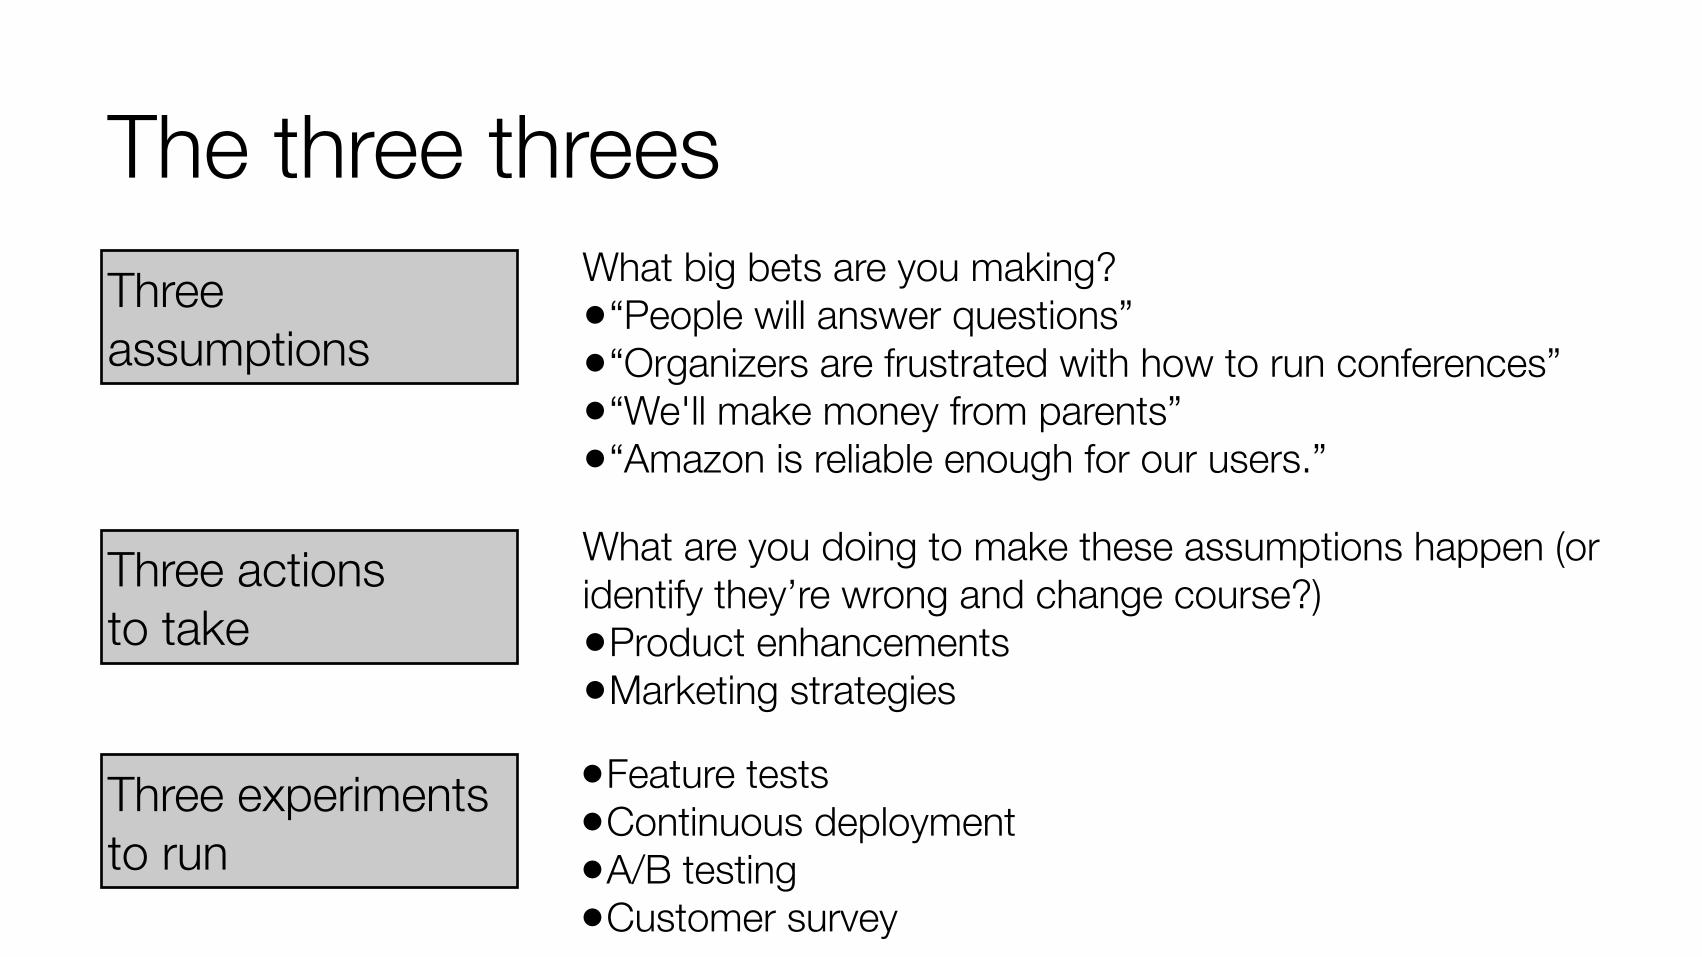
The three threesThreeassumptions
What big bets are you making? •“People will answer questions” •“Organizers are frustrated with how to run conferences” •“We'll make money from parents” •“Amazon is reliable enough for our users.”
Three actions to take
What are you doing to make these assumptions happen (or identify they’re wrong and change course?) •Product enhancements •Marketing strategies
Three experimentsto run
•Feature tests •Continuous deployment •A/B testing •Customer survey
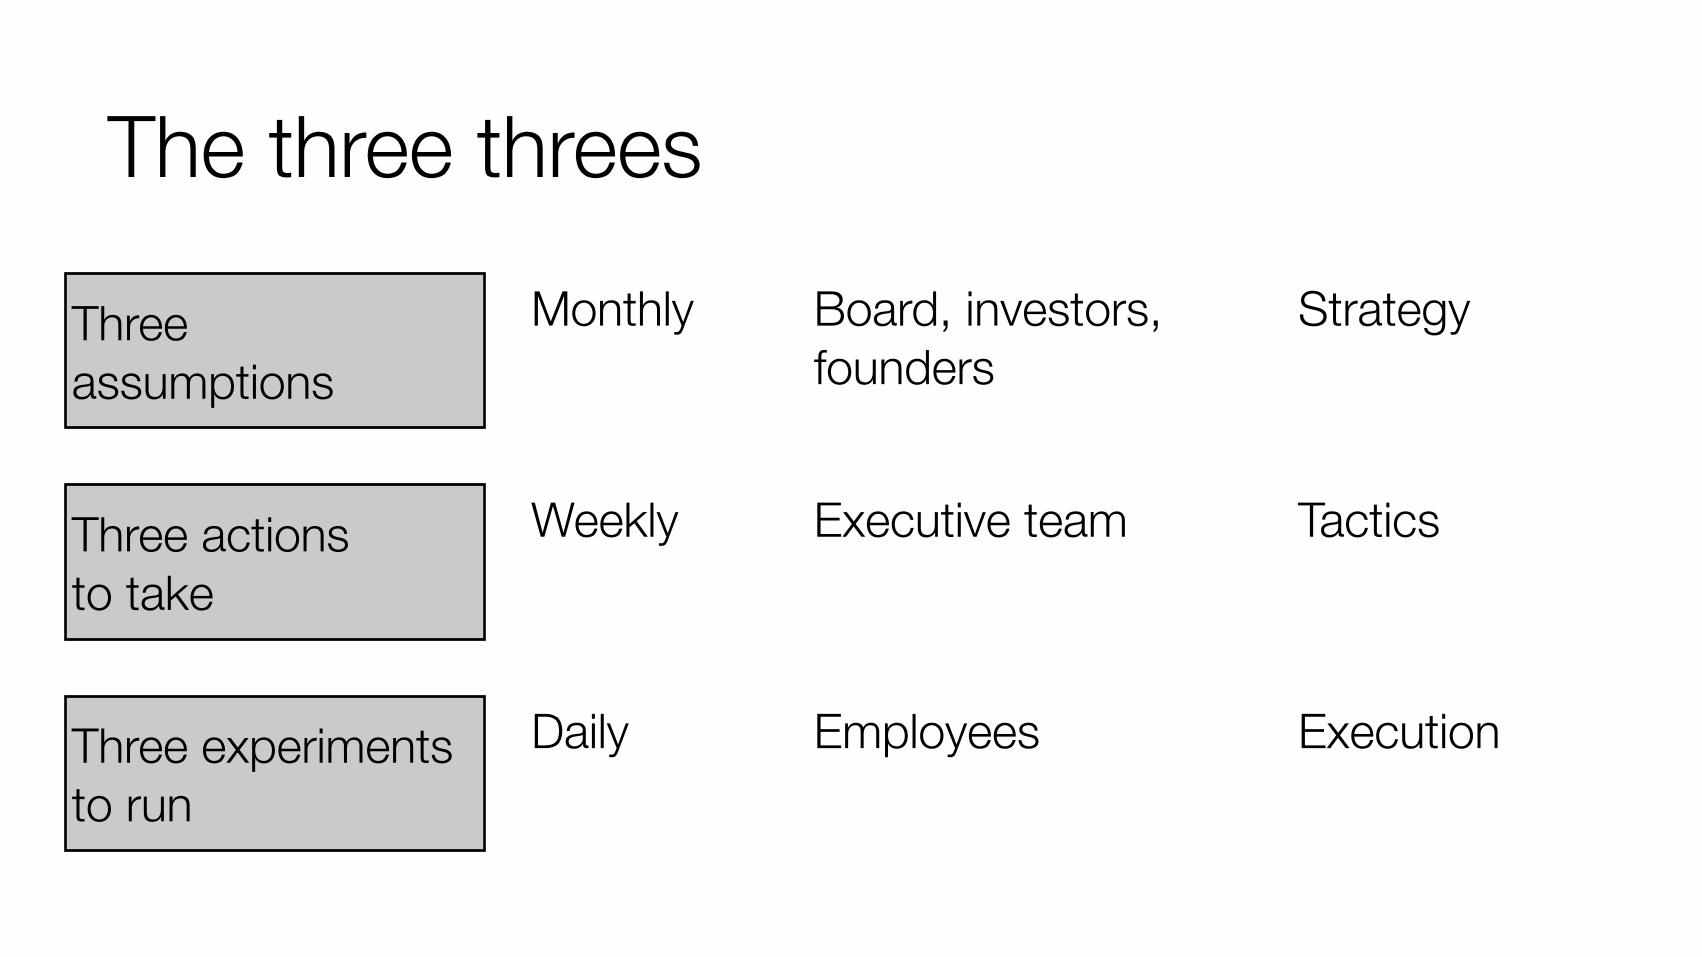
The three threes
Threeassumptions
Three actions to take
Three experimentsto run
Monthly
Weekly
Daily
Board, investors, founders
Executive team
Employees
Strategy
Tactics
Execution
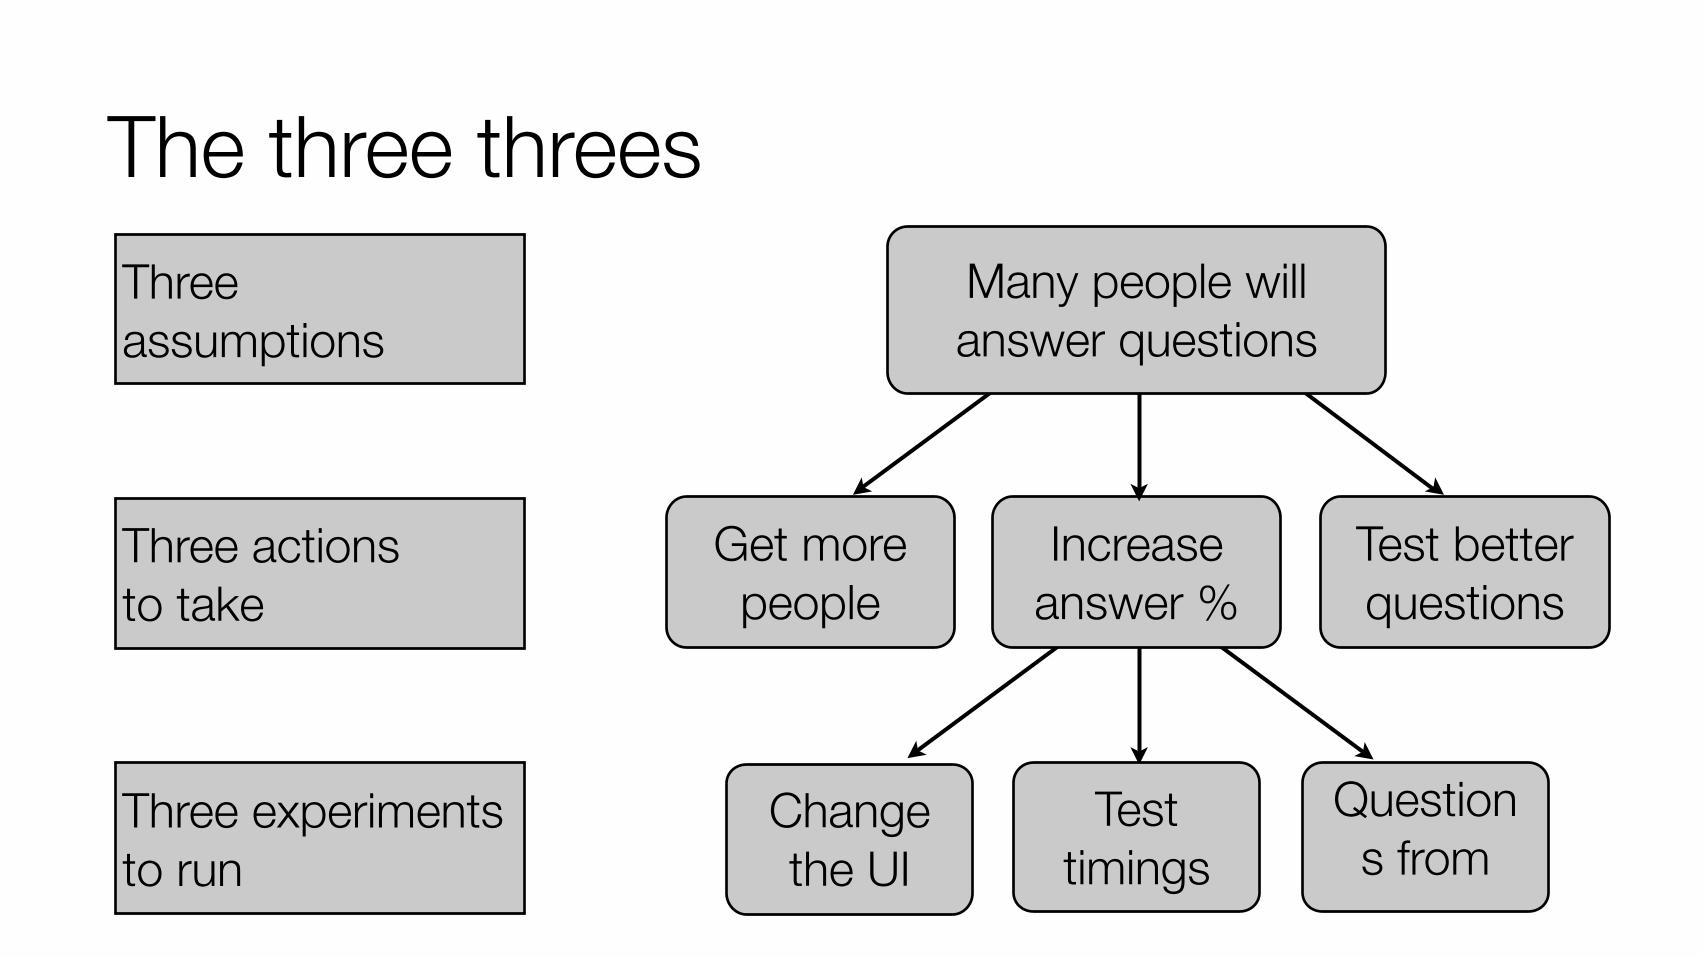
The three threesThreeassumptions
Three actions to take
Three experimentsto run
Get more people
Increase answer %
Test betterquestions
Change the UI
Test timings
Questions from
Many people will answer questions
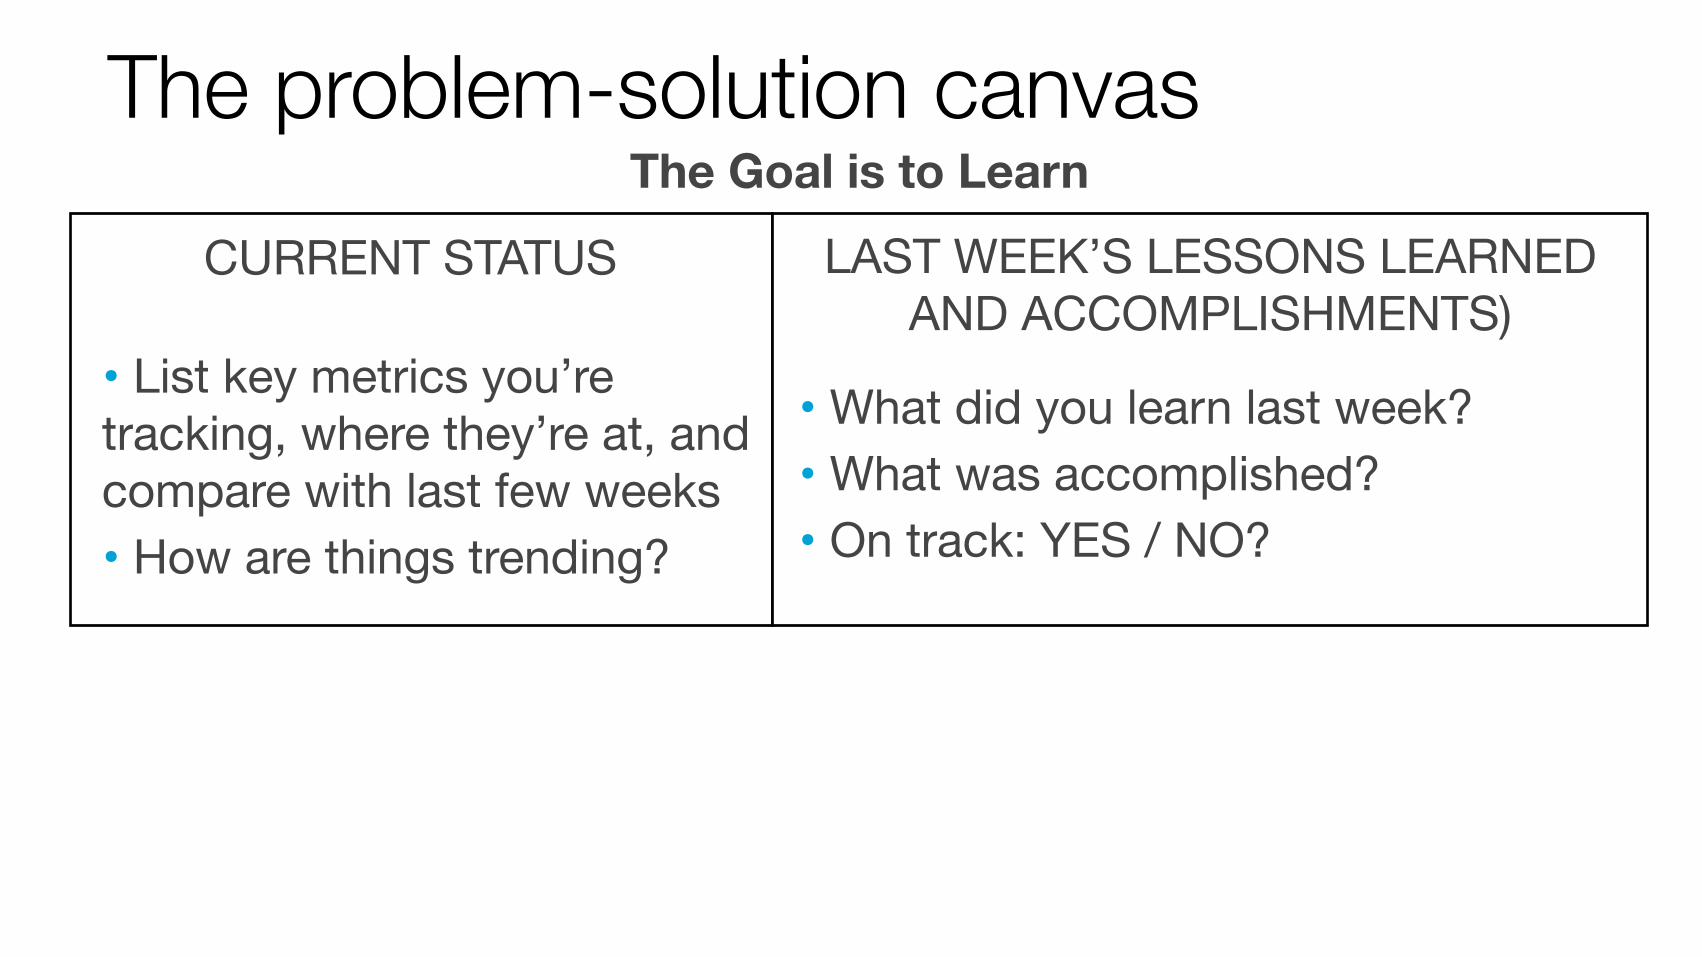
The problem-solution canvasCURRENT STATUS
• List key metrics you’re tracking, where they’re at, and compare with last few weeks• How are things trending?
LAST WEEK’S LESSONS LEARNED AND ACCOMPLISHMENTS)
• What did you learn last week?• What was accomplished?• On track: YES / NO?
The Goal is to Learn
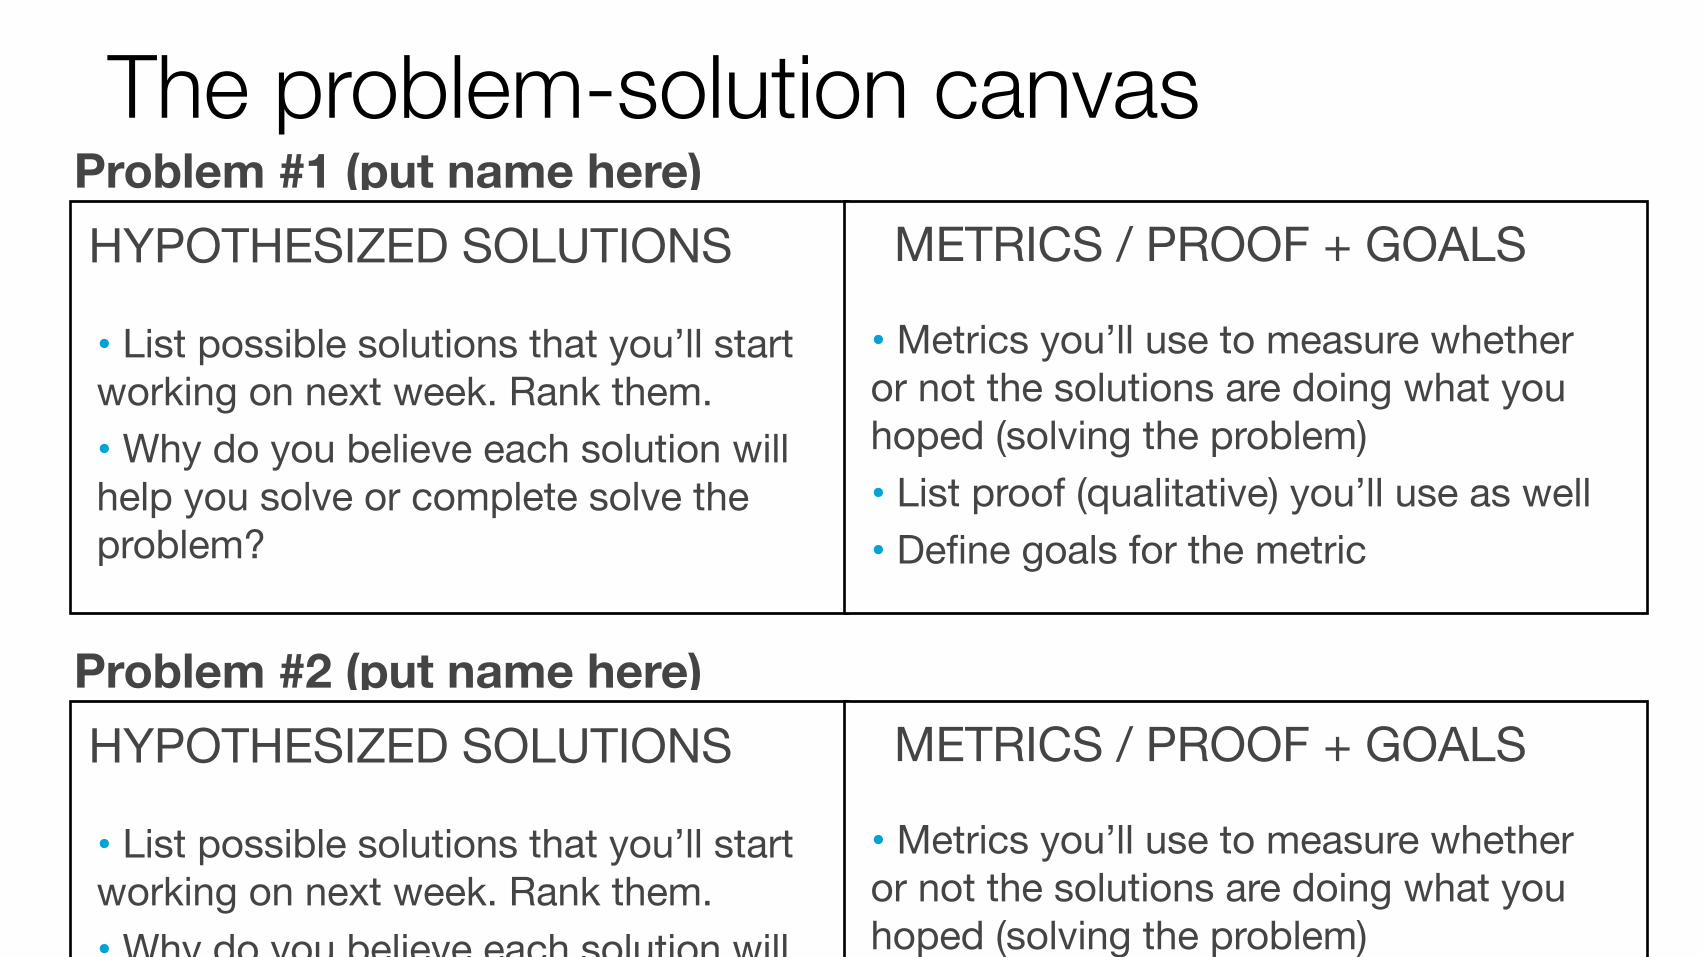
The problem-solution canvasHYPOTHESIZED SOLUTIONS
• List possible solutions that you’ll start working on next week. Rank them.• Why do you believe each solution will help you solve or complete solve the problem?
METRICS / PROOF + GOALSProblem #1 (put name here)
• Metrics you’ll use to measure whether or not the solutions are doing what you hoped (solving the problem)• List proof (qualitative) you’ll use as well• Define goals for the metric
HYPOTHESIZED SOLUTIONS
• List possible solutions that you’ll start working on next week. Rank them.• Why do you believe each solution will
METRICS / PROOF + GOALS
• Metrics you’ll use to measure whether or not the solutions are doing what you hoped (solving the problem)• List proof (qualitative) you’ll use as well
Problem #2 (put name here)
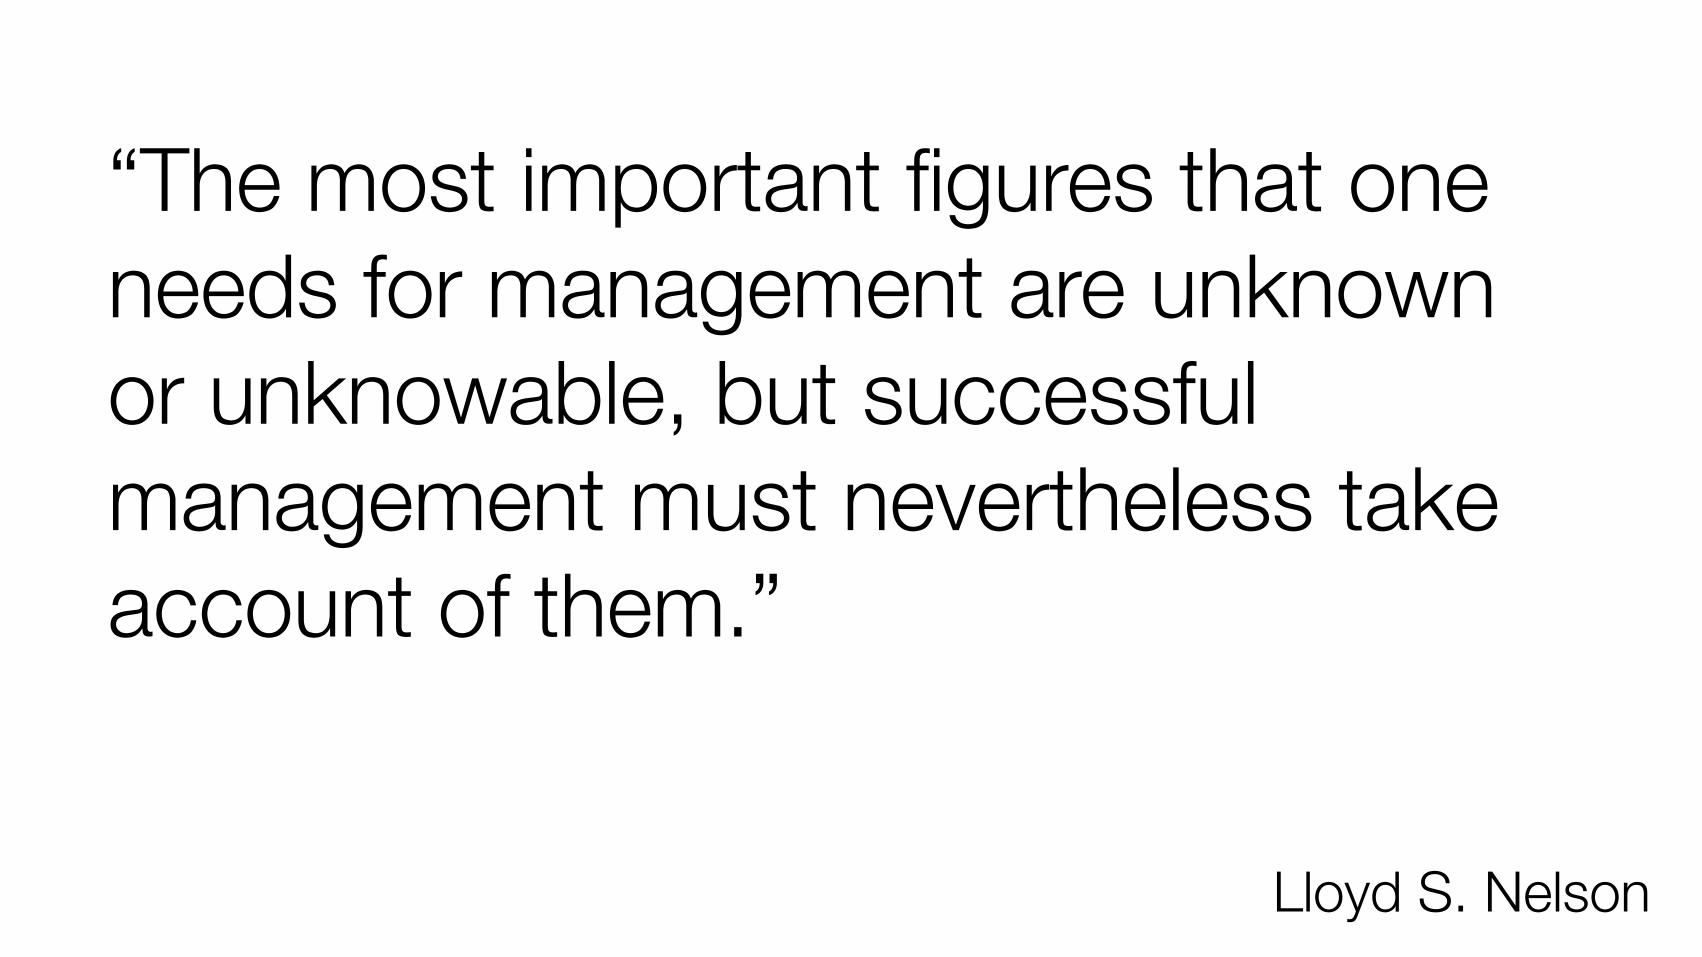
“The most important figures that one needs for management are unknown or unknowable, but successful management must nevertheless take account of them.”
Lloyd S. Nelson

Pic by Twodolla on Flickr. http://www.flickr.com/photos/twodolla/3168857844

ARCHIMEDES HAD TAKEN
BATHS BEFORE.
Once, a leader convinced others in the absence of data.

Now, a leader knows what questions to ask.
Workshop: Systems diagrams and NCARB’s business
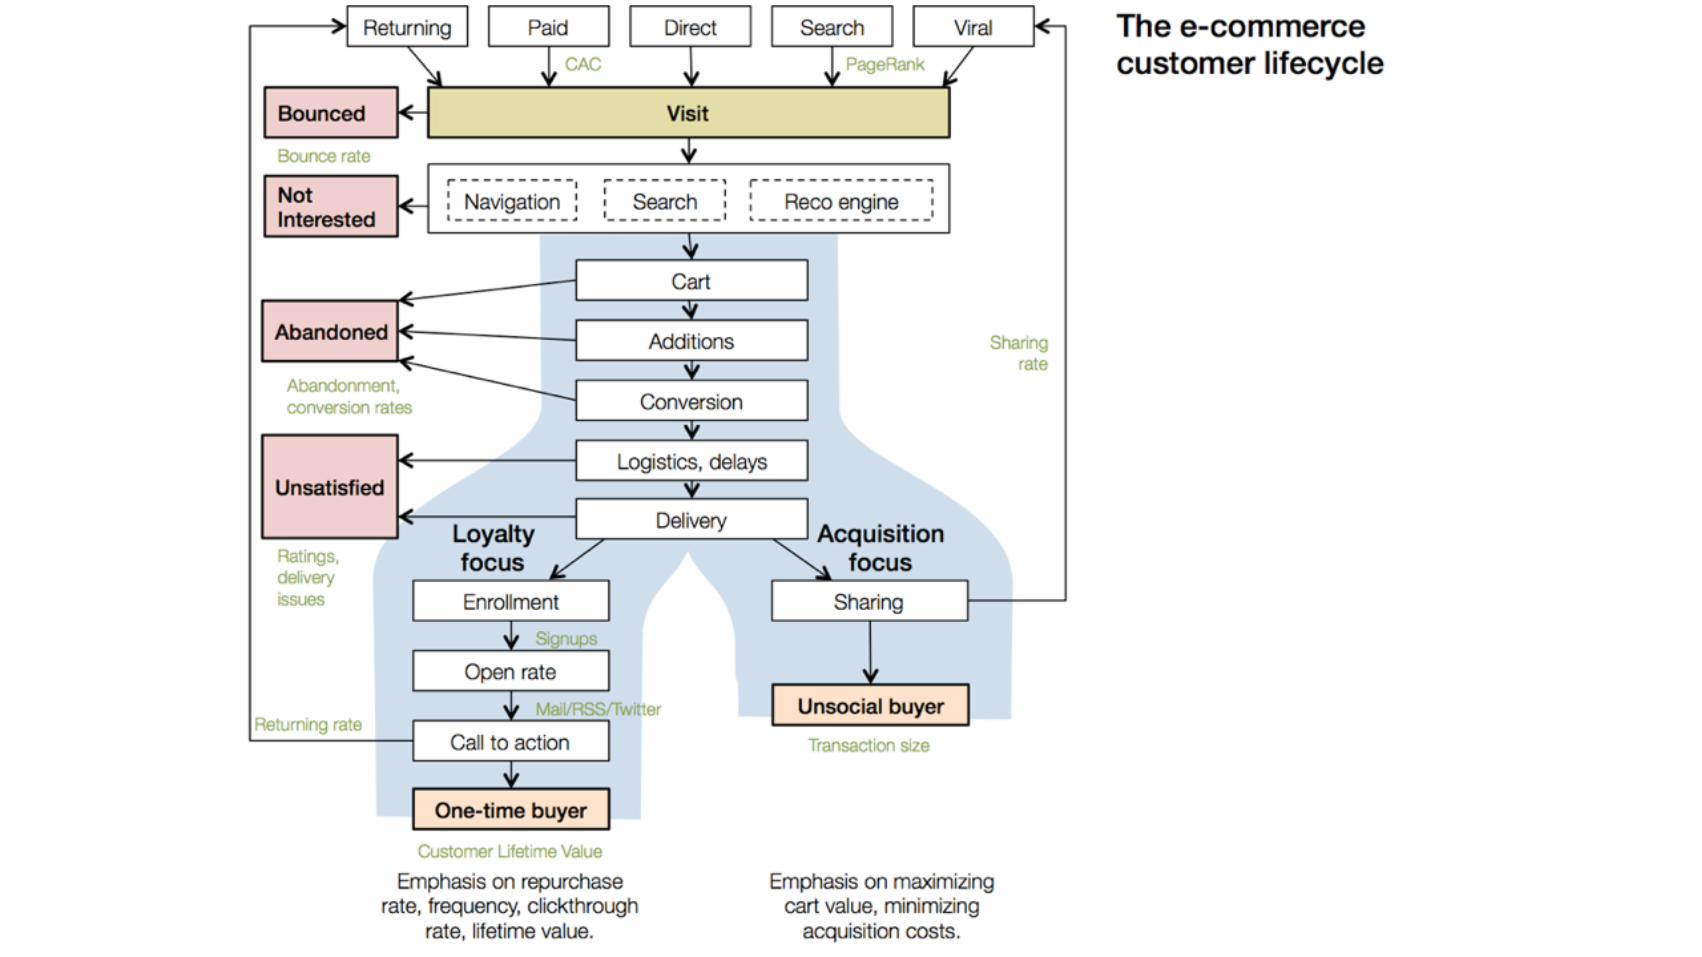
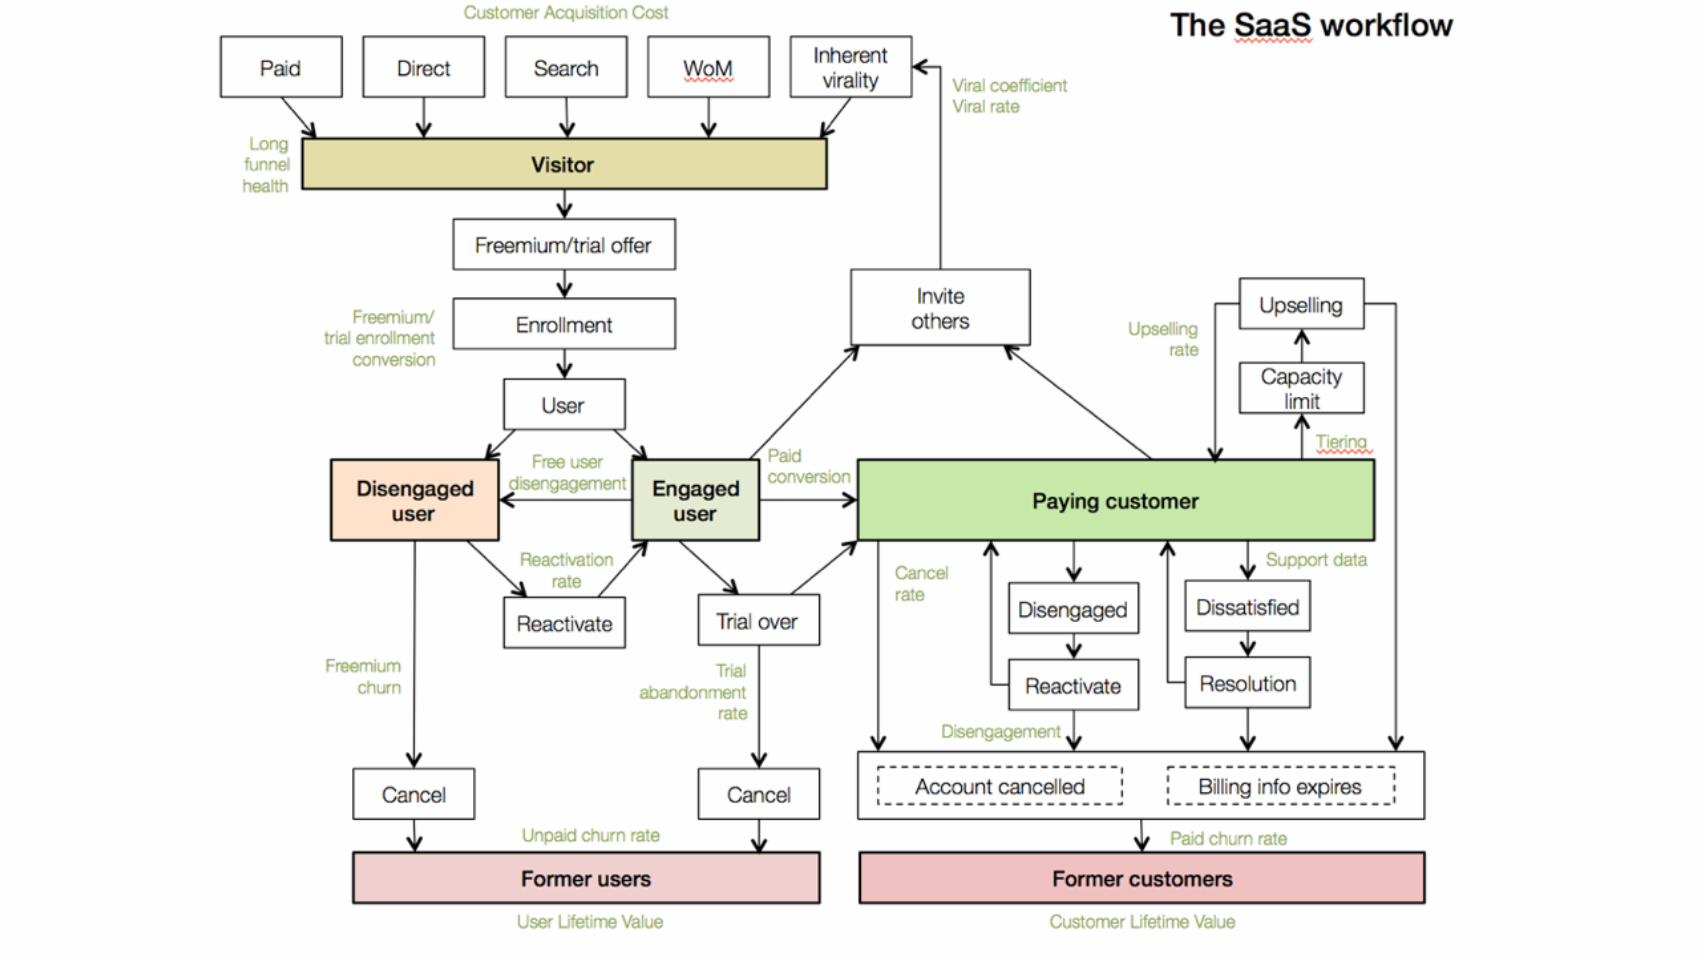
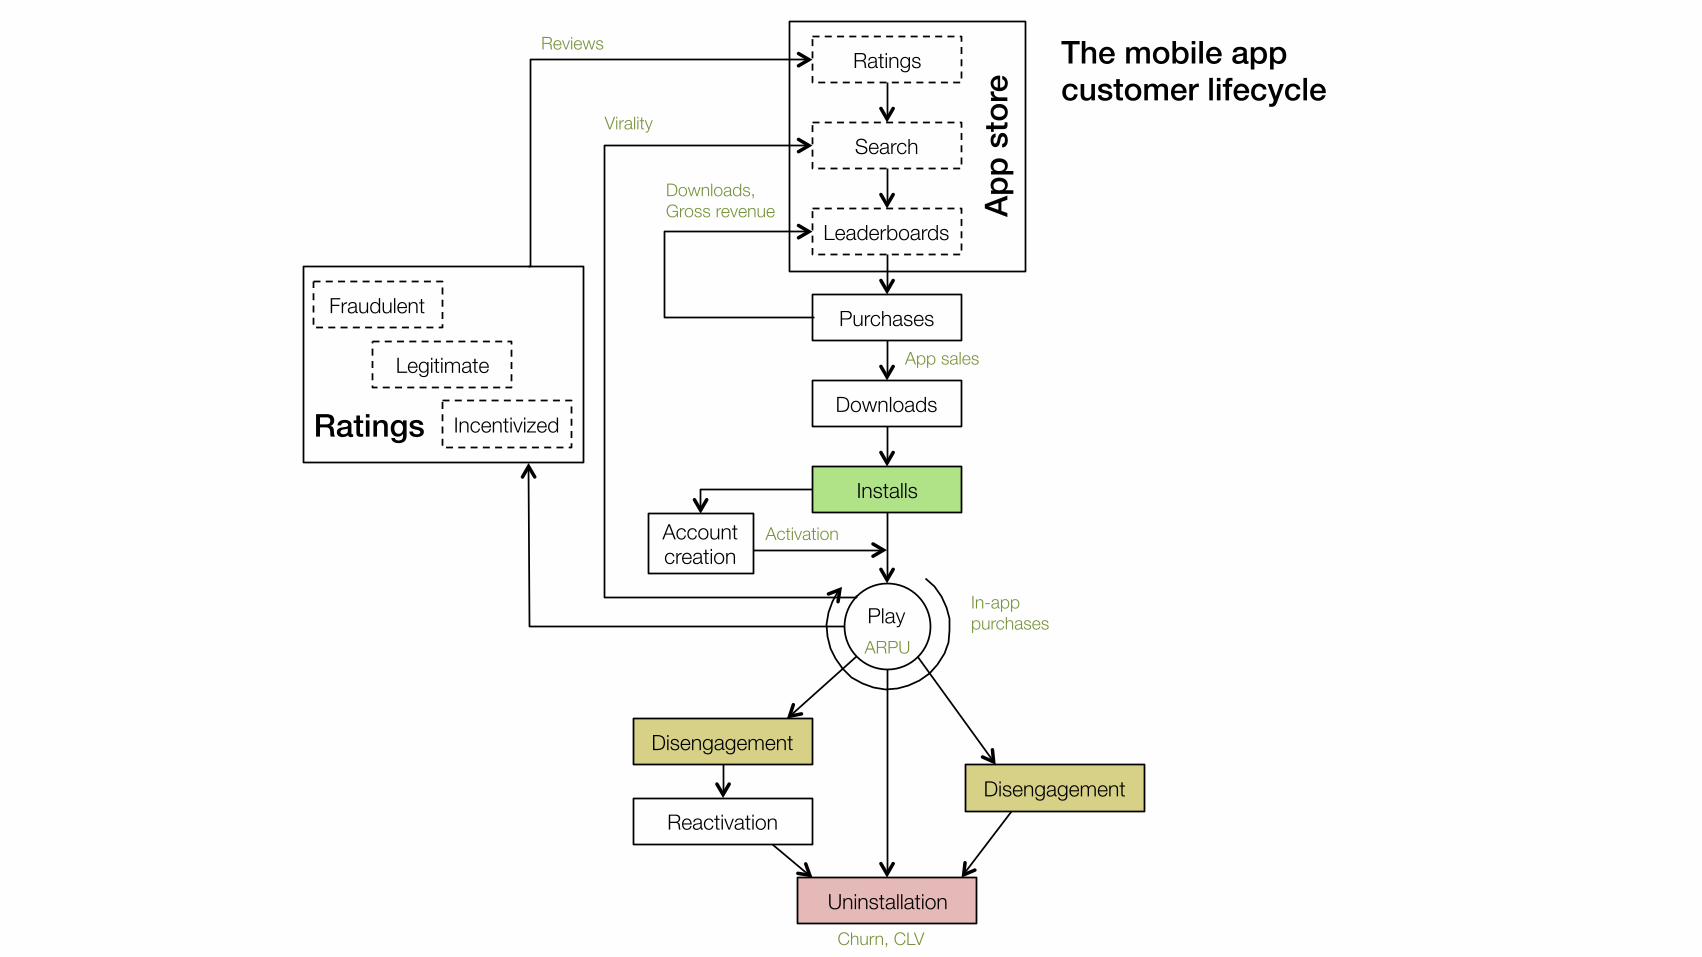
The mobile app !customer lifecycle!
Ratings Reviews
Search
Leaderboards
Purchases
Downloads
Installs
Play
Disengagement
Reactivation
Uninstallation
Disengagement
Account"creation
Virality
Downloads,"Gross revenue
ARPU
App sales
Activation
Churn, CLV
In-app"purchases
App
stor
e!
Incentivized
Legitimate
Fraudulent
Ratings!
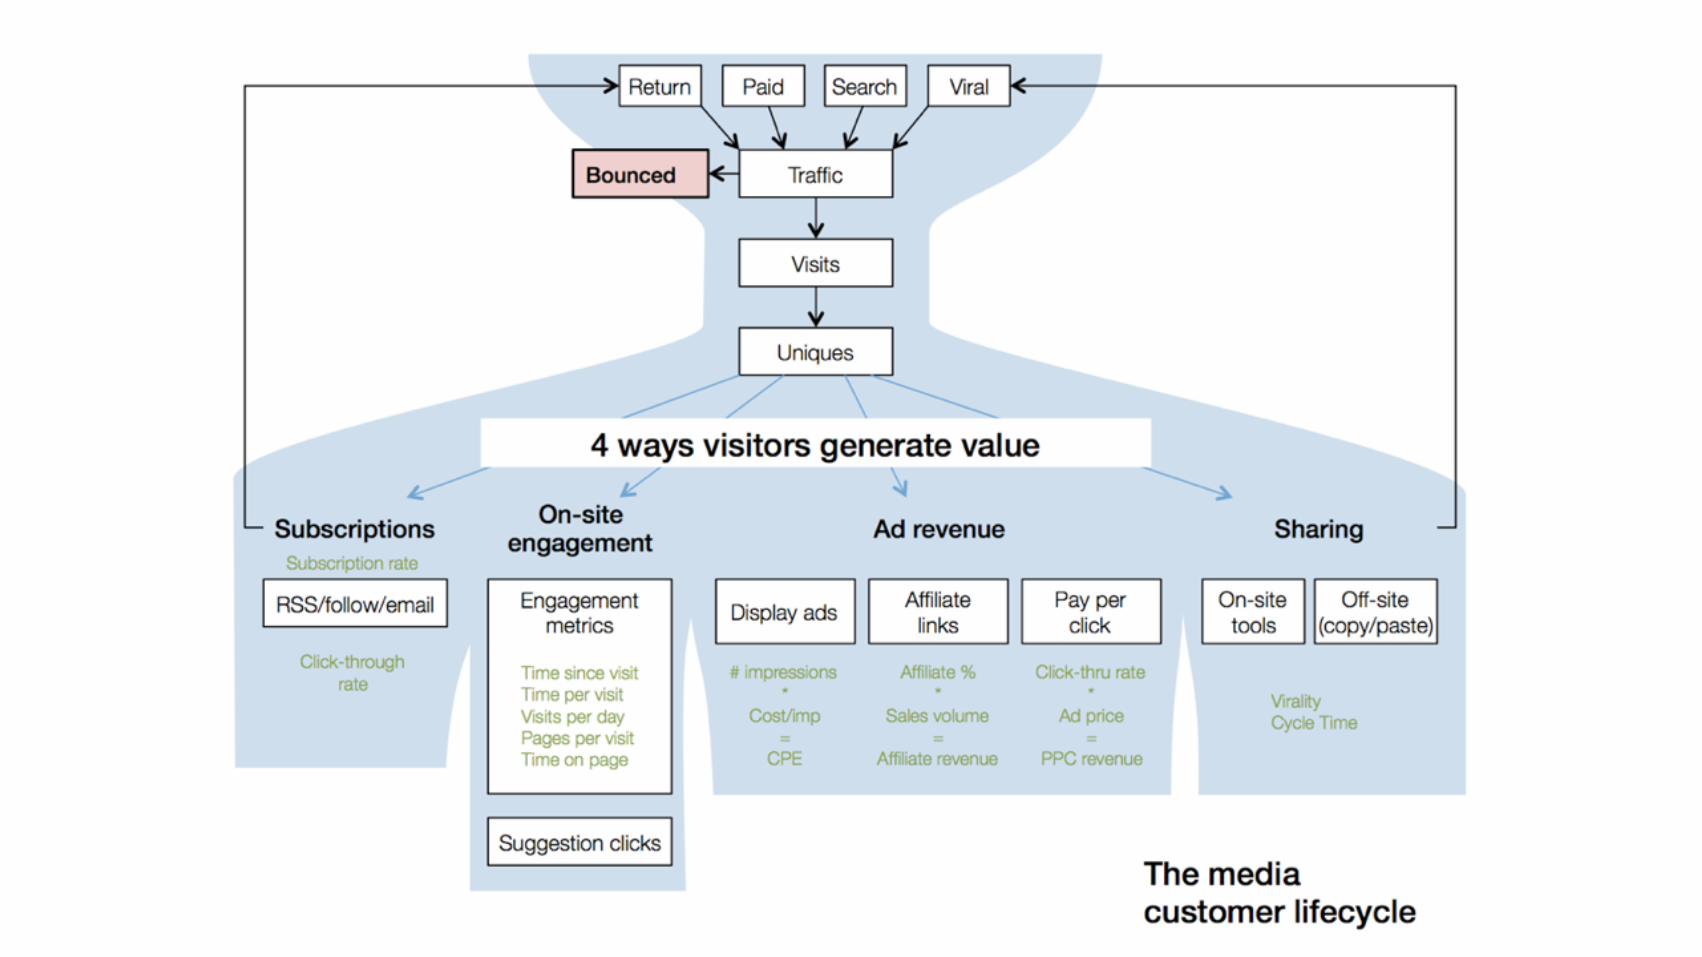
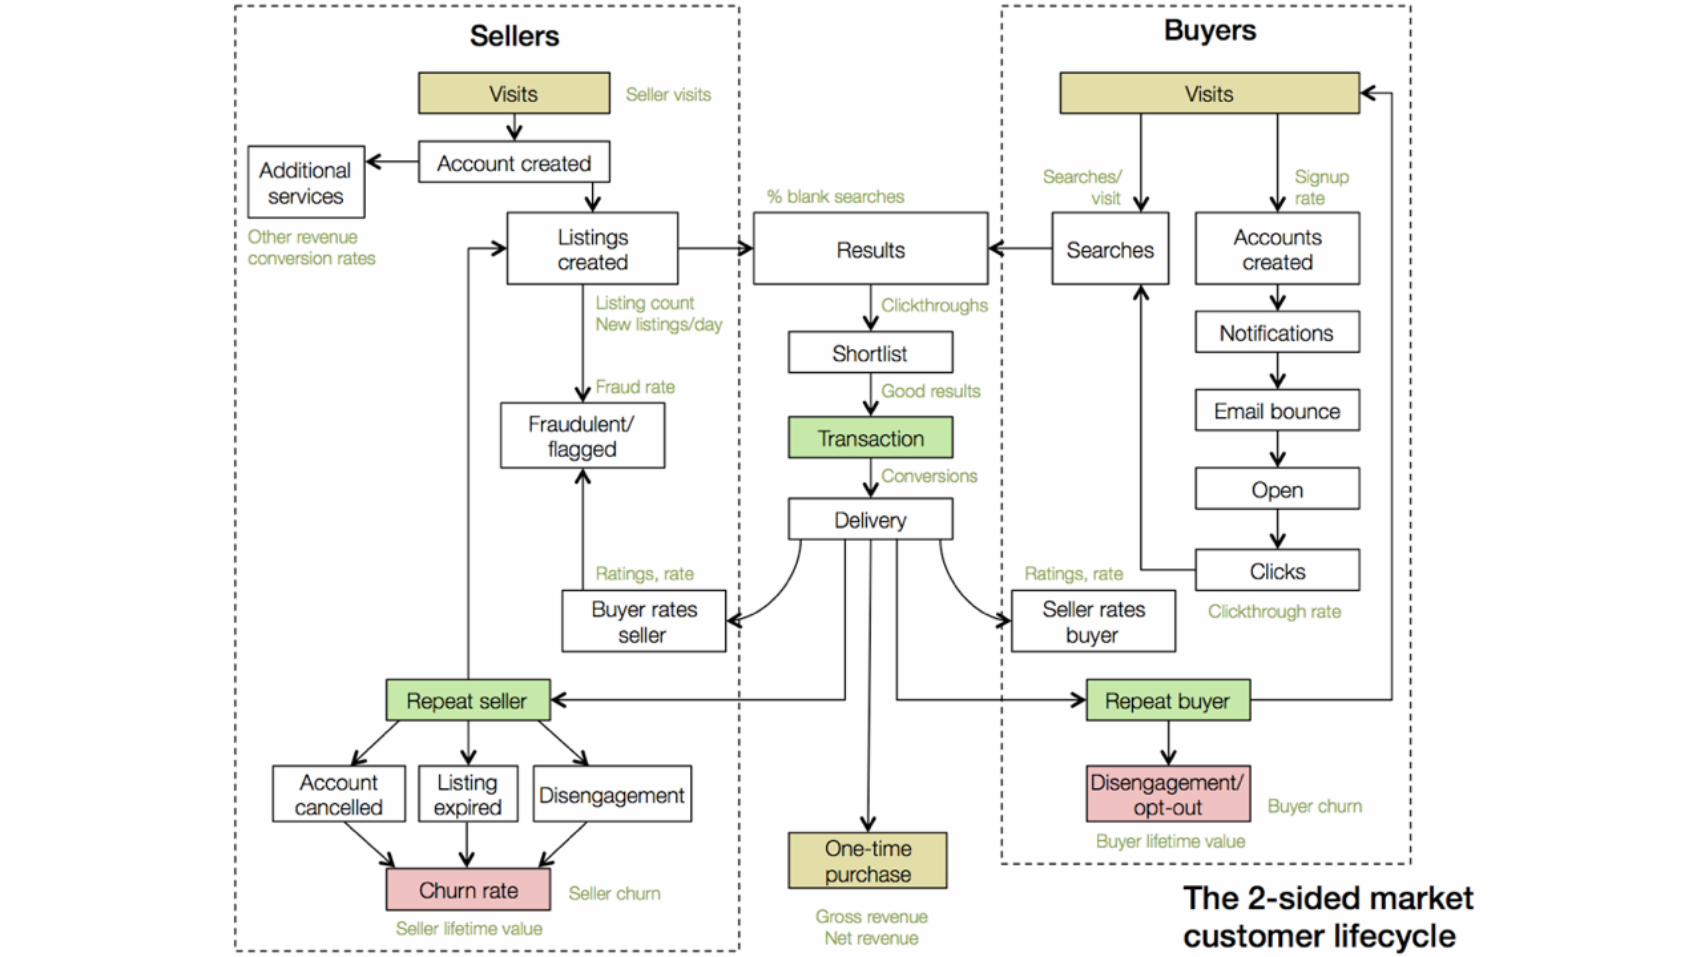
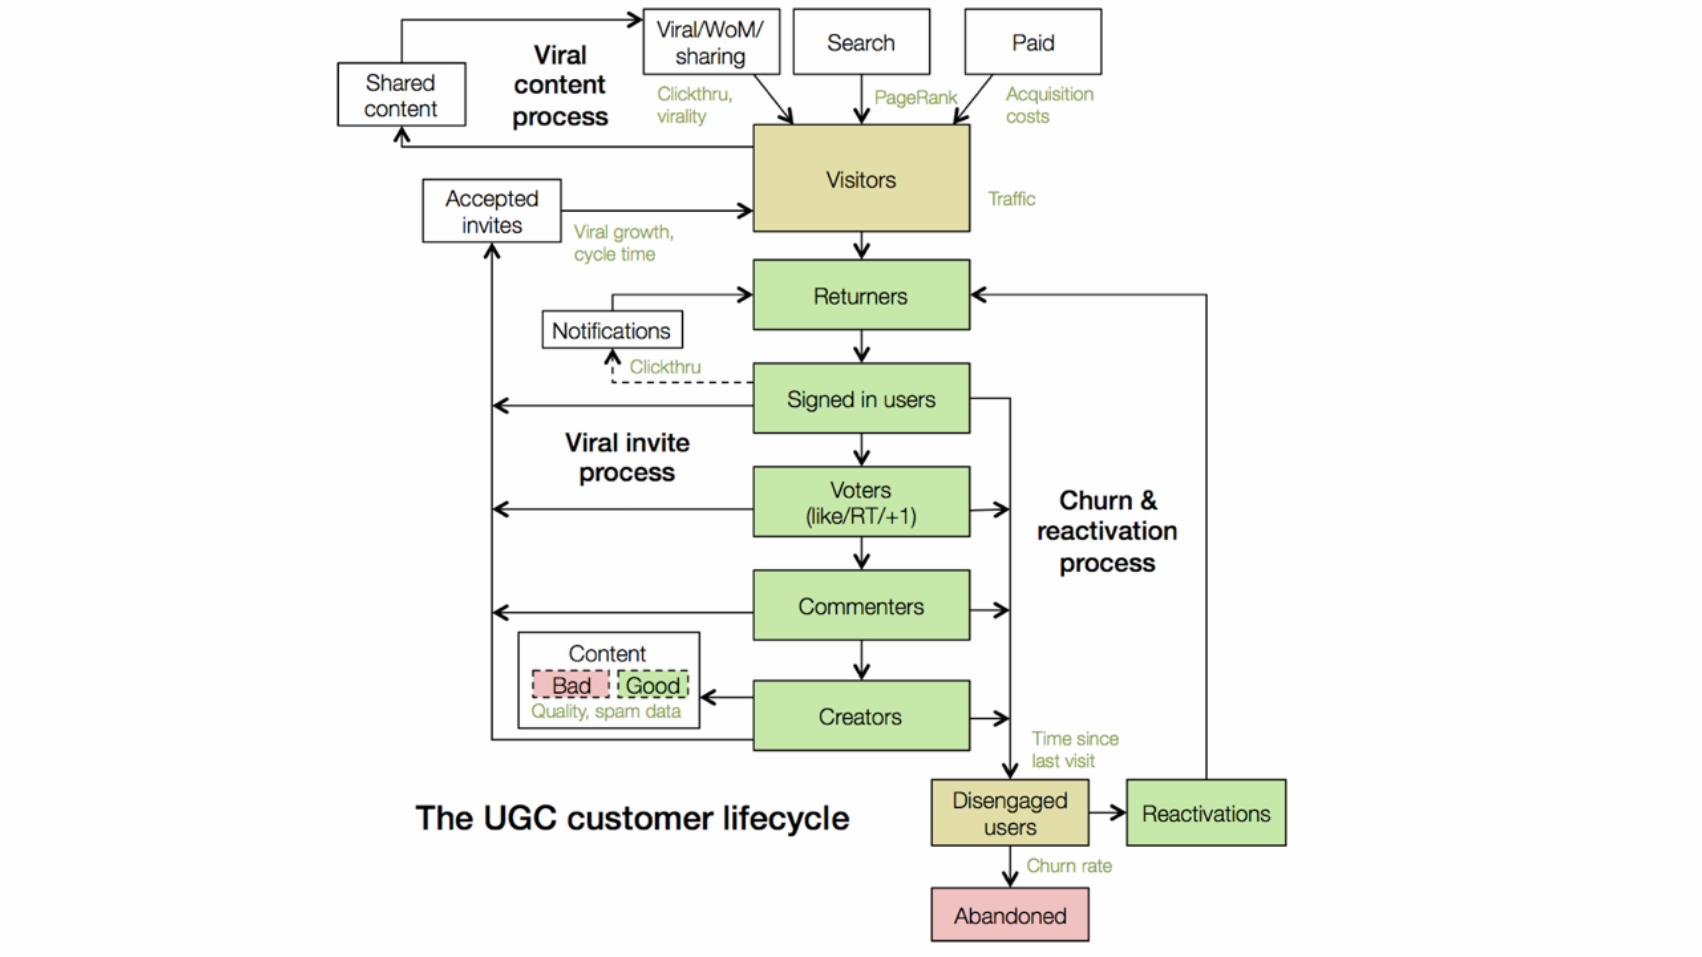
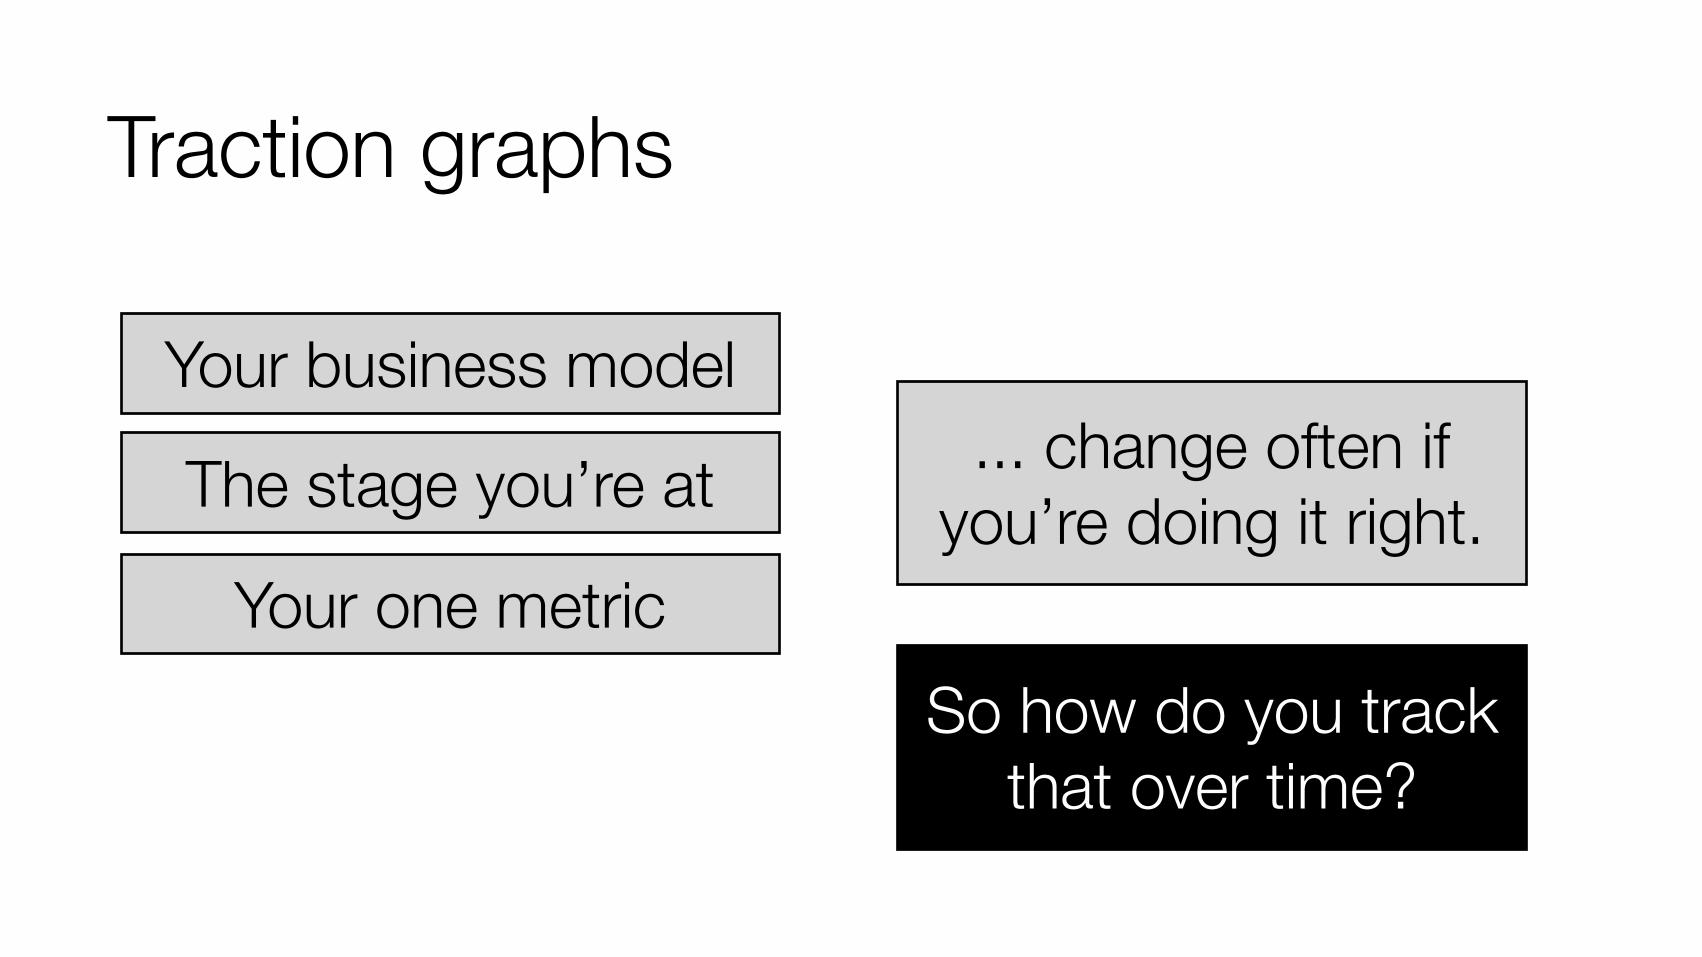
Traction graphs
Your business model
The stage you’re at
Your one metric
... change often if you’re doing it right.
So how do you track that over time?
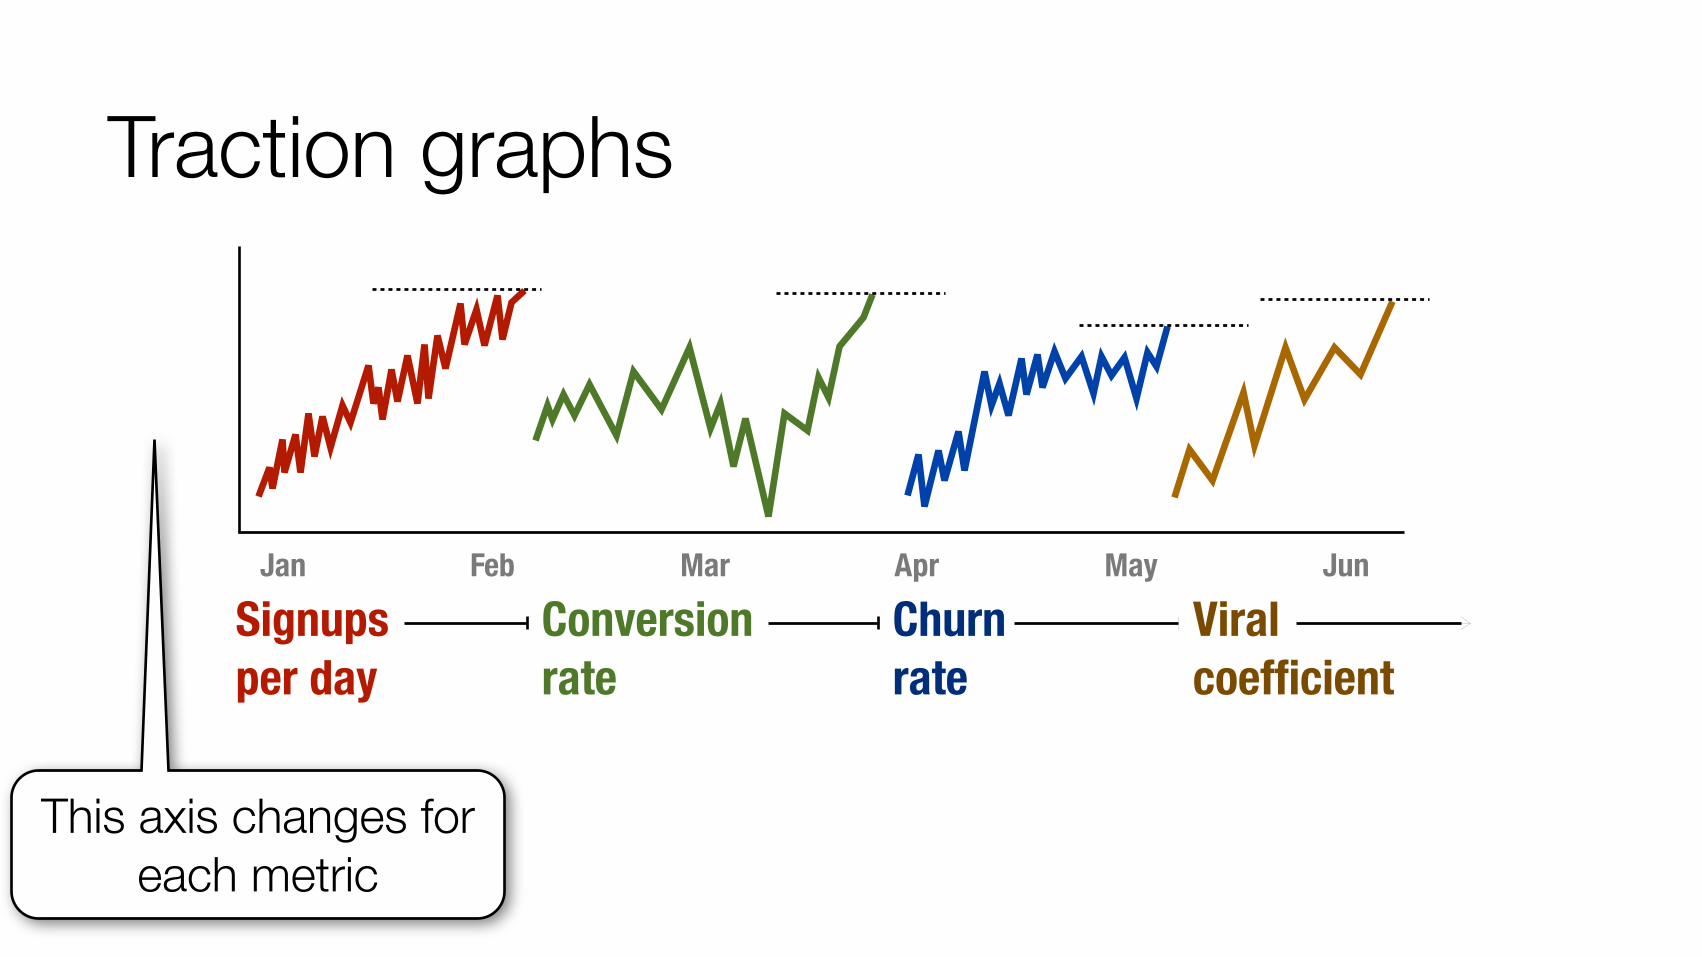
Traction graphs
Jan Feb Mar Apr May Jun
Signupsper day
Conversionrate
Churnrate
Viralcoefficient
This axis changes for each metric
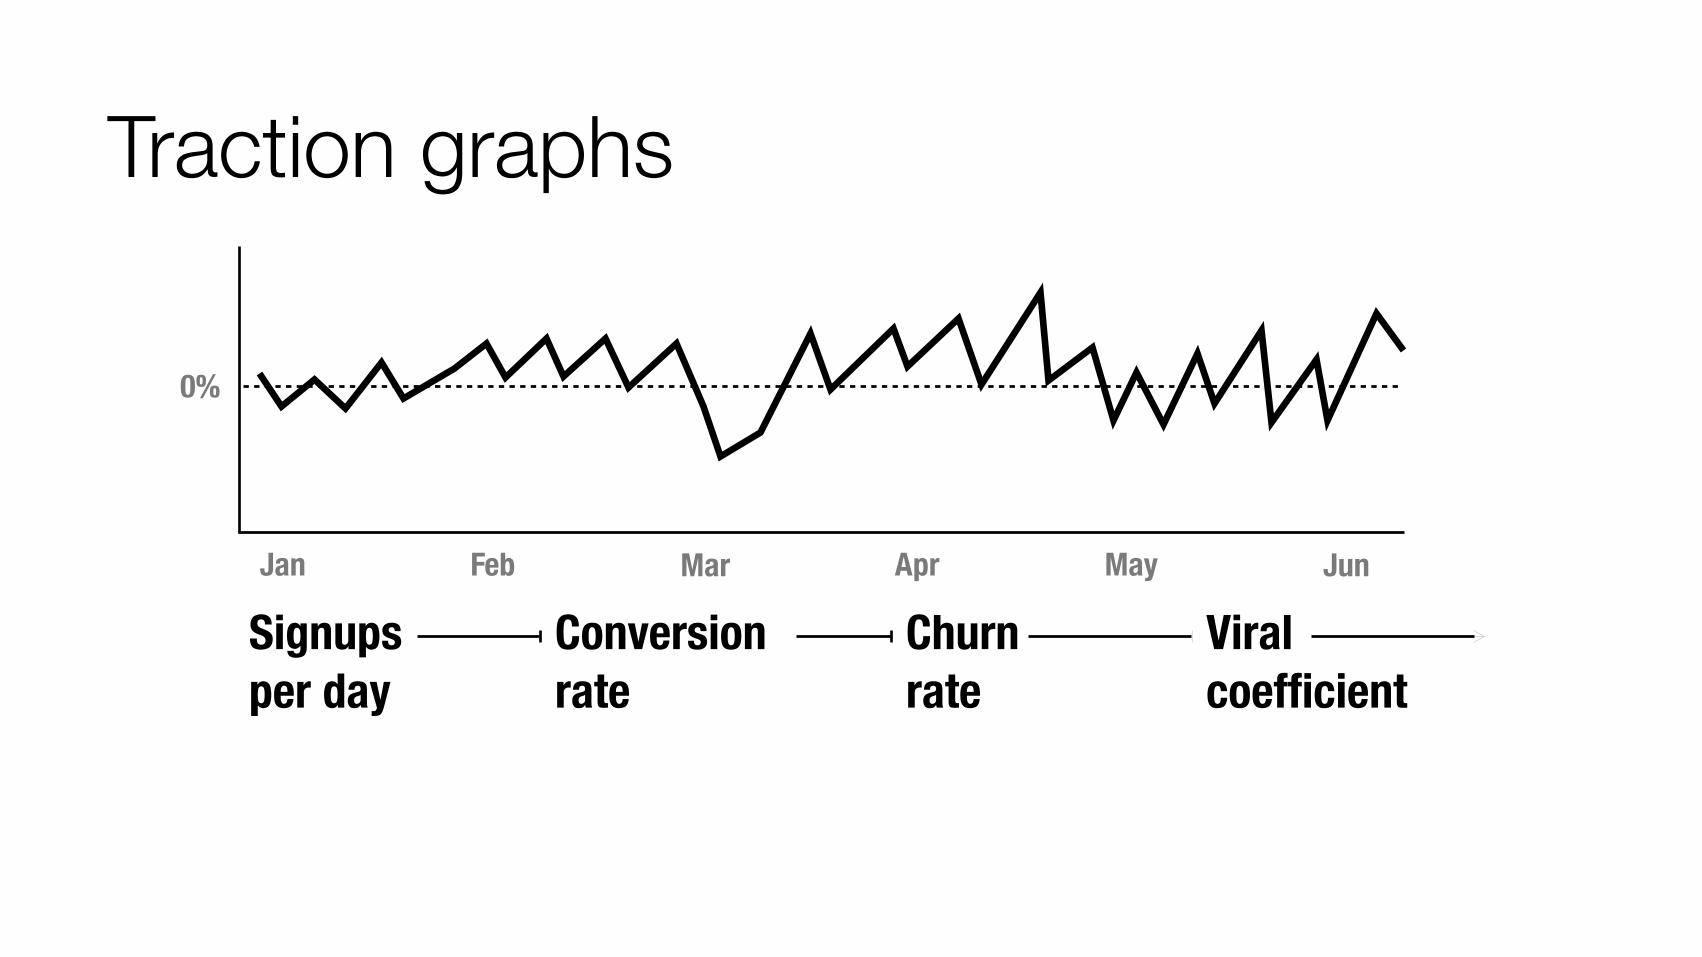
Traction graphs
Jan Feb Mar Apr May Jun
Signupsper day
Conversionrate
Churnrate
Viralcoefficient
0%
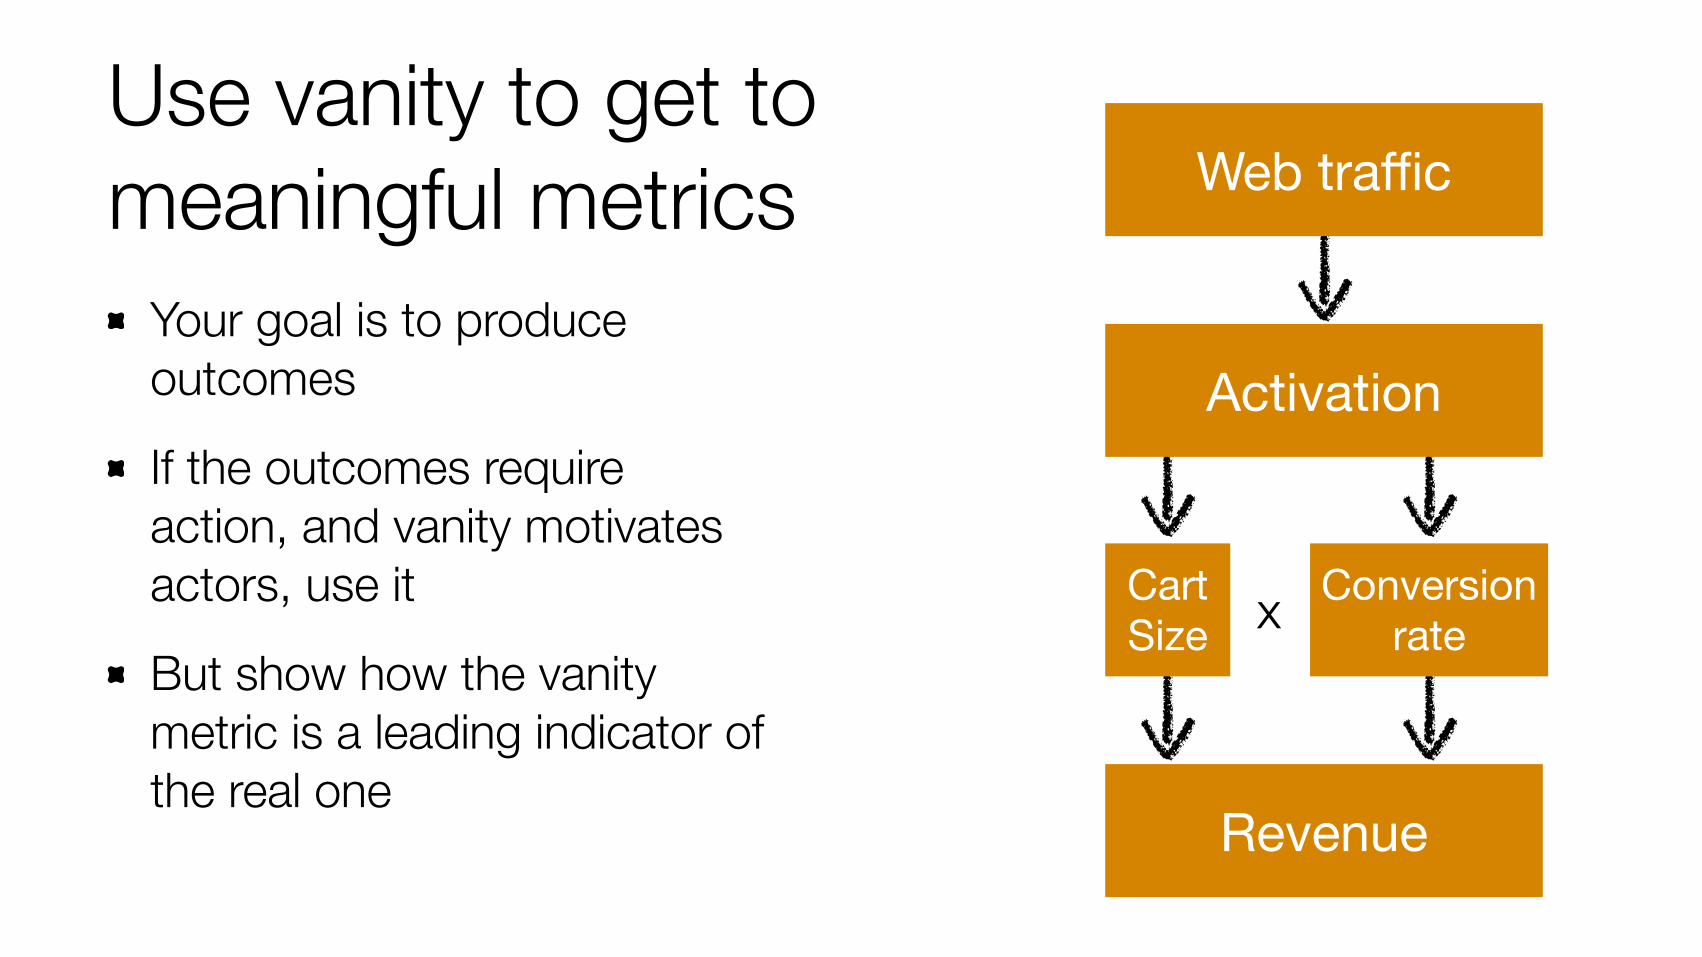
Use vanity to get to meaningful metrics
Your goal is to produce outcomes
If the outcomes require action, and vanity motivates actors, use it
But show how the vanity metric is a leading indicator of the real one
x
Web traffic
Revenue
Activation
CartSize
Conversion rate
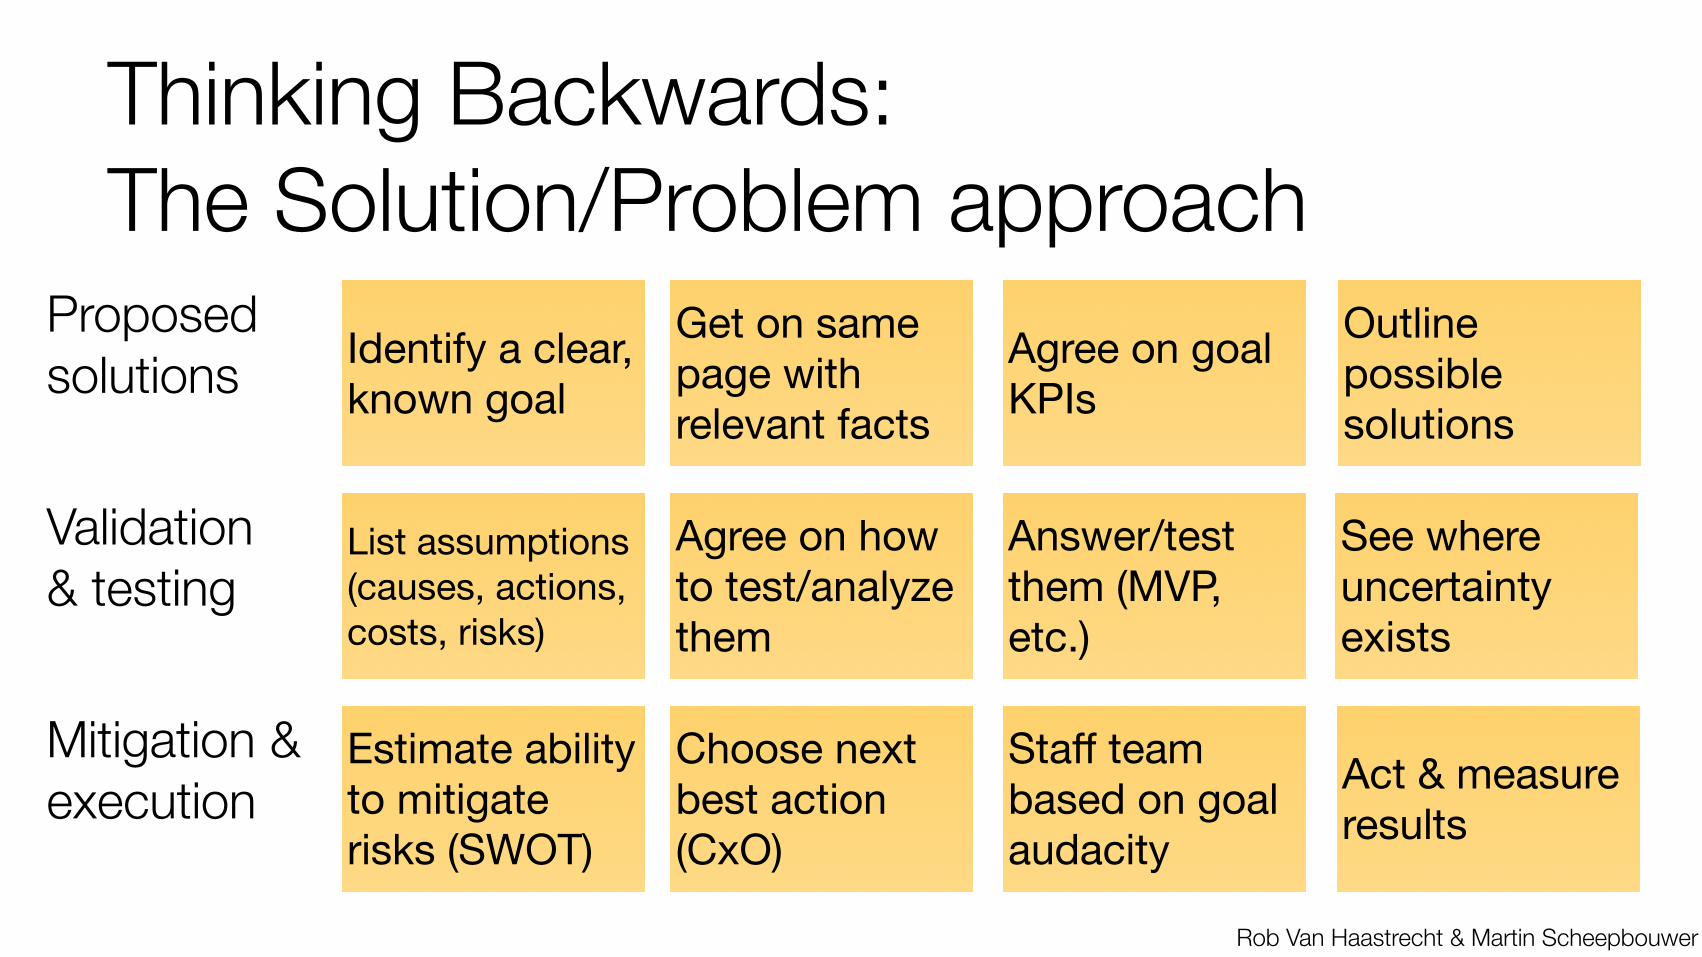
Thinking Backwards: The Solution/Problem approach
Rob Van Haastrecht & Martin Scheepbouwer
Identify a clear, known goal
Get on same page with relevant facts
Agree on goal KPIs
Outline possible solutions
Proposedsolutions
List assumptions (causes, actions, costs, risks)
Agree on how to test/analyze them
Answer/test them (MVP, etc.)
See where uncertainty exists
Validation& testing
Estimate ability to mitigate risks (SWOT)
Choose next best action (CxO)
Staff team based on goal audacity
Mitigation & execution Act & measure
results
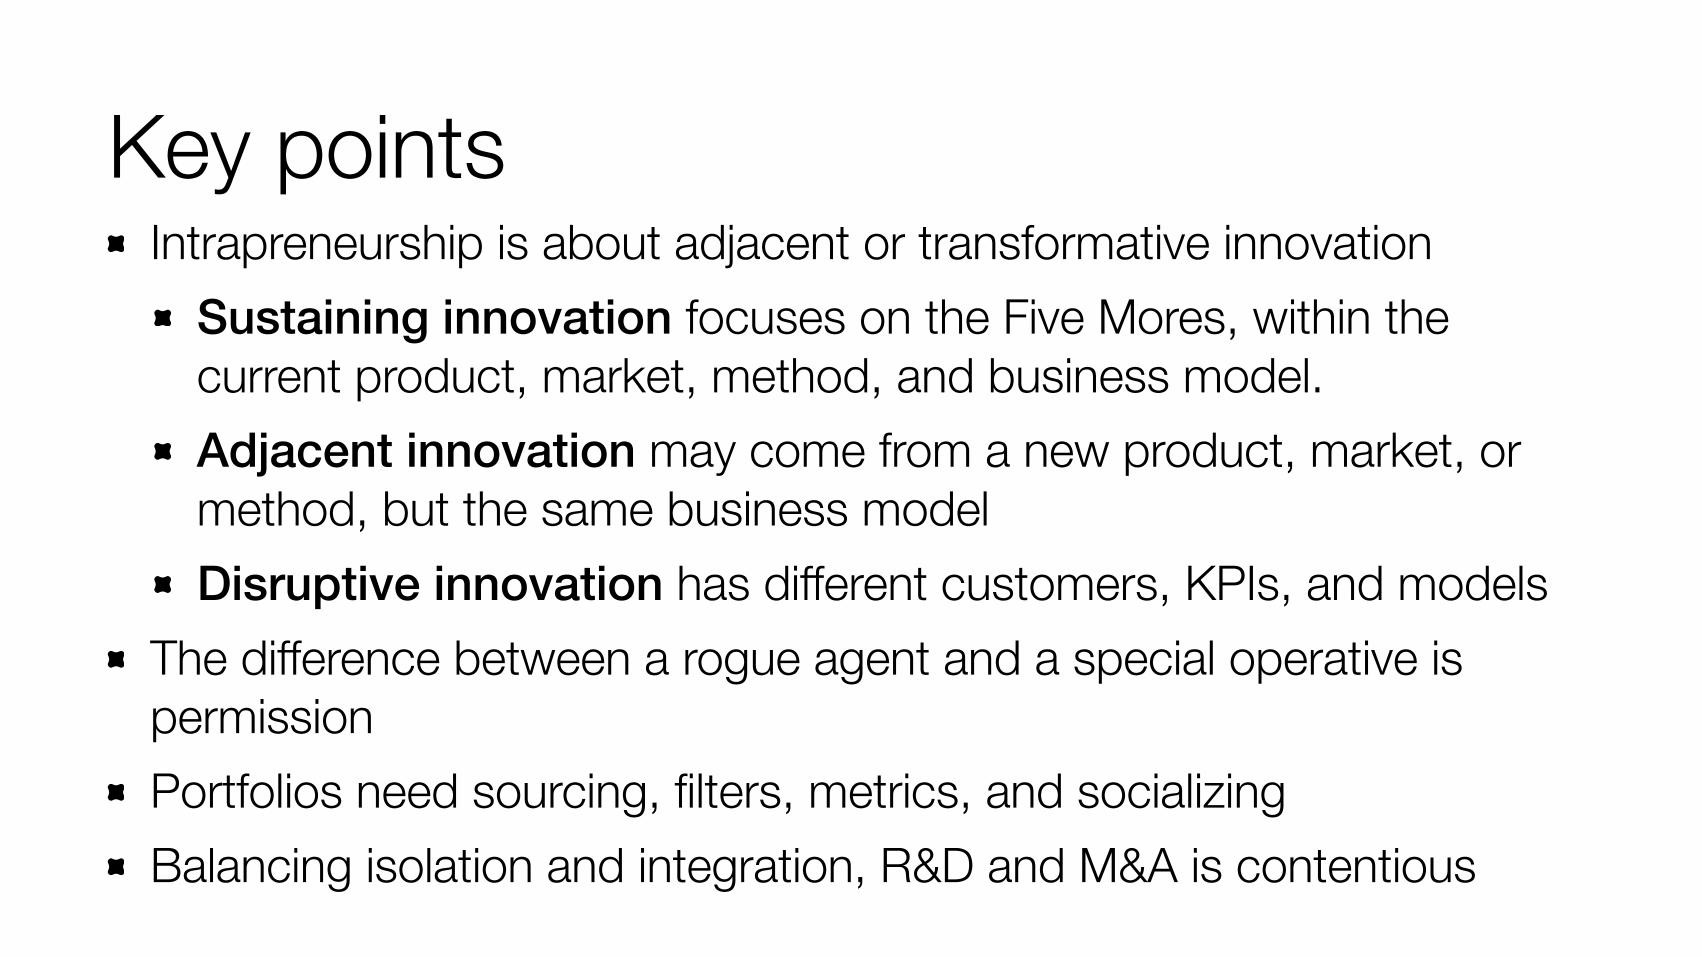
Key pointsIntrapreneurship is about adjacent or transformative innovation
Sustaining innovation focuses on the Five Mores, within the current product, market, method, and business model. Adjacent innovation may come from a new product, market, or method, but the same business model Disruptive innovation has different customers, KPIs, and models
The difference between a rogue agent and a special operative is permission Portfolios need sourcing, filters, metrics, and socializing Balancing isolation and integration, R&D and M&A is contentious