Embed Size (px)
Citation preview
Starbucks
Presented By:Brandie Whitmire
Lukas JonesRichard Whitehouse
David Alex SelbyErika Hartvickson
Bryan KellyJustin YoungPete Leiweke
Executive Summary
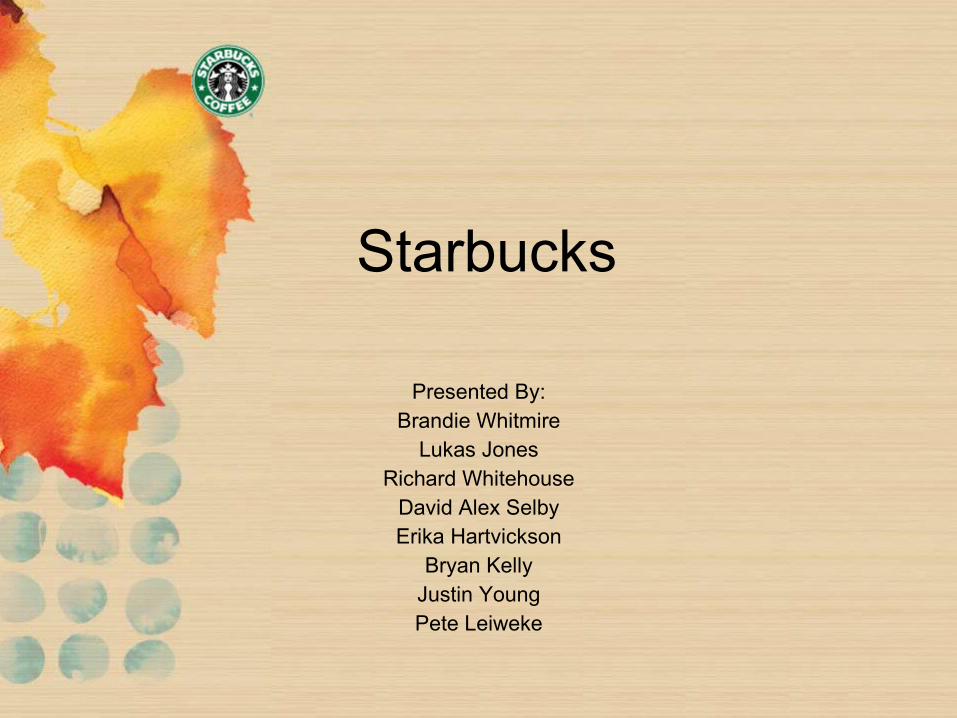
• Vision Statement: “The bottom line is we always figured that putting people
before products just made good common sense. So far, it’s been working out for us. Our relationships with farmers yield the highest quality coffees. The connections we make in communities create a loyal following. And the support we provide our baristas pays off everyday.”
• Mission Statement: “Establish Starbucks as the premier purveyor of the finest
coffee in the world while maintaining our uncompromising principles while we grow”
Executive Summary
• Company Overview– 1971 in Seattle’s Pike Place Market
– Went public 1992
– 1999 Hear Music
– 2006 Starbucks Entertainment
– Competing Internationally

Company Background
• Founding Shareholders– Jerry Baldwin, Zev Siegel, and
Gordon Bowker, Howard Schultz
• Company Management– Howard Schultz with other investors

Executive Summary
• Strategy Tactics– Customer Orientation,
Employees, and Customization
• Market Analysis– Domestic is saturated and
mature– Intense Competition
• Low Capital Requirements
Executive Summary
• Market Plan– Ambiance and Personal
Experience– Customers prefer known brand
names, have high disposable income
• Financial Plan– Growth in Revenues– Profit Margins 3-5%
Industry Analysis
• Principle Products• Unique Features• Sales Growth / Profit Margins• Industry Data and Prospects• Maturity of Line• Trends
Product’s Unique Features
–Variety of products
–Customer’s experience
Sales Growth and Profit Margins
–Profit margin 3-5%
–Sales increased 20% in 2006
–Sales predicted to increase 14%

Pretax Profits
– Retail operations 2006: $6,583,098– Retail operations 2005: $5,391,927
– Foodservice operations 2006: $343,168– Foodservice operations 2005: $304,358
– Licensing operations 2006: $860,676– Licensing operations 2005: $673,015
Industry Data
–Franchises, coffeehouse chains, and independently owned coffee houses
–Supplier Power
–Buyer Power
–Threat of Substitution
Product Maturity and Trends
–Domestic Market Saturation
–International Market Growing
–Leader in trend of young coffee drinkers
–Brand and culture to coffee drinking

Opportunities
–Ease of entry
–Industry growth
–Buyer power
Threats
–Brand identity
–Economies of scale
–Substitutes
Marketing and Sales
• Customer Profile• Distribution Systems• Pricing• Stage in Product Life-Cycle• Advertising/Promotion
compared to competitors
Customer-End user Profile
–Age 18-34–Internet users–Men and women–Majority of ethnicities–High disposable income–Prefer brand names and vulnerable to
societal/cultural influences
Distribution
–Directly to customers through own retail stores
–Partnerships with grocery and retail outlets
Marketing and Pricing
–A way of life–Coffee house environment–Charges a premium price–Maturity stage of life cycle
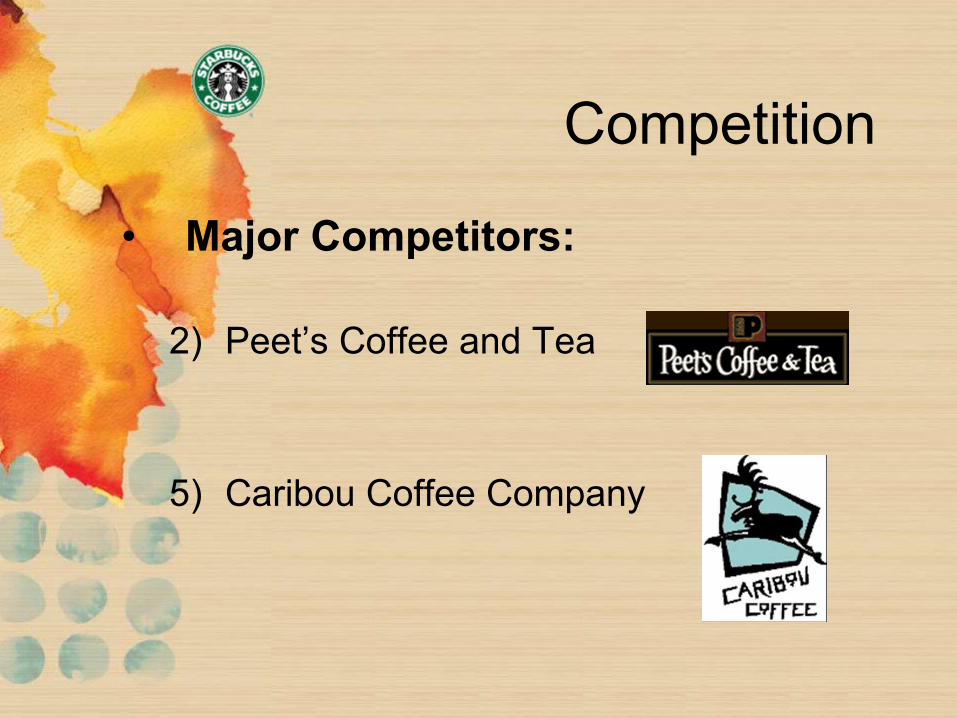
Competition
• Major Competitors:
2) Peet’s Coffee and Tea
5) Caribou Coffee Company
Competition
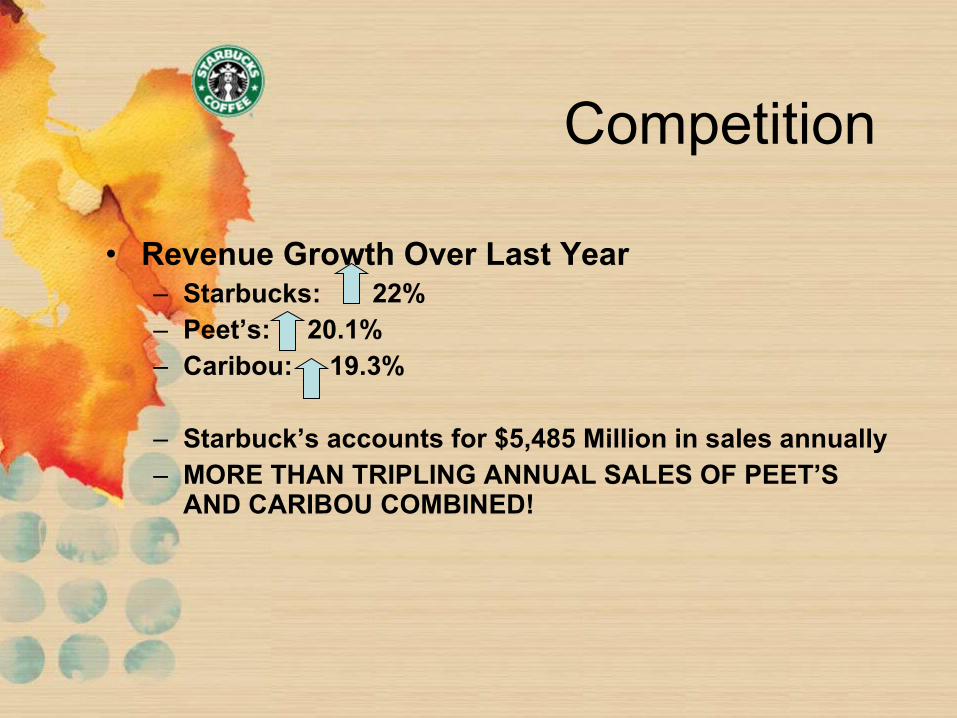
• Revenue Growth Over Last Year– Starbucks: 22%– Peet’s: 20.1%– Caribou: 19.3%
– Starbuck’s accounts for $5,485 Million in sales annually – MORE THAN TRIPLING ANNUAL SALES OF PEET’S
AND CARIBOU COMBINED!

Competition
• Net Earnings as % of Revenues
– Starbucks: .06% to 7.2% of revenues
– Peet’s: to 3.8% of revenues
– Caribou: worse than previous year to (3.8%) of revenue
Competition
• Intensity of Rivalry– Rivalry is mostly determined by:
• geographical location• brand identity.
– Highly saturated areas = more intense rivalry– Competitors with established brand identity = Bigger threat.– Starbucks competitors pose little threat and rivalry is low –
Maintains monopolistic stance.
Competition
• Competitive Advantages– 3 Unique Competencies:
1) Employees – Unique Culture2) Customer Orientation – Brand Intimacy3) Customization – Unique Experience
• “Third Place” Philosophy
Competition
• Entry and Exit Barriers– Relatively Low
• Low technological requirements• Low capital requirements
– Easy to enter and exit this industry
Competition
• Pricing– Prices slightly higher than competition
• Starbucks: $1.70 for a 16 oz. cup of coffee
• Competitors: Between $1.50 - $1.75 for same cup of coffee
Competition
• Advertising and Promotional Effort– Amount of Selling, Administrative, and
General Expenses as a % of Revenues:
• Starbucks = 6%• Peet’s Coffee = 9%• Caribou = 52%

Structure
• Sense of Empowerment
• Regionalized Leadership
• Team Work
• Constant Differentiation

Strategy
• Differentiate– Constant Internal R&D
• Tactics– Focus on Growth– New Product Categories and
Channels– Maintain Core Values
Management Team
• Baristas – Standardization of Skills
• Employee Empowerment as a Tactic– 40 Vice Presidents– One Store Manager– Two Assistant Managers
Control
• Ground Level– Reduced Bureaucracy– Standardization of Skills
• Upper Management– Team Work– Regionalized Leadership– 40 Vice Presidents

Compensation
• Sense of Empowerment– 20 hrs + Receive Stock and
Health Care
• Other Compensation Includes– Retirement Savings Plan,
Discount Stock, Management Bonus, Life Insurance, Discount Merchandise
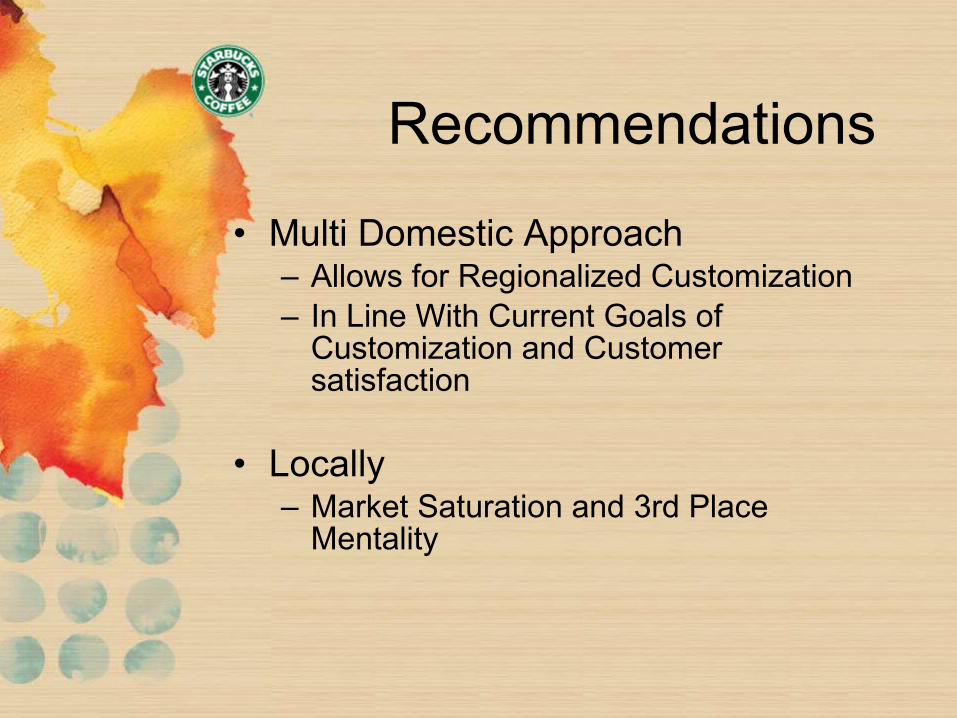
Recommendations
• Multi Domestic Approach– Allows for Regionalized Customization– In Line With Current Goals of
Customization and Customer satisfaction
• Locally– Market Saturation and 3rd Place
Mentality

Conclusion
• Differentiation Strategy
• Empowerment and Sense of Community
• Highly Regionalized Leadership and Localized Customization
• Constant Innovation
Q&A
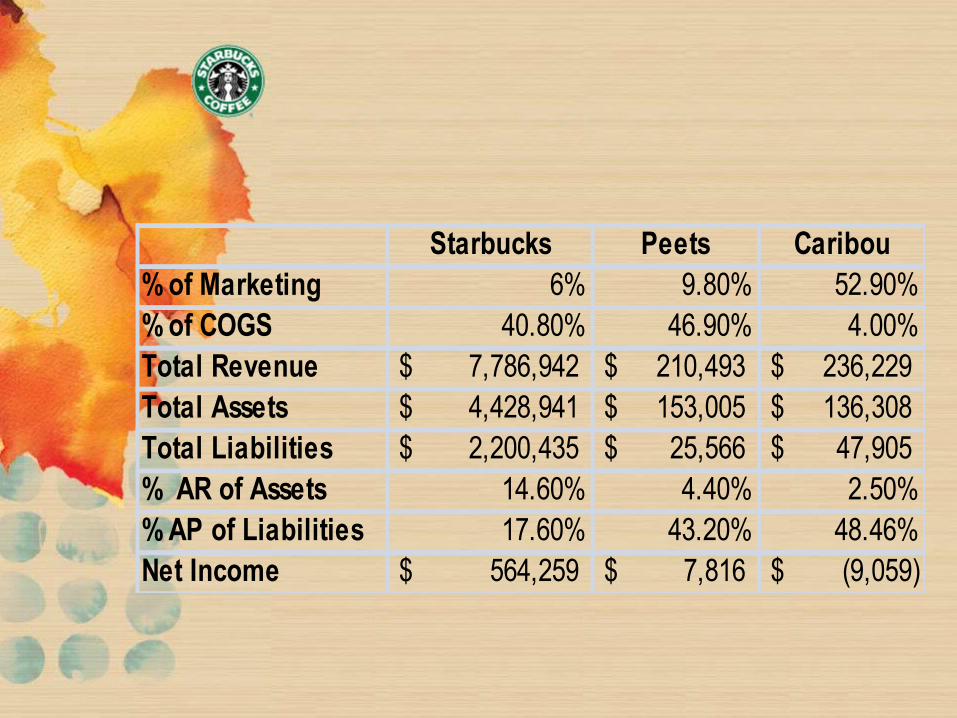
Starbucks Peets Caribou% of Marketing 6% 9.80% 52.90%% of COGS 40.80% 46.90% 4.00%Total Revenue 7,786,942$ 210,493$ 236,229$ Total Assets 4,428,941$ 153,005$ 136,308$ Total Liabilities 2,200,435$ 25,566$ 47,905$ % AR of Assets 14.60% 4.40% 2.50%% AP of Liabilities 17.60% 43.20% 48.46%Net Income 564,259$ 7,816$ (9,059)$


![Storyboard final-111020042336-phpapp01[1]](https://img.pdfslide.us/doc/110x75/54869eb1b4af9f870d8b51ee/storyboard-final-111020042336-phpapp011.jpg)