Embed Size (px)
Citation preview
Corporate Presentation
May 2015
About Safeguard Scientifics (NYSE:SFE)
> Founded in 1953
> NYSE-listed since 1971
> Proven Partner for entrepreneurs looking to accelerate growth and
build long-term value in their businesses
> Industry Focus on healthcare and technology
> Successful Track Record includes $776M realized since 2006*
> Deep Domain Expertise as financiers and entrepreneurs
> Strong Balance Sheet and Liquidity
2
*Includes DriveFactor
Why Own Safeguard (NYSE:SFE)?
> Full Value Yet to be Realized or Recognized
> Ownership Stakes in Exciting Partner Companies
> Top Performance of Proven Team
> Financial Strength, Flexibility and Liquidity
> Strong Alignment of Interests
3
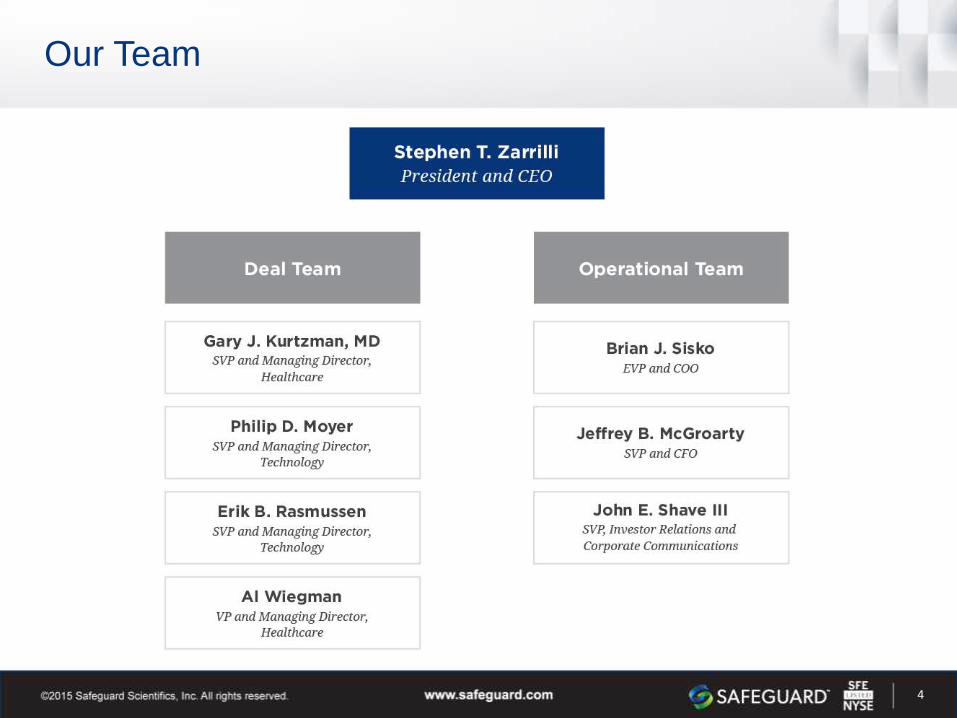
Our Team
4
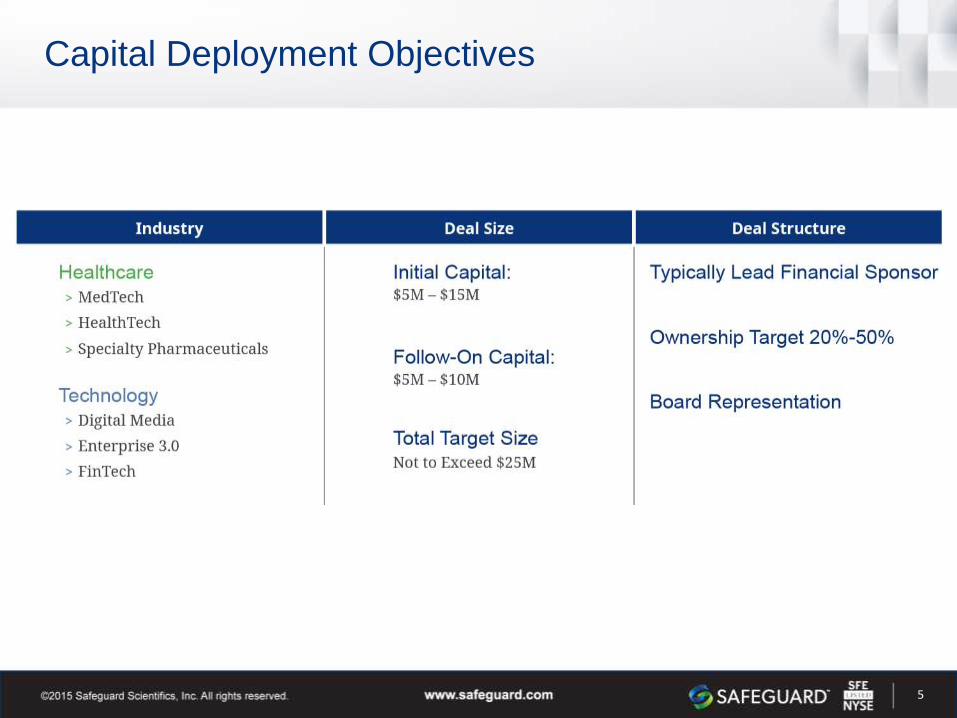
Capital Deployment Objectives
5
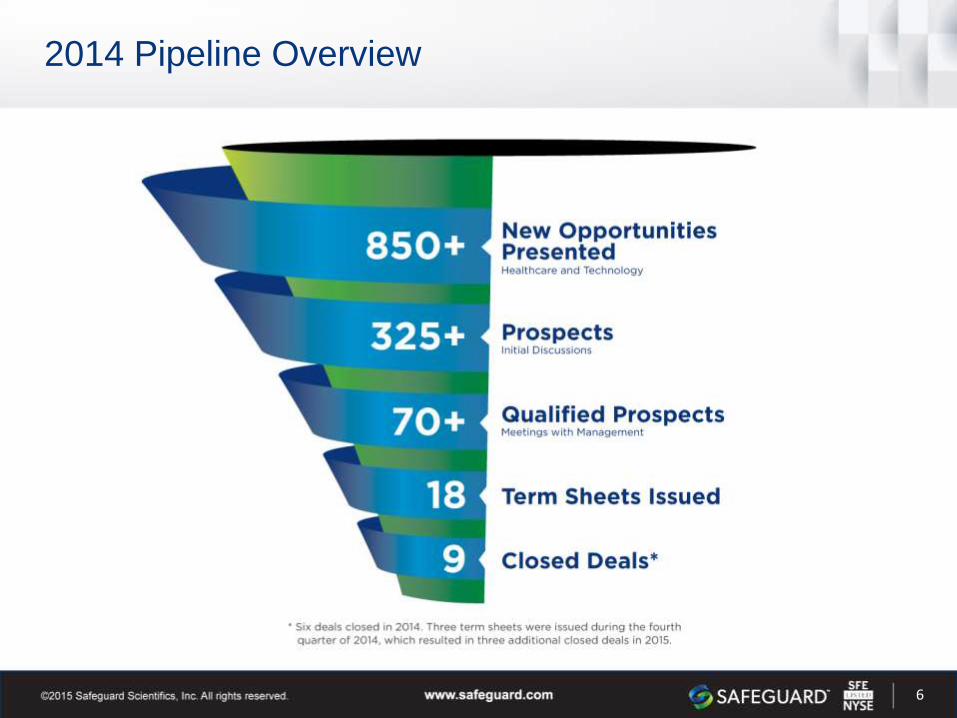
2014 Pipeline Overview
6
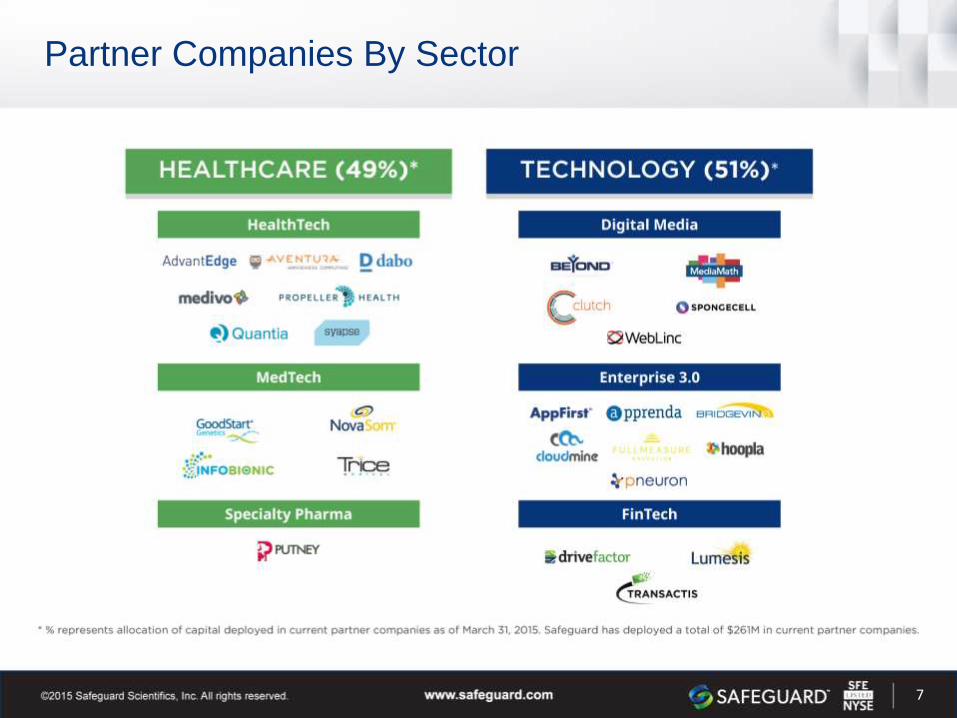
Partner Companies By Sector
7
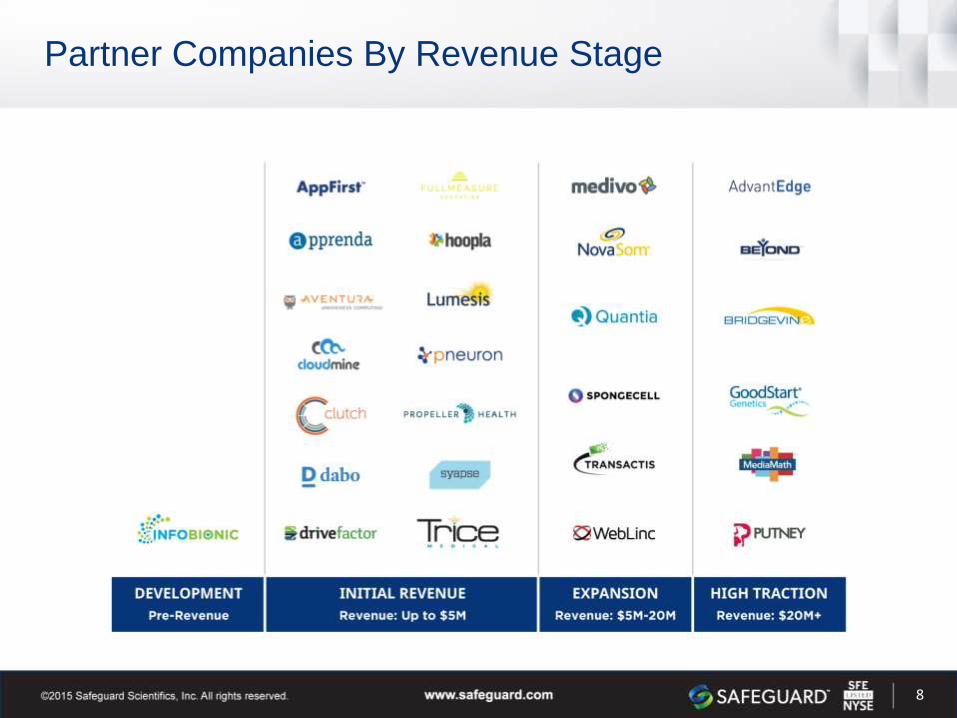
Partner Companies By Revenue Stage
8
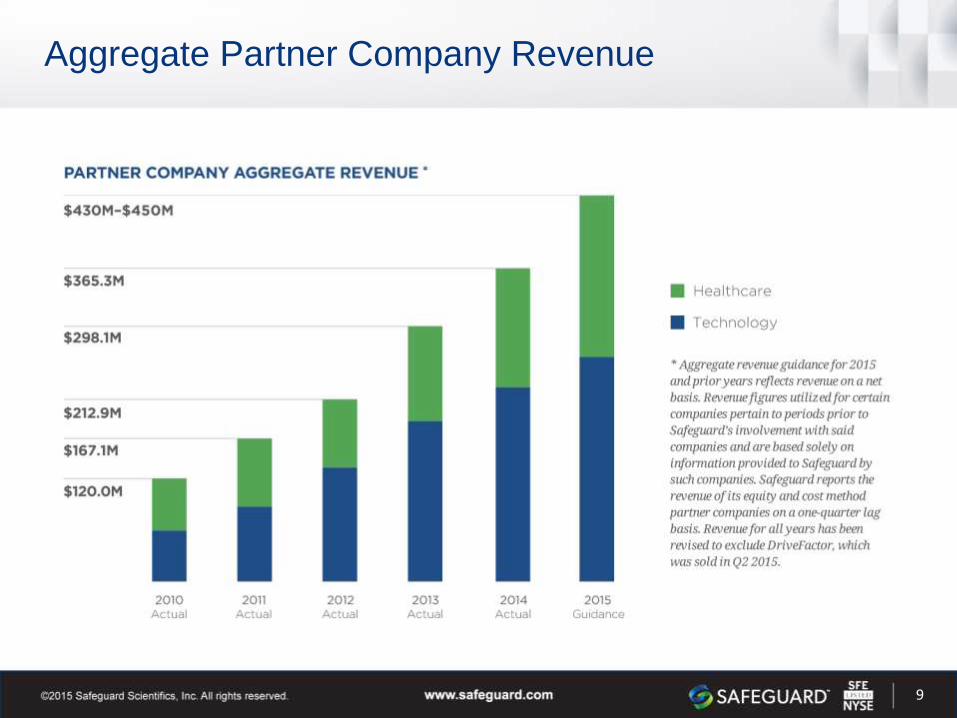
Aggregate Partner Company Revenue
9
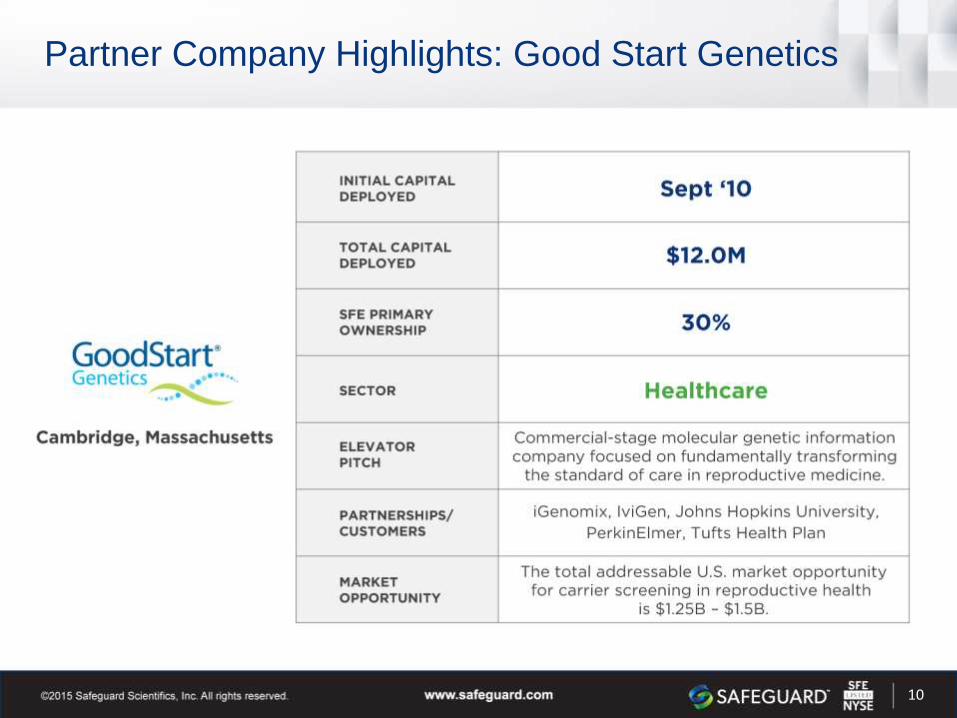
Partner Company Highlights: Good Start Genetics
10
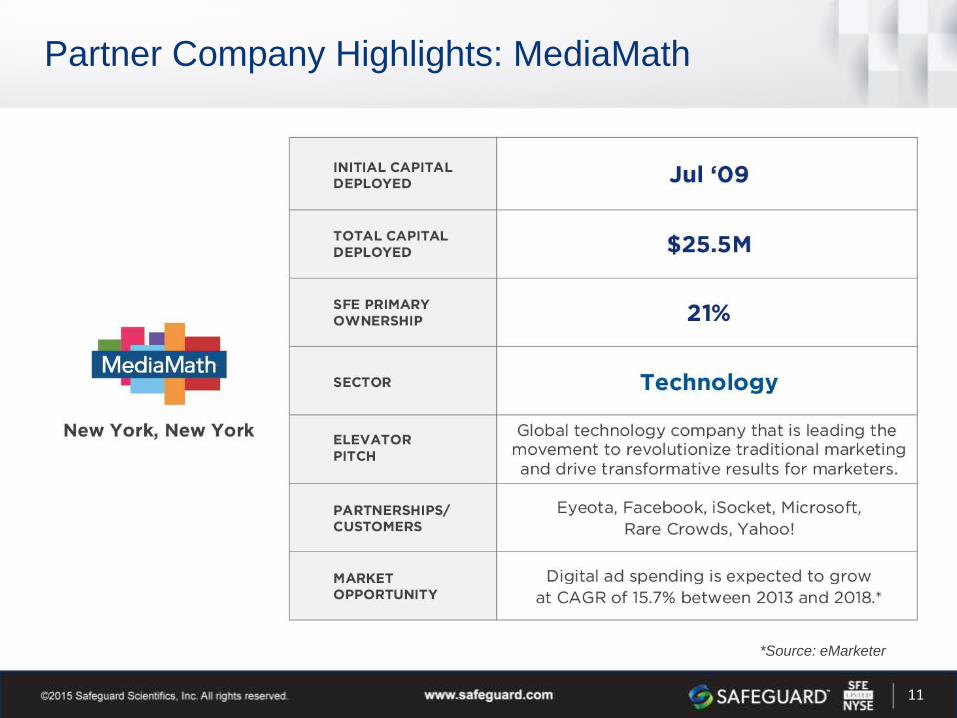
Partner Company Highlights: MediaMath
11
*Source: eMarketer
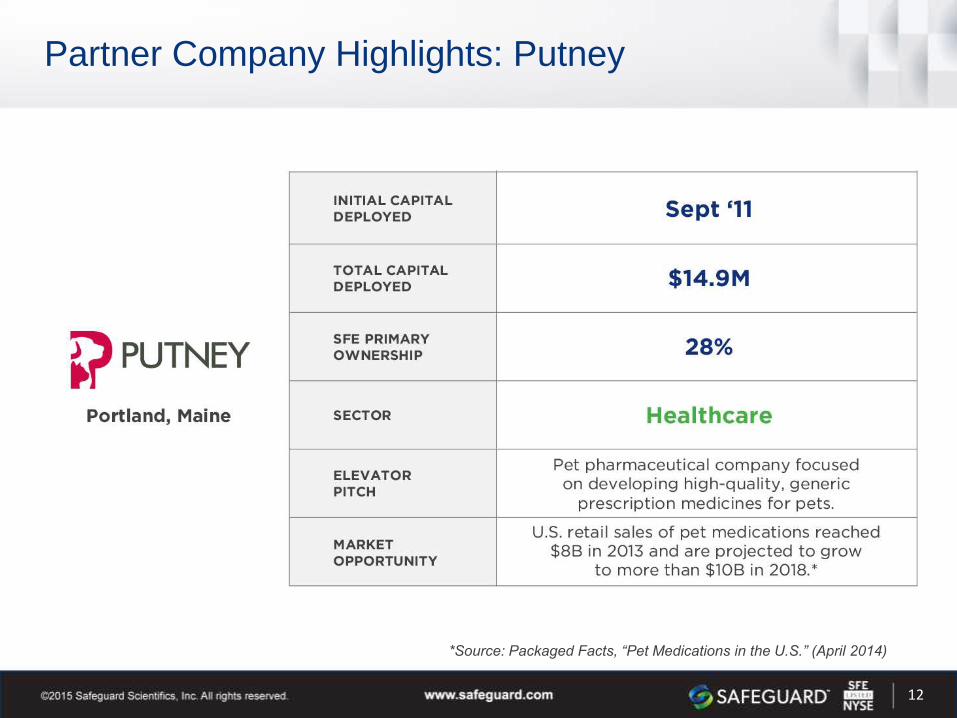
Partner Company Highlights: Putney
12
*Source: Packaged Facts, “Pet Medications in the U.S.” (April 2014)
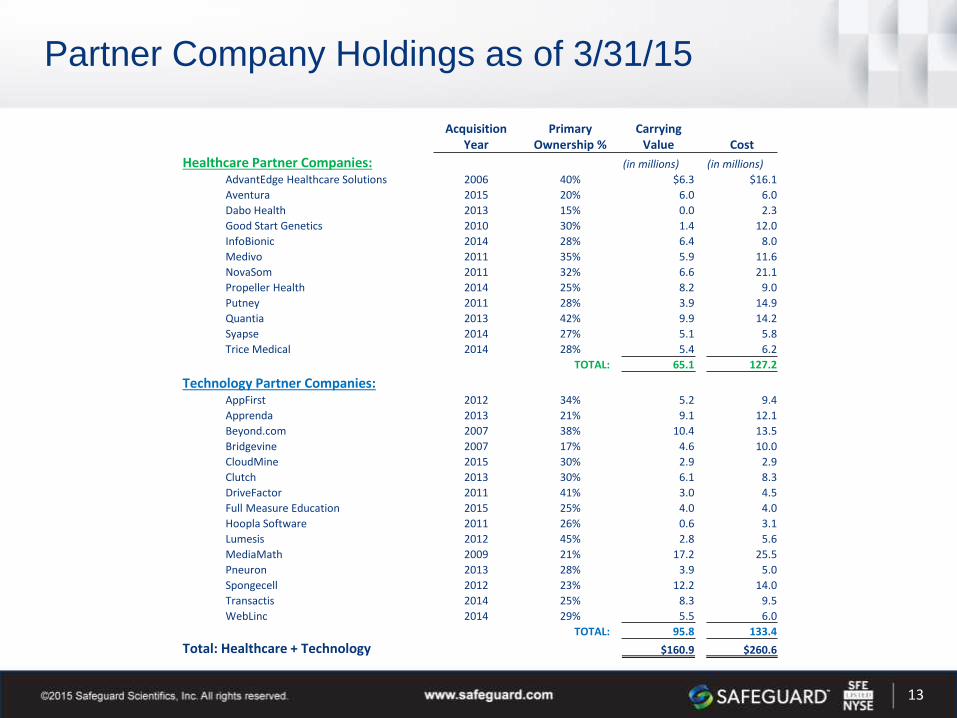
Acquisition Year
Primary Ownership %
Carrying Value Cost
Healthcare Partner Companies: (in millions) (in millions)
AdvantEdge Healthcare Solutions 2006 40% $6.3 $16.1
Aventura 2015 20% 6.0 6.0
Dabo Health 2013 15% 0.0 2.3
Good Start Genetics 2010 30% 1.4 12.0
InfoBionic 2014 28% 6.4 8.0
Medivo 2011 35% 5.9 11.6
NovaSom 2011 32% 6.6 21.1
Propeller Health 2014 25% 8.2 9.0
Putney 2011 28% 3.9 14.9
Quantia 2013 42% 9.9 14.2
Syapse 2014 27% 5.1 5.8
Trice Medical 2014 28% 5.4 6.2
TOTAL: 65.1 127.2
Technology Partner Companies:AppFirst 2012 34% 5.2 9.4
Apprenda 2013 21% 9.1 12.1
Beyond.com 2007 38% 10.4 13.5
Bridgevine 2007 17% 4.6 10.0
CloudMine 2015 30% 2.9 2.9
Clutch 2013 30% 6.1 8.3
DriveFactor 2011 41% 3.0 4.5
Full Measure Education 2015 25% 4.0 4.0
Hoopla Software 2011 26% 0.6 3.1
Lumesis 2012 45% 2.8 5.6
MediaMath 2009 21% 17.2 25.5
Pneuron 2013 28% 3.9 5.0
Spongecell 2012 23% 12.2 14.0
Transactis 2014 25% 8.3 9.5
WebLinc 2014 29% 5.5 6.0
TOTAL: 95.8 133.4
Total: Healthcare + Technology $160.9 $260.6
13
Partner Company Holdings as of 3/31/15
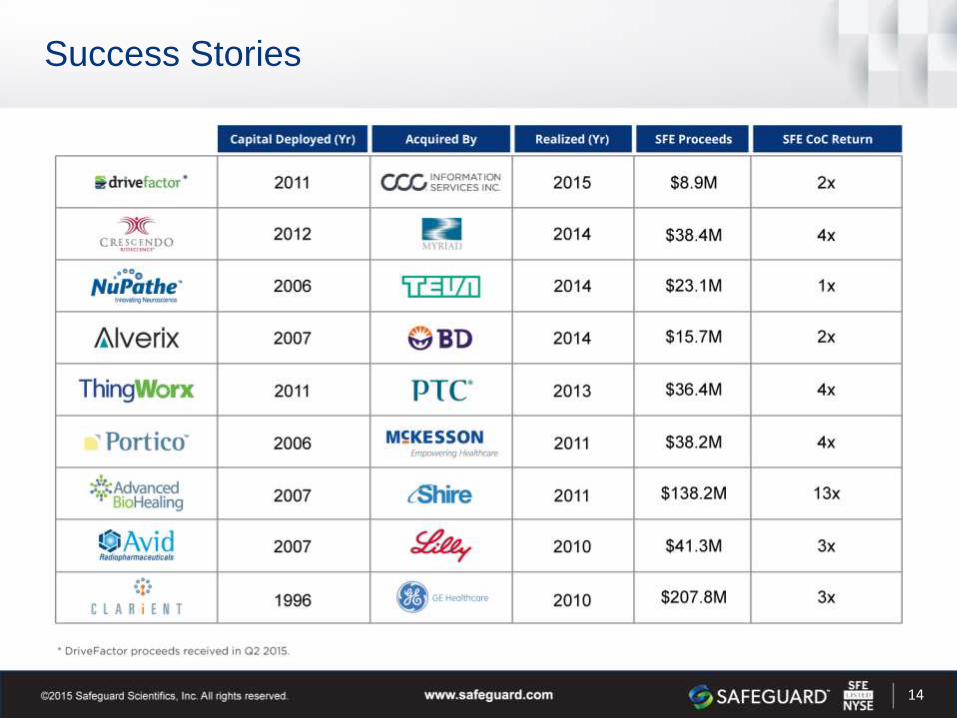
Success Stories
14
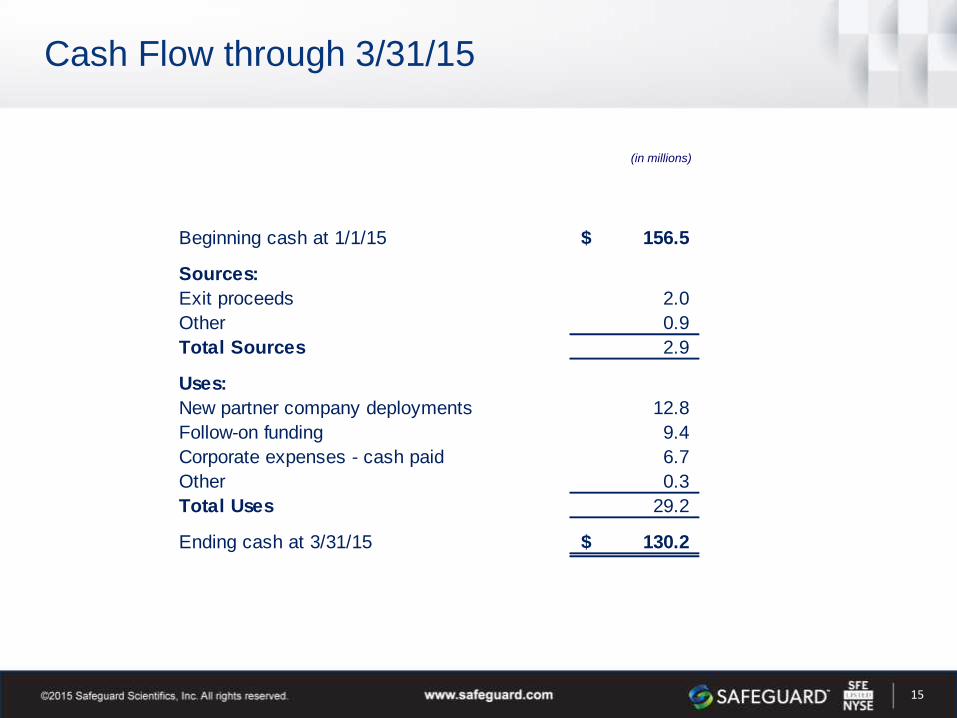
Cash Flow through 3/31/15
Beginning cash at 1/1/15 156.5$
Sources:
Exit proceeds 2.0
Other 0.9
Total Sources 2.9
Uses:
New partner company deployments 12.8
Follow-on funding 9.4
Corporate expenses - cash paid 6.7
Other 0.3
Total Uses 29.2
Ending cash at 3/31/15 130.2$
15
(in millions)
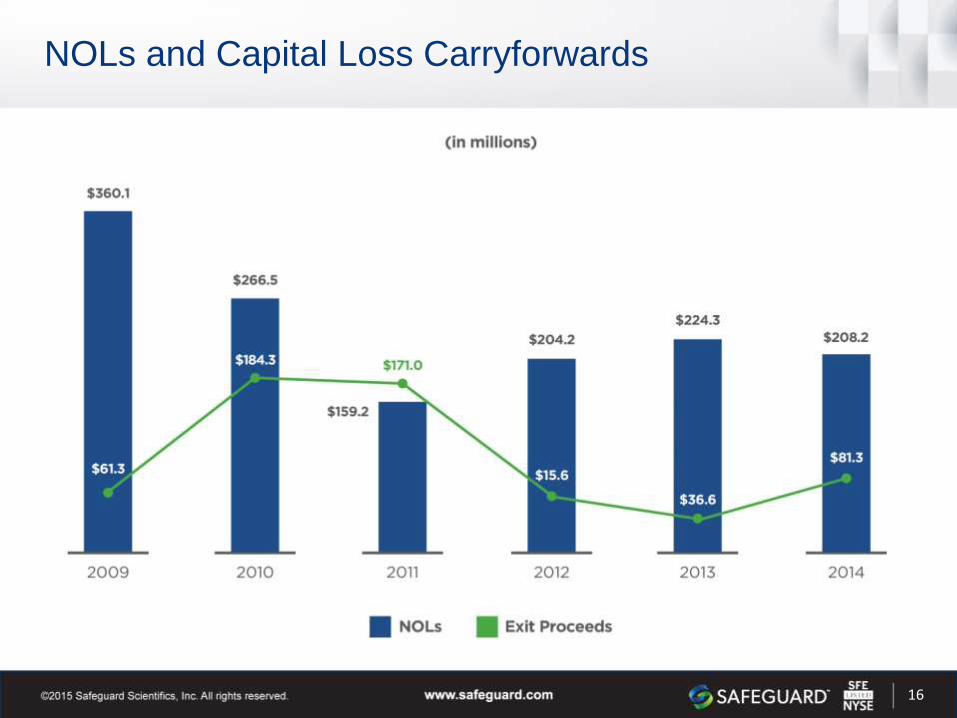
NOLs and Capital Loss Carryforwards
16
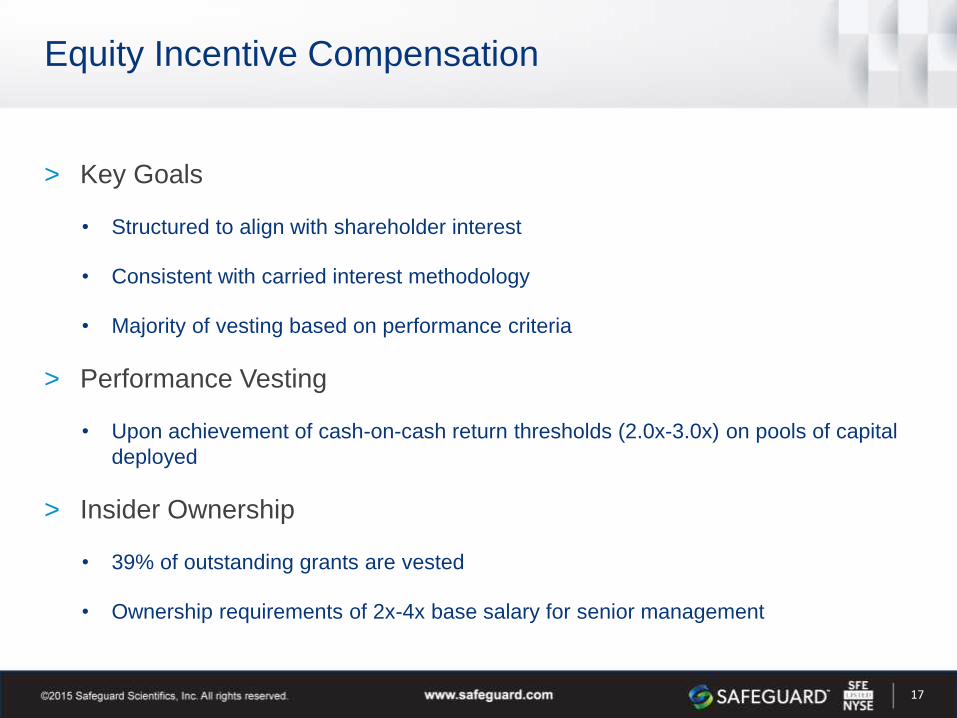
Equity Incentive Compensation
> Key Goals
• Structured to align with shareholder interest
• Consistent with carried interest methodology
• Majority of vesting based on performance criteria
> Performance Vesting
• Upon achievement of cash-on-cash return thresholds (2.0x-3.0x) on pools of capital
deployed
> Insider Ownership
• 39% of outstanding grants are vested
• Ownership requirements of 2x-4x base salary for senior management
17
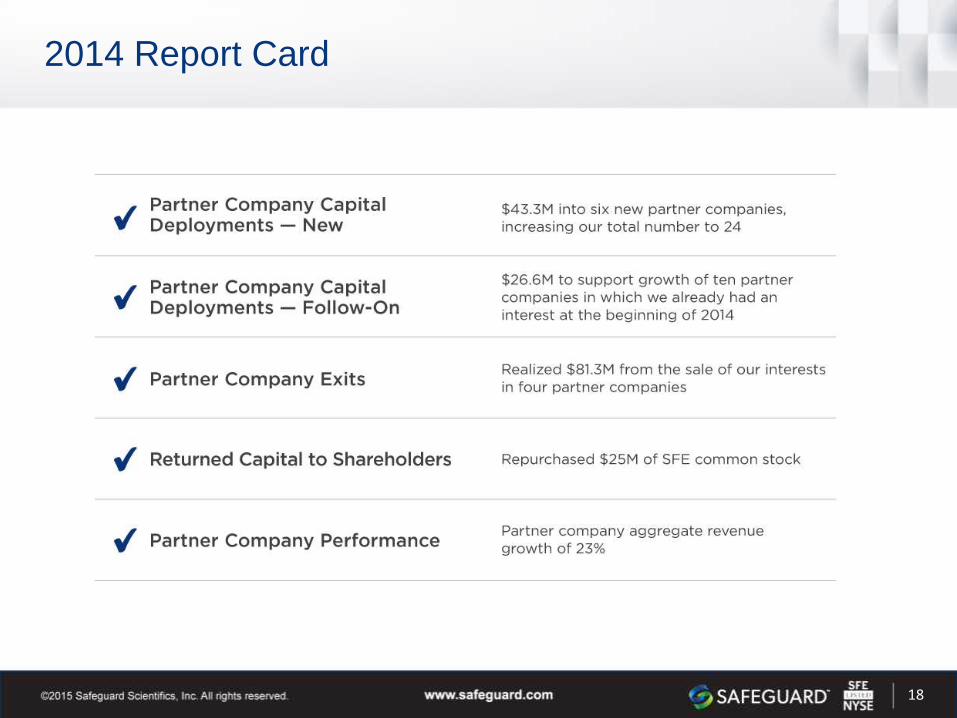
2014 Report Card
18
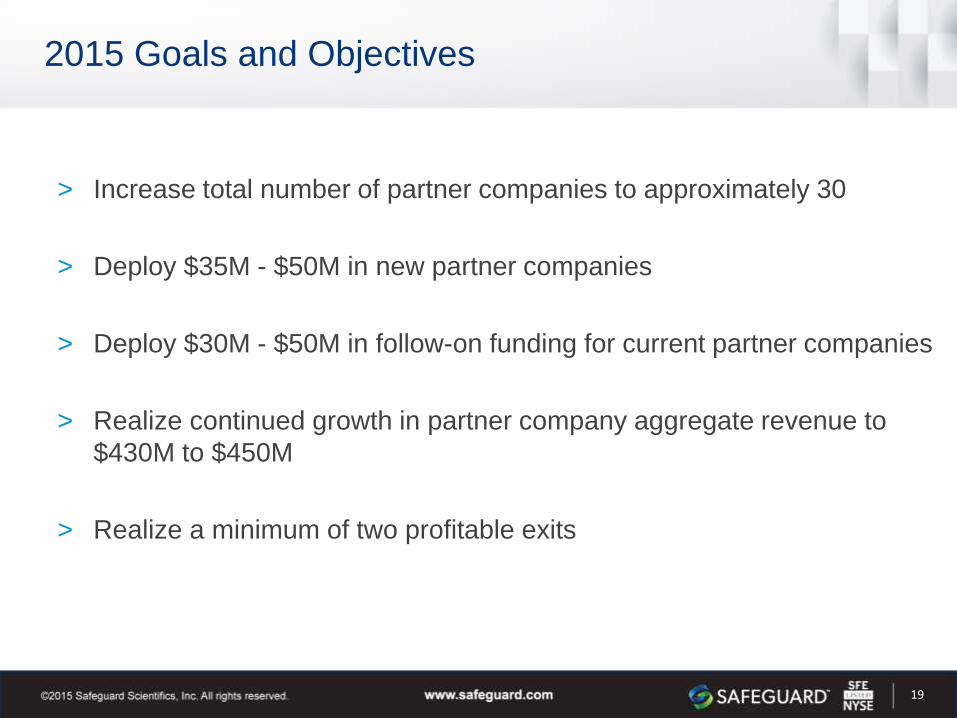
2015 Goals and Objectives
> Increase total number of partner companies to approximately 30
> Deploy $35M - $50M in new partner companies
> Deploy $30M - $50M in follow-on funding for current partner companies
> Realize continued growth in partner company aggregate revenue to
$430M to $450M
> Realize a minimum of two profitable exits
19
John E. Shave IIISENIOR VICE PRESIDENT,INVESTOR RELATIONS &CORPORATE COMMUNICATIONS
P 610.975.4952E [email protected]
Request a Meeting: www.safeguard.com/RequestAMeeting
20
Forward Looking Statements
Statements contained in this presentation that are not historical facts are forward looking statements which involve certain risks and uncertainties including, but not limited to, risks associated with our ability to make good decisions about the deployment of capital, the fact that our partner companies may vary from period to period, our substantial capital requirements and absence of liquidity from our partner company holdings, fluctuations in the market prices of our publicly traded partner company holdings, competition, our inability to obtain maximum value for our partner company holdings, our ability to attract and retain qualified employees, market valuations in sectors in which our partner companies operate may decline, our inability to control our partner companies, our need to manage our assets to avoid registration under the Investment Company Act of 1940, and risks associated with our partner companies, and other uncertainties as described in our filings with the Securities and Exchange Commission, including our Annual Report on Form 10-K. Many of these factors are beyond our ability to predict or control. As a result of these and other factors, our past financial performance should not be relied on as an indication of future performance.
Safeguard does not assume any obligation to update any forward looking statements or other information contained in this presentation. You should not rely on these statements as indicative of the partner company’s future results, and all forward looking statements are qualified by this cautionary statement. All information is as of the date indicated or as of the date of this presentation, and none of the partner companies assumes any obligation to update or revise the information presented.
21