Embed Size (px)
Citation preview
Telecom Revenue assurance 101
Ikwe Gideon [email protected]
www.datahouseconsulting.com
1 © Datahouse Consulting
Agenda
1 2 3 4
What is revenue assurance? How to assure revenue? Sources , Type and Statistics of Revenue Leakages Revenue Assurance KPI and Tools
Who will assure revenue? 5
Key factor to consider 6
2 © Datahouse Consulting
Why is Revenue Assurance Required?
• Effects of worsening market conditions
• Effects of investor pressure:
• Downgrading of debts
• Difficulty in raising capital for new projects
• Impact of billing errors on customers and trading partners
• The Nature of service render( Service is generated immediately customer place an order for call,
implies quality control must be embedded into all element of the process )
• The use of multi-systems from various vendor
• Importance of usage data integrity
• Complexity of the Billing process
• Increasing Government regulation
• Stiff Competitive Environment
3 © Datahouse Consulting
What is Revenue Assurance?
• The process of measuring achieved revenue against forecasts, and accounting for any discrepancies
• The Art of finding what you didn’t know was missing
• The verification of the amount being billed
• Protecting and optimising revenues and profits
• Everything involved in ensuring that the maximum amount of revenue comes into the organisation, and
that all leakage in the system is rectified
• Any activity an organization does to ensure that processes, practices and procedures result in revenue that
is billed completely, accurately and in a timely manner
• Revenue Assurance as a discipline within a telecommunications operator is necessary because of one
apparently basic Laws of the universe.
• Which is a corollary to Murphy’s Law, states that: If something can go wrong, it will, and at the most
inconvenient moment. This is why tomato soup always splashes onto one’s only clean shirt just before an
important meeting, or the car breaks down on a lonely road when the cell phone’s battery has just gone
flat.
• Revenue Assurance cannot revoke these Natural Laws, but it can and does mitigate their malign effects.
4 © Datahouse Consulting
Product
Partner management
Customer
management
Order Management & Provisioning
Network
Management & usage
Finance &
Accounting
Receivables management
Rating &
Billing
& Offer Management
Revenue Assurance
• Correct Rates • Profitable product offerings • Appropriate revenue assurance
Controls in place for new offer
• • • •
Credit assessment Timely activation Provisioning Link to tariff plan, Services and discounts • xDR leakage • Inaccurate xDRs • High usage
• Reference data management • Unbillable xDRs • Billing cycle calculation& generation of bill
existence of postings • Revenue recognition
• • • •
Payment follow-up Dunning Bad debt management Dispute resolution
• •
• •
Carecred its Churn management • Completeness &
• • • •
Dealer commissions Interconnection setup Routing Contentprovider Contract compliance
Variation Orders
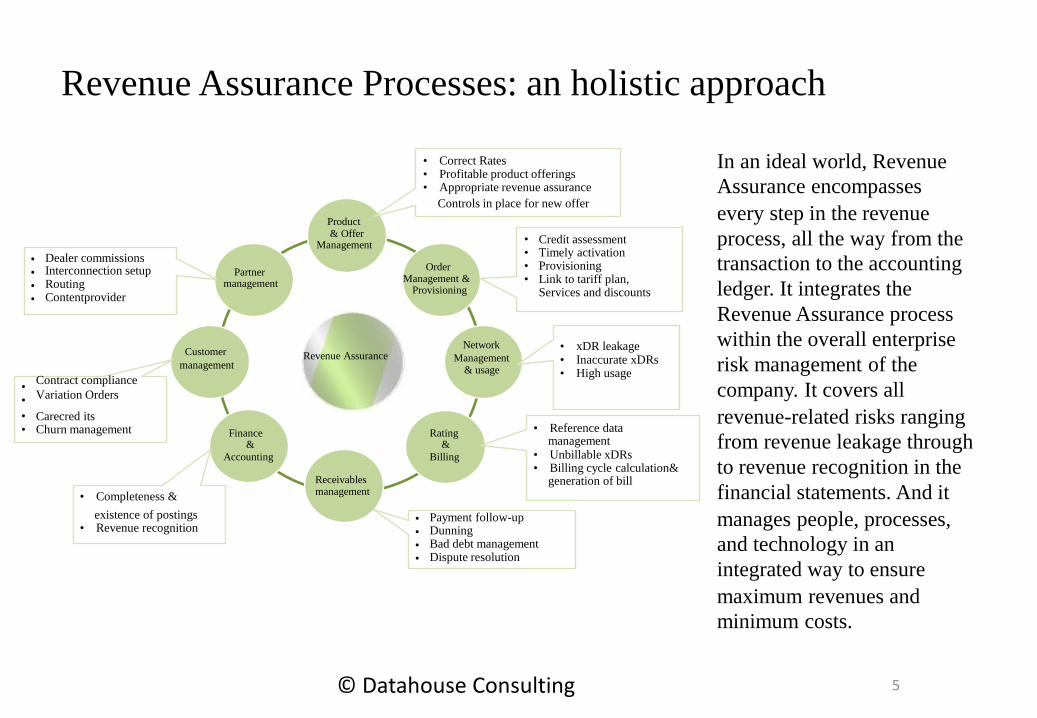
In an ideal world, Revenue
Assurance encompasses
every step in the revenue
process, all the way from the
transaction to the accounting
ledger. It integrates the
Revenue Assurance process
within the overall enterprise
risk management of the
company. It covers all
revenue-related risks ranging
from revenue leakage through
to revenue recognition in the
financial statements. And it
manages people, processes,
and technology in an
integrated way to ensure
maximum revenues and
minimum costs.
Revenue Assurance Processes: an holistic approach
5 © Datahouse Consulting
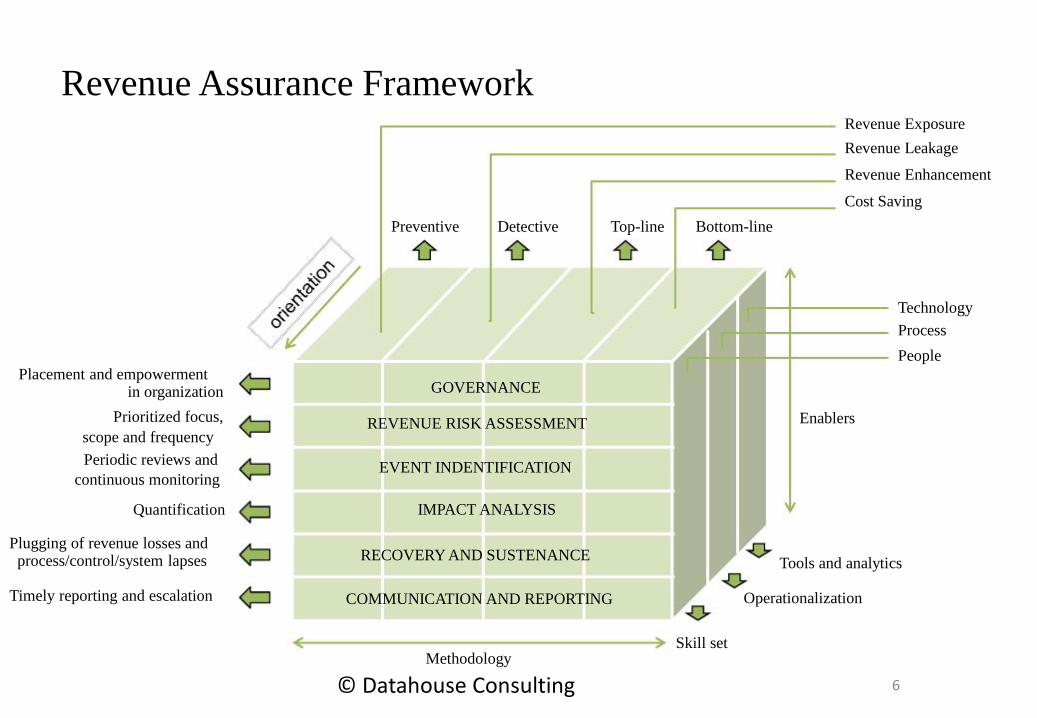
Enablers
Placement and empowerment in organization
Prioritized focus,
scope and frequency
Periodic reviews and
continuous monitoring Quantification
Plugging of revenue losses and process/control/system lapses Timely reporting and escalation
Preventive Detective Top-line Bottom-line
Skill set
Tools and analytics Operationalization
GOVERNANCE REVENUE RISK ASSESSMENT EVENT INDENTIFICATION IMPACT ANALYSIS
RECOVERY AND SUSTENANCE COMMUNICATION AND REPORTING Methodology
Revenue Assurance Framework Revenue Exposure
Revenue Leakage
Revenue Enhancement
Cost Saving
Technology
Process
People
6 © Datahouse Consulting
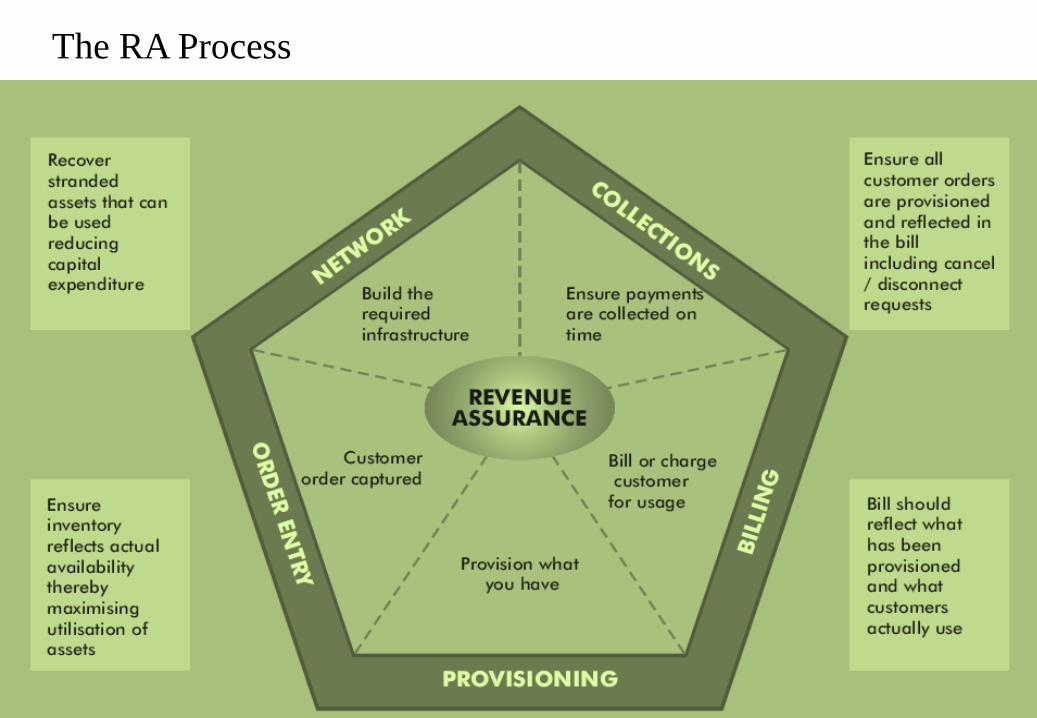
The RA Process
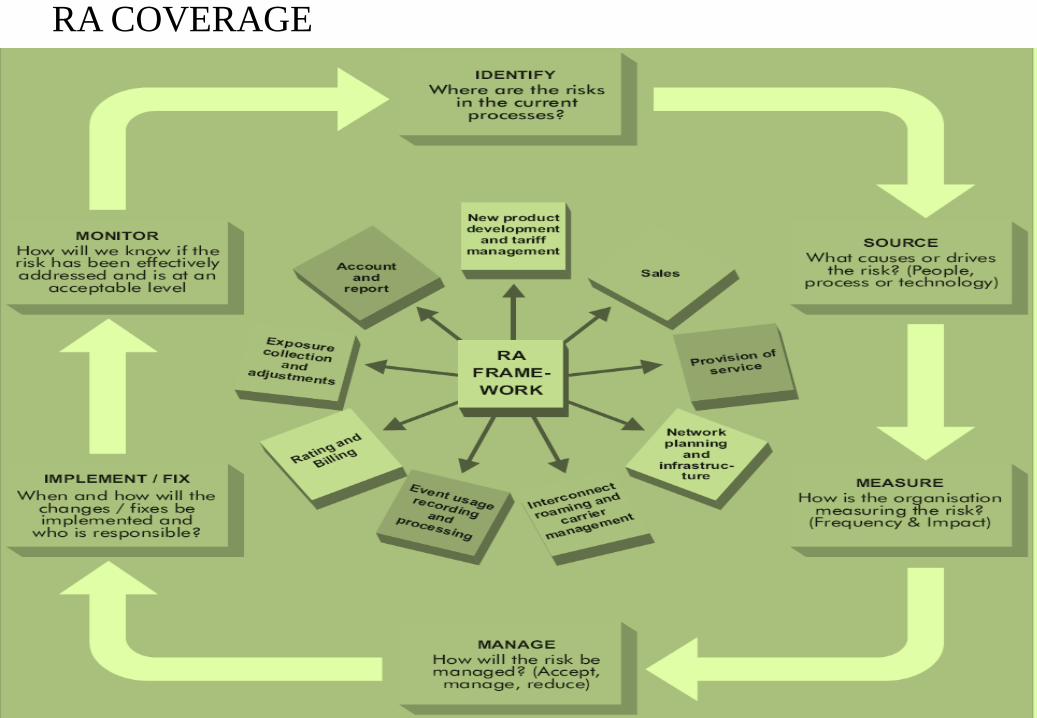
RA COVERAGE
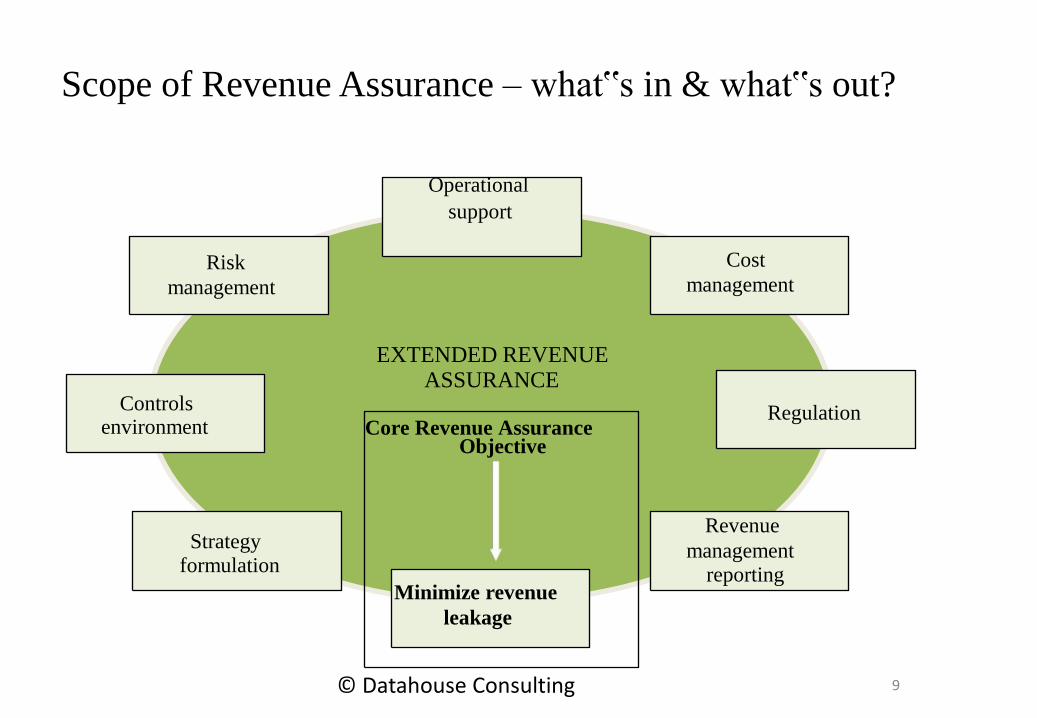
EXTENDED REVENUE ASSURANCE
Risk
management
Cost
management
Regulation Revenue
management reporting
Controls environment Strategy formulation
Core Revenue Assurance Objective
Minimize revenue
leakage
Scope of Revenue Assurance – what‟s in & what‟s out? Operational
support
9 © Datahouse Consulting
Revenue Assurance Core Activities
• Subscription Assurance
• Usage Assurance
• Rating Assurance
• Mediation Assurance
• Billing-Postpaid Assurance
• Prepaid Assurance
• Interconnect Assurance
• Roaming Assurance
• Business insight and Intelligence
• Thirty party service Cost Assurance
10 © Datahouse Consulting
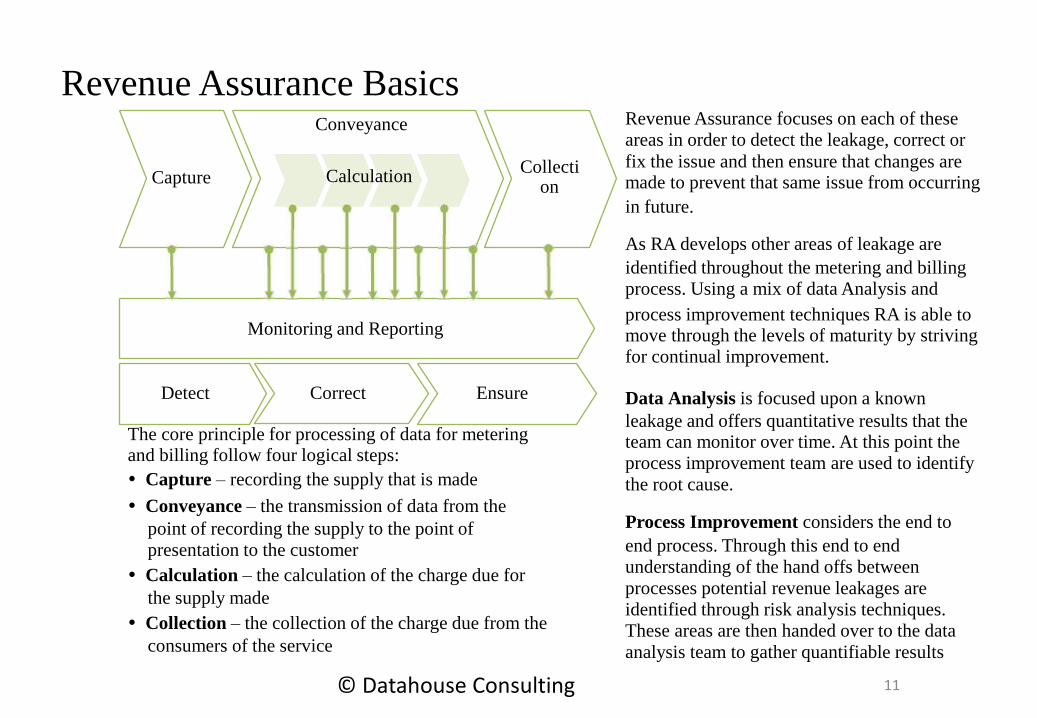
Revenue Assurance Basics
The core principle for processing of data for metering and billing follow four logical steps:
Capture – recording the supply that is made
Conveyance – the transmission of data from the
point of recording the supply to the point of
presentation to the customer
Calculation – the calculation of the charge due for
the supply made
Collection – the collection of the charge due from the
consumers of the service
Revenue Assurance focuses on each of these
areas in order to detect the leakage, correct or
fix the issue and then ensure that changes are made to prevent that same issue from occurring
in future. As RA develops other areas of leakage are
identified throughout the metering and billing process. Using a mix of data Analysis and
process improvement techniques RA is able to move through the levels of maturity by striving
for continual improvement.
Data Analysis is focused upon a known
leakage and offers quantitative results that the team can monitor over time. At this point the
process improvement team are used to identify
the root cause. Process Improvement considers the end to
end process. Through this end to end
understanding of the hand offs between
processes potential revenue leakages are
identified through risk analysis techniques.
These areas are then handed over to the data
analysis team to gather quantifiable results
Capture
Conveyance
Collecti on
Monitoring and Reporting
Detect Correct Ensure
Calculation
11 © Datahouse Consulting
Agenda
1 2 3 4
What is revenue assurance? How to assure revenue? Sources , Type and Statistics of Revenue Leakages Revenue Assurance KPI and Tools
Who will assure revenue? 5
Key factor to consider 6
12 © Datahouse Consulting
How to Assure Revenue • Identify key attributes of every service that is on operation that can affect revenue. • Identify the affected data sources associated with the key attributes (such as switches,
mediation components, roaming clearinghouses and interconnect operators). • Map the data sources to the information model. • Identify the data flows across the data sources, identify the location of the data sources
and to where the data is being send from each of these data sources. • Define controls to ensure the integrity of data related to revenue, across all data flows. • Define thresholds for loss at each point. This should be derived from the target threshold
on an end to end reconciliation, thresholds such as rejection tolerance and time to receive
CDRs. • Devise a mechanism to cross check with the first point to the last point in the data flow
(switch to billing system).
13 © Datahouse Consulting
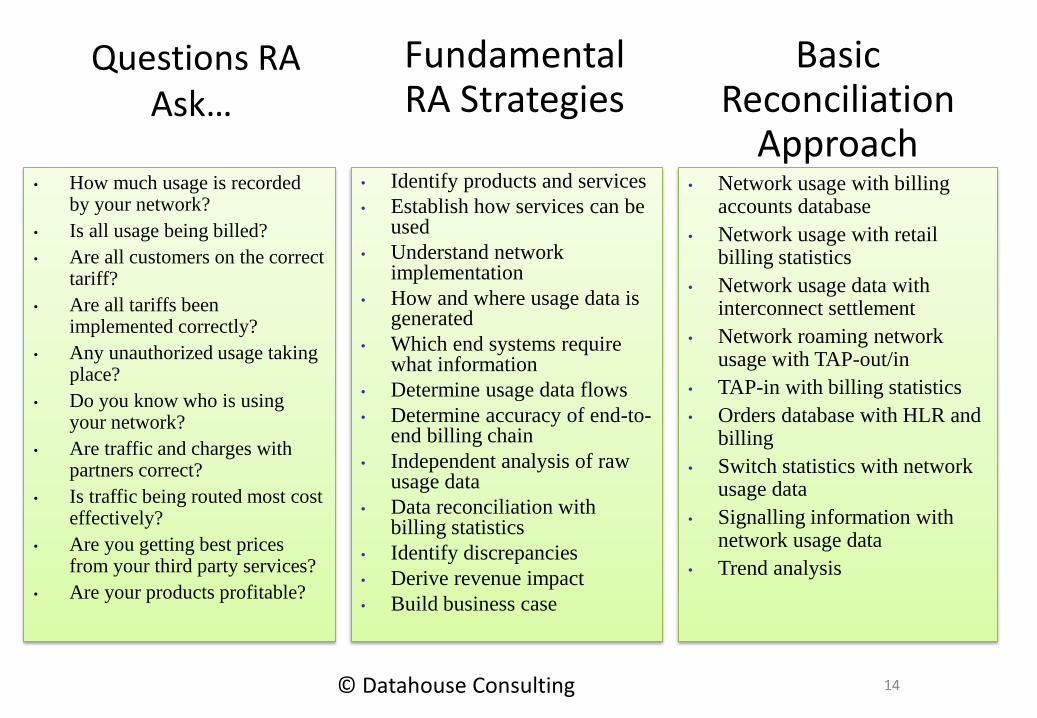
Questions RA Ask…
• How much usage is recorded by your network?
• Is all usage being billed?
• Are all customers on the correct tariff?
• Are all tariffs been implemented correctly?
• Any unauthorized usage taking place?
• Do you know who is using your network?
• Are traffic and charges with partners correct?
• Is traffic being routed most cost effectively?
• Are you getting best prices from your third party services?
• Are your products profitable?
• Identify products and services
• Establish how services can be used
• Understand network implementation
• How and where usage data is generated
• Which end systems require what information
• Determine usage data flows
• Determine accuracy of end-to-end billing chain
• Independent analysis of raw usage data
• Data reconciliation with billing statistics
• Identify discrepancies
• Derive revenue impact
• Build business case
Fundamental RA Strategies
• Network usage with billing accounts database
• Network usage with retail billing statistics
• Network usage data with interconnect settlement
• Network roaming network usage with TAP-out/in
• TAP-in with billing statistics
• Orders database with HLR and billing
• Switch statistics with network usage data
• Signalling information with network usage data
• Trend analysis
Basic Reconciliation
Approach
14 © Datahouse Consulting
Agenda
1 2 3 4
What is revenue assurance? How to assure revenue? Sources , Type and Statistics of Revenue Leakages Revenue Assurance KPI and Tools
Who will assure revenue? 5
Key factor to consider 6
15 © Datahouse Consulting
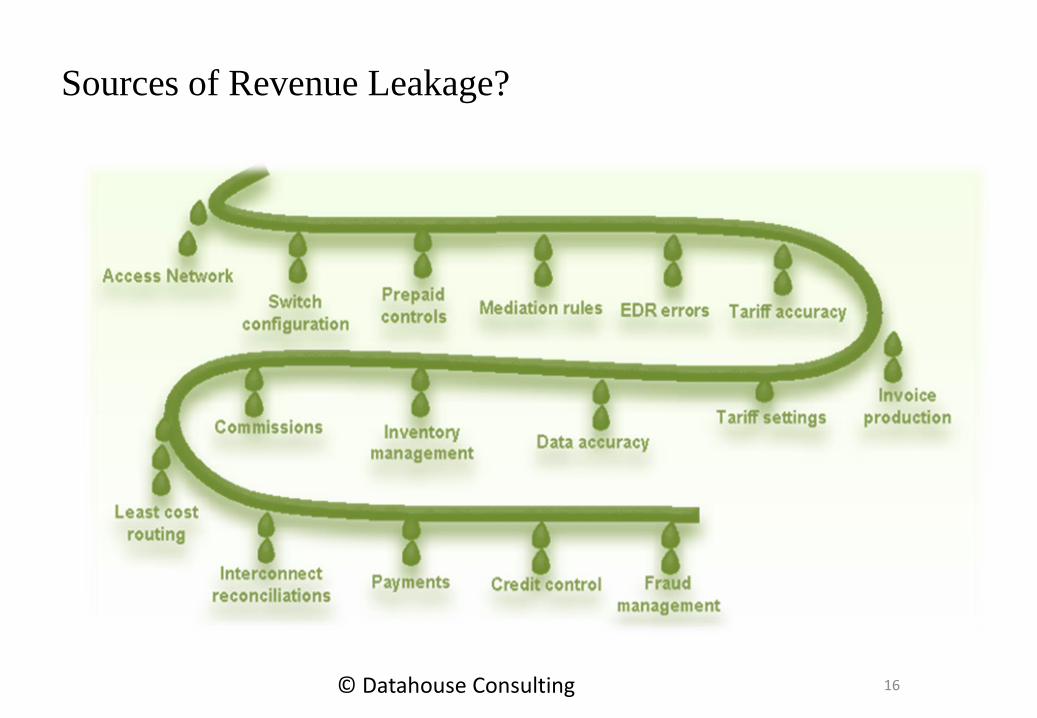
Sources of Revenue Leakage?
16 © Datahouse Consulting
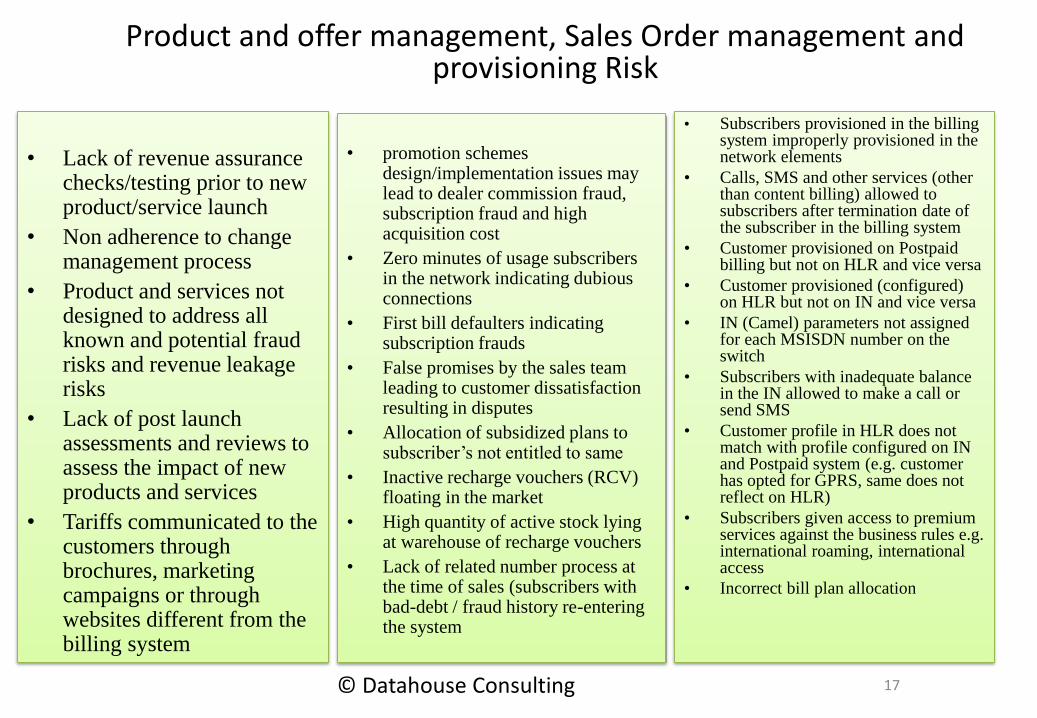
Product and offer management, Sales Order management and provisioning Risk
• Lack of revenue assurance checks/testing prior to new product/service launch
• Non adherence to change management process
• Product and services not designed to address all known and potential fraud risks and revenue leakage risks
• Lack of post launch assessments and reviews to assess the impact of new products and services
• Tariffs communicated to the customers through brochures, marketing campaigns or through websites different from the billing system
• promotion schemes design/implementation issues may lead to dealer commission fraud, subscription fraud and high acquisition cost
• Zero minutes of usage subscribers in the network indicating dubious connections
• First bill defaulters indicating subscription frauds
• False promises by the sales team leading to customer dissatisfaction resulting in disputes
• Allocation of subsidized plans to subscriber’s not entitled to same
• Inactive recharge vouchers (RCV) floating in the market
• High quantity of active stock lying at warehouse of recharge vouchers
• Lack of related number process at the time of sales (subscribers with bad-debt / fraud history re-entering the system
• Subscribers provisioned in the billing system improperly provisioned in the network elements
• Calls, SMS and other services (other than content billing) allowed to subscribers after termination date of the subscriber in the billing system
• Customer provisioned on Postpaid billing but not on HLR and vice versa
• Customer provisioned (configured) on HLR but not on IN and vice versa
• IN (Camel) parameters not assigned for each MSISDN number on the switch
• Subscribers with inadequate balance in the IN allowed to make a call or send SMS
• Customer profile in HLR does not match with profile configured on IN and Postpaid system (e.g. customer has opted for GPRS, same does not reflect on HLR)
• Subscribers given access to premium services against the business rules e.g. international roaming, international access
• Incorrect bill plan allocation
17 © Datahouse Consulting
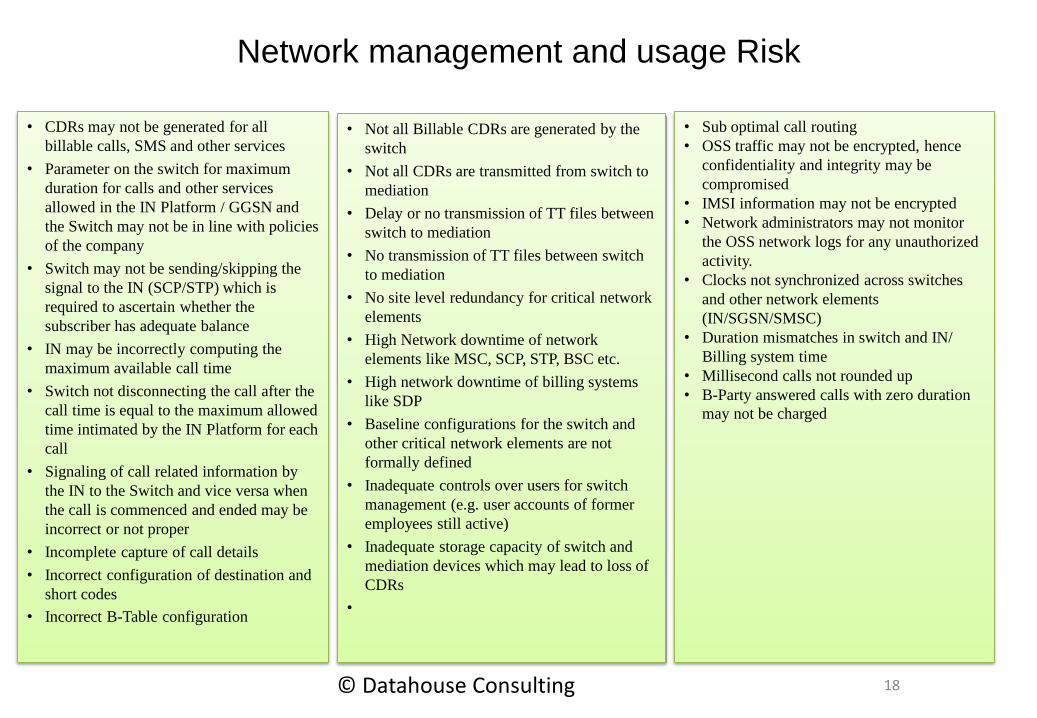
Network management and usage Risk
• CDRs may not be generated for all
billable calls, SMS and other services
• Parameter on the switch for maximum
duration for calls and other services
allowed in the IN Platform / GGSN and
the Switch may not be in line with policies
of the company
• Switch may not be sending/skipping the
signal to the IN (SCP/STP) which is
required to ascertain whether the
subscriber has adequate balance
• IN may be incorrectly computing the
maximum available call time
• Switch not disconnecting the call after the
call time is equal to the maximum allowed
time intimated by the IN Platform for each
call
• Signaling of call related information by
the IN to the Switch and vice versa when
the call is commenced and ended may be
incorrect or not proper
• Incomplete capture of call details
• Incorrect configuration of destination and
short codes
• Incorrect B-Table configuration
• Not all Billable CDRs are generated by the
switch
• Not all CDRs are transmitted from switch to
mediation
• Delay or no transmission of TT files between
switch to mediation
• No transmission of TT files between switch
to mediation
• No site level redundancy for critical network
elements
• High Network downtime of network
elements like MSC, SCP, STP, BSC etc.
• High network downtime of billing systems
like SDP
• Baseline configurations for the switch and
other critical network elements are not
formally defined
• Inadequate controls over users for switch
management (e.g. user accounts of former
employees still active)
• Inadequate storage capacity of switch and
mediation devices which may lead to loss of
CDRs
•
• Sub optimal call routing
• OSS traffic may not be encrypted, hence
confidentiality and integrity may be
compromised
• IMSI information may not be encrypted
• Network administrators may not monitor
the OSS network logs for any unauthorized
activity.
• Clocks not synchronized across switches
and other network elements
(IN/SGSN/SMSC)
• Duration mismatches in switch and IN/
Billing system time
• Millisecond calls not rounded up
• B-Party answered calls with zero duration
may not be charged
18 © Datahouse Consulting
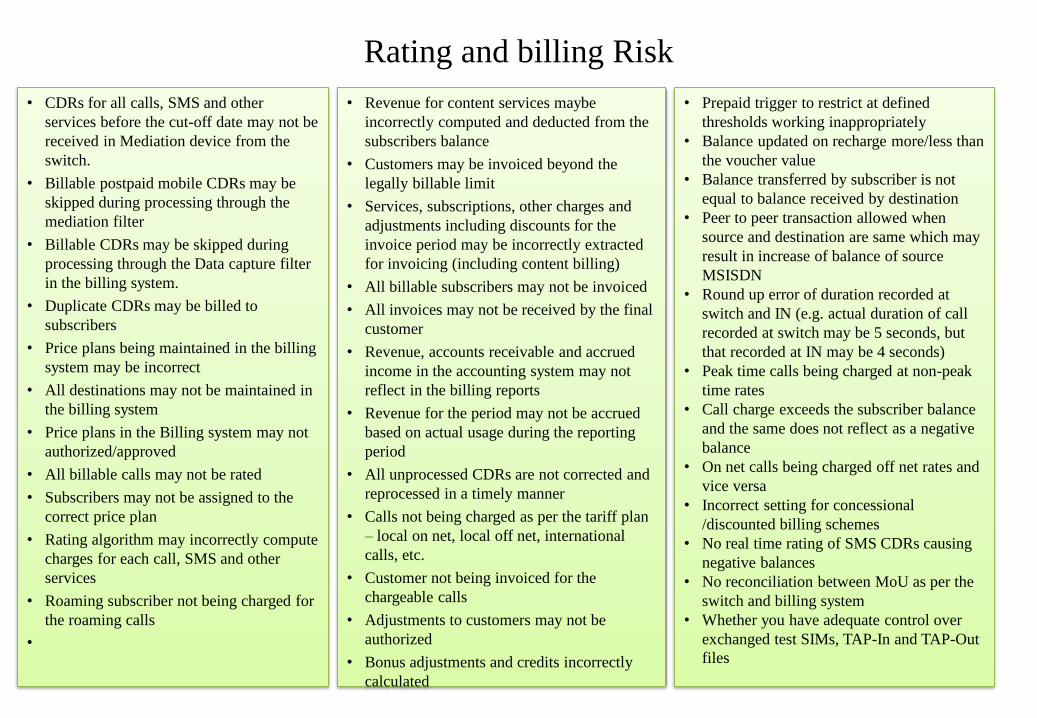
Rating and billing Risk
• CDRs for all calls, SMS and other
services before the cut-off date may not be
received in Mediation device from the
switch.
• Billable postpaid mobile CDRs may be
skipped during processing through the
mediation filter
• Billable CDRs may be skipped during
processing through the Data capture filter
in the billing system.
• Duplicate CDRs may be billed to
subscribers
• Price plans being maintained in the billing
system may be incorrect
• All destinations may not be maintained in
the billing system
• Price plans in the Billing system may not
authorized/approved
• All billable calls may not be rated
• Subscribers may not be assigned to the
correct price plan
• Rating algorithm may incorrectly compute
charges for each call, SMS and other
services
• Roaming subscriber not being charged for
the roaming calls
•
• Revenue for content services maybe
incorrectly computed and deducted from the
subscribers balance
• Customers may be invoiced beyond the
legally billable limit
• Services, subscriptions, other charges and
adjustments including discounts for the
invoice period may be incorrectly extracted
for invoicing (including content billing)
• All billable subscribers may not be invoiced
• All invoices may not be received by the final
customer
• Revenue, accounts receivable and accrued
income in the accounting system may not
reflect in the billing reports
• Revenue for the period may not be accrued
based on actual usage during the reporting
period
• All unprocessed CDRs are not corrected and
reprocessed in a timely manner
• Calls not being charged as per the tariff plan
– local on net, local off net, international
calls, etc.
• Customer not being invoiced for the
chargeable calls
• Adjustments to customers may not be
authorized
• Bonus adjustments and credits incorrectly
calculated
• Prepaid trigger to restrict at defined
thresholds working inappropriately
• Balance updated on recharge more/less than
the voucher value
• Balance transferred by subscriber is not
equal to balance received by destination
• Peer to peer transaction allowed when
source and destination are same which may
result in increase of balance of source
MSISDN
• Round up error of duration recorded at
switch and IN (e.g. actual duration of call
recorded at switch may be 5 seconds, but
that recorded at IN may be 4 seconds)
• Peak time calls being charged at non-peak
time rates
• Call charge exceeds the subscriber balance
and the same does not reflect as a negative
balance
• On net calls being charged off net rates and
vice versa
• Incorrect setting for concessional
/discounted billing schemes
• No real time rating of SMS CDRs causing
negative balances
• No reconciliation between MoU as per the
switch and billing system
• Whether you have adequate control over
exchanged test SIMs, TAP-In and TAP-Out
files
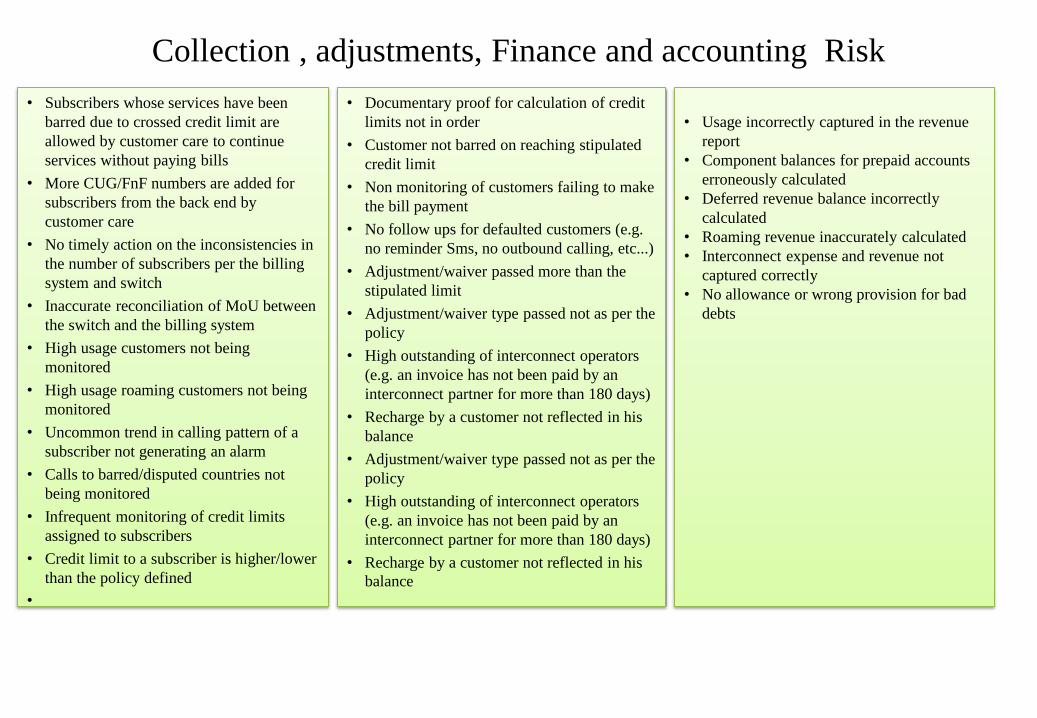
Collection , adjustments, Finance and accounting Risk
• Subscribers whose services have been
barred due to crossed credit limit are
allowed by customer care to continue
services without paying bills
• More CUG/FnF numbers are added for
subscribers from the back end by
customer care
• No timely action on the inconsistencies in
the number of subscribers per the billing
system and switch
• Inaccurate reconciliation of MoU between
the switch and the billing system
• High usage customers not being
monitored
• High usage roaming customers not being
monitored
• Uncommon trend in calling pattern of a
subscriber not generating an alarm
• Calls to barred/disputed countries not
being monitored
• Infrequent monitoring of credit limits
assigned to subscribers
• Credit limit to a subscriber is higher/lower
than the policy defined
•
• Documentary proof for calculation of credit
limits not in order
• Customer not barred on reaching stipulated
credit limit
• Non monitoring of customers failing to make
the bill payment
• No follow ups for defaulted customers (e.g.
no reminder Sms, no outbound calling, etc...)
• Adjustment/waiver passed more than the
stipulated limit
• Adjustment/waiver type passed not as per the
policy
• High outstanding of interconnect operators
(e.g. an invoice has not been paid by an
interconnect partner for more than 180 days)
• Recharge by a customer not reflected in his
balance
• Adjustment/waiver type passed not as per the
policy
• High outstanding of interconnect operators
(e.g. an invoice has not been paid by an
interconnect partner for more than 180 days)
• Recharge by a customer not reflected in his
balance
• Usage incorrectly captured in the revenue
report
• Component balances for prepaid accounts
erroneously calculated
• Deferred revenue balance incorrectly
calculated
• Roaming revenue inaccurately calculated
• Interconnect expense and revenue not
captured correctly
• No allowance or wrong provision for bad
debts
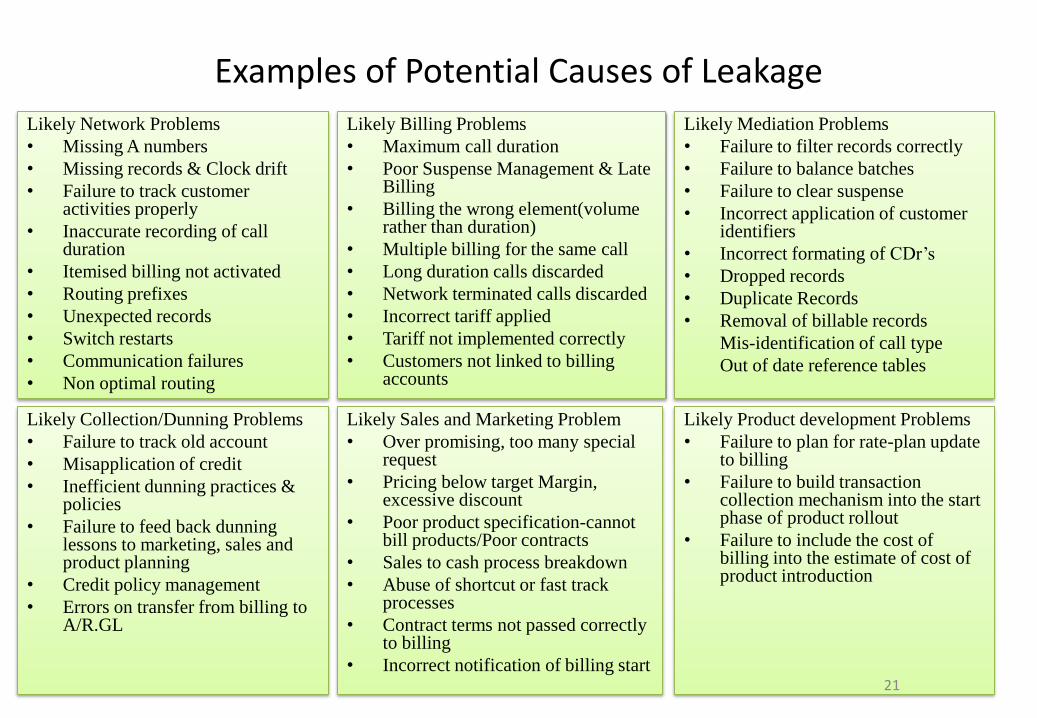
Examples of Potential Causes of Leakage
Likely Network Problems
• Missing A numbers
• Missing records & Clock drift
• Failure to track customer activities properly
• Inaccurate recording of call duration
• Itemised billing not activated
• Routing prefixes
• Unexpected records
• Switch restarts
• Communication failures
• Non optimal routing
Likely Billing Problems
• Maximum call duration
• Poor Suspense Management & Late Billing
• Billing the wrong element(volume rather than duration)
• Multiple billing for the same call
• Long duration calls discarded
• Network terminated calls discarded
• Incorrect tariff applied
• Tariff not implemented correctly
• Customers not linked to billing accounts
Likely Mediation Problems
• Failure to filter records correctly
• Failure to balance batches
• Failure to clear suspense
• Incorrect application of customer identifiers
• Incorrect formating of CDr’s
• Dropped records
• Duplicate Records
• Removal of billable records
Mis-identification of call type
Out of date reference tables
Likely Collection/Dunning Problems
• Failure to track old account
• Misapplication of credit
• Inefficient dunning practices & policies
• Failure to feed back dunning lessons to marketing, sales and product planning
• Credit policy management
• Errors on transfer from billing to A/R.GL
Likely Sales and Marketing Problem
• Over promising, too many special request
• Pricing below target Margin, excessive discount
• Poor product specification-cannot bill products/Poor contracts
• Sales to cash process breakdown
• Abuse of shortcut or fast track processes
• Contract terms not passed correctly to billing
• Incorrect notification of billing start
Likely Product development Problems
• Failure to plan for rate-plan update to billing
• Failure to build transaction collection mechanism into the start phase of product rollout
• Failure to include the cost of billing into the estimate of cost of product introduction
21
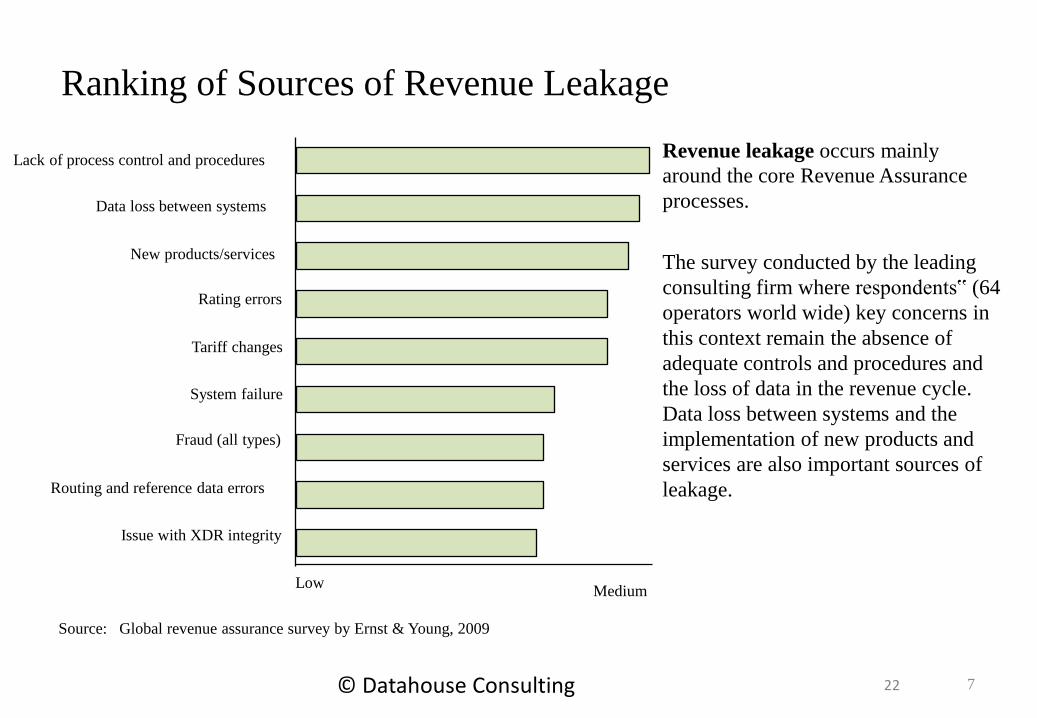
Ranking of Sources of Revenue Leakage
7
Revenue leakage occurs mainly
around the core Revenue Assurance
processes. The survey conducted by the leading
consulting firm where respondents‟ (64
operators world wide) key concerns in
this context remain the absence of
adequate controls and procedures and
the loss of data in the revenue cycle.
Data loss between systems and the
implementation of new products and
services are also important sources of
leakage.
Medium
Lack of process control and procedures Data loss between systems New products/services Rating errors Tariff changes System failure Fraud (all types) Routing and reference data errors Issue with XDR integrity Low Source: Global revenue assurance survey by Ernst & Young, 2009
22 © Datahouse Consulting
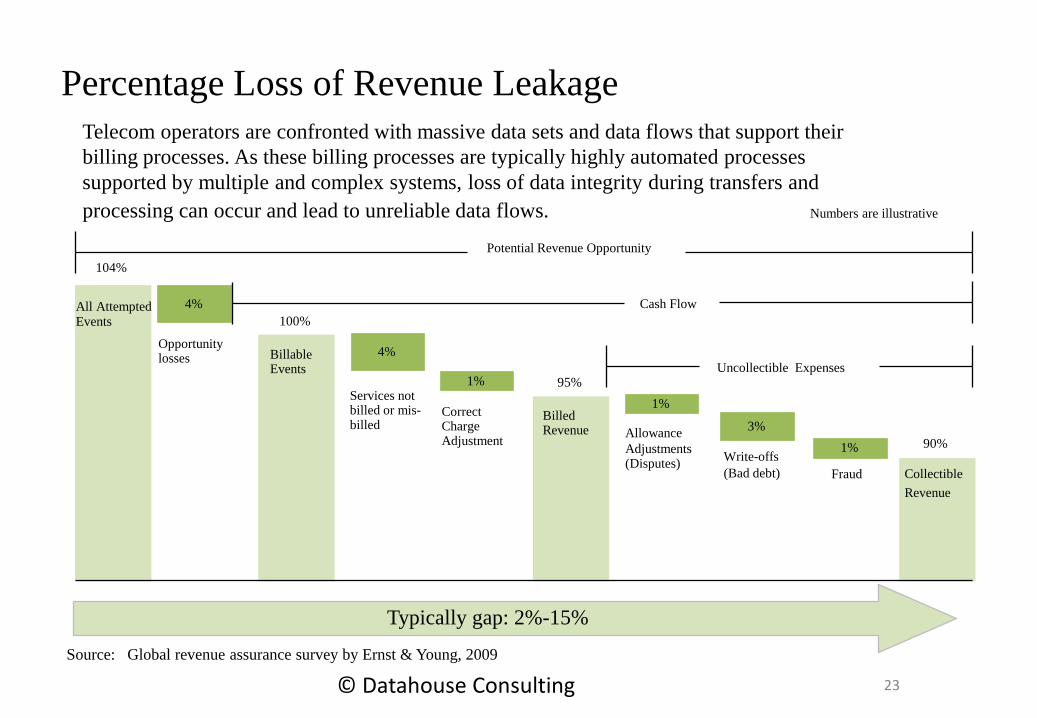
Percentage Loss of Revenue Leakage Telecom operators are confronted with massive data sets and data flows that support their
billing processes. As these billing processes are typically highly automated processes
supported by multiple and complex systems, loss of data integrity during transfers and
100%
95%
Opportunity losses Billable
Events
Billed Revenue
90% Collectible
Services not billed or mis- billed
Correct Charge Adjustment
4%
4%
1%
1% Allowance
Adjustments (Disputes)
3% Write-offs
(Bad debt)
1% Fraud
Uncollectible Expenses
Cash Flow
processing can occur and lead to unreliable data flows. Potential Revenue Opportunity
104%
All Attempted Events
Numbers are illustrative
Revenue Typically gap: 2%-15% Source: Global revenue assurance survey by Ernst & Young, 2009
23 © Datahouse Consulting
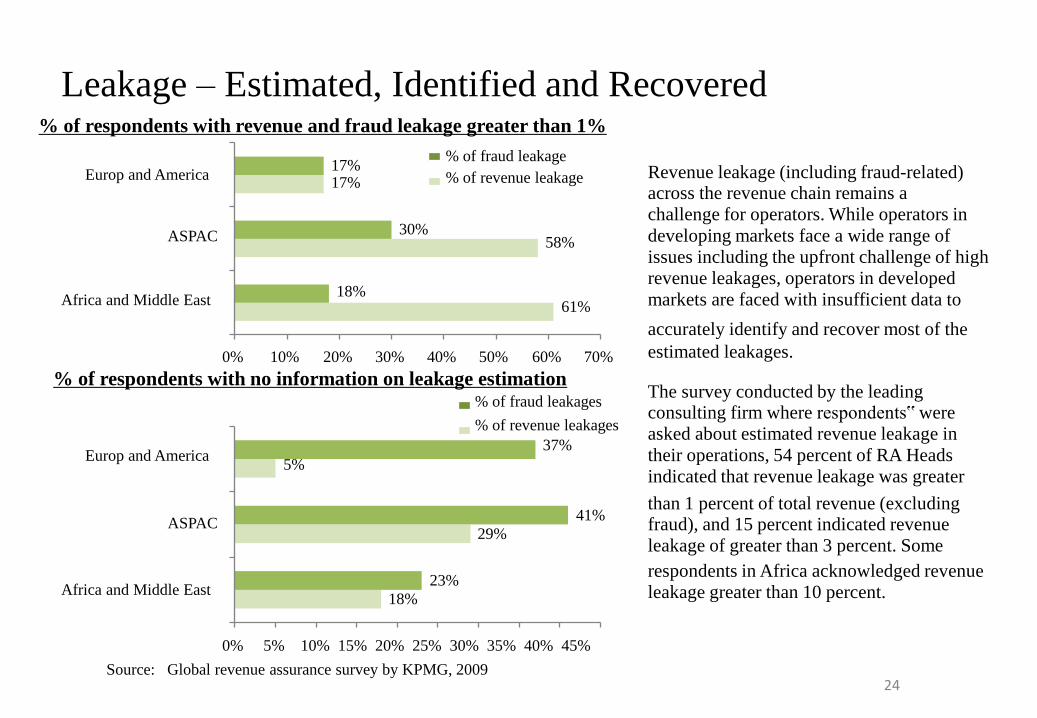
Revenue leakage (including fraud-related) across the revenue chain remains a
challenge for operators. While operators in
developing markets face a wide range of
issues including the upfront challenge of high
revenue leakages, operators in developed
markets are faced with insufficient data to
accurately identify and recover most of the
estimated leakages.
The survey conducted by the leading consulting firm where respondents‟ were
asked about estimated revenue leakage in
their operations, 54 percent of RA Heads
indicated that revenue leakage was greater
than 1 percent of total revenue (excluding fraud), and 15 percent indicated revenue
leakage of greater than 3 percent. Some
respondents in Africa acknowledged revenue
leakage greater than 10 percent.
30%
17% 17% 18%
0% 10% 20% 30% 40% 50% 60% 70%
Europ and America ASPAC Africa and Middle East
% of fraud leakage
% of revenue leakage 58% 61%
Leakage – Estimated, Identified and Recovered % of respondents with revenue and fraud leakage greater than 1%
18%
29%
23%
41%
0% 5% 10% 15% 20% 25% 30% 35% 40% 45%
Africa and Middle East
ASPAC
% of respondents with no information on leakage estimation % of fraud leakages
% of revenue leakages
37% Europ and America 5%
Source: Global revenue assurance survey by KPMG, 2009 24
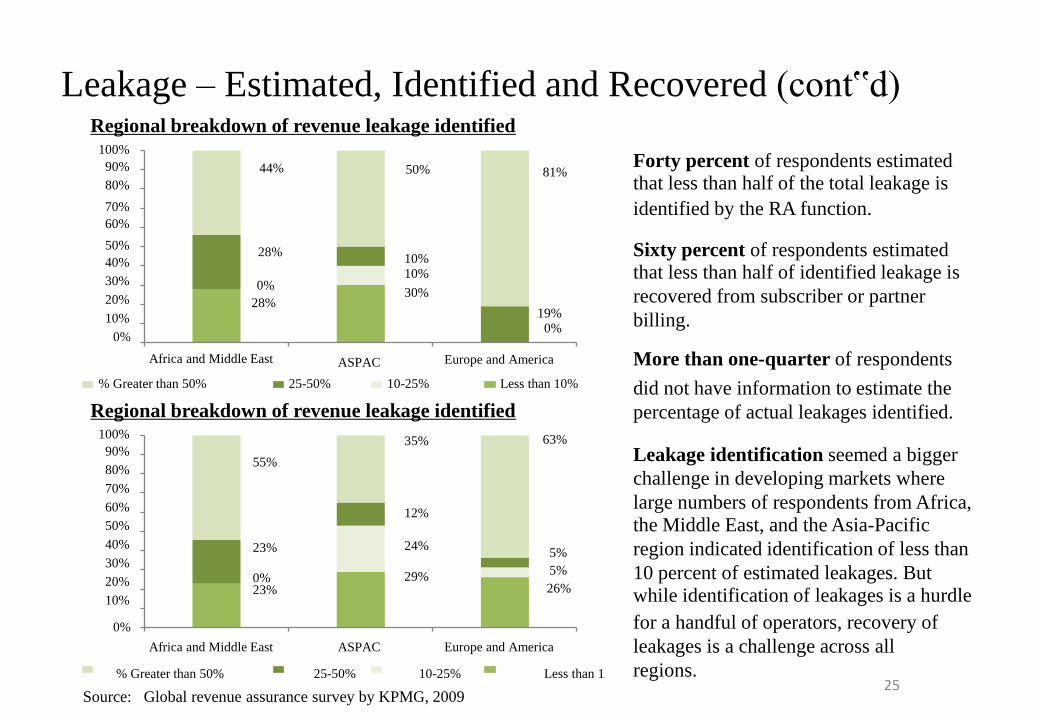
regions.
Forty percent of respondents estimated that less than half of the total leakage is
identified by the RA function.
Sixty percent of respondents estimated that less than half of identified leakage is
recovered from subscriber or partner
billing. More than one-quarter of respondents
did not have information to estimate the
percentage of actual leakages identified.
Leakage identification seemed a bigger
challenge in developing markets where
large numbers of respondents from Africa, the Middle East, and the Asia-Pacific
region indicated identification of less than
10 percent of estimated leakages. But while identification of leakages is a hurdle
for a handful of operators, recovery of
leakages is a challenge across all
10% 10%
30%
44% 50% 81%
50%
40%
30%
20%
10%
0%
70%
60%
100%
90%
80%
28% 0%
28% Africa and Middle East ASPAC
19% 0% Europe and America
% Greater than 50% 25-50% 10-25% Less than 10%
Leakage – Estimated, Identified and Recovered (cont‟d) Regional breakdown of revenue leakage identified
55% 23%
0% 23%
35% 12%
24% 29%
63% 5%
5%
26%
0%
100%
90%
80%
70%
60%
50%
40%
30%
20%
10%
Africa and Middle East ASPAC Europe and America
Regional breakdown of revenue leakage identified
% Greater than 50% 25-50% 10-25% Less than 1 Source: Global revenue assurance survey by KPMG, 2009
25
Revenue Leakage - Conclusion • For the majority of operators, recovery of leakages ranged from 2.5 percent up to 37.5 percent of the total estimated revenue leakage. This indicates that a large portion of revenue
leakage remains un-recovered. Although revenue leakage worldwide was generally 1-3
percent of revenues, the quantum of this loss even at this miniscule percentage is significant. • It is imperative for operators to assess the complete life cycle of capturing leakage data,
identifying the leakages and recovering them. Timeliness is also critical since leakages
recovered over an extended period of time are less likely to realize the potential value. As the
time between the leakage and recovery increases, the probability and size of the recovery
may decline. 1% revenue leakage over one billion of revenue is still 10 million.
26 © Datahouse Consulting
Agenda
1 2 3 4
What is revenue assurance? How to assure revenue? Sources , Type and Statistics of Revenue Leakages Revenue Assurance KPI and Tools
Who will assure revenue? 5
Key factor to consider 6
27
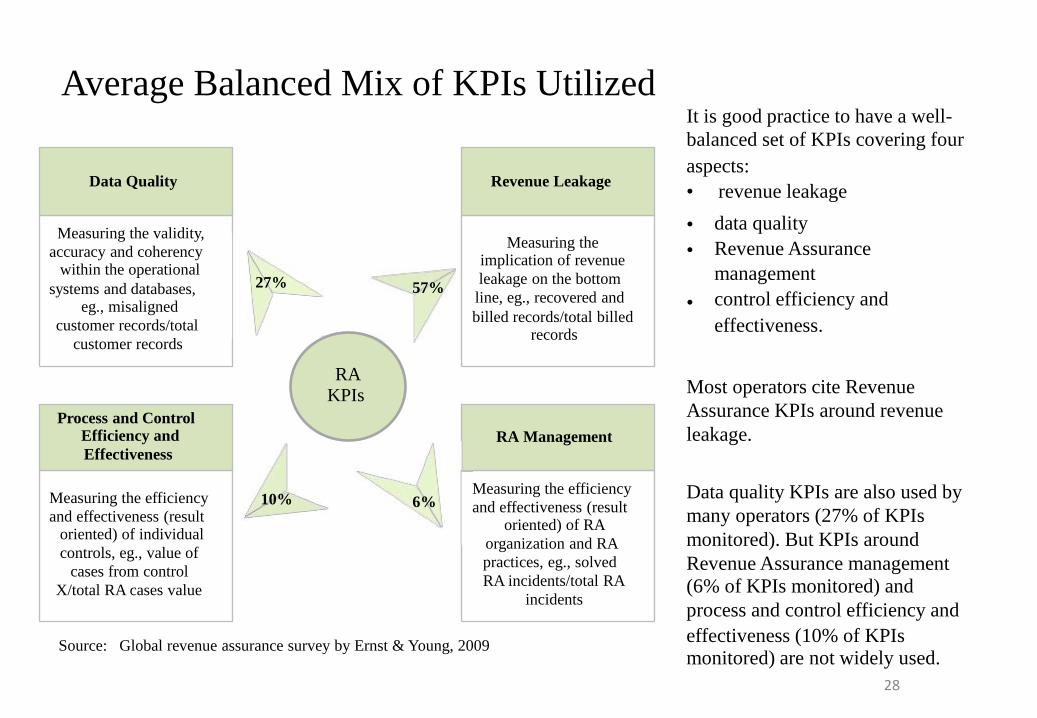
Average Balanced Mix of KPIs Utilized It is good practice to have a well-
balanced set of KPIs covering four
aspects:
• revenue leakage
•
• •
data quality
Revenue Assurance
management
control efficiency and
effectiveness.
Most operators cite Revenue
Assurance KPIs around revenue
leakage.
Data quality KPIs are also used by
many operators (27% of KPIs
monitored). But KPIs around
Revenue Assurance management (6% of KPIs monitored) and
process and control efficiency and
effectiveness (10% of KPIs monitored) are not widely used.
Data Quality
Measuring the validity,
accuracy and coherency within the operational
systems and databases, eg., misaligned
customer records/total
customer records
Revenue Leakage
Measuring the implication of revenue
leakage on the bottom
line, eg., recovered and
billed records/total billed records
RA Management
Measuring the efficiency
and effectiveness (result oriented) of RA
organization and RA
practices, eg., solved
RA incidents/total RA
incidents
Process and Control Efficiency and
Effectiveness
Measuring the efficiency
and effectiveness (result oriented) of individual
controls, eg., value of
cases from control
X/total RA cases value
RA KPIs
27% 57%
10% 6%
Source: Global revenue assurance survey by Ernst & Young, 2009
28
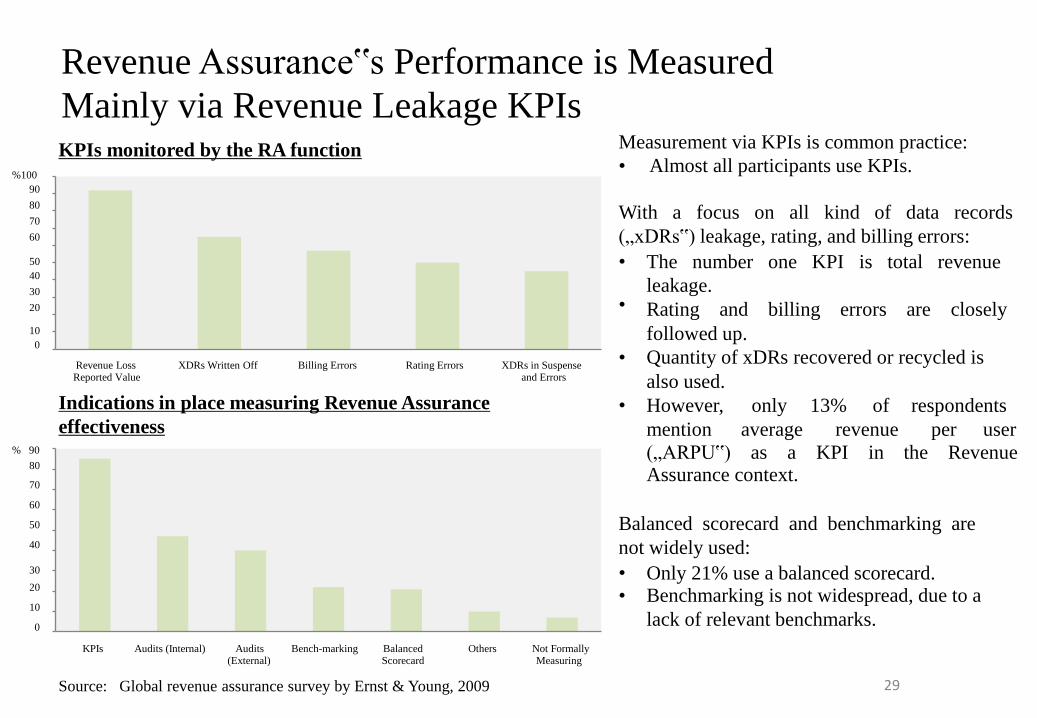
Measurement via KPIs is common practice:
• Almost all participants use KPIs. With a focus on all kind of data records
(„xDRs‟) leakage, rating, and billing errors:
• •
The number one KPI is total revenue
leakage.
Rating and billing errors are closely
•
followed up.
Quantity of xDRs recovered or recycled is
also used.
• However, only 13% of respondents
mention average revenue per user
(„ARPU‟) as a KPI in the Revenue Assurance context. Balanced scorecard and benchmarking are
not widely used:
• •
Only 21% use a balanced scorecard. Benchmarking is not widespread, due to a
lack of relevant benchmarks.
Revenue Assurance‟s Performance is Measured
Mainly via Revenue Leakage KPIs
10
0
50
40
30
20
Revenue Loss Reported Value
XDRs Written Off Billing Errors Rating Errors XDRs in Suspense and Errors
KPIs monitored by the RA function
30
20
10
0
KPIs Audits (Internal) Audits (External)
Bench-marking Balanced Scorecard
Others Not Formally Measuring
Indications in place measuring Revenue Assurance
effectiveness
%100
90
80
70
60
% 90
80
70
60
50
40
Source: Global revenue assurance survey by Ernst & Young, 2009 29
% of revenue
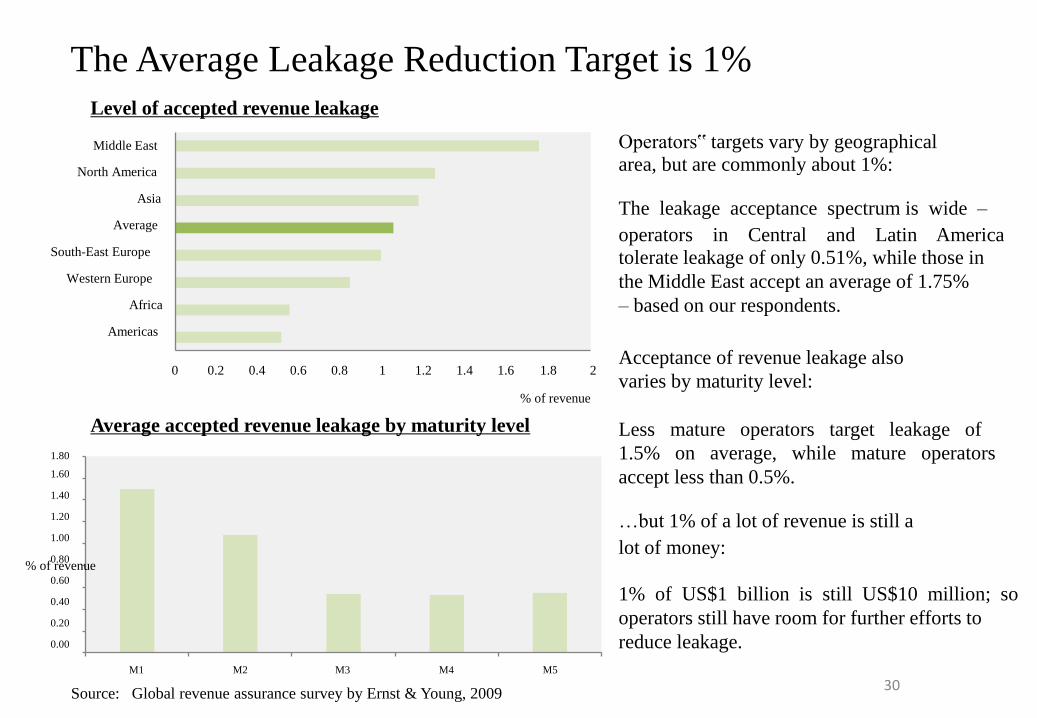
Operators‟ targets vary by geographical area, but are commonly about 1%: The leakage acceptance spectrum is wide –
operators in Central and Latin America tolerate leakage of only 0.51%, while those in
the Middle East accept an average of 1.75%
– based on our respondents.
Acceptance of revenue leakage also
varies by maturity level:
Less mature operators target leakage of
1.5% on average, while mature operators
accept less than 0.5%. …but 1% of a lot of revenue is still a
lot of money: 1% of US$1 billion is still US$10 million; so
operators still have room for further efforts to
reduce leakage.
0 0.2 0.4 0.6 0.8 1 1.2 1.4 1.6
Middle East North America Asia Average South-East Europe Western Europe Africa Americas
1.8 2 % of revenue
The Average Leakage Reduction Target is 1% Level of accepted revenue leakage
Average accepted revenue leakage by maturity level
1.80
1.60
1.40
1.20
1.00
0.80
0.60
0.40
0.20
0.00
M1 M2 M3 M4 M5
Source: Global revenue assurance survey by Ernst & Young, 2009 30
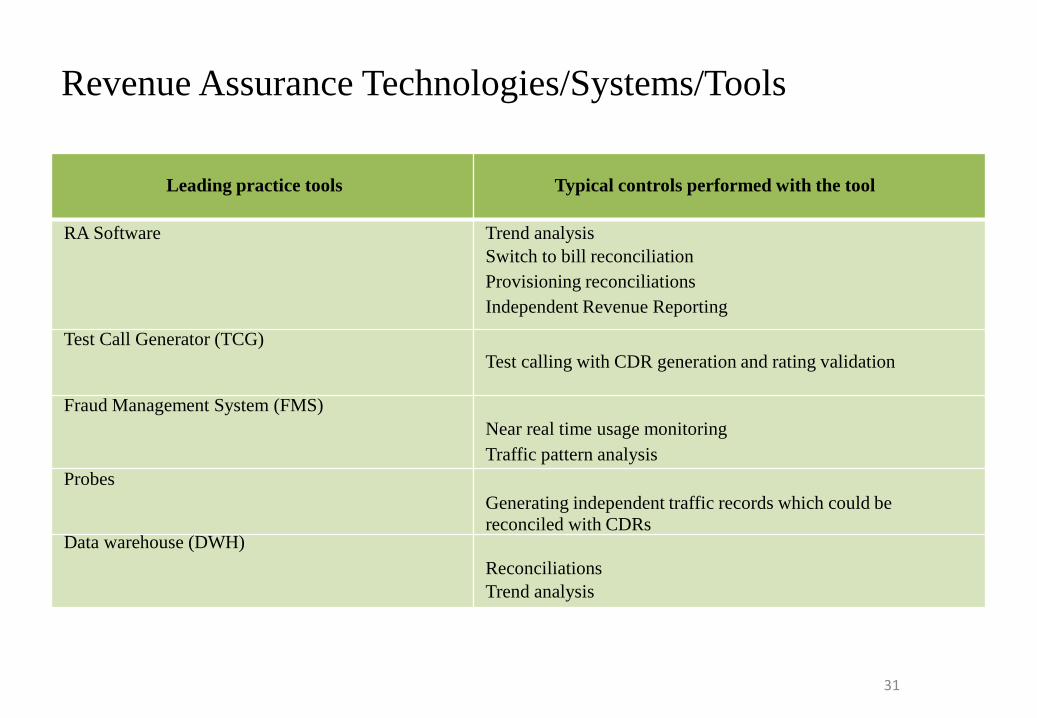
Revenue Assurance Technologies/Systems/Tools
Leading practice tools RA Software Test Call Generator (TCG) Fraud Management System (FMS) Probes Data warehouse (DWH)
Typical controls performed with the tool Trend analysis
Switch to bill reconciliation
Provisioning reconciliations
Independent Revenue Reporting Test calling with CDR generation and rating validation Near real time usage monitoring
Traffic pattern analysis Generating independent traffic records which could be
reconciled with CDRs Reconciliations
Trend analysis
31
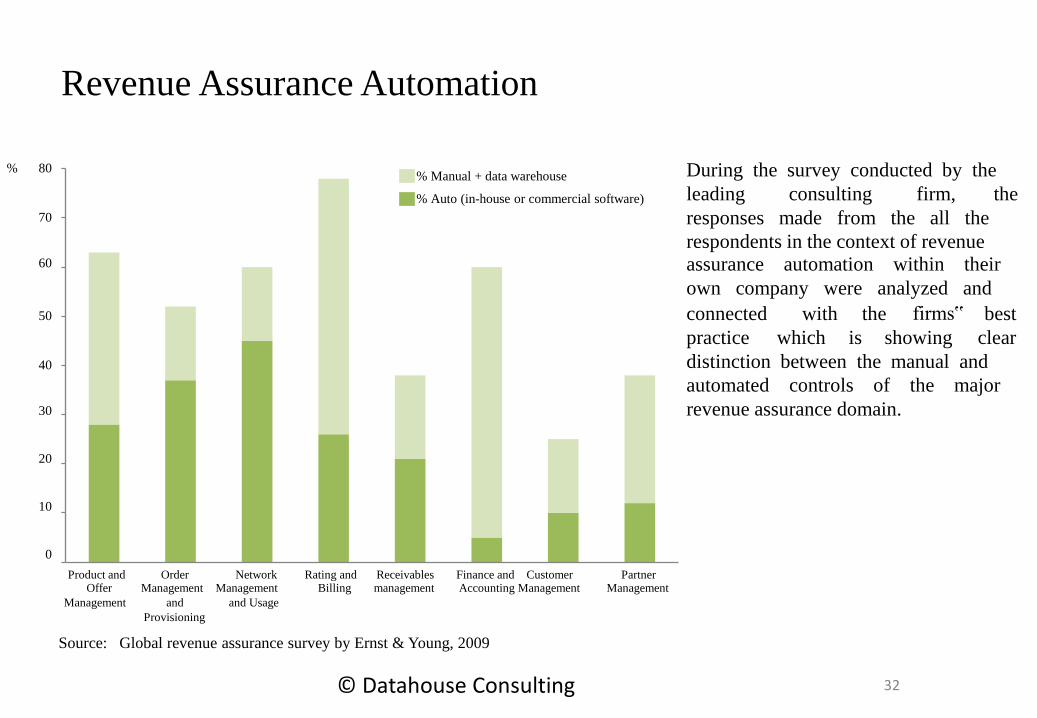
During the survey conducted by the
leading consulting firm, the
responses made from the all the
respondents in the context of revenue assurance automation within their
own company were analyzed and
connected with the firms‟ best
practice which is showing clear
distinction between the manual and
automated controls of the major
revenue assurance domain.
Revenue Assurance Automation
40 30
20
10
0
50
70 60
80 % Manual + data warehouse
% Auto (in-house or commercial software)
%
Product and Offer
Management
Order
and
Network Management Management
and Usage
Rating and Billing
Receivables management
Finance and Customer Accounting Management
Partner Management
Provisioning Source: Global revenue assurance survey by Ernst & Young, 2009
32 © Datahouse Consulting
33
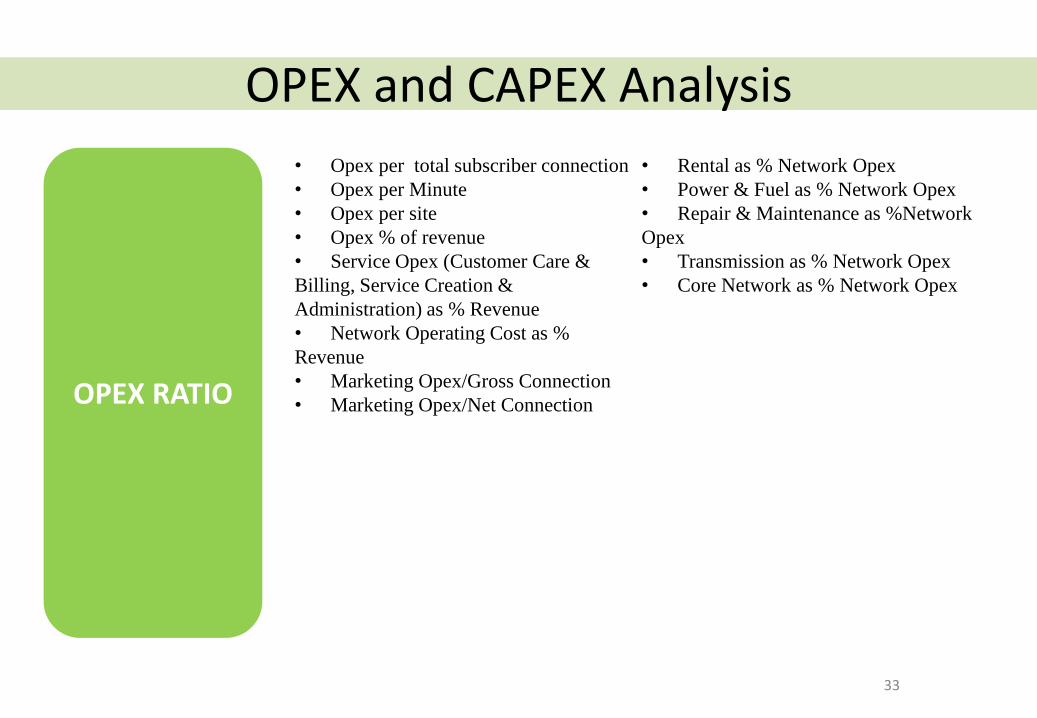
OPEX RATIO
OPEX and CAPEX Analysis
• Opex per total subscriber connection
• Opex per Minute
• Opex per site
• Opex % of revenue
• Service Opex (Customer Care &
Billing, Service Creation &
Administration) as % Revenue
• Network Operating Cost as %
Revenue
• Marketing Opex/Gross Connection
• Marketing Opex/Net Connection
• Rental as % Network Opex
• Power & Fuel as % Network Opex
• Repair & Maintenance as %Network
Opex
• Transmission as % Network Opex
• Core Network as % Network Opex
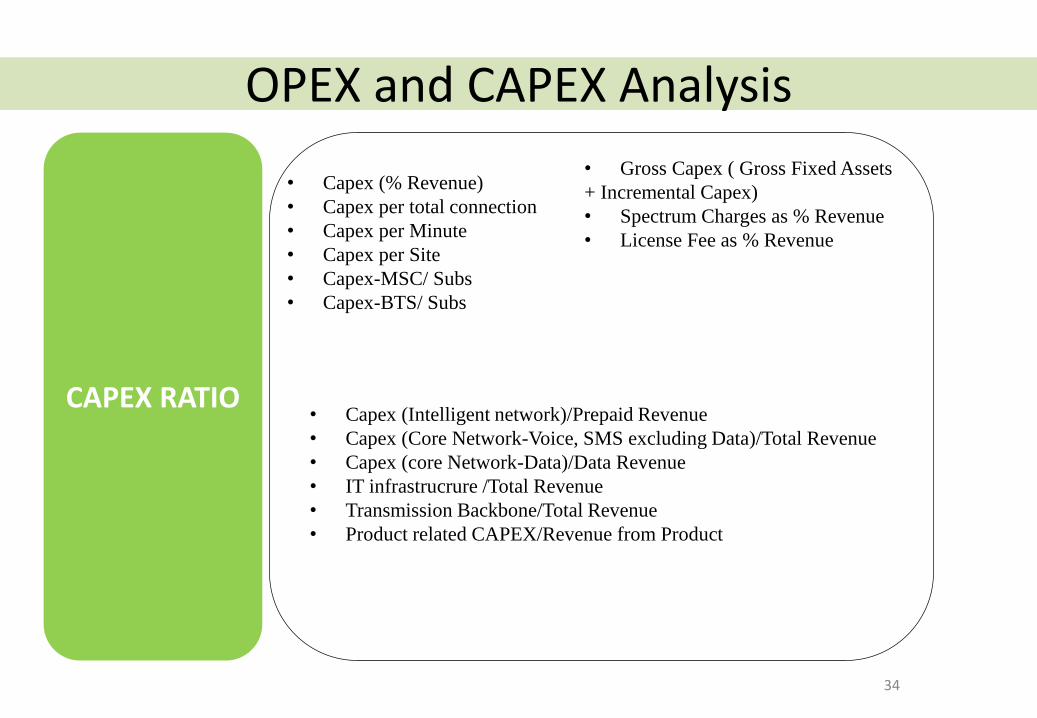
OPEX and CAPEX Analysis
34
CAPEX RATIO
• Capex (% Revenue)
• Capex per total connection
• Capex per Minute
• Capex per Site
• Capex-MSC/ Subs
• Capex-BTS/ Subs
• Gross Capex ( Gross Fixed Assets
+ Incremental Capex)
• Spectrum Charges as % Revenue
• License Fee as % Revenue
• Capex (Intelligent network)/Prepaid Revenue
• Capex (Core Network-Voice, SMS excluding Data)/Total Revenue
• Capex (core Network-Data)/Data Revenue
• IT infrastrucrure /Total Revenue
• Transmission Backbone/Total Revenue
• Product related CAPEX/Revenue from Product
35
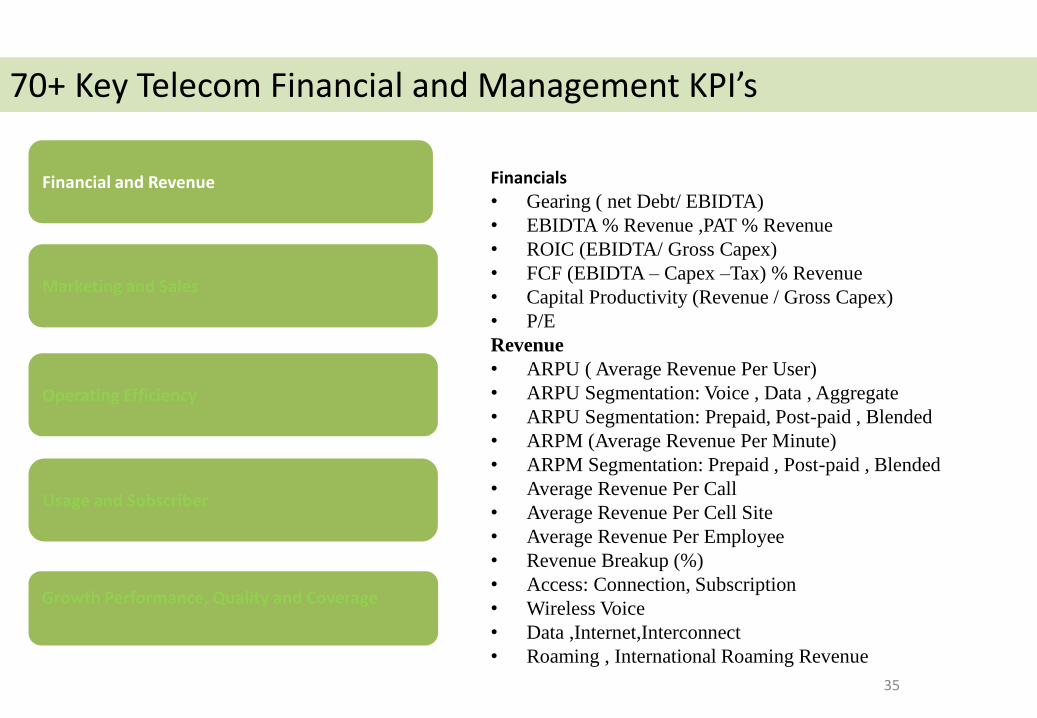
Marketing and Sales
Operating Efficiency
Growth Performance, Quality and Coverage
Financial and Revenue
Usage and Subscriber
Financials
• Gearing ( net Debt/ EBIDTA)
• EBIDTA % Revenue ,PAT % Revenue
• ROIC (EBIDTA/ Gross Capex)
• FCF (EBIDTA – Capex –Tax) % Revenue
• Capital Productivity (Revenue / Gross Capex)
• P/E
Revenue
• ARPU ( Average Revenue Per User)
• ARPU Segmentation: Voice , Data , Aggregate
• ARPU Segmentation: Prepaid, Post-paid , Blended
• ARPM (Average Revenue Per Minute)
• ARPM Segmentation: Prepaid , Post-paid , Blended
• Average Revenue Per Call
• Average Revenue Per Cell Site
• Average Revenue Per Employee
• Revenue Breakup (%)
• Access: Connection, Subscription
• Wireless Voice
• Data ,Internet,Interconnect
• Roaming , International Roaming Revenue
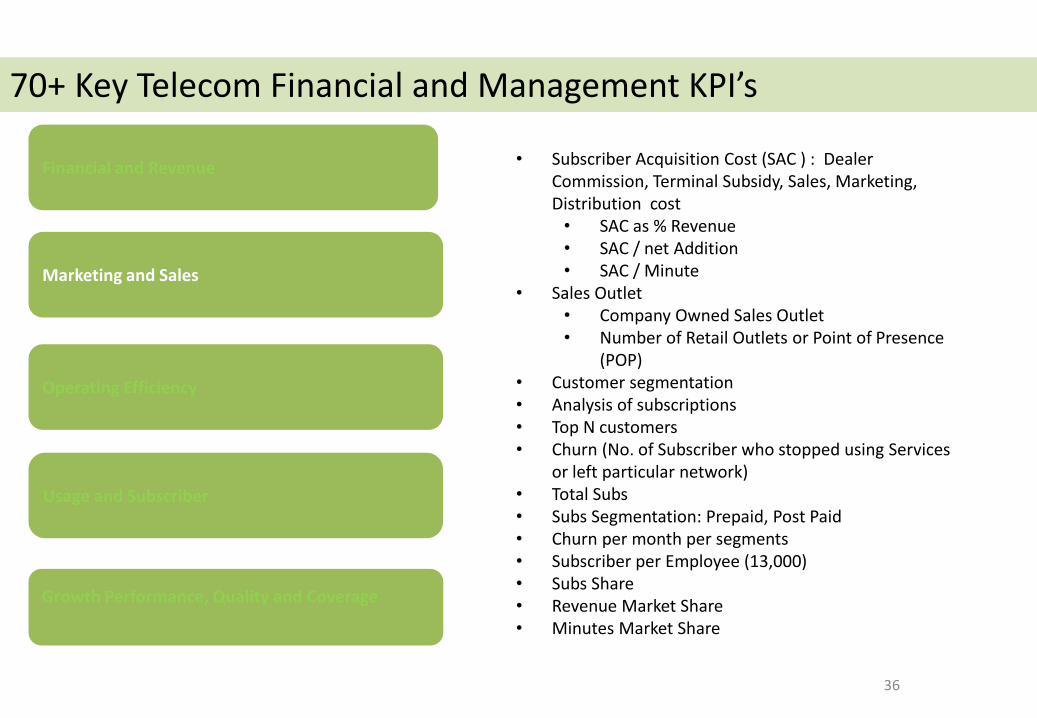
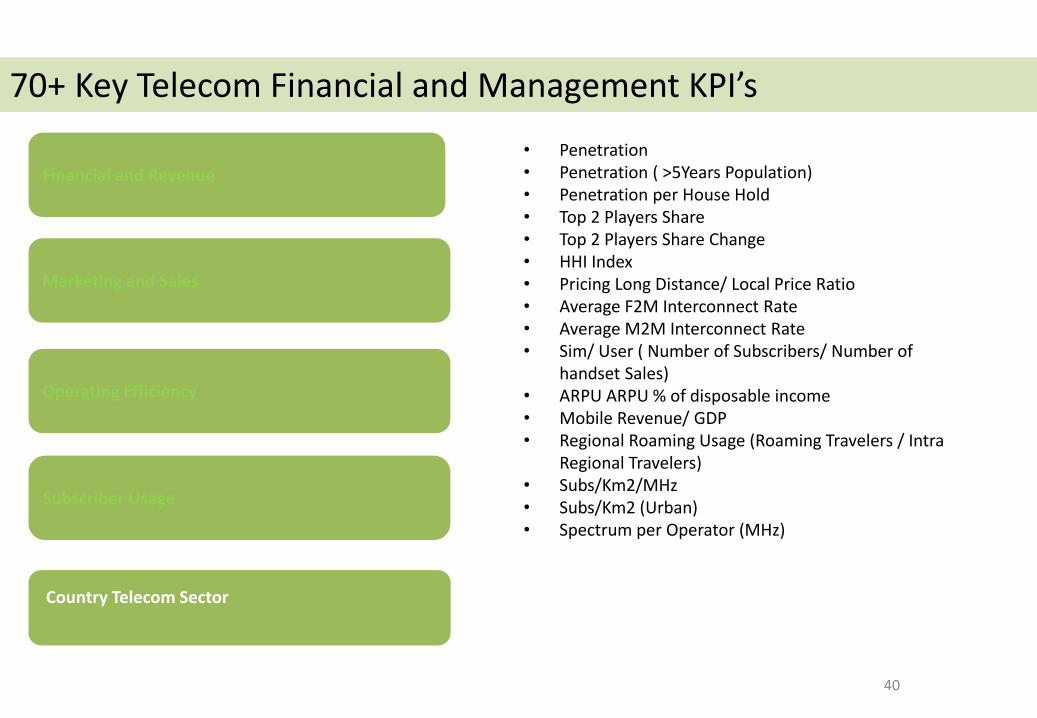
70+ Key Telecom Financial and Management KPI’s
36
Marketing and Sales
Operating Efficiency
Growth Performance, Quality and Coverage
Financial and Revenue
Usage and Subscriber
• Subscriber Acquisition Cost (SAC ) : Dealer Commission, Terminal Subsidy, Sales, Marketing, Distribution cost • SAC as % Revenue • SAC / net Addition • SAC / Minute
• Sales Outlet • Company Owned Sales Outlet • Number of Retail Outlets or Point of Presence
(POP) • Customer segmentation • Analysis of subscriptions • Top N customers • Churn (No. of Subscriber who stopped using Services
or left particular network) • Total Subs • Subs Segmentation: Prepaid, Post Paid • Churn per month per segments • Subscriber per Employee (13,000) • Subs Share • Revenue Market Share • Minutes Market Share
70+ Key Telecom Financial and Management KPI’s
37
Marketing and Sales
Operating Efficiency
Growth Performance, Quality and Coverage
Financial and Revenue
Usage and Subscriber
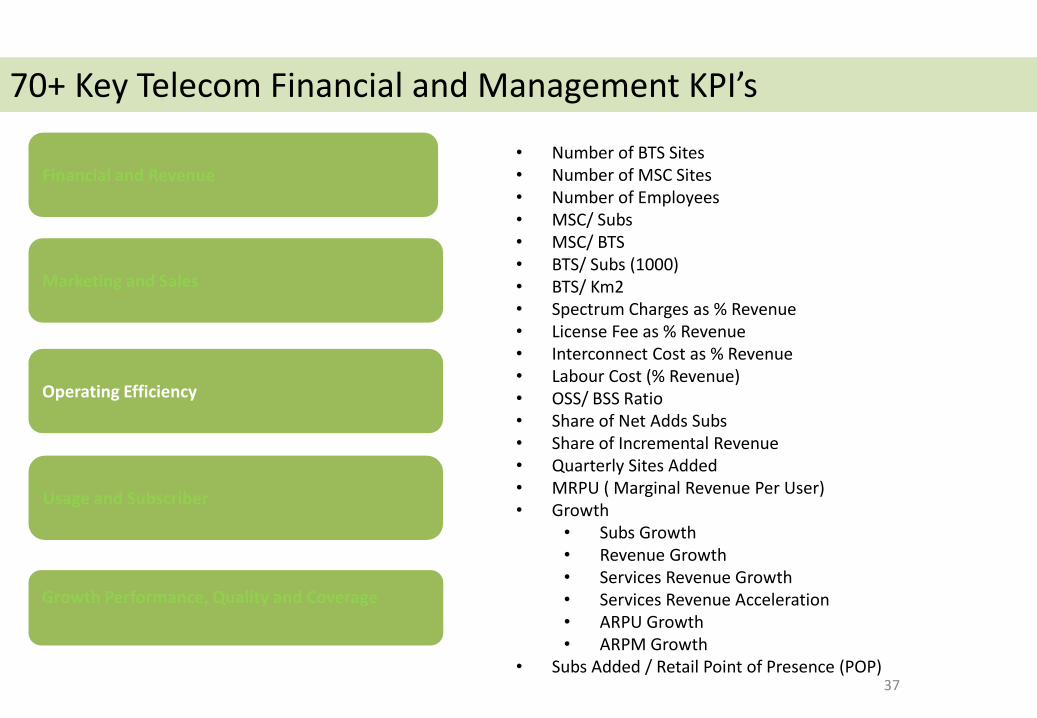
• Number of BTS Sites • Number of MSC Sites • Number of Employees • MSC/ Subs • MSC/ BTS • BTS/ Subs (1000) • BTS/ Km2 • Spectrum Charges as % Revenue • License Fee as % Revenue • Interconnect Cost as % Revenue • Labour Cost (% Revenue) • OSS/ BSS Ratio • Share of Net Adds Subs • Share of Incremental Revenue • Quarterly Sites Added • MRPU ( Marginal Revenue Per User) • Growth
• Subs Growth • Revenue Growth • Services Revenue Growth • Services Revenue Acceleration • ARPU Growth • ARPM Growth
• Subs Added / Retail Point of Presence (POP)
70+ Key Telecom Financial and Management KPI’s
38
Marketing and Sales
Operating Efficiency
Growth Performance, Quality and Coverage
Financial and Revenue
Subscriber Usage
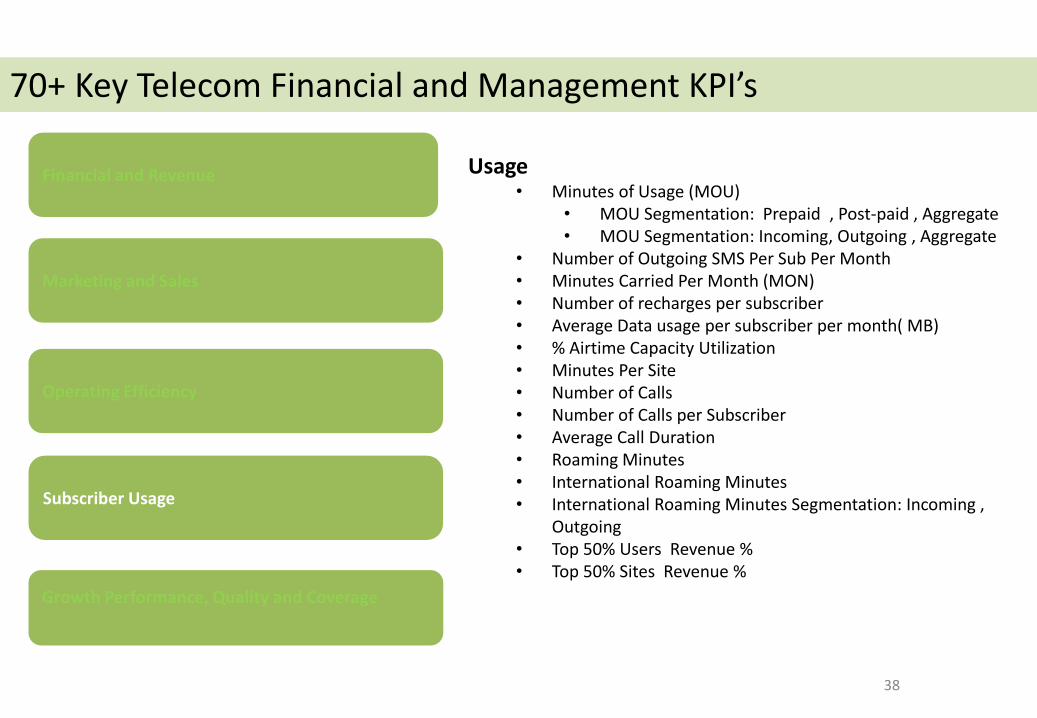
Usage • Minutes of Usage (MOU)
• MOU Segmentation: Prepaid , Post-paid , Aggregate • MOU Segmentation: Incoming, Outgoing , Aggregate
• Number of Outgoing SMS Per Sub Per Month • Minutes Carried Per Month (MON) • Number of recharges per subscriber • Average Data usage per subscriber per month( MB) • % Airtime Capacity Utilization • Minutes Per Site • Number of Calls • Number of Calls per Subscriber • Average Call Duration • Roaming Minutes • International Roaming Minutes • International Roaming Minutes Segmentation: Incoming ,
Outgoing • Top 50% Users Revenue % • Top 50% Sites Revenue %
70+ Key Telecom Financial and Management KPI’s
39
Marketing and Sales
Operating Efficiency
Quality and Coverage
Financial and Revenue
Subscriber Usage
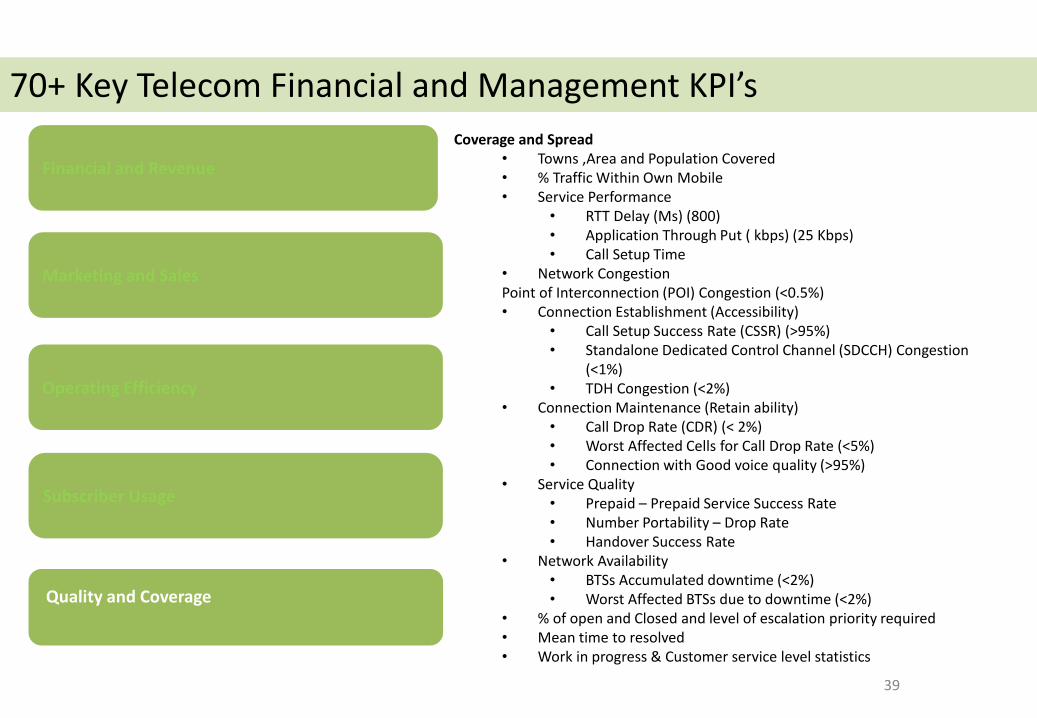
Coverage and Spread • Towns ,Area and Population Covered • % Traffic Within Own Mobile • Service Performance
• RTT Delay (Ms) (800) • Application Through Put ( kbps) (25 Kbps) • Call Setup Time
• Network Congestion Point of Interconnection (POI) Congestion (<0.5%) • Connection Establishment (Accessibility)
• Call Setup Success Rate (CSSR) (>95%) • Standalone Dedicated Control Channel (SDCCH) Congestion
(<1%) • TDH Congestion (<2%)
• Connection Maintenance (Retain ability) • Call Drop Rate (CDR) (< 2%) • Worst Affected Cells for Call Drop Rate (<5%) • Connection with Good voice quality (>95%)
• Service Quality • Prepaid – Prepaid Service Success Rate • Number Portability – Drop Rate • Handover Success Rate
• Network Availability • BTSs Accumulated downtime (<2%) • Worst Affected BTSs due to downtime (<2%)
• % of open and Closed and level of escalation priority required • Mean time to resolved • Work in progress & Customer service level statistics
70+ Key Telecom Financial and Management KPI’s
40
Marketing and Sales
Operating Efficiency
Country Telecom Sector
Financial and Revenue
Subscriber Usage
• Penetration • Penetration ( >5Years Population) • Penetration per House Hold • Top 2 Players Share • Top 2 Players Share Change • HHI Index • Pricing Long Distance/ Local Price Ratio • Average F2M Interconnect Rate • Average M2M Interconnect Rate • Sim/ User ( Number of Subscribers/ Number of
handset Sales) • ARPU ARPU % of disposable income • Mobile Revenue/ GDP • Regional Roaming Usage (Roaming Travelers / Intra
Regional Travelers) • Subs/Km2/MHz • Subs/Km2 (Urban) • Spectrum per Operator (MHz)
70+ Key Telecom Financial and Management KPI’s
Agenda
1 2 3 4
What is revenue assurance? How to assure revenue? Sources , Type and Statistics of Revenue Leakages Revenue Assurance KPI and Tools
Who will assure revenue? 5
Key factor to consider 6
41
Revenue Assurance Organization
Objective
To provide and sustain an effective enterprise-wide process that will independently
confirm the end-to-end completeness, accuracy, integrity and timely capture, billing and
reporting of all revenue generating events; while identifying emerging revenue risks
and/or opportunities with a view to mitigating/exploiting same.
42
Where should the Revenue Assurance function sit within the organization?
How many people should there be within the Revenue Assurance organization?
What should RA‟s relationship be with functions such as fraud, internal audit, risk management, finance,
billing, and customer relationship management?
What should the organizational structure look like?
What type of roles and skills should there be in the team?
How can we build cultural awareness by linking RA‟s performance to wider Group targets?
Unfortunately there is no one-size-fits-all answer to these questions:
The objectives set for the Revenue Assurance function, together with the characteristics of the organization as a whole, will shape the appropriate structure. The nature of the RA organization will be influenced by
factors including: • size of the organization
• existing structure of the organization
• risk culture
• group structure
• initial start-up point (where was it initiated?)
• executive sponsorship
• regulatory requirements.
The Revenue Assurance Organization: Insight How to structure a Revenue Assurance organization to achieve success?
Many operators continue to struggle with questions such as these:
43 © Datahouse Consulting
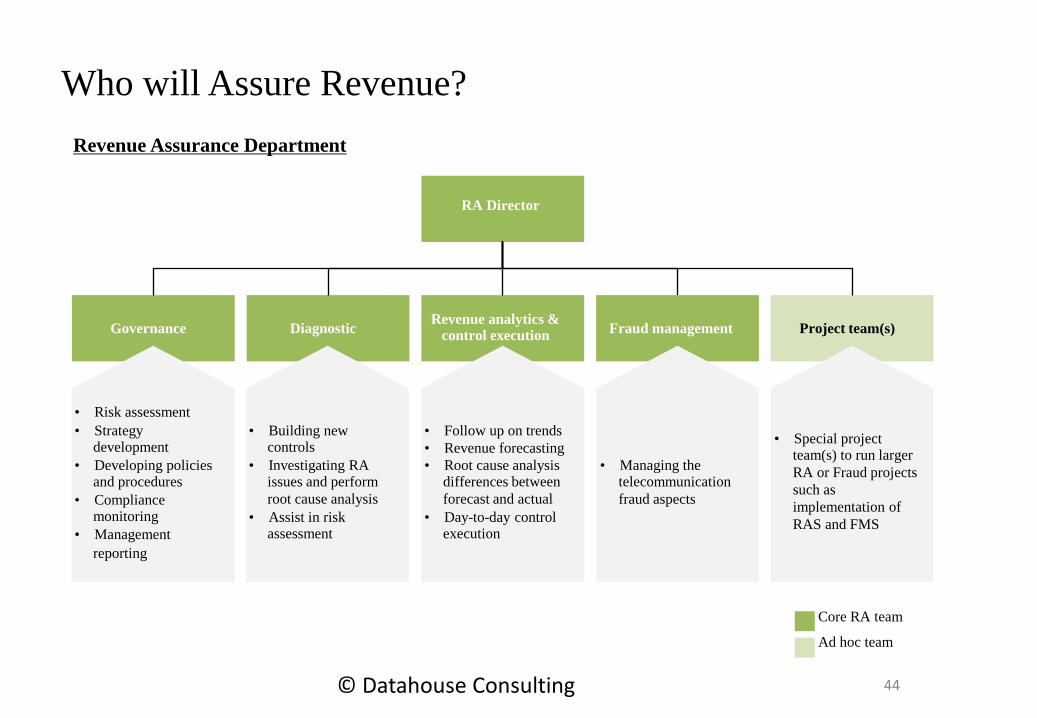
Governance Revenue analytics & control execution
Project team(s)
• Risk assessment
• Strategy development
• Developing policies and procedures
• Compliance monitoring
• Management
• Follow up on trends
• Revenue forecasting
• Root cause analysis differences between
forecast and actual
• Day-to-day control execution
• Special project team(s) to run larger
RA or Fraud projects
such as
implementation of
RAS and FMS
Diagnostic
reporting Core RA team
Ad hoc team
• Building new controls
• Investigating RA issues and perform
root cause analysis
• Assist in risk assessment
Fraud management
• Managing the telecommunication
fraud aspects
Who will Assure Revenue? Revenue Assurance Department RA Director
44 © Datahouse Consulting
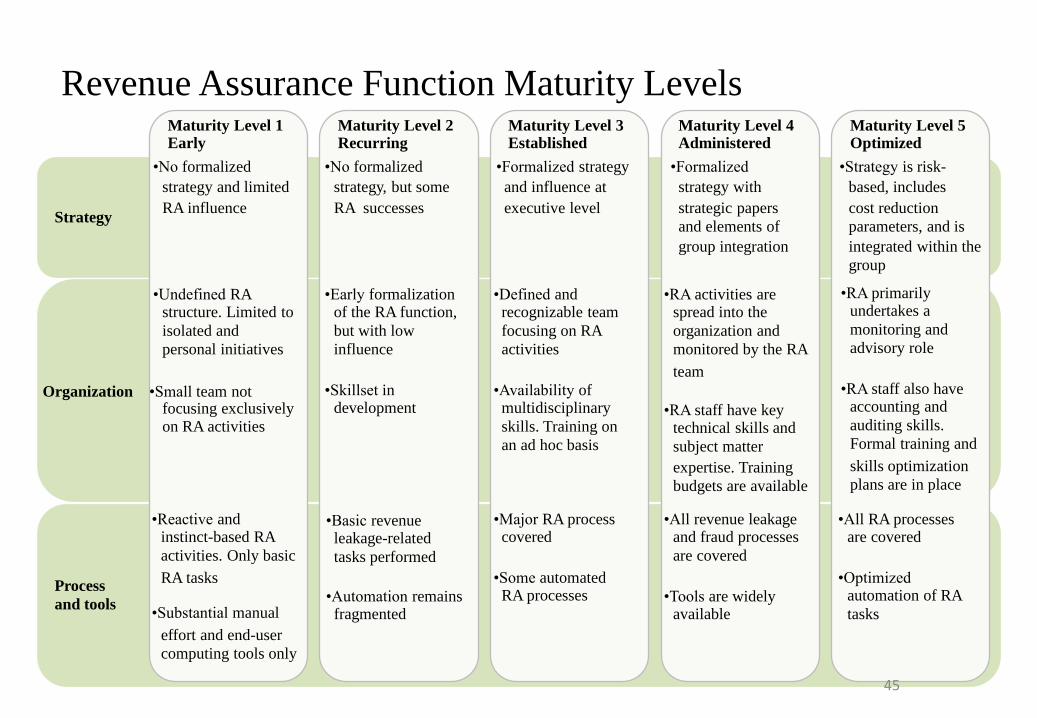
Revenue Assurance Function Maturity Levels
Strategy
Process
and tools
Maturity Level 1 Early
•No formalized
strategy and limited
RA influence
Maturity Level 2 Recurring
•No formalized
strategy, but some
RA successes
Maturity Level 3 Established
•Formalized strategy
and influence at
executive level
Maturity Level 4 Administered
•Formalized
strategy with
strategic papers
and elements of
group integration
Maturity Level 5 Optimized
•Strategy is risk-
based, includes
cost reduction
parameters, and is
integrated within the
group
•Undefined RA structure. Limited to
isolated and
personal initiatives
Organization •Small team not focusing exclusively on RA activities
•Early formalization of the RA function,
but with low
influence
•Skillset in development
•Defined and recognizable team
focusing on RA
activities
•Availability of multidisciplinary
skills. Training on
an ad hoc basis
•RA activities are spread into the
organization and
monitored by the RA
team
•RA staff have key technical skills and
subject matter
expertise. Training
budgets are available
•RA primarily undertakes a
monitoring and
advisory role
•RA staff also have accounting and
auditing skills.
Formal training and
skills optimization
plans are in place
•Reactive and instinct-based RA
activities. Only basic
RA tasks •Substantial manual
effort and end-user
computing tools only
•Basic revenue leakage-related
tasks performed
•Automation remains fragmented
•Major RA process covered
•Some automated RA processes
•All revenue leakage and fraud processes
are covered
•Tools are widely available
•All RA processes are covered
•Optimized automation of RA
tasks
45
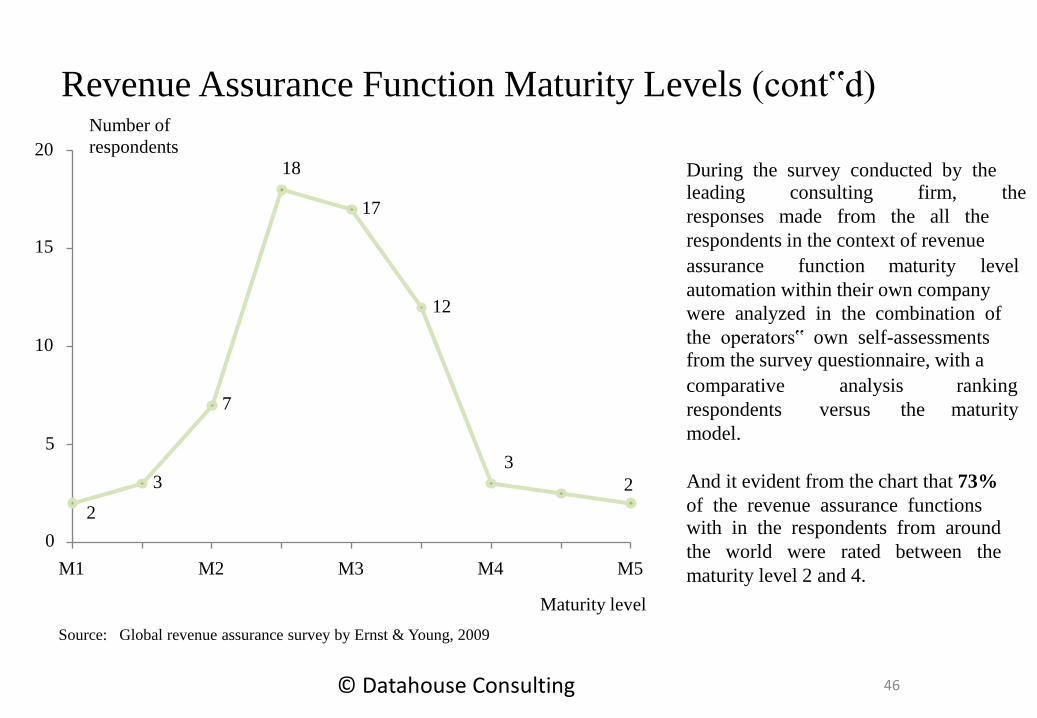
During the survey conducted by the leading consulting firm, the
responses made from the all the
respondents in the context of revenue
assurance function maturity level
automation within their own company
were analyzed in the combination of
the operators‟ own self-assessments
from the survey questionnaire, with a
comparative analysis ranking
respondents versus the maturity
model.
And it evident from the chart that 73%
of the revenue assurance functions with in the respondents from around
the world were rated between the
maturity level 2 and 4.
2
3
7
18
17
12
3
2
0
5
10
15
20
M1 M2 M3 M4 M5
Revenue Assurance Function Maturity Levels (cont‟d) Number of
respondents
Maturity level Source: Global revenue assurance survey by Ernst & Young, 2009
46 © Datahouse Consulting
The Revenue Assurance Strategy: Insight Why have a strategy? The need for a Revenue Assurance strategy which is in line with, and integrated into, the overall risk management framework of an organization should be an obvious point. By having
a documented and publicized strategy, the goals and purpose of the Revenue Assurance
function help other departments within the business clearly understand what Revenue
Assurance is trying to achieve and why Revenue Assurance should be embedded into the
operating processes of the business. This understanding is critical in delivering improved revenue capture, as without buy-in to the strategy, the goals of Revenue Assurance will simply not be achieved.
47 © Datahouse Consulting
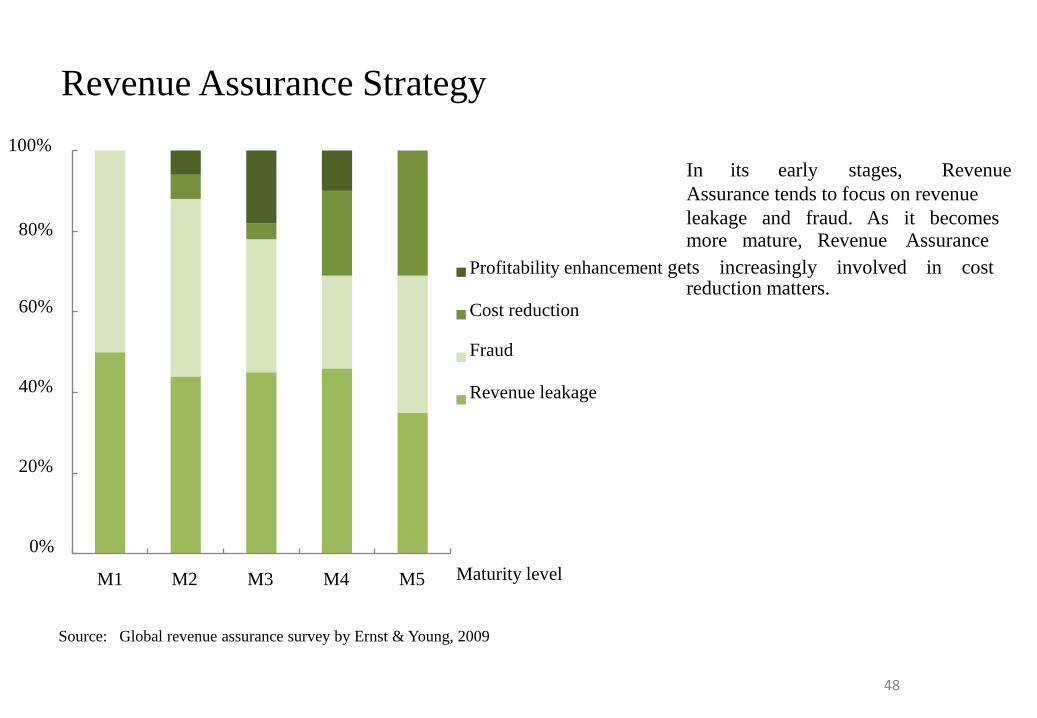
In its early stages, Revenue
Assurance tends to focus on revenue
80% 60% 40% 20% 0%
Revenue Assurance Strategy 100%
M1 M2 M3 M4 M5
leakage and fraud. As it becomes more mature, Revenue Assurance
Profitability enhancement gets increasingly involved in cost reduction matters. Cost reduction Fraud Revenue leakage
Maturity level
Source: Global revenue assurance survey by Ernst & Young, 2009
48
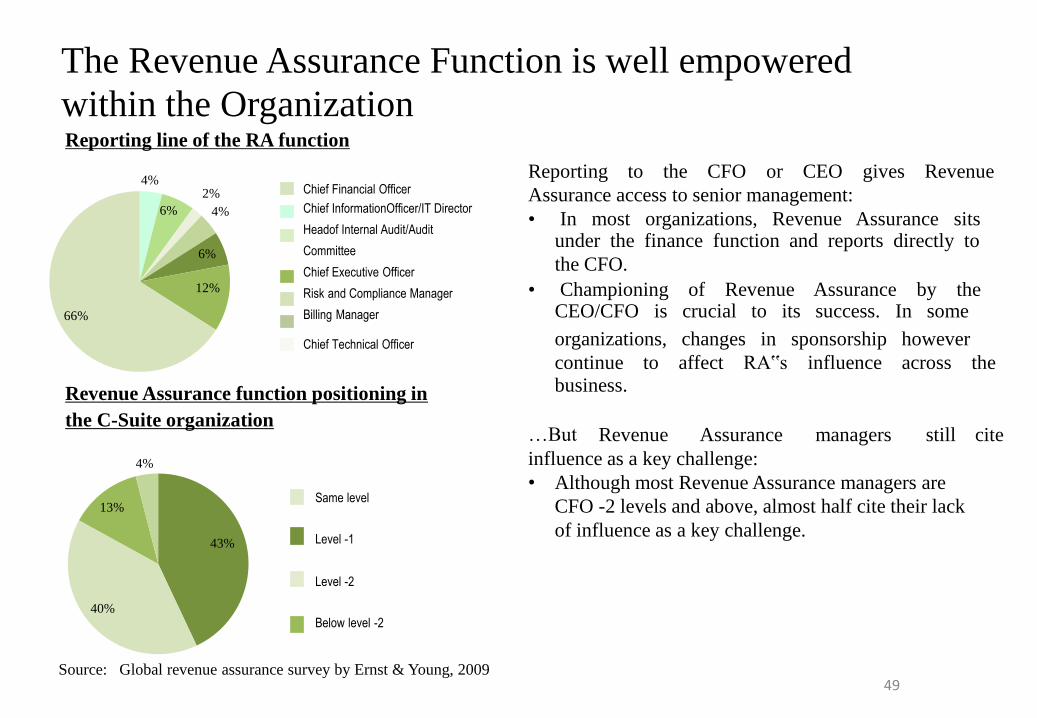
The Revenue Assurance Function is well empowered
within the Organization Reporting line of the RA function
Reporting to the CFO or CEO gives Revenue
Assurance access to senior management:
• In most organizations, Revenue Assurance sits under the finance function and reports directly to
the CFO.
• Championing of Revenue Assurance by the CEO/CFO is crucial to its success. In some
organizations, changes in sponsorship however
continue to affect RA‟s influence across the business.
…But Revenue Assurance managers still cite
influence as a key challenge:
• Although most Revenue Assurance managers are
CFO -2 levels and above, almost half cite their lack
of influence as a key challenge.
Chief Financial Officer
Chief InformationOfficer/IT Director
Headof Internal Audit/Audit
Committee
Chief Executive Officer
Risk and Compliance Manager
Billing Manager
Chief Technical Officer Revenue Assurance function positioning in
the C-Suite organization
Same level Level -1
Level -2
Below level -2
4% 6%
2%
4% 6% 12%
66%
43%
40%
13%
4%
Source: Global revenue assurance survey by Ernst & Young, 2009 49
Two conflicting factors impact Revenue Assurance's
positioning:
The need for across departments influence
…And the sometime inadequate hierarchical
positioning of Revenue Assurance within the organization which could limit RA‟s ability of action.
Technical departments (billing, IT, network) are key
collaborators, together with Finance.
It is believed that Revenue Assurance should:
Operate as a subset of enterprise risk
management
…And benefit from formal links with the internal
audit, risk management and compliance functions.
More mature RA functions maintain strong ties and
synergies with other risk management functions.
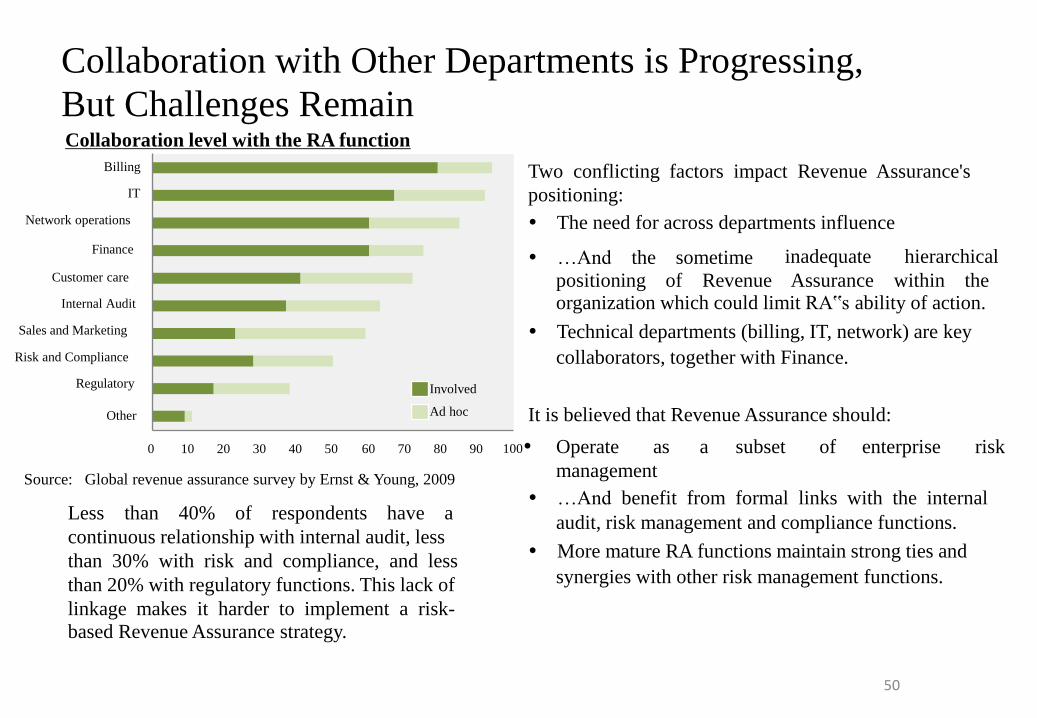
0 10 20 30 40 50 60 70 80 90 100
Other
Customer care Internal Audit Sales and Marketing Risk and Compliance Regulatory
Finance
Billing IT Network operations
Involved
Ad hoc
Collaboration with Other Departments is Progressing,
But Challenges Remain Collaboration level with the RA function
Source: Global revenue assurance survey by Ernst & Young, 2009 Less than 40% of respondents have a
continuous relationship with internal audit, less
than 30% with risk and compliance, and less
than 20% with regulatory functions. This lack of
linkage makes it harder to implement a risk-
based Revenue Assurance strategy.
50
People Capabilities of Revenue Assurance What determines RA skills needs?
The wider the product mix, the greater the need for a mixed skills group
The more skills, the greater the size of the department and the greater the need for multiple
applications in order to provide coverage and assurance across the various product streams
Do you have to be able to respond quickly and adapt to constant change?
Do you need to ensure an appropriate presence and input at senior Level and across various
Change forums?
51
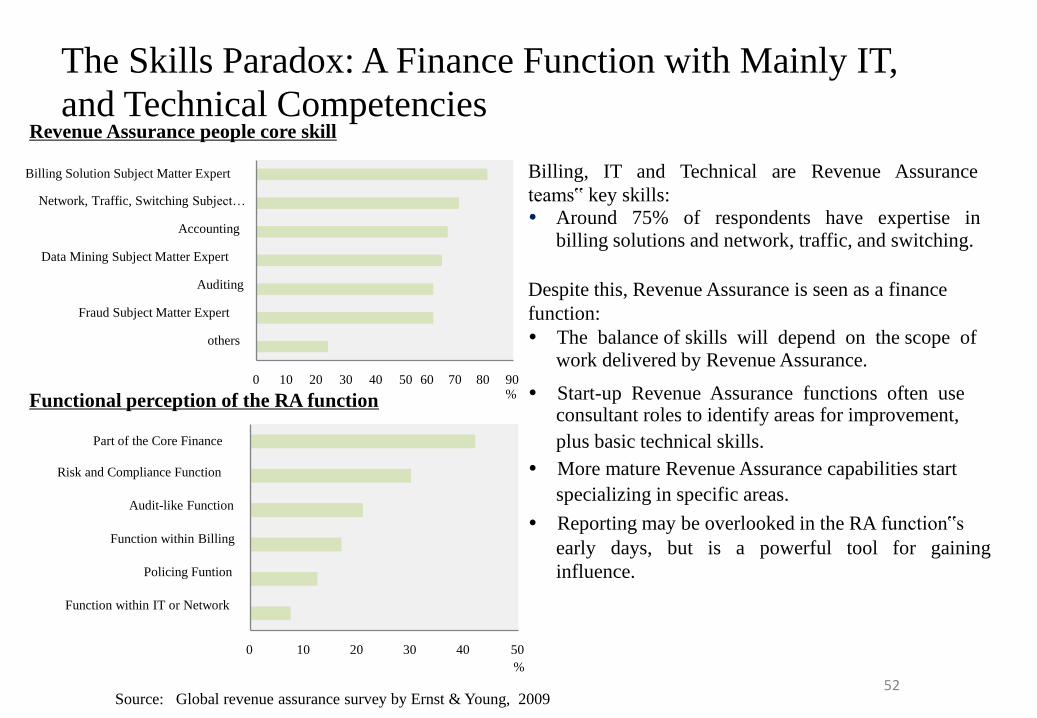
Billing, IT and Technical are Revenue Assurance
teams‟ key skills: Around 75% of respondents have expertise in billing solutions and network, traffic, and switching. Despite this, Revenue Assurance is seen as a finance
function:
The balance of skills will depend on the scope of work delivered by Revenue Assurance.
Start-up Revenue Assurance functions often use consultant roles to identify areas for improvement,
plus basic technical skills.
More mature Revenue Assurance capabilities start
specializing in specific areas.
Reporting may be overlooked in the RA function‟s
early days, but is a powerful tool for gaining
influence.
60 70 80
Billing Solution Subject Matter Expert Network, Traffic, Switching Subject… Accounting Data Mining Subject Matter Expert Auditing Fraud Subject Matter Expert others
The Skills Paradox: A Finance Function with Mainly IT,
and Technical Competencies Revenue Assurance people core skill
90 %
0 10 20 30 40 50
Part of the Core Finance Risk and Compliance Function Audit-like Function Function within Billing Policing Funtion Function within IT or Network
0 10 20 30 40 50
Functional perception of the RA function
%
Source: Global revenue assurance survey by Ernst & Young, 2009 52
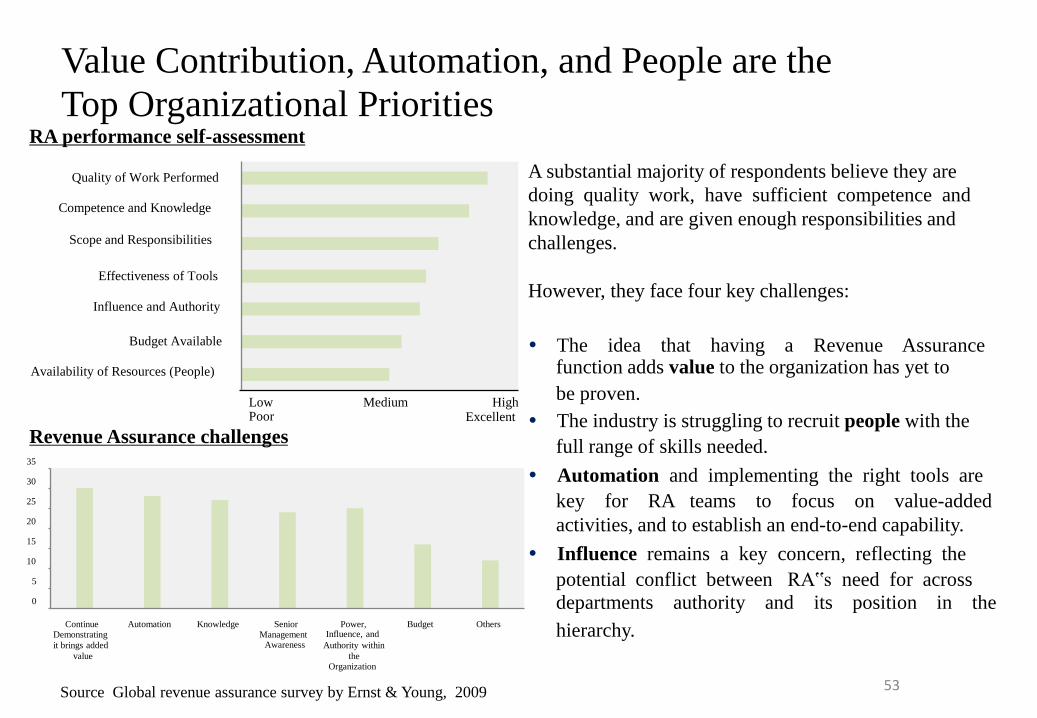
A substantial majority of respondents believe they are
doing quality work, have sufficient competence and
knowledge, and are given enough responsibilities and
challenges.
The idea that having a Revenue Assurance function adds value to the organization has yet to
be proven.
The industry is struggling to recruit people with the
full range of skills needed.
Automation and implementing the right tools are
key for RA teams to focus on value-added
activities, and to establish an end-to-end capability.
Influence remains a key concern, reflecting the
potential conflict between RA‟s need for across
departments authority and its position in the
hierarchy.
Budget Available Availability of Resources (People)
Effectiveness of Tools
However, they face four key challenges: Influence and Authority
Quality of Work Performed Competence and Knowledge Scope and Responsibilities
Medium High Excellent
Continue Demonstrating
it brings added
value
Automation Knowledge Senior Management Awareness
Power, Influence, and
Authority within the Organization
Budget Others
Value Contribution, Automation, and People are the
Top Organizational Priorities RA performance self-assessment
Low Poor
Revenue Assurance challenges 35
30
25
20
15
10
5
0
Source Global revenue assurance survey by Ernst & Young, 2009 53
Key Factors to be Considered • Collective responsibility for revenue assurance – the root cause for revenue leakage being the lack of coordination, it is important to have a separate team with clear responsibility
towards revenue assurance. • There should be a framework document for the revenue assurance activities. The
revenue assurance team should come out with a framework document with due consideration
for measurements and best practices • The revenue assurance team should also consider the external events related to the
reliability factors such as system failures, their impact and the effectiveness of the
contingency procedures. • Tracking and reporting as specified in the framework document should be strictly
implemented.
54