Embed Size (px)
DESCRIPTION
Pharmaceutical Industry Analysis- India. FY 2013
Citation preview
Valuation Analysis of Indian Ph i l SPharmaceutical Sector
ContentsContents
Background of India’s Pharmaceutical Industry
Current Trends and Performance
Valuation Multiples Analysis
Industry’s Major Players Performance
Regulatory Issues
Industry s Major Players PerformanceContact Us
Financial Advisory Services – Team RBSA
• Valuation
1
• Investment Banking• Advisory Services
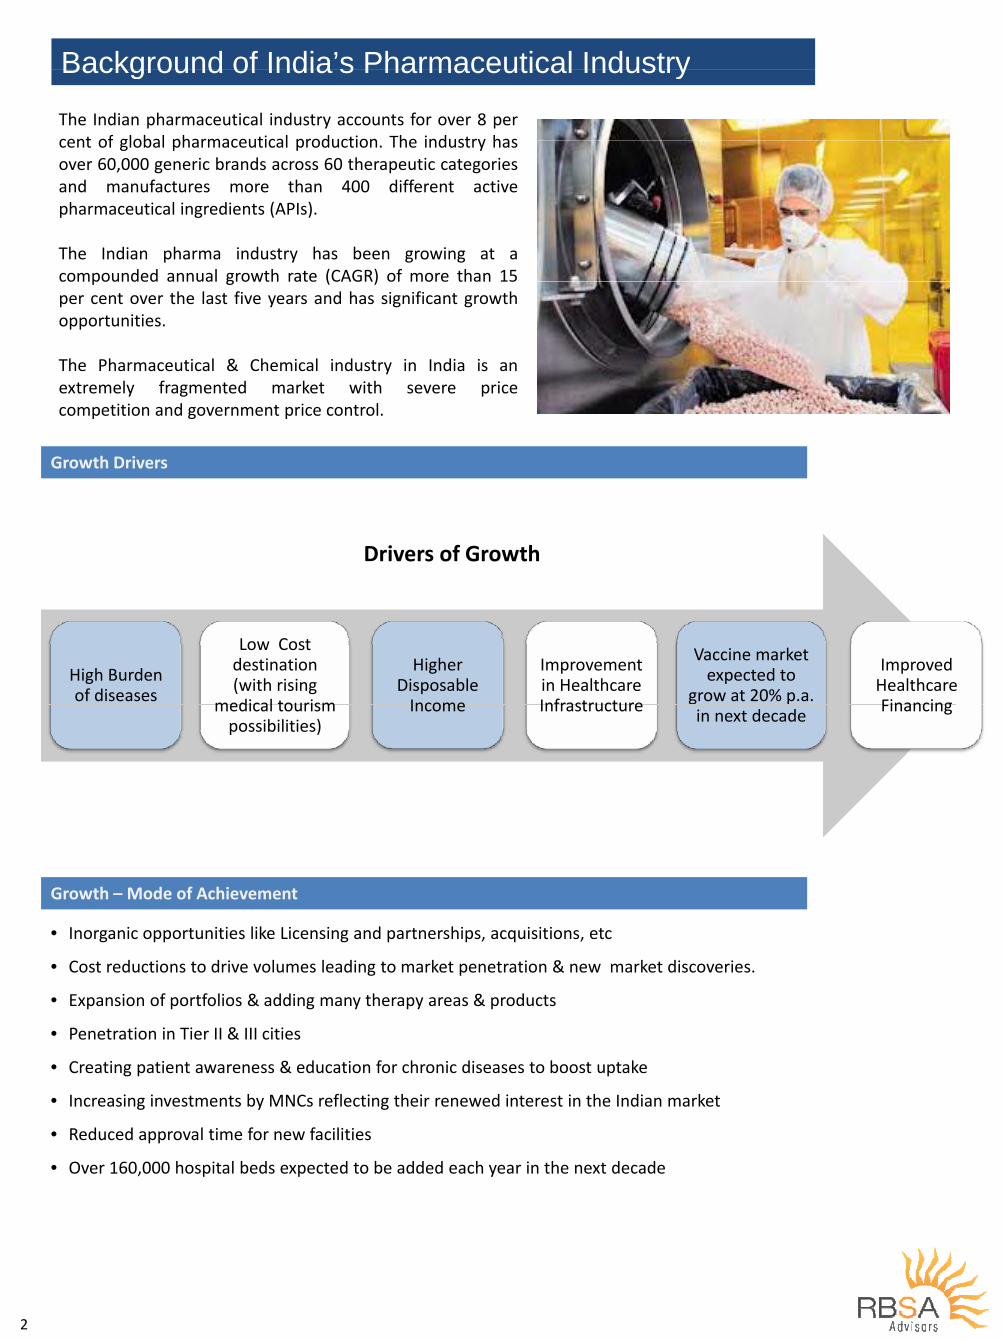
Background of India’s Pharmaceutical IndustryBackground of India s Pharmaceutical Industry
The Indian pharmaceutical industry accounts for over 8 percent of global pharmaceutical production The industry hascent of global pharmaceutical production. The industry hasover 60,000 generic brands across 60 therapeutic categoriesand manufactures more than 400 different activepharmaceutical ingredients (APIs)pharmaceutical ingredients (APIs).
The Indian pharma industry has been growing at acompounded annual growth rate (CAGR) of more than 15compounded annual growth rate (CAGR) of more than 15per cent over the last five years and has significant growthopportunities.
The Pharmaceutical & Chemical industry in India is anextremely fragmented market with severe pricecompetition and government price control.
Growth Drivers
Drivers of Growth
High Burden of diseases
Low Cost destination (with rising
medical tourism
Higher Disposable Income
Improvement in Healthcare Infrastructure
Vaccine market expected to
grow at 20% p.a.
Improved Healthcare Financingmedical tourism
possibilities)Income Infrastructure in next decade Financing
Growth – Mode of Achievement
• Inorganic opportunities like Licensing and partnerships, acquisitions, etc
• Cost reductions to drive volumes leading to market penetration & new market discoveries.
• Expansion of portfolios & adding many therapy areas & products
• Penetration in Tier II & III cities
• Creating patient awareness & education for chronic diseases to boost uptake
• Increasing investments by MNCs reflecting their renewed interest in the Indian market
d d l f f l• Reduced approval time for new facilities
• Over 160,000 hospital beds expected to be added each year in the next decade
2
Current Trends and PerformanceCurrent Trends and PerformanceBiotech
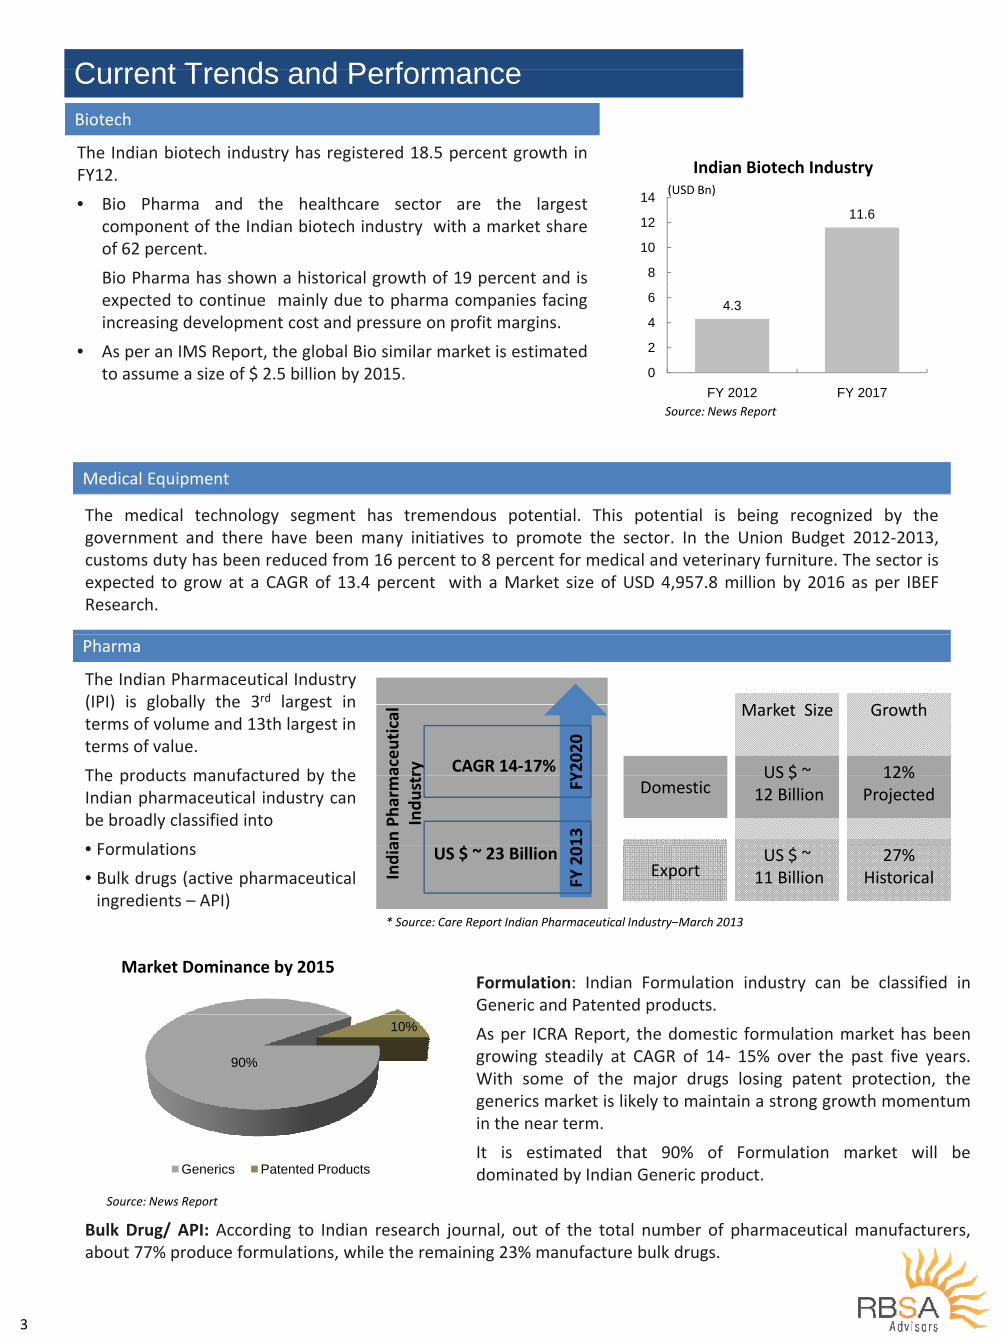
The Indian biotech industry has registered 18.5 percent growth inFY12.
• Bio Pharma and the healthcare sector are the largest 11 614
Indian Biotech Industry(USD Bn)
gcomponent of the Indian biotech industry with a market shareof 62 percent.
Bio Pharma has shown a historical growth of 19 percent and is
11.6
8
10
12
Bio Pharma has shown a historical growth of 19 percent and isexpected to continue mainly due to pharma companies facingincreasing development cost and pressure on profit margins.
• As per an IMS Report the global Bio similar market is estimated
4.3
2
4
6
• As per an IMS Report, the global Bio similar market is estimatedto assume a size of $ 2.5 billion by 2015. 0
FY 2012 FY 2017Source: News Report
Medical Equipment
The medical technology segment has tremendous potential. This potential is being recognized by thegovernment and there have been many initiatives to promote the sector. In the Union Budget 2012‐2013,customs duty has been reduced from 16 percent to 8 percent for medical and veterinary furniture. The sector iscustoms duty has been reduced from 16 percent to 8 percent for medical and veterinary furniture. The sector isexpected to grow at a CAGR of 13.4 percent with a Market size of USD 4,957.8 million by 2016 as per IBEFResearch.
The Indian Pharmaceutical Industry(IPI) is globally the 3rd largest in
Pharma
G hM k Si(IPI) is globally the 3 largest interms of volume and 13th largest interms of value.
The products manufactured by the aceu
tical
ry CAGR 14‐17% Y2020
Growth
12%
Market Size
US $ ~The products manufactured by theIndian pharmaceutical industry canbe broadly classified into
F l ti an Pha
rma
Indu
str
$
13 FY Domestic
12% Projected
US $ 12 Billion
• Formulations
• Bulk drugs (active pharmaceuticalingredients – API)
India US $ ~ 23 Billion
FY 20
ExportUS $ ~11 Billion
27%Historical
Formulation: Indian Formulation industry can be classified in
* Source: Care Report Indian Pharmaceutical Industry–March 2013
Market Dominance by 2015Formulation: Indian Formulation industry can be classified inGeneric and Patented products.
As per ICRA Report, the domestic formulation market has beengrowing steadily at CAGR of 14‐ 15% over the past five years90%
10%
growing steadily at CAGR of 14‐ 15% over the past five years.With some of the major drugs losing patent protection, thegenerics market is likely to maintain a strong growth momentumin the near term.
90%
in the near term.
It is estimated that 90% of Formulation market will bedominated by Indian Generic product.Generics Patented Products
S N R t
Bulk Drug/ API: According to Indian research journal, out of the total number of pharmaceutical manufacturers,about 77% produce formulations, while the remaining 23% manufacture bulk drugs.
Source: News Report
3

Global pharma firms have been under significant pressure to reduce prices due to limited growth opportunities in
Mergers and Acquisitions in Pharmaceutical Sector
their home markets, dwindling product pipelines, and regulatory constraints. These factors are pushing foreign firmsto look for growth outside their home markets.
I di i i k f h l b l h fi b f i billi l l i i i GDPIndia is seen as a attractive market for the global pharma firms because of its billion plus population, increasing GDP& per capita income, growing incidence of lifestyle diseases and greater coverage of medical insurance.
Due to the above two reasons pharma MNCs are willing to pay a significant premium for high quality pharma assetsDue to the above two reasons , pharma MNCs are willing to pay a significant premium for high‐quality pharma assetsin India. Thus, the Indian pharma industry is attracting premium valuation from the MNC`s.
Acquirer Target Sector Stake Size
Mylan Agila Specialities Pharmaceuticals NA USD 1.6 Mn
T i D S i tifi d JAS Di ti H lth NA USD 6 5 MTransasia Drew Scientific and JAS Diagnostics Healthcare NA USD 6.5 Mn
Trivitron Healthcare Ani Labsystems Healthcare NA INR 110 Cr
Shalby Hospitals Krishna Hospitals Healthcare 86 00% INR 75 CrShalby Hospitals Krishna Hospitals Healthcare 86.00% INR 75 Cr
Mylan SMS Pharmaceuticals Pharmaceuticals NA USD 33 Mn
Mitsui & Co Arch Pharmalabs Pharmaceuticals 25.00% INR 372 Cr
Hospira Inc.Orchid Chemicals and Pharmaceuticals
Pharmaceuticals NAUSD 200 Mn
U i d D Pl Bil Li i d GCS U i H l h NA USD 61 MUnited Drug Plc. Bilcare Limited ‐ GCS Unit Healthcare NA USD 61 Mn
Sun Pharmaceutical Taro Pharma Pharmaceuticals Buy‐Out USD571
Adcock Ingram Healthcare INR 70 8 CrAdcock Ingram Healthcare Private Limited
Cosme Farma Healthcare NAINR 70.8 Cr
Serum Institute of India Netherlands Vaccine Institute Healthcare NA INR 224 Cr
Piramal Healthcare Decision Resources Group Pharmaceuticals NA USD 635 Mn
Strides Arcolab Star Drugs ‐Manufacturing Plant Pharmaceuticals NA INR 125 Cr
Origio A/s Trivector Scientific Healthcare 51.00% USD 3.3 Mn
Aanjaneya Apex Drugs & Intermediates Pharmaceuticals NA INR 250 Cr
Table Source: News Reports
4
Industry Players Performance and Valuation MultiplesIndustry Players Performance and Valuation Multiples
MaHistorical PAT Margin argin C
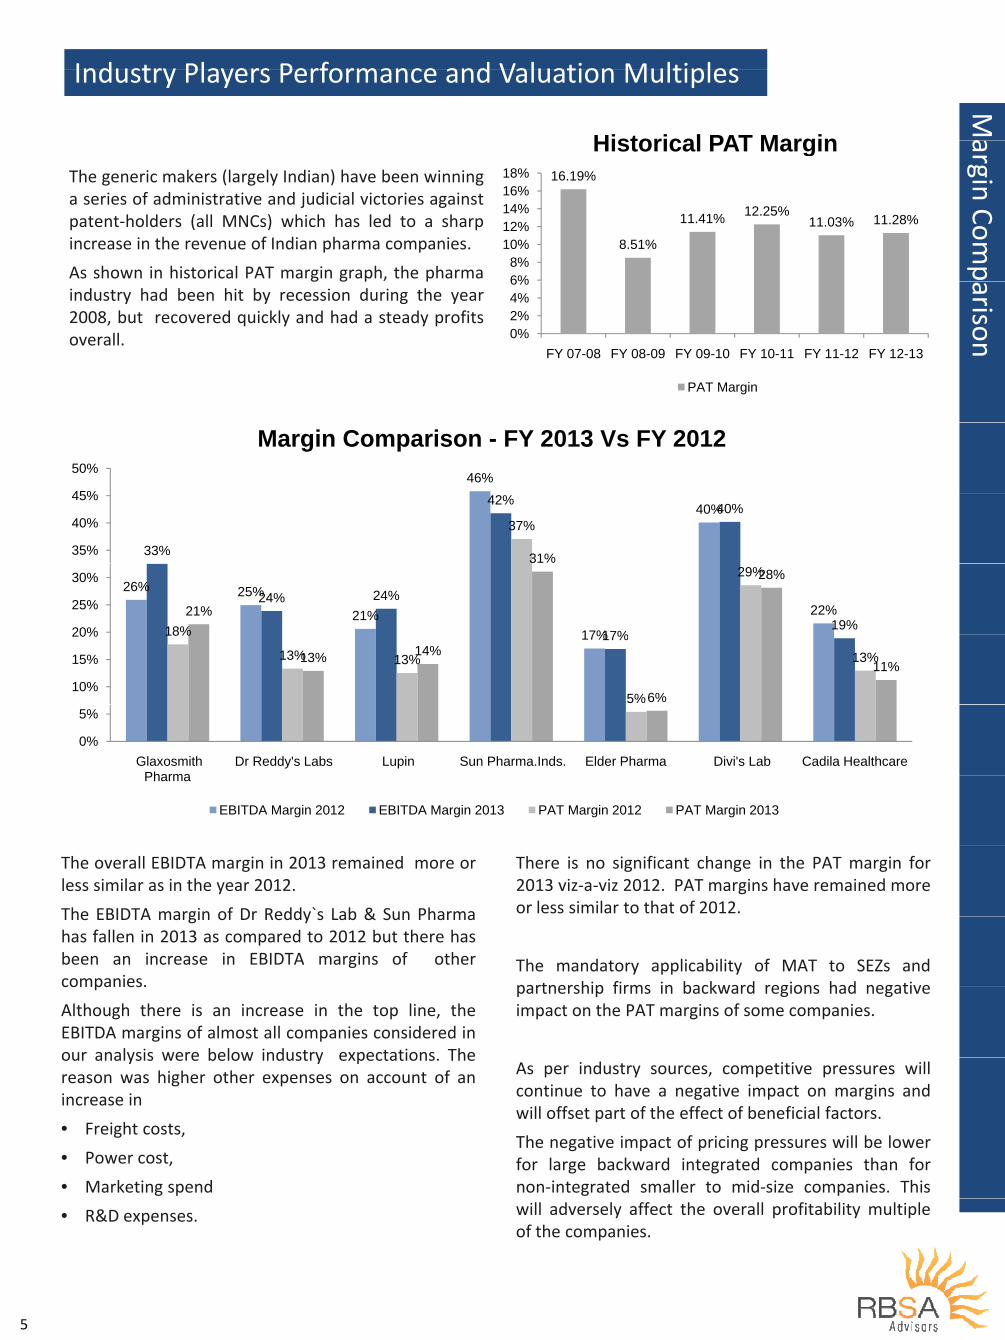
The generic makers (largely Indian) have been winninga series of administrative and judicial victories against
16.19%
12 25%14%16%18%
Historical PAT Margin
Comp
patent‐holders (all MNCs) which has led to a sharpincrease in the revenue of Indian pharma companies.
As shown in historical PAT margin graph, the pharma
8.51%
11.41% 12.25%11.03% 11.28%
6%8%
10%12%14%
arison
g g p pindustry had been hit by recession during the year2008, but recovered quickly and had a steady profitsoverall. 0%
2%4%6%
FY 07 08 FY 08 09 FY 09 10 FY 10 11 FY 11 12 FY 12 13
n
FY 07-08 FY 08-09 FY 09-10 FY 10-11 FY 11-12 FY 12-13
PAT Margin
46%45%
50%
Margin Comparison - FY 2013 Vs FY 2012
40%
33%
42% 40%37%
31%35%
40%
45%
26% 25%
21%17%
22%24% 24%
17%19%18%
29%
21%
28%
20%
25%
30%
17%17%18%
13% 13%
5%
13%13% 14%
6%
11%10%
15%
20%
0%
5%
Glaxosmith Pharma
Dr Reddy's Labs Lupin Sun Pharma.Inds. Elder Pharma Divi's Lab Cadila HealthcarePharma
EBITDA Margin 2012 EBITDA Margin 2013 PAT Margin 2012 PAT Margin 2013
The overall EBIDTA margin in 2013 remained more orless similar as in the year 2012.
The EBIDTA margin of Dr Reddy`s Lab & Sun Pharma
There is no significant change in the PAT margin for2013 viz‐a‐viz 2012. PAT margins have remained moreor less similar to that of 2012.The EBIDTA margin of Dr Reddy s Lab & Sun Pharma
has fallen in 2013 as compared to 2012 but there hasbeen an increase in EBIDTA margins of othercompanies.
The mandatory applicability of MAT to SEZs andpartnership firms in backward regions had negativecompanies.
Although there is an increase in the top line, theEBITDA margins of almost all companies considered inour analysis were below industry expectations The
partnership firms in backward regions had negativeimpact on the PAT margins of some companies.
our analysis were below industry expectations. Thereason was higher other expenses on account of anincrease in
• Freight costs
As per industry sources, competitive pressures willcontinue to have a negative impact on margins andwill offset part of the effect of beneficial factors.
• Freight costs,
• Power cost,
• Marketing spend
The negative impact of pricing pressures will be lowerfor large backward integrated companies than fornon‐integrated smaller to mid‐size companies. This
• R&D expenses. will adversely affect the overall profitability multipleof the companies.
5
Industry Players Performance and Valuation Multiples
E
Industry Players Performance and Valuation Multiples
EV/ Sal
Relationship between EBITDA Margins and EV/Sales Multiple FY 2013
les
Relationship between EBITDA Margins and EV/Sales Multiple –FY 2013
Sun Pharma
7 00 x
8.00 x
Glaxosmit Divi`s Lab
6.00 x
7.00 x
es
5.00 x
EV/Sal
Dr ReddyLupinCadila
3.00 x
4.00 x
Elder Pharma
2.00 x
Elder Pharma
0 00 x
1.00 x
0.00 x10% 15% 20% 25% 30% 35% 40% 45%
EBIDTA Margin
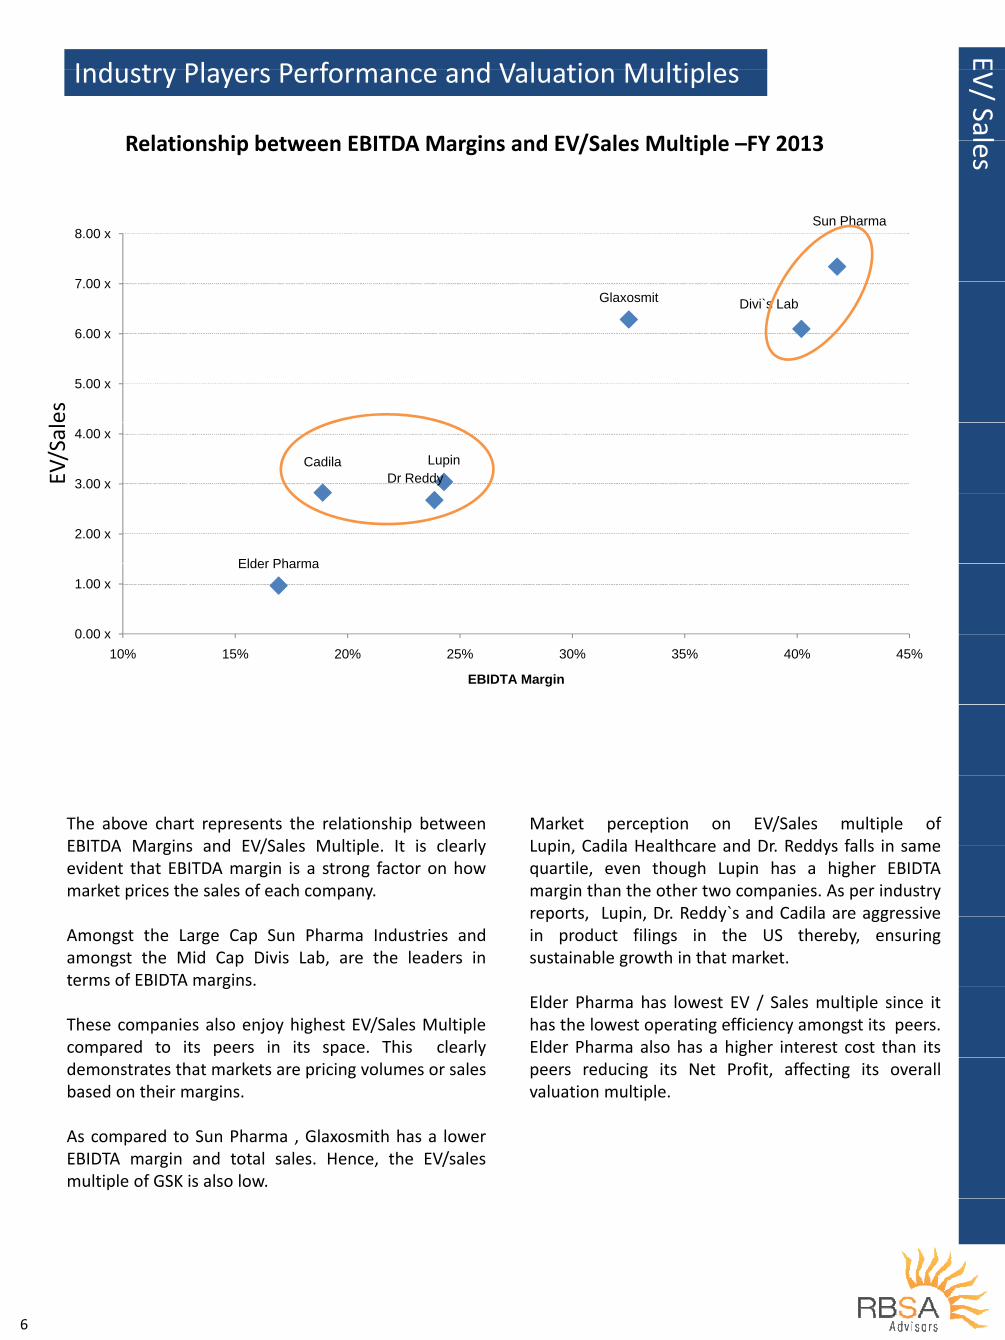
The above chart represents the relationship betweenEBITDA Margins and EV/Sales Multiple It is clearly
Market perception on EV/Sales multiple ofLupin Cadila Healthcare and Dr Reddys falls in sameEBITDA Margins and EV/Sales Multiple. It is clearly
evident that EBITDA margin is a strong factor on howmarket prices the sales of each company.
Lupin, Cadila Healthcare and Dr. Reddys falls in samequartile, even though Lupin has a higher EBIDTAmargin than the other two companies. As per industryreports Lupin Dr Reddy`s and Cadila are aggressive
Amongst the Large Cap Sun Pharma Industries andamongst the Mid Cap Divis Lab, are the leaders interms of EBIDTA margins.
reports, Lupin, Dr. Reddy s and Cadila are aggressivein product filings in the US thereby, ensuringsustainable growth in that market.
g
These companies also enjoy highest EV/Sales Multiplecompared to its peers in its space. This clearly
Elder Pharma has lowest EV / Sales multiple since ithas the lowest operating efficiency amongst its peers.Elder Pharma also has a higher interest cost than its
demonstrates that markets are pricing volumes or salesbased on their margins.
peers reducing its Net Profit, affecting its overallvaluation multiple.
As compared to Sun Pharma , Glaxosmith has a lowerEBIDTA margin and total sales. Hence, the EV/salesmultiple of GSK is also low.
6
Industry Players Performance and Valuation MultiplesIndustry Players Performance and Valuation Multiples
EV
8.65 xI d t A
V/ EBID
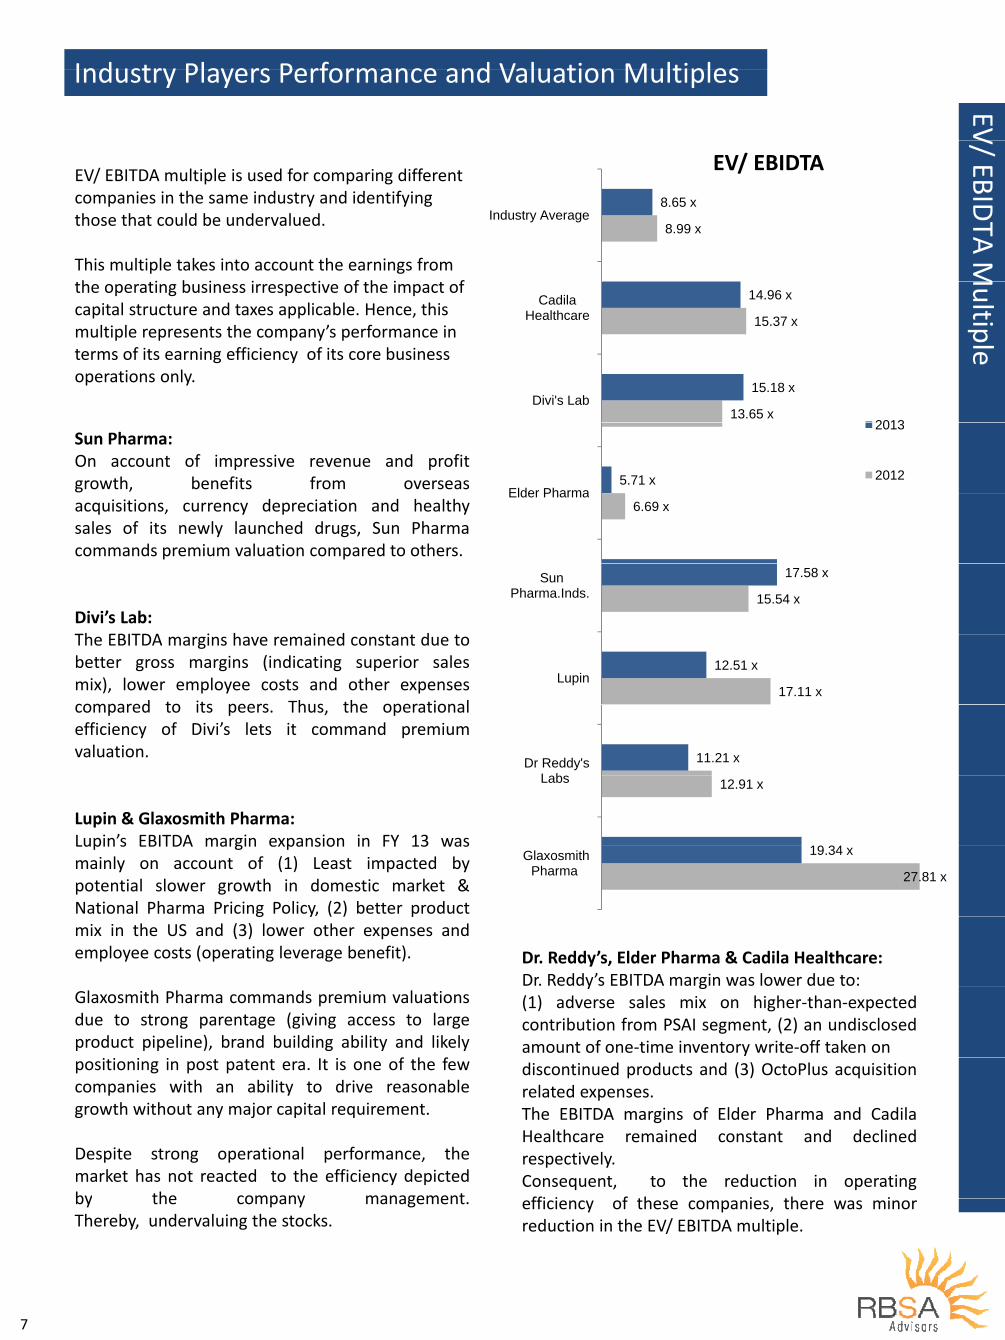
EV/ EBIDTAEV/ EBITDA multiple is used for comparing different companies in the same industry and identifying
8.99 xIndustry Average
DTA
M
those that could be undervalued.
This multiple takes into account the earnings from h i b i i i f h i f
15.37 x
14.96 xCadila Healthcare
Multipl
the operating business irrespective of the impact of capital structure and taxes applicable. Hence, this multiple represents the company’s performance in terms of its earning efficiency of its core business
13.65 x
15.18 xDivi's Lab
2013
eterms of its earning efficiency of its core business operations only.
5.71 xElder Pharma
2013
2012
Sun Pharma:On account of impressive revenue and profitgrowth, benefits from overseas
6.69 xElder Pharma
acquisitions, currency depreciation and healthysales of its newly launched drugs, Sun Pharmacommands premium valuation compared to others.
15.54 x
17.58 xSun Pharma.Inds.
Divi’s Lab:Th EBITDA i h i d d
17.11 x
12.51 xLupin
The EBITDA margins have remained constant due tobetter gross margins (indicating superior salesmix), lower employee costs and other expensescompared to its peers Thus the operational
11.21 xDr Reddy's L b
compared to its peers. Thus, the operationalefficiency of Divi’s lets it command premiumvaluation.
12.91 x
19 34
Labs
Lupin & Glaxosmith Pharma:Lupin’s EBITDA margin expansion in FY 13 was
27.81 x
19.34 xGlaxosmith Pharma
Lupin s EBITDA margin expansion in FY 13 wasmainly on account of (1) Least impacted bypotential slower growth in domestic market &National Pharma Pricing Policy, (2) better productg y ( ) pmix in the US and (3) lower other expenses andemployee costs (operating leverage benefit). Dr. Reddy’s, Elder Pharma & Cadila Healthcare:
Dr. Reddy’s EBITDA margin was lower due to:Glaxosmith Pharma commands premium valuationsdue to strong parentage (giving access to largeproduct pipeline), brand building ability and likely
f h f
y g(1) adverse sales mix on higher‐than‐expectedcontribution from PSAI segment, (2) an undisclosedamount of one‐time inventory write‐off taken on
positioning in post patent era. It is one of the fewcompanies with an ability to drive reasonablegrowth without any major capital requirement.
discontinued products and (3) OctoPlus acquisitionrelated expenses.The EBITDA margins of Elder Pharma and Cadila
Despite strong operational performance, themarket has not reacted to the efficiency depictedby the company management
Healthcare remained constant and declinedrespectively.Consequent, to the reduction in operatingffi i f th i th iby the company management.
Thereby, undervaluing the stocks.efficiency of these companies, there was minorreduction in the EV/ EBITDA multiple.
7

Industry Players Performance and Valuation MultiplesIndustry Players Performance and Valuation Multiples
Pr
B comparing price and earnings per share for a PE Multiple ice Ea
By comparing price and earnings per share for acompany, one can analyze the market's stockvaluation of a company and its shares relative tothe income the company is actually generating
PE Multiple
rning
the income the company is actually generating.
Companies with higher (or more certain)forecast earnings growth will usually have a higher
15.90 x
13.63 xIndustry Average
Multip
forecast earnings growth will usually have a higherP/E, and those expected to have lower (or riskier)earnings growth will usually have a lower P/E.
22 85 x
21.94 xCadila Healthcare ple
There is an overall decrease in the PE ratio of theindustry is due to pricing pressure and reduced
ti i
22.85 x
21 69 xoperating margins.
Sun Pharma:Sun Pharma has the highest market capitalization
19.09 x
21.69 xDivi's Lab
Sun Pharma has the highest market capitalizationamongst its peers. The PE ratio of Sun Pharma hasincreased compared to FY 12 because of itsimprovement in sequential growth and also a sharp 9.62 x
7.18 xElder Pharma
2013
2012improvement in sequential growth and also a sharpincrease of 63% YoY in its export business, whichcontributed close to 57% to its sales.
24.25 x
Divi's Lab:Divi's earns strong margins due to its global costand market leadership in some APIs (global market
19.84 xSun Pharma.Inds.
share of 50‐70%), pricing power and strongbackward integration. Due to promising growthprospect in near future Divis Lab PE ratio is greater 26.66 x
21.00 xLupin
than FY 12.
l i h h19.65 x
Dr Reddy's LabsGlaxoSmith Pharma:Despite significant increase in the EBIDTA and PATmargins of Glaxosmith Pharma, there has been afall in its PE multiple which indicates that the stock
22.92 xDr Reddy s Labs
fall in its PE multiple which indicates that the stockis undervalued.
Dr Reddy’s Lab:
45.27 x
33.00 xGlaxosmith Pharma
Dr. Reddy s Lab:The PAT margin of the company in FY 13 remainednearly constant as compared to FY 12 which led toreduction in its PE ratio.
Elder Pharma:The high interest cost burden and overall negativereduction in its PE ratio.
Lupin:There has been a reduction in interest cost due to
The high interest cost burden and overall negativesentiment in the stock market about the companymanagement has led to reduction in the P/Emultiple in FY 13.
repayment of debt. There has been a drastic fall ineffective tax rate that has led to increase in PAT.Despite a marginal increase in PAT margin, the PE
p
Cadila :The reduction in operating efficiency and increase
multiple has seen a reduction as compared to FY12.
in depreciation has led to marginal reduction in theP/E multiple in FY 13.
8 Note: All Financial data for calculation of multiple has been taken from public sources, annual reports or Capital Line.
Regulatory Issues & Government InitiativesRegulatory Issues & Government Initiatives
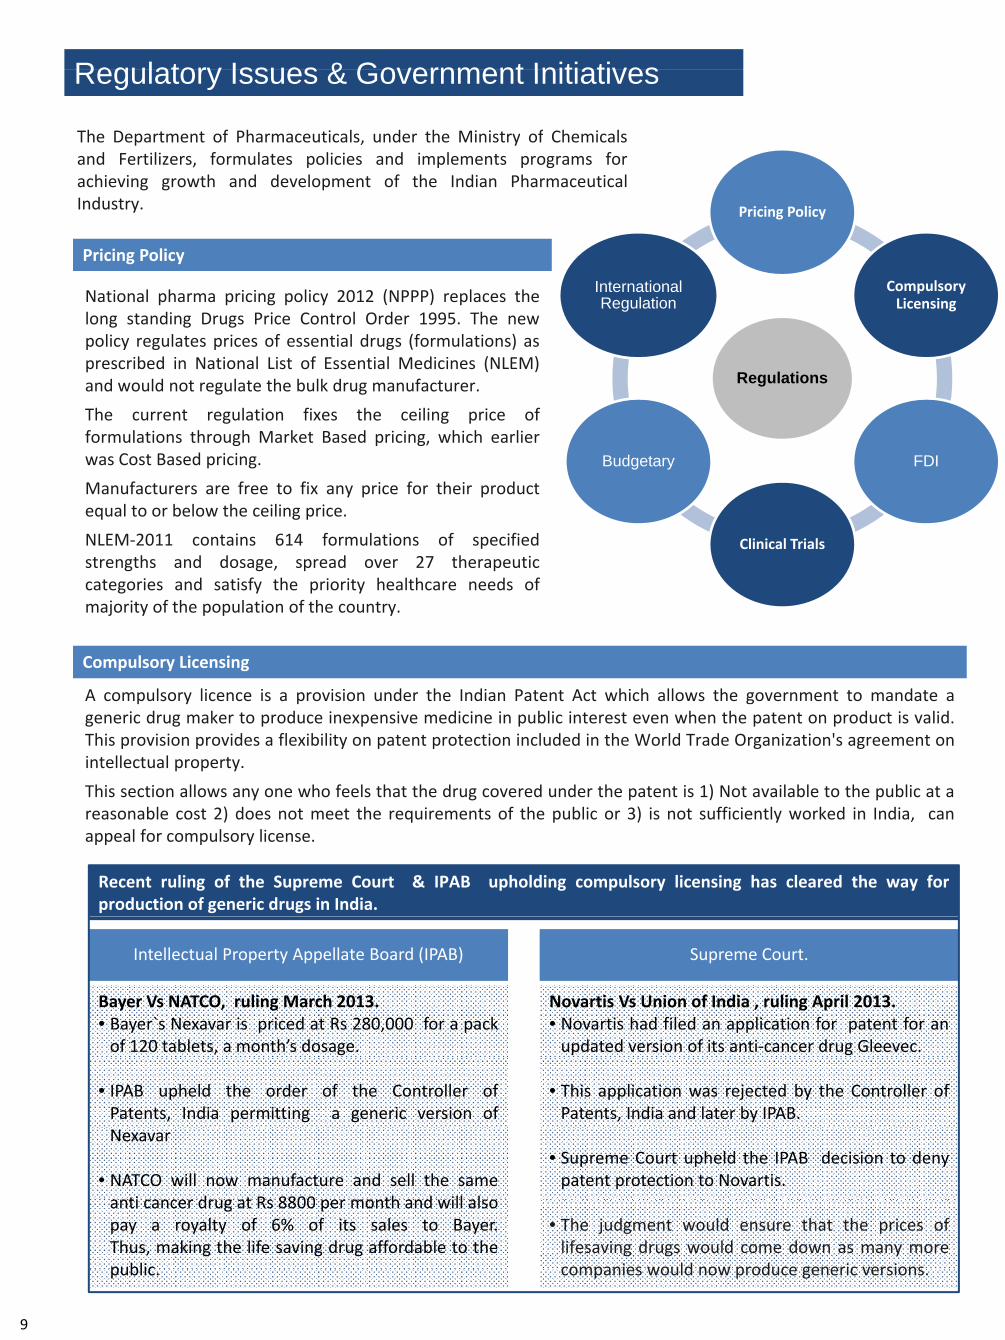
The Department of Pharmaceuticals, under the Ministry of Chemicals
Pricing Policy
The Department of Pharmaceuticals, under the Ministry of Chemicalsand Fertilizers, formulates policies and implements programs forachieving growth and development of the Indian PharmaceuticalIndustry. Pricing Policy
C lI t ti l
y
Pricing Policy
Compulsory Licensing
International RegulationNational pharma pricing policy 2012 (NPPP) replaces the
long standing Drugs Price Control Order 1995. The newpolicy regulates prices of essential drugs (formulations) as
Regulationsprescribed in National List of Essential Medicines (NLEM)and would not regulate the bulk drug manufacturer.
The current regulation fixes the ceiling price of
FDIBudgetary
g g pformulations through Market Based pricing, which earlierwas Cost Based pricing.
Manufacturers are free to fix any price for their product
Clinical Trials
Manufacturers are free to fix any price for their productequal to or below the ceiling price.
NLEM‐2011 contains 614 formulations of specifiedstrengths and dosage spread over 27 therapeuticstrengths and dosage, spread over 27 therapeuticcategories and satisfy the priority healthcare needs ofmajority of the population of the country.
A compulsory licence is a provision under the Indian Patent Act which allows the government to mandate a
Compulsory Licensing
generic drug maker to produce inexpensive medicine in public interest even when the patent on product is valid.This provision provides a flexibility on patent protection included in the World Trade Organization's agreement onintellectual property.
This section allows any one who feels that the drug covered under the patent is 1) Not available to the public at areasonable cost 2) does not meet the requirements of the public or 3) is not sufficiently worked in India, canappeal for compulsory license.
Recent ruling of the Supreme Court & IPAB upholding compulsory licensing has cleared the way forproduction of generic drugs in India.
Intellectual Property Appellate Board (IPAB) Supreme Court.
Bayer Vs NATCO, ruling March 2013.• Bayer`s Nexavar is priced at Rs 280,000 for a packof 120 tablets, a month’s dosage.
Novartis Vs Union of India , ruling April 2013.• Novartis had filed an application for patent for anupdated version of its anti‐cancer drug Gleevec.
• IPAB upheld the order of the Controller ofPatents, India permitting a generic version of
• This application was rejected by the Controller ofPatents, India and later by IPAB.
Nexavar
• NATCO will now manufacture and sell the sameti d t R 8800 th d ill l
• Supreme Court upheld the IPAB decision to denypatent protection to Novartis.
anti cancer drug at Rs 8800 per month and will alsopay a royalty of 6% of its sales to Bayer.Thus, making the life saving drug affordable to thepublic
• The judgment would ensure that the prices oflifesaving drugs would come down as many morecompanies would now produce generic versions
9
public. companies would now produce generic versions.
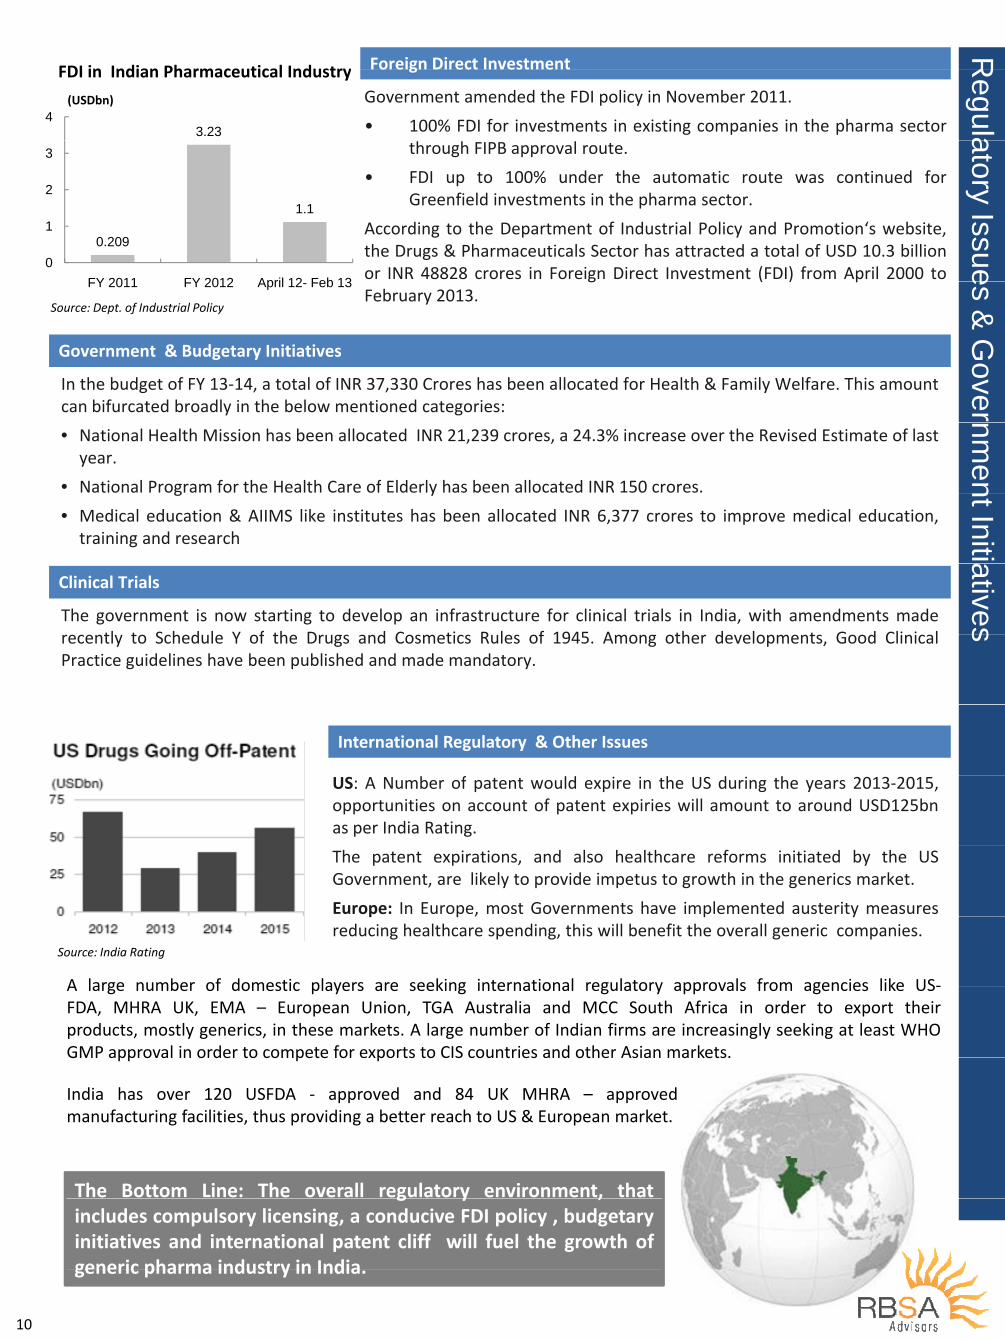
Foreign Direct Investment
RFDI in Indian Pharmaceutical Industry
Government amended the FDI policy in November 2011.
• 100% FDI for investments in existing companies in the pharma sector
g
Regula3.23
4
FDI in Indian Pharmaceutical Industry
(USDbn)
through FIPB approval route.
• FDI up to 100% under the automatic route was continued forGreenfield investments in the pharma sector.
atory 1 12
3
According to the Department of Industrial Policy and Promotion‘s website,the Drugs & Pharmaceuticals Sector has attracted a total of USD 10.3 billionor INR 48828 crores in Foreign Direct Investment (FDI) from April 2000 to
Issue
0.209
1.1
0
1
FY 2011 FY 2012 April 12 Feb 13 g ( ) pFebruary 2013.
es & G
Government & Budgetary Initiatives
FY 2011 FY 2012 April 12- Feb 13
Source: Dept. of Industrial Policy
Gover
In the budget of FY 13‐14, a total of INR 37,330 Crores has been allocated for Health & Family Welfare. This amountcan bifurcated broadly in the below mentioned categories:
Government & Budgetary Initiatives
nmen
• National Health Mission has been allocated INR 21,239 crores, a 24.3% increase over the Revised Estimate of lastyear.
• National Program for the Health Care of Elderly has been allocated INR 150 crores.
nt Initia
g y
• Medical education & AIIMS like institutes has been allocated INR 6,377 crores to improve medical education,training and research ativesThe government is now starting to develop an infrastructure for clinical trials in India, with amendments made
tl t S h d l Y f th D d C ti R l f 1945 A th d l t G d Cli i l
Clinical Trials
s
recently to Schedule Y of the Drugs and Cosmetics Rules of 1945. Among other developments, Good ClinicalPractice guidelines have been published and made mandatory.
International Regulatory & Other Issues
US: A Number of patent would expire in the US during the years 2013‐2015,opportunities on account of patent expiries will amount to around USD125bnas per India Rating.
The patent expirations, and also healthcare reforms initiated by the USGovernment, are likely to provide impetus to growth in the generics market.
Europe: In Europe, most Governments have implemented austerity measuresp p , p yreducing healthcare spending, this will benefit the overall generic companies.
Source: India Rating
A large number of domestic players are seeking international regulatory approvals from agencies like US‐A large number of domestic players are seeking international regulatory approvals from agencies like US‐FDA, MHRA UK, EMA – European Union, TGA Australia and MCC South Africa in order to export theirproducts, mostly generics, in these markets. A large number of Indian firms are increasingly seeking at least WHOGMP approval in order to compete for exports to CIS countries and other Asian markets.
India has over 120 USFDA ‐ approved and 84 UK MHRA – approvedmanufacturing facilities, thus providing a better reach to US & European market.
GMP approval in order to compete for exports to CIS countries and other Asian markets.
The Bottom Line: The overall regulatory environment, thatg y ,includes compulsory licensing, a conducive FDI policy , budgetaryinitiatives and international patent cliff will fuel the growth ofgeneric pharma industry in India
10
generic pharma industry in India.

Industry Players Performancey y
Sun Pharmaceuticals Limited
20%
Stock Performance viz‐a‐viz IndexSun Pharmaceuticals Limited is aninternational specialty pharma company
15%
20%having four business segments ‐ IndianBranded Generics, USGenerics, International Branded
5%
10%Generics and Active PharmaceuticalIngredients (API).
Th C l d th i iti f
‐5%
0%The Company closed the acquisition of:‐ URL Pharma Inc’s generic business inthe US with the portfolio of 107products represented by over 230
‐10%
BSE Healthcare BSE Index Sun Phama
products represented by over 230Abbreviated New Drug Applications(ANDA).‐ DUSA Pharmaceutical Inc a specialtyDUSA Pharmaceutical Inc, a specialtydermatology company in the US.
The annual sales of the company has grown by 40% in FYThe annual sales of the company has grown by 40% in FY2012 whereas the EBITDA & PAT margins have jumped by59% & 56% respectively.
11238.8912000
INR inCrores
Sales and Profitability Analysis
In FY 2013, India branded generic sales were at Rs 2,966crores. Also, US finished dosage sales at US$ 1,132 milliongrew by 56% (in US$ terms) over previous year whereas
8019.498000
10000
International formulation sales at US$ 281 million grew by21%.
5727.9
3674.724695.4
2972 73 3494 344000
6000
The management has stated that despite the outperformance by a wide margin for eight consecutivequarters ending December 2012 by its Israel’s subsidiary
h i l h h i l l
2314.681907.37
2972.73 3494.34
0
2000
Taro Pharmaceuticals, the current growth rate is clearlyunsustainable. The price hike in specific products has beena function of capacity glut and the management does notexpect the dynamic to sustain
FY 2011 FY 2012 FY 2013
Total Net Sales EBITDA PAT expect the dynamic to sustain.
Although there has been increase in the Sales &Profitability in FY 2013, there is a reduction in
Profitability Ratio AnalysisEBITDA & PAT margins compared to FY 2012.
Sun Pharma plans to file about 25 ANDAs for FY14.R&D t d t b d 6 8% f
40%46%
42%40%
45%
50%
y y
R&D expenses are expected to be around 6‐8% ofsales while the management expects an overallcapex at Rs.800 crores. 33%
37% 31%
25%
30%
35%
40%
Recently, Sun Pharma announced that it will payPfizer Inc and Japan‐based Takeda $550 million tosettle a patent infringement suit in the US on 5%
10%
15%
20%
settle a patent infringement suit in the US ongeneric pantoprazole. 0%
FY 2011 FY 2012 FY 2013
PAT Margin (%) EBITDA Margin (%)
11
PAT Margin (%) EBITDA Margin (%)
Industry Players Performancey y
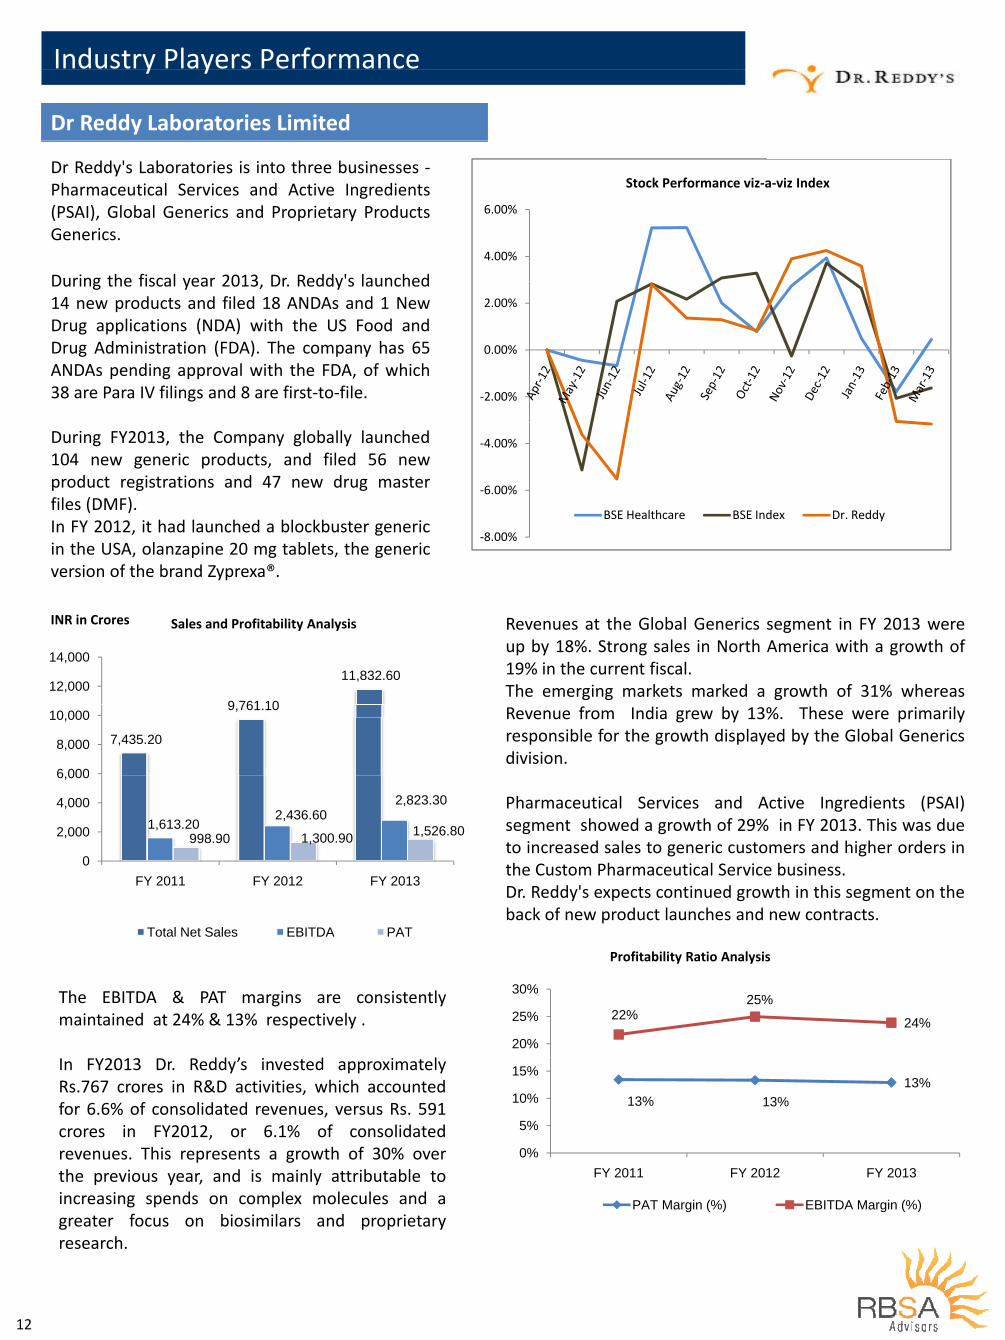
Dr Reddy Laboratories Limited
Dr Reddy's Laboratories is into three businesses ‐Pharmaceutical Services and Active Ingredients(PSAI) Global Generics and Proprietary Products 6 00%
Stock Performance viz‐a‐viz Index
(PSAI), Global Generics and Proprietary ProductsGenerics.
4.00%
6.00%
During the fiscal year 2013 Dr Reddy's launched
0 00%
2.00%
During the fiscal year 2013, Dr. Reddy s launched14 new products and filed 18 ANDAs and 1 NewDrug applications (NDA) with the US Food andDrug Administration (FDA). The company has 65
‐2.00%
0.00%Drug Administration (FDA). The company has 65ANDAs pending approval with the FDA, of which38 are Para IV filings and 8 are first‐to‐file.
‐6.00%
‐4.00%During FY2013, the Company globally launched104 new generic products, and filed 56 newproduct registrations and 47 new drug master
‐8.00%
6.00%
BSE Healthcare BSE Index Dr. Reddy files (DMF).In FY 2012, it had launched a blockbuster genericin the USA, olanzapine 20 mg tablets, the genericversion of the brand Zyprexa®.
Revenues at the Global Generics segment in FY 2013 wereINR in Crores Sales and Profitability Analysis
up by 18%. Strong sales in North America with a growth of19% in the current fiscal.The emerging markets marked a growth of 31% whereas
9 761 10
11,832.60 12,000
14,000
Revenue from India grew by 13%. These were primarilyresponsible for the growth displayed by the Global Genericsdivision.
7,435.20
9,761.10
6 000
8,000
10,000
Pharmaceutical Services and Active Ingredients (PSAI)segment showed a growth of 29% in FY 2013. This was dueto increased sales to generic customers and higher orders in
1,613.20 2,436.60
2,823.30
998.90 1,300.90 1,526.80 2,000
4,000
6,000
to increased sales to generic customers and higher orders inthe Custom Pharmaceutical Service business.Dr. Reddy's expects continued growth in this segment on theback of new product launches and new contracts
0FY 2011 FY 2012 FY 2013
back of new product launches and new contracts.Total Net Sales EBITDA PAT
30%
Profitability Ratio Analysis
The EBITDA & PAT margins are consistentlymaintained at 24% & 13% respectively .
dd ’ d l
22%25%
24%20%
25%
30%
In FY2013 Dr. Reddy’s invested approximatelyRs.767 crores in R&D activities, which accountedfor 6.6% of consolidated revenues, versus Rs. 591
i FY2012 6 1% f lid t d
13% 13%13%
5%
10%
15%
crores in FY2012, or 6.1% of consolidatedrevenues. This represents a growth of 30% overthe previous year, and is mainly attributable toincreasing spends on complex molecules and a
0%
5%
FY 2011 FY 2012 FY 2013
increasing spends on complex molecules and agreater focus on biosimilars and proprietaryresearch.
PAT Margin (%) EBITDA Margin (%)
12
Industry Players Performancey y
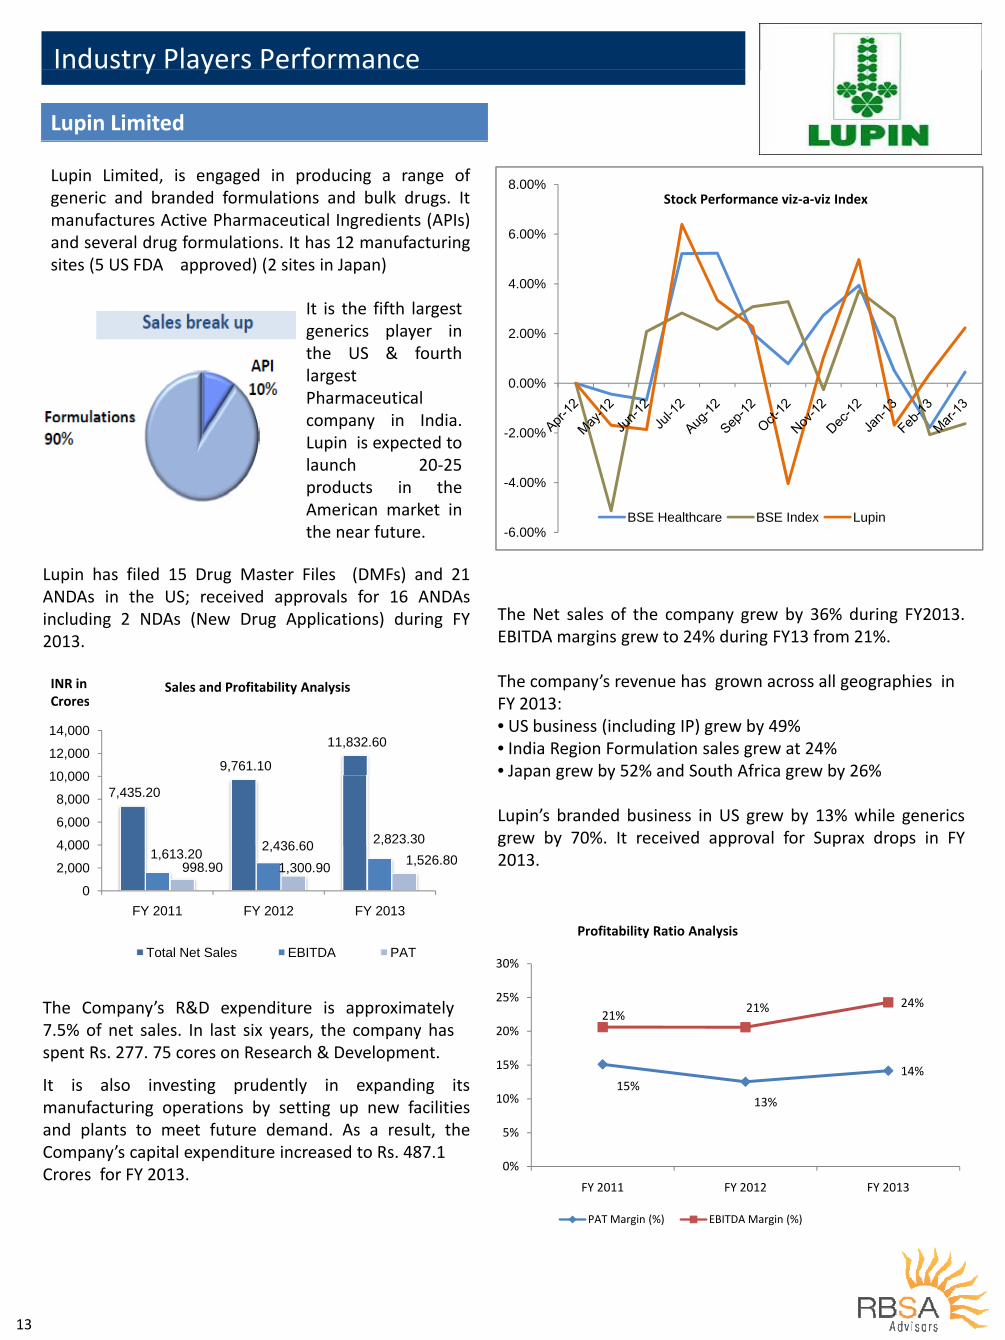
Lupin Limited
Lupin Limited, is engaged in producing a range ofgeneric and branded formulations and bulk drugs. It
8.00%Stock Performance viz‐a‐viz Index
manufactures Active Pharmaceutical Ingredients (APIs)and several drug formulations. It has 12 manufacturingsites (5 US FDA approved) (2 sites in Japan)
4 00%
6.00%
2.00%
4.00%
It is the fifth largestgenerics player inthe US & fourth
0.00%
the US & fourthlargestPharmaceuticalcompany in India
-4.00%
-2.00%company in India.Lupin is expected tolaunch 20‐25products in the
-6.00%BSE Healthcare BSE Index Lupin
p oducts t eAmerican market inthe near future.
The Net sales of the company grew by 36% during FY2013.EBITDA margins grew to 24% during FY13 from 21%
Lupin has filed 15 Drug Master Files (DMFs) and 21ANDAs in the US; received approvals for 16 ANDAsincluding 2 NDAs (New Drug Applications) during FY
EBITDA margins grew to 24% during FY13 from 21%.
The company’s revenue has grown across all geographies in FY 2013:
INR inCrores
Sales and Profitability Analysis
2013.
FY 2013:• US business (including IP) grew by 49%• India Region Formulation sales grew at 24%• Japan grew by 52% and South Africa grew by 26%9,761.10
11,832.60
10 000
12,000
14,000
Crores
Japan grew by 52% and South Africa grew by 26%
Lupin’s branded business in US grew by 13% while genericsgrew by 70%. It received approval for Suprax drops in FY
7,435.20
2 436 60 2,823.30 4 000
6,000
8,000
10,000
g y pp p p2013.1,613.20 2,436.60
998.90 1,300.90 1,526.80
0
2,000
4,000
FY 2011 FY 2012 FY 2013
Total Net Sales EBITDA PAT 30%
Profitability Ratio Analysis
The Company’s R&D expenditure is approximately7.5% of net sales. In last six years, the company hasspent Rs. 277. 75 cores on Research & Development.
21%21% 24%
20%
25%
spent Rs. 277. 75 cores on Research & Development.
It is also investing prudently in expanding itsmanufacturing operations by setting up new facilitiesand plants to meet future demand As a result the
15%13%
14%
%
10%
15%
and plants to meet future demand. As a result, theCompany’s capital expenditure increased to Rs. 487.1Crores for FY 2013. 0%
5%
FY 2011 FY 2012 FY 2013
PAT Margin (%) EBITDA Margin (%)
13
Industry Players Performance
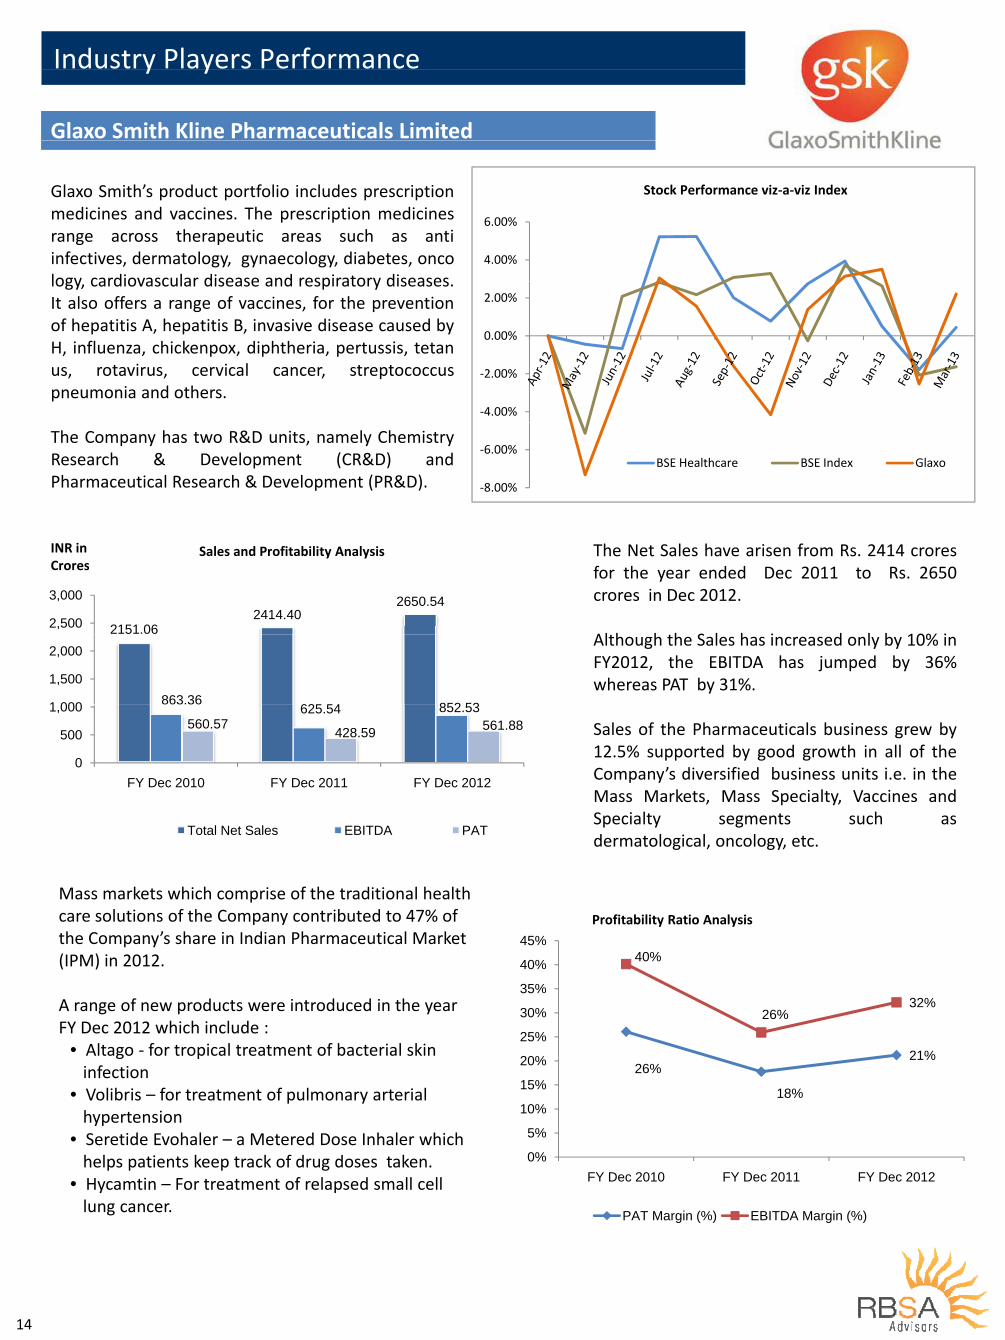
Glaxo Smith Kline Pharmaceuticals Limited
y y
Stock Performance viz‐a‐viz IndexGlaxo Smith’s product portfolio includes prescriptionmedicines and vaccines The prescription medicines
4.00%
6.00%medicines and vaccines. The prescription medicinesrange across therapeutic areas such as antiinfectives, dermatology, gynaecology, diabetes, oncology cardiovascular disease and respiratory diseases
0.00%
2.00%logy, cardiovascular disease and respiratory diseases.It also offers a range of vaccines, for the preventionof hepatitis A, hepatitis B, invasive disease caused byH, influenza, chickenpox, diphtheria, pertussis, tetan
‐4.00%
‐2.00%
H, influenza, chickenpox, diphtheria, pertussis, tetanus, rotavirus, cervical cancer, streptococcuspneumonia and others.
‐8.00%
‐6.00%BSE Healthcare BSE Index Glaxo
The Company has two R&D units, namely ChemistryResearch & Development (CR&D) andPharmaceutical Research & Development (PR&D).
The Net Sales have arisen from Rs. 2414 croresINR inCrores
Sales and Profitability Analysis
for the year ended Dec 2011 to Rs. 2650crores in Dec 2012.
Al h h h S l h i d l b 10% i2151.06
2414.402650.54
2,500
3,000
Crores
Although the Sales has increased only by 10% inFY2012, the EBITDA has jumped by 36%whereas PAT by 31%.
863.36625 54 852 531 000
1,500
2,000
Sales of the Pharmaceuticals business grew by12.5% supported by good growth in all of theCompany’s diversified business units i e in the
625.54 852.53560.57 428.59 561.88
0
500
1,000
Company s diversified business units i.e. in theMass Markets, Mass Specialty, Vaccines andSpecialty segments such asdermatological, oncology, etc.
FY Dec 2010 FY Dec 2011 FY Dec 2012
Total Net Sales EBITDA PAT dermatological, oncology, etc.
P fit bilit R ti A l i
Mass markets which comprise of the traditional health care solutions of the Company contributed to 47% of
40%
35%
40%
45%Profitability Ratio Analysiscare solutions of the Company contributed to 47% of
the Company’s share in Indian Pharmaceutical Market (IPM) in 2012.
21%
26%32%
20%
25%
30%
35%A range of new products were introduced in the year FY Dec 2012 which include :
• Altago ‐ for tropical treatment of bacterial skin 26%
18%
21%
%
10%
15%
20%g p
infection• Volibris – for treatment of pulmonary arterial hypertension
0%
5%
FY Dec 2010 FY Dec 2011 FY Dec 2012
• Seretide Evohaler – a Metered Dose Inhaler which helps patients keep track of drug doses taken.
• Hycamtin – For treatment of relapsed small cell
PAT Margin (%) EBITDA Margin (%)lung cancer.
14
Industry Players Performance
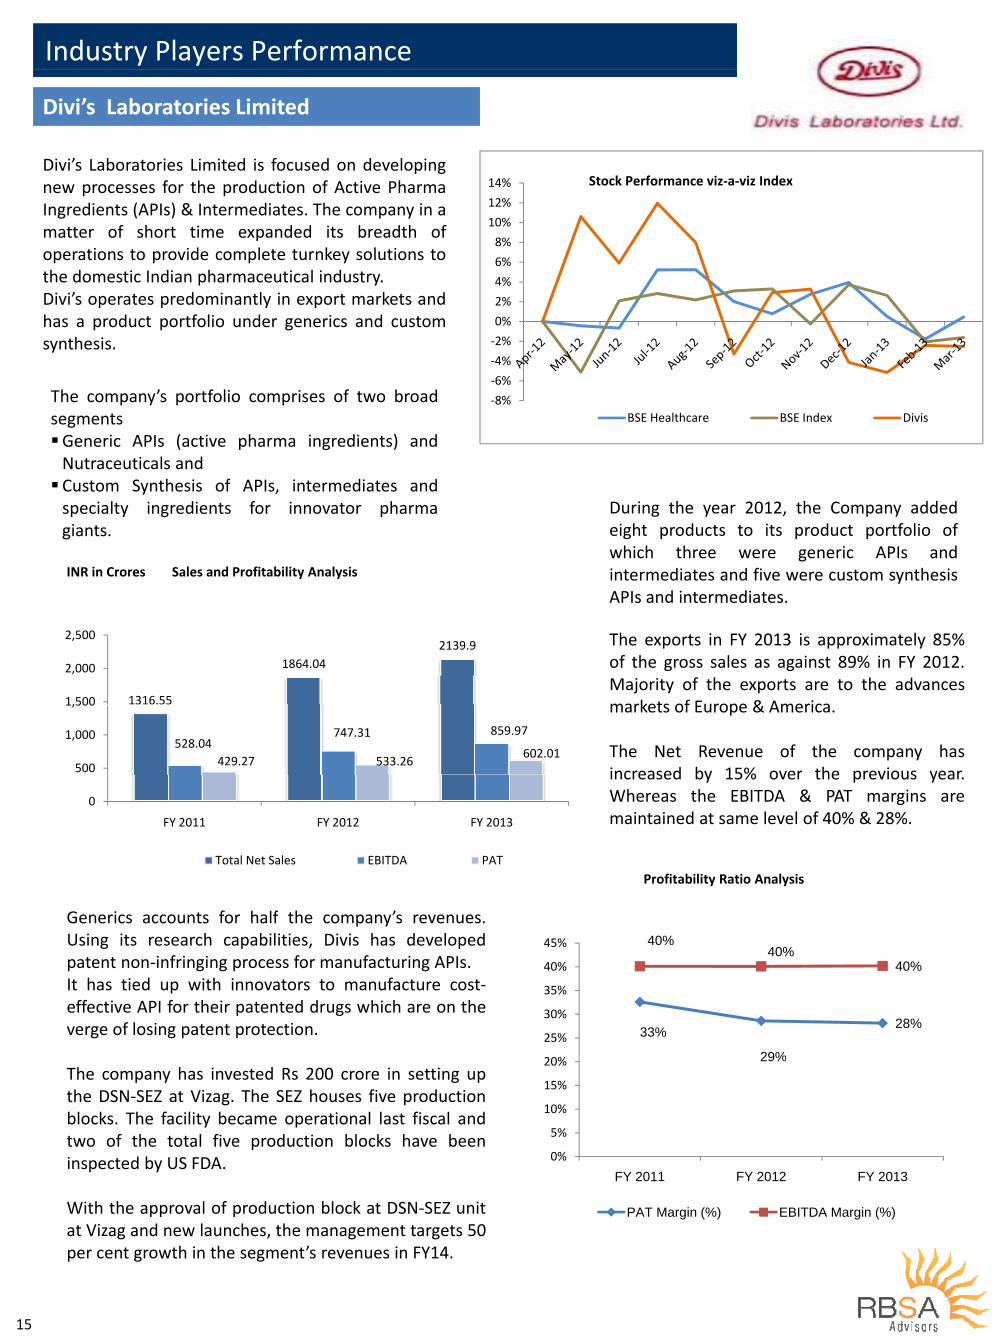
Divi’s Laboratories Limited
12%
14% Stock Performance viz‐a‐viz IndexDivi’s Laboratories Limited is focused on developingnew processes for the production of Active PharmaIngredients (APIs) & Intermediates The company in a
4%
6%
8%
10%Ingredients (APIs) & Intermediates. The company in amatter of short time expanded its breadth ofoperations to provide complete turnkey solutions tothe domestic Indian pharmaceutical industry.
‐2%
0%
2%
4%the domestic Indian pharmaceutical industry.Divi’s operates predominantly in export markets andhas a product portfolio under generics and customsynthesis.
‐8%
‐6%
‐4%
BSE Healthcare BSE Index Divis
y
The company’s portfolio comprises of two broadsegmentssegmentsGeneric APIs (active pharma ingredients) andNutraceuticals andCustom Synthesis of APIs, intermediates andy ,specialty ingredients for innovator pharmagiants.
During the year 2012, the Company addedeight products to its product portfolio ofwhich three were generic APIs andintermediates and five were custom synthesisAPIs and intermediates.
Th i FY 2013 i i l 85%2 500
INR in Crores Sales and Profitability Analysis
The exports in FY 2013 is approximately 85%of the gross sales as against 89% in FY 2012.Majority of the exports are to the advancesmarkets of Europe & America1316.55
1864.042139.9
1,500
2,000
2,500
markets of Europe & America.
The Net Revenue of the company hasincreased by 15% over the previous year
528.04747.31 859.97
429.27 533.26602.01
500
1,000
1,500
increased by 15% over the previous year.Whereas the EBITDA & PAT margins aremaintained at same level of 40% & 28%.
0
FY 2011 FY 2012 FY 2013
Profitability Ratio AnalysisTotal Net Sales EBITDA PAT
Generics accounts for half the company’s revenues40%
40%40%
35%
40%
45%
Generics accounts for half the company s revenues.Using its research capabilities, Divis has developedpatent non‐infringing process for manufacturing APIs.It has tied up with innovators to manufacture cost‐
33%
29%
28%
20%
25%
30%
35%It has tied up with innovators to manufacture costeffective API for their patented drugs which are on theverge of losing patent protection.
29%
10%
15%
20%The company has invested Rs 200 crore in setting upthe DSN‐SEZ at Vizag. The SEZ houses five productionblocks. The facility became operational last fiscal and
0%
5%
FY 2011 FY 2012 FY 2013
two of the total five production blocks have beeninspected by US FDA.
PAT Margin (%) EBITDA Margin (%)With the approval of production block at DSN‐SEZ unitat Vizag and new launches, the management targets 50per cent growth in the segment’s revenues in FY14.
15
Industry Players Performance
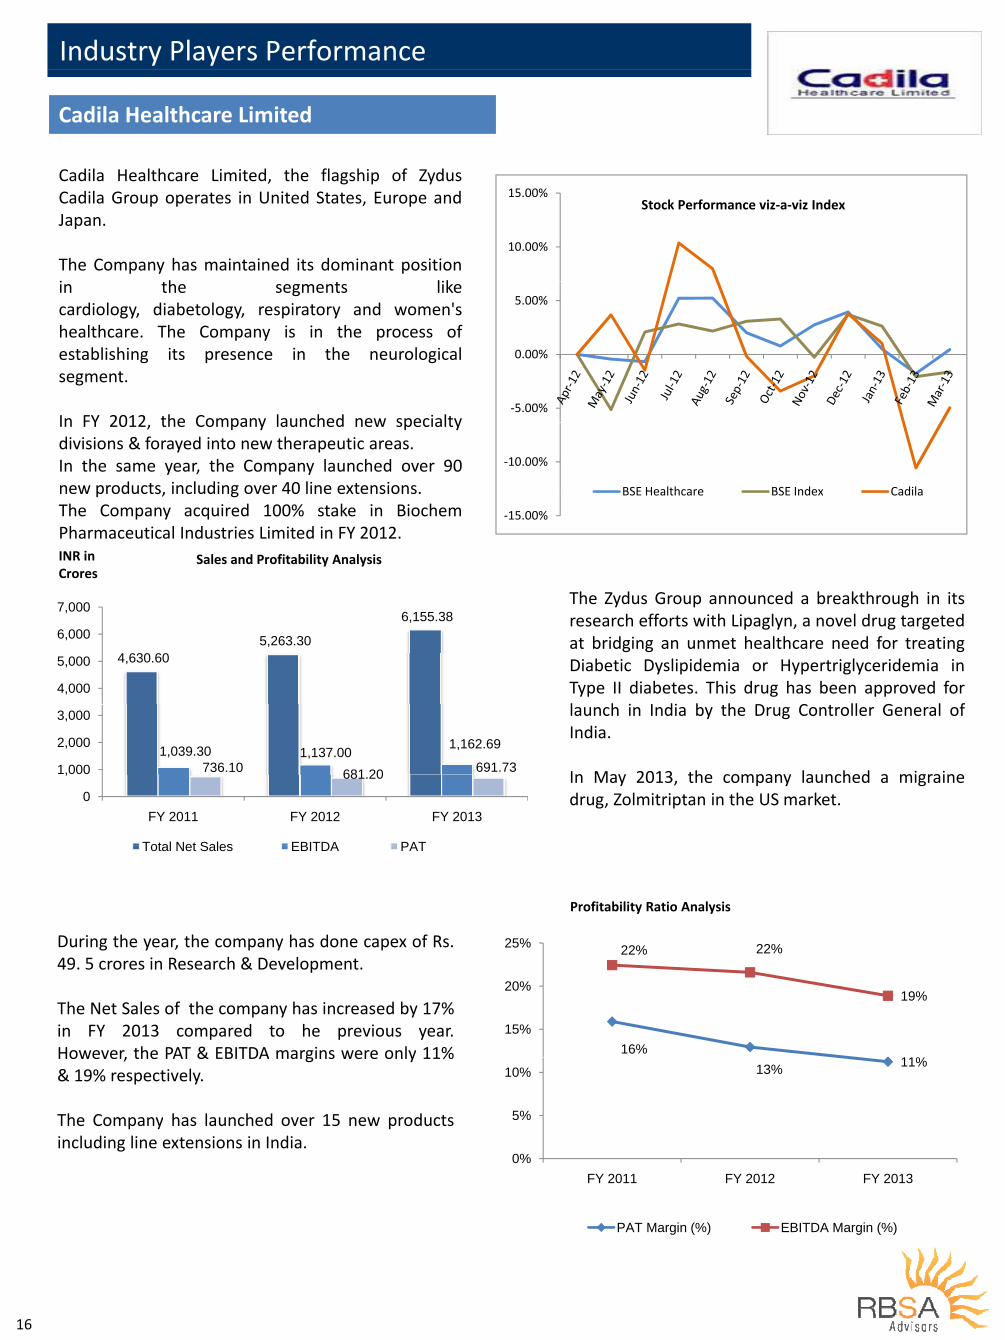
Cadila Healthcare Limited
15.00%Stock Performance viz‐a‐viz Index
Cadila Healthcare Limited, the flagship of ZydusCadila Group operates in United States, Europe and
10.00%
Japan.
The Company has maintained its dominant positioni h lik
0 00%
5.00%in the segments likecardiology, diabetology, respiratory and women'shealthcare. The Company is in the process ofestablishing its presence in the neurological
‐5.00%
0.00%establishing its presence in the neurologicalsegment.
In FY 2012 the Company launched new specialty
‐10.00%
BSE Healthcare BSE Index Cadila
In FY 2012, the Company launched new specialtydivisions & forayed into new therapeutic areas.In the same year, the Company launched over 90new products, including over 40 line extensions.
‐15.00%
BSE Healthcare BSE Index Cadilanew products, including over 40 line extensions.The Company acquired 100% stake in BiochemPharmaceutical Industries Limited in FY 2012.INR in Sales and Profitability Analysis
6,155.38 6 000
7,000
CroresSales and Profitability Analysis
The Zydus Group announced a breakthrough in itsresearch efforts with Lipaglyn, a novel drug targeted
4,630.60 5,263.30
4,000
5,000
6,000 at bridging an unmet healthcare need for treatingDiabetic Dyslipidemia or Hypertriglyceridemia inType II diabetes. This drug has been approved forl h i I di b h D C ll G l f
1,039.30 1,137.00 1,162.69
736.10 681 20 691.73 1,000
2,000
3,000 launch in India by the Drug Controller General ofIndia.
In May 2013 the company launched a migraine681.20
0
,
FY 2011 FY 2012 FY 2013
Total Net Sales EBITDA PAT
In May 2013, the company launched a migrainedrug, Zolmitriptan in the US market.
Total Net Sales EBITDA PAT
Profitability Ratio Analysis
During the year, the company has done capex of Rs.49. 5 crores in Research & Development.
22% 22%
20%
25%
The Net Sales of the company has increased by 17%in FY 2013 compared to he previous year.However, the PAT & EBITDA margins were only 11% 16%
11%
19%
15%
20%
However, the PAT & EBITDA margins were only 11%& 19% respectively.
The Company has launched over 15 new products
13% 11%
5%
10%
p y pincluding line extensions in India.
0%FY 2011 FY 2012 FY 2013
PAT Margin (%) EBITDA Margin (%)
16
Industry Players Performance
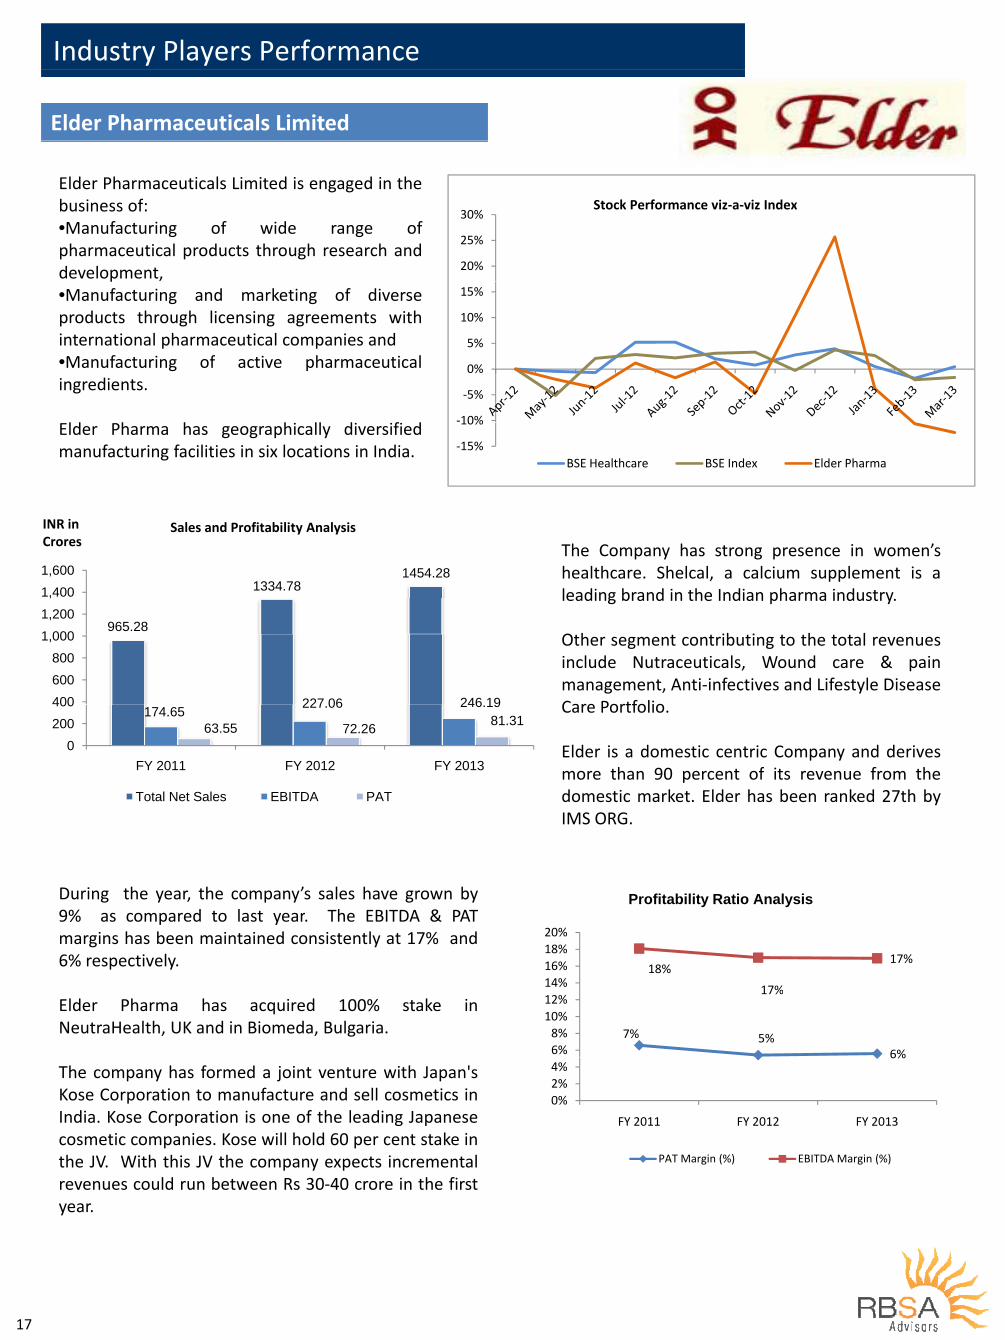
Elder Pharmaceuticals Limited
Elder Pharmaceuticals Limited is engaged in thebusiness of: 30%
Stock Performance viz‐a‐viz Indexbusiness of:•Manufacturing of wide range ofpharmaceutical products through research anddevelopment, 20%
25%
30%
p•Manufacturing and marketing of diverseproducts through licensing agreements withinternational pharmaceutical companies and 5%
10%
15%
•Manufacturing of active pharmaceuticalingredients.
ld h h h ll d f d ‐10%
‐5%
0%
Elder Pharma has geographically diversifiedmanufacturing facilities in six locations in India. ‐15%
10%
BSE Healthcare BSE Index Elder Pharma
The Company has strong presence in women’s
INR inCrores
Sales and Profitability Analysis
healthcare. Shelcal, a calcium supplement is aleading brand in the Indian pharma industry.
O h ib i h l965.28
1334.781454.28
1 0001,2001,4001,600
Other segment contributing to the total revenuesinclude Nutraceuticals, Wound care & painmanagement, Anti‐infectives and Lifestyle DiseaseCare Portfolio227 06 246 19400
600800
1,000
Care Portfolio.
Elder is a domestic centric Company and derivesmore than 90 percent of its revenue from the
174.65 227.06 246.19
63.55 72.26 81.31
0200400
FY 2011 FY 2012 FY 2013 more than 90 percent of its revenue from thedomestic market. Elder has been ranked 27th byIMS ORG.
Total Net Sales EBITDA PAT
During the year, the company’s sales have grown by9% as compared to last year The EBITDA & PAT
Profitability Ratio Analysis9% as compared to last year. The EBITDA & PATmargins has been maintained consistently at 17% and6% respectively. 18%
17%
17%
14%16%18%20%
Elder Pharma has acquired 100% stake inNeutraHealth, UK and in Biomeda, Bulgaria. 7% 5%
6%
17%
6%8%
10%12%
%
The company has formed a joint venture with Japan'sKose Corporation to manufacture and sell cosmetics inIndia. Kose Corporation is one of the leading Japanese
6%
0%2%4%
FY 2011 FY 2012 FY 2013
cosmetic companies. Kose will hold 60 per cent stake inthe JV. With this JV the company expects incrementalrevenues could run between Rs 30‐40 crore in the first
PAT Margin (%) EBITDA Margin (%)
year.
17

GlossaryGlossary
AIIMS All‐India Institute of Medical SciencesAPI Active Pharmaceutical Ingredients ANDA Abbreviated New Drug Applications BV Book ValueB / b Billi ( )Bn / bn Billion (s)CAGR Compounded Annual Growth RateCIS Commonwealth of Independent StatesCapex Capital ExpenditureCapex Capital ExpenditureEBITDA Earnings before interest, tax, depreciation and amortizationEBIT Earnings before interest and taxEMA The European Medical AgencyEMA The European Medical AgencyEV Enterprise ValueGCP Good Clinical Practice GDP Gross Domestic ProductGDP Gross Domestic ProductGMP Good Manufacturing PracticeIBEF Indian Brand Equity FoundationICRA An associate of Moody`s Investor service(formerly Investment Information y ( yand Credit Rating Agency)INR Indian National RupeesIPAB Intellectual Property Appellate Board Mn. Million(s)Market Cap Market capitalizationMAT Minimum Alternate TaxMCC Medicines Control CouncilMHRA‐UK Medicines and Healthcare products Regulatory AgencyMI Minority Interest/ D t ith t li bl t il bln/a Data either not applicable or not available
n.p. Data not providedNAV Net Asset ValueNLEM National List of Essential MedicinesNLEM National List of Essential Medicines NPPP National pharma pricing policy 2012 No Number ofPSAI Pharmaceutical Services and Active IngredientsPSAI Pharmaceutical Services and Active Ingredients PAT Profit after taxROW Rest of the WorldSEZ Special Economic ZonepTGA Therapeutic Goods AdministrationUK The United KingdomeUS The United States of AmericaUSD United States DollarUS‐FDA United States‐ Food and Drugs AdministrationWHO World Health Organization.
18 Note: All Financial data for calculation of multiple has been taken from public sources, annual reports or Capital Line,

Contact Us
Mumbai Office: Delhi Office : Bangalore Office:21-23, T.V. Industrial Estate, 248 -A, S.K. Ahire Marg, Off. Dr. A. B. Road, Worli, Mumbai – 400 030
602, Ashoka Estate,24 Barakhambha Road,New Delhi – 110 001
#15,3rd-A Cross Road, Seethappa Layout,Near Naga Ganapathi, ,
Tel : +91 22 2494 0150-54Fax: +91 22 2494 0154
Tel : +91 11 2335 0635g p
Temple, ManorayanapalyaR.T. Nagar Post,Bangalore- 560032Bangalore 560032Tel : +91 97435 50600
Ahmedabad Office:912, Venus Atlantis Corporate Park, Anand Nagar
Surat Office:37, 3rd Floor, Meher Park, ‘A’, Athwa Gate, Ring
Jaipur office:Karmayog, A-8, Metal Colony,Sikar Road, g
Rd, Prahaladnagar, Ahmedabad –380 015Tel : +91 79 4050 6000
gRoad, Surat – 395 001Tel : +91 261 246 4491Fax : +91 261 301 6366
Jaipur – 302 023Tel : +91 141 233 5892Fax : +91 141 233 5279
Fax : +91 79 4050 6001
Global Reach:Global Reach:
Singapore Bahrain Dubai
Contact:Tel: +91 90040 50600T l 971 5 5478 6464Tel: +971 5 5478 6464Email: [email protected]
Disclaimer :To the extent this report relates to information prepared by RBSA Advisors, it is furnished to the recipient for advertising andgeneral information purposes only. This report and other research material may also be found on our website at www.rbsa.in.Each recipient should conduct its own investigation and analysis of any such information contained in this report. No recipient is
l d l h k f d h f kentitled to rely on the work of RBSA contained in this report for any purpose. RBSA makes no representations or warrantiesregarding the accuracy or completeness of such information and expressly disclaims any and all liabilities based on suchinformation or on omissions there from
19