Embed Size (px)
Citation preview

Raisio’s interim report January-September 2014
CEO Matti Rihko
Raisio plc
4 November 2014 Q3/2014

2
• Group EBIT EUR 12.1 million*
• Strong units of the Brands Division further improved their performance
• Raisioagro’s relative profitability improved as a result of the restructuring
• The UK’s cereals and snacks business returned to profit
• Russia’s EBIT improved
• Good activity in Benemilk
*EBIT excluding one-off items
Raisio’s Q3/2014 in brief

Group’s EBIT
3
12.0 12.1
0
2
4
6
8
10
0
5
10
15
Q3/2013 Q3/2014
%
EBIT EBIT %
Excluding one-off items M€
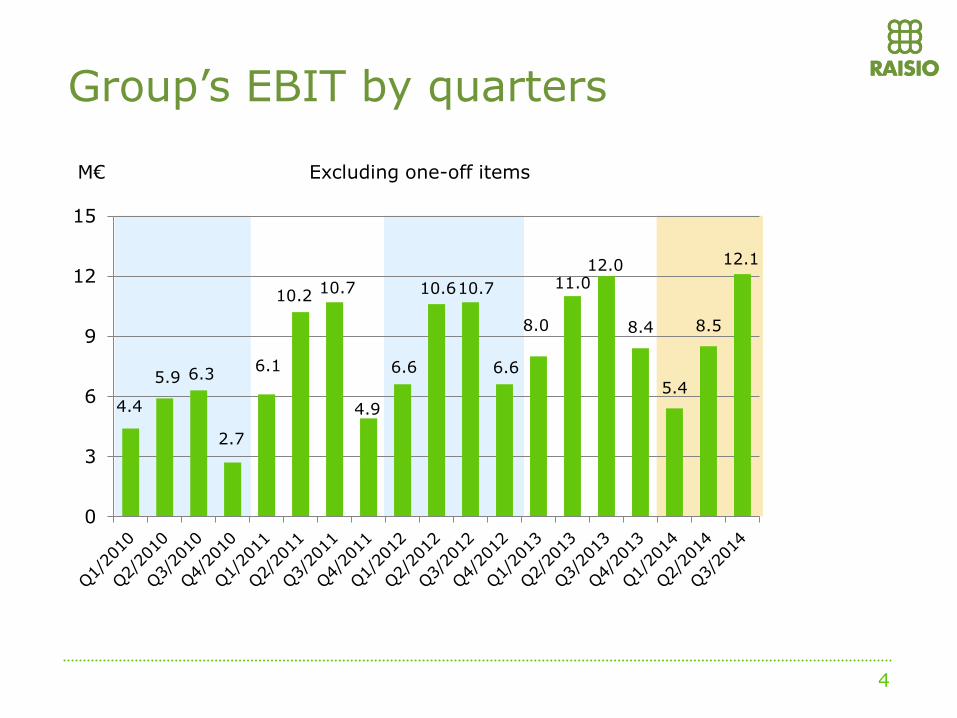
Excluding one-off items
Group’s EBIT by quarters
M€
4
4.4
5.9 6.3
2.7
6.1
10.2 10.7
4.9
6.6
10.6 10.7
6.6
8.0
11.0 12.0
8.4
5.4
8.5
12.1
0
3
6
9
12
15

19.2
31.8
34.6 39.3
31.0
25.9
0
1
2
3
4
5
6
7
8
0
10
20
30
40
50
2010 2011 2012 2013 1-9/2013 1-9/2014
EBIT EBIT %
Group’s EBIT
M€ %
5
Excluding one-off items

0
100
200
300
400
500
600
700
2010 2011 2012 2013 1-9/2013 1-9/2014
Group’s net sales
6
M€
424
553 584 558
426 376
Brands Raisioagro
0
100
200
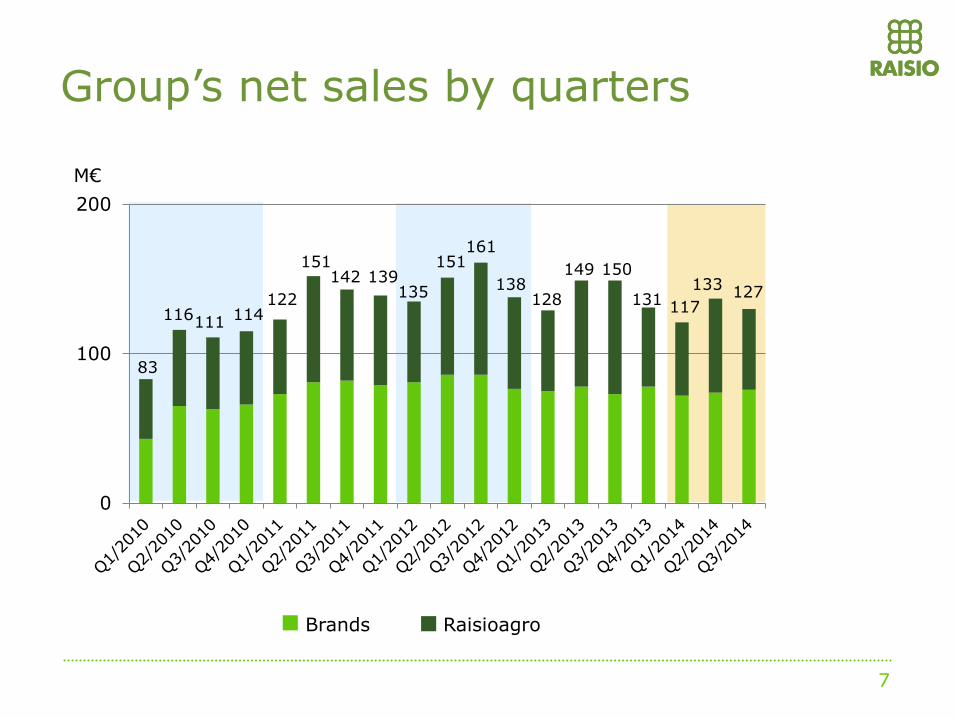
116 114 122
111
83
151 142 139
135
151 161
138 128
149 150
131 117
133 127
Group’s net sales by quarters
7
M€
Brands Raisioagro
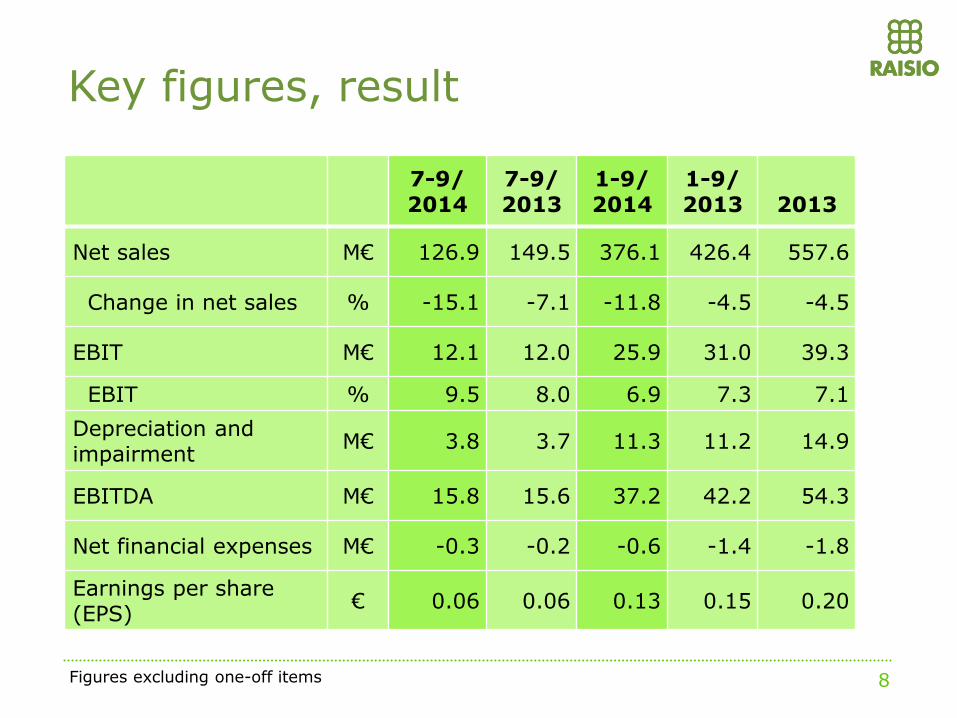
Key figures, result
7-9/ 2014
7-9/ 2013
1-9/ 2014
1-9/ 2013
2013
Net sales M€ 126.9 149.5 376.1 426.4 557.6
Change in net sales % -15.1 -7.1 -11.8 -4.5 -4.5
EBIT M€ 12.1 12.0 25.9 31.0 39.3
EBIT % 9.5 8.0 6.9 7.3 7.1
Depreciation and impairment
M€ 3.8 3.7 11.3 11.2 14.9
EBITDA M€ 15.8 15.6 37.2 42.2 54.3
Net financial expenses M€ -0.3 -0.2 -0.6 -1.4 -1.8
Earnings per share (EPS)
€ 0.06 0.06 0.13 0.15 0.20
8 Figures excluding one-off items
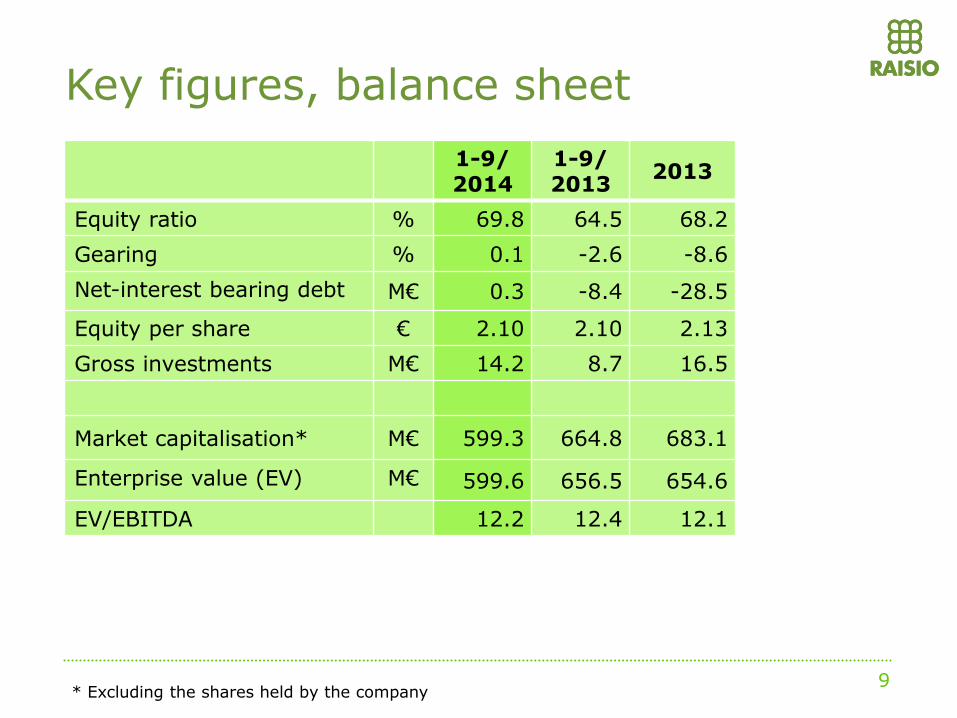
Key figures, balance sheet
1-9/ 2014
1-9/ 2013
2013
Equity ratio % 69.8 64.5 68.2
Gearing % 0.1 -2.6 -8.6
Net-interest bearing debt M€ 0.3 -8.4 -28.5
Equity per share € 2.10 2.10 2.13
Gross investments M€ 14.2 8.7 16.5
Market capitalisation* M€ 599.3 664.8 683.1
Enterprise value (EV) M€ 599.6 656.5 654.6
EV/EBITDA 12.2 12.4 12.1
9 * Excluding the shares held by the company

10
Brands
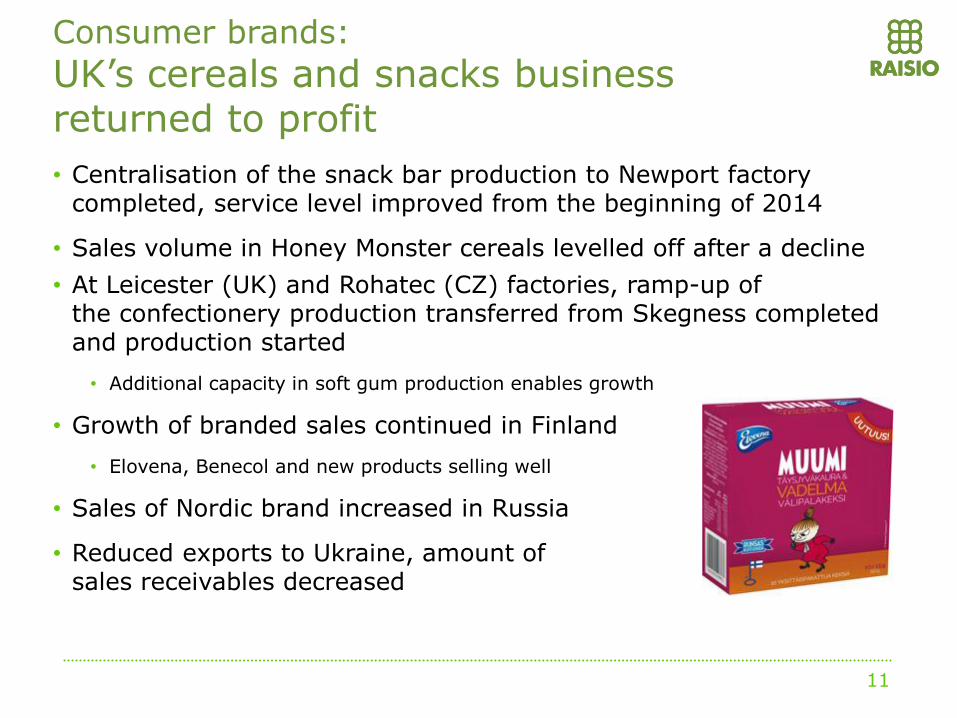
• Centralisation of the snack bar production to Newport factory completed, service level improved from the beginning of 2014
• Sales volume in Honey Monster cereals levelled off after a decline
• At Leicester (UK) and Rohatec (CZ) factories, ramp-up of the confectionery production transferred from Skegness completed and production started
• Additional capacity in soft gum production enables growth
• Growth of branded sales continued in Finland
• Elovena, Benecol and new products selling well
• Sales of Nordic brand increased in Russia
• Reduced exports to Ukraine, amount of sales receivables decreased
Consumer brands:
UK’s cereals and snacks business returned to profit
11
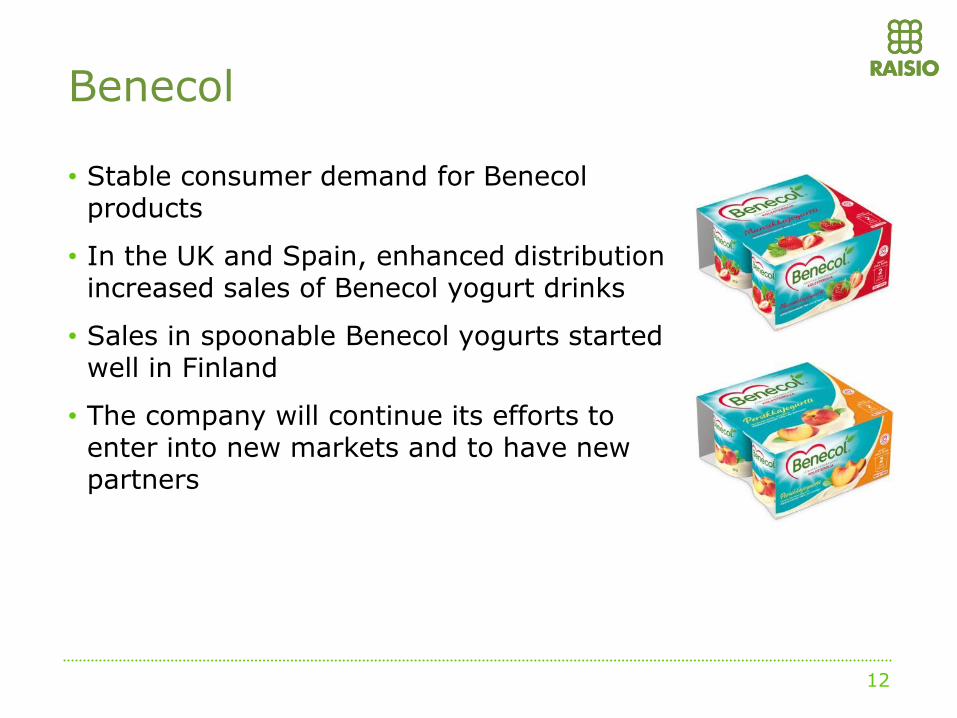
• Stable consumer demand for Benecol products
• In the UK and Spain, enhanced distribution increased sales of Benecol yogurt drinks
• Sales in spoonable Benecol yogurts started well in Finland
• The company will continue its efforts to enter into new markets and to have new partners
Benecol
12

Benemilk
• Benemilk is conducting numerous commercial negotiations in Asia, Oceania, Europe and North America
• We have proceeded with several partner candidates to the planning and implementation of feeding trials conducted with independent research institutes
• First commercial Benemilk launches possible in 2015
13
World’s most successful sustainable food and feed licensing company
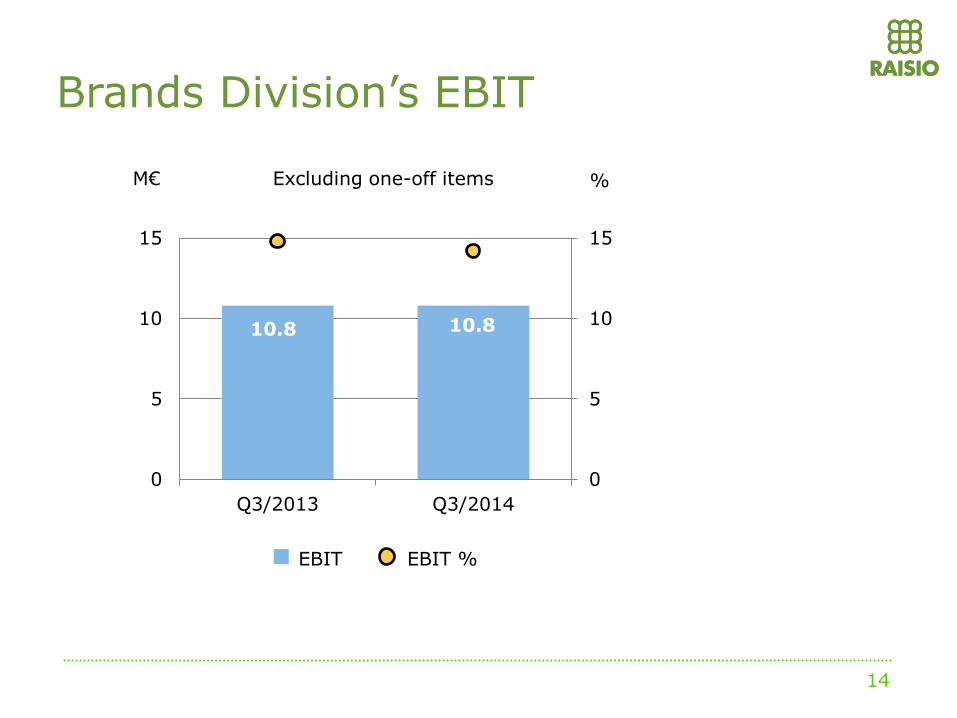
Brands Division’s EBIT
14
10.8 10.8
0
5
10
15
0
5
10
15
Q3/2013 Q3/2014
%
EBIT EBIT %
Excluding one-off items M€

Excluding one-off items
Brands Division’s EBIT by quarters
15
M€
5.8
8.4
10.4
6.6
9.0
11.0
9.7
7.6
9.4
11.1 10.8 10.0
6.4
8.2
10.8
0
4
8
12

20.0
31.2
37.4 41.4
31.3
25.3
0
2
4
6
8
10
12
14
16
0
10
20
30
40
50
2010 2011 2012 2013 1-9/2013 1-9/2014
EBIT EBIT %
Brands Division’s EBIT
16
M€ % Excluding one-off items
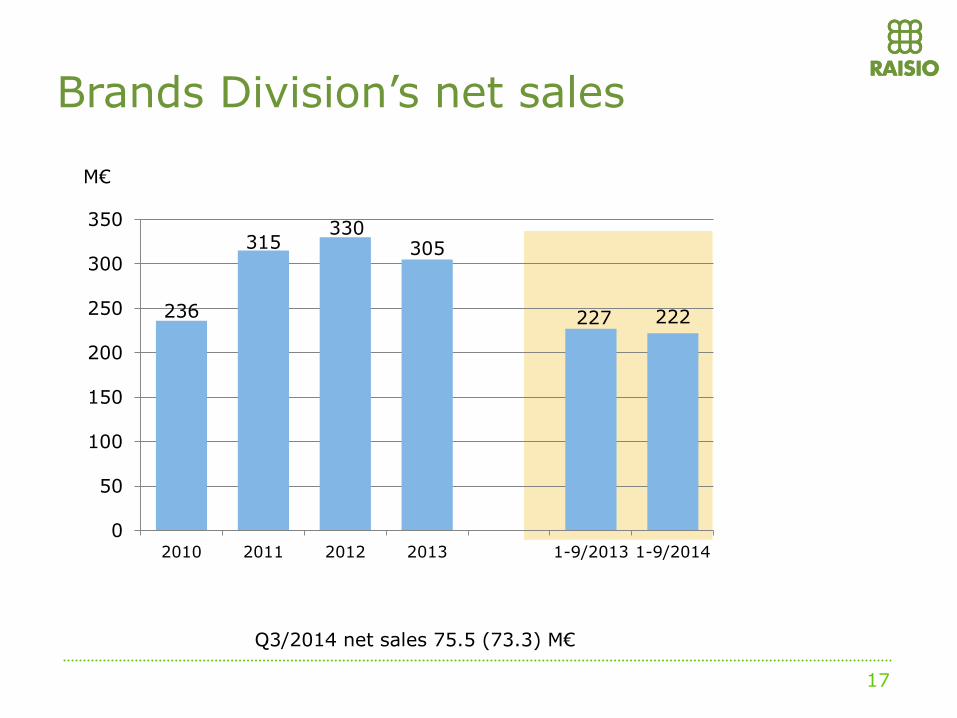
236
315 330
305
227 222
0
50
100
150
200
250
300
350
2010 2011 2012 2013 1-9/2013 1-9/2014
Brands Division’s net sales
17
M€
Q3/2014 net sales 75.5 (73.3) M€
18
Raisioagro

Raisioagro’s renewal continuing
19
• Sales volume of Benemilk feeds increased in Finland
• Product range renewed to better complement different quality silages
• Aim is to increase the market share of Benemilk feeds
• First batches of Benemilk feeds delivered to St. Petersburg area
• Northwest Russia is the first market area outside Finland
• Positive customer feedback
• Raisioagro’s net sales almost 30% lower than in the comparison period
• Sales volume of pig and poultry feeds declined as a result of the termination decision
• Share of low-profit products in the range was decreased. As a result, Raisioagro’s relative profitability and return on investment improved and working capital was released
• Online sales increased by some 40%
• Fish feed exports to Russia increased
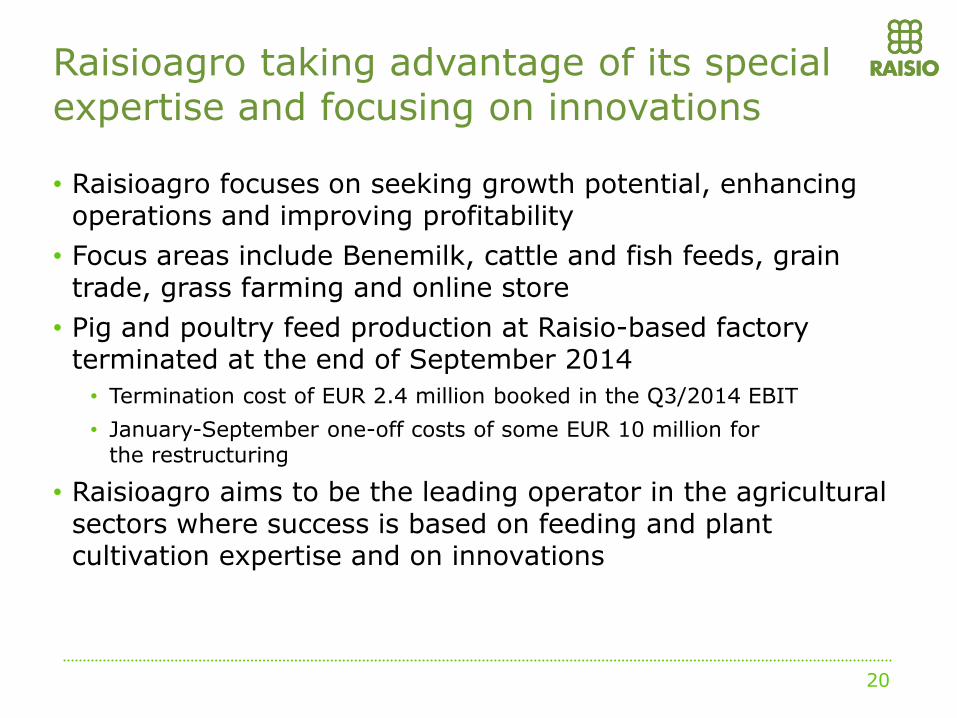
Raisioagro taking advantage of its special expertise and focusing on innovations
• Raisioagro focuses on seeking growth potential, enhancing operations and improving profitability
• Focus areas include Benemilk, cattle and fish feeds, grain trade, grass farming and online store
• Pig and poultry feed production at Raisio-based factory terminated at the end of September 2014
• Termination cost of EUR 2.4 million booked in the Q3/2014 EBIT
• January-September one-off costs of some EUR 10 million for the restructuring
• Raisioagro aims to be the leading operator in the agricultural sectors where success is based on feeding and plant cultivation expertise and on innovations
20
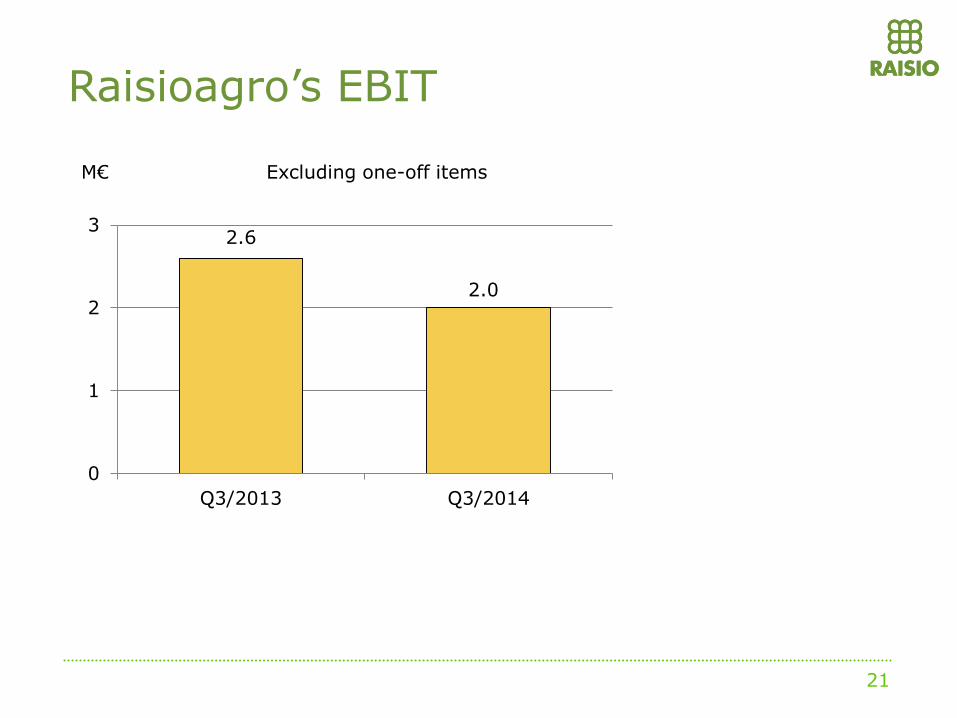
Raisioagro’s EBIT
21
2.6
2.0
0
1
2
3
Q3/2013 Q3/2014
M€ Excluding one-off items

0.7
2.3
0.4
-0.5
-1.8
0.4
1.2
-0.1 -0.6
1.3
2.6
-0.3
0.0
1.4
2.0
-3
-2
-1
0
1
2
3
22
Raisioagro’s EBIT by quarters
M€ Excluding one-off items

1.9
2.9
-0.3
3.1 3.3 3.4
-3
-2
-1
0
1
2
3
4
5
2010 2011 2012 2013 1-9/2013 1-9/2014
Raisioagro’s EBIT
23
M€ Excluding one-off items
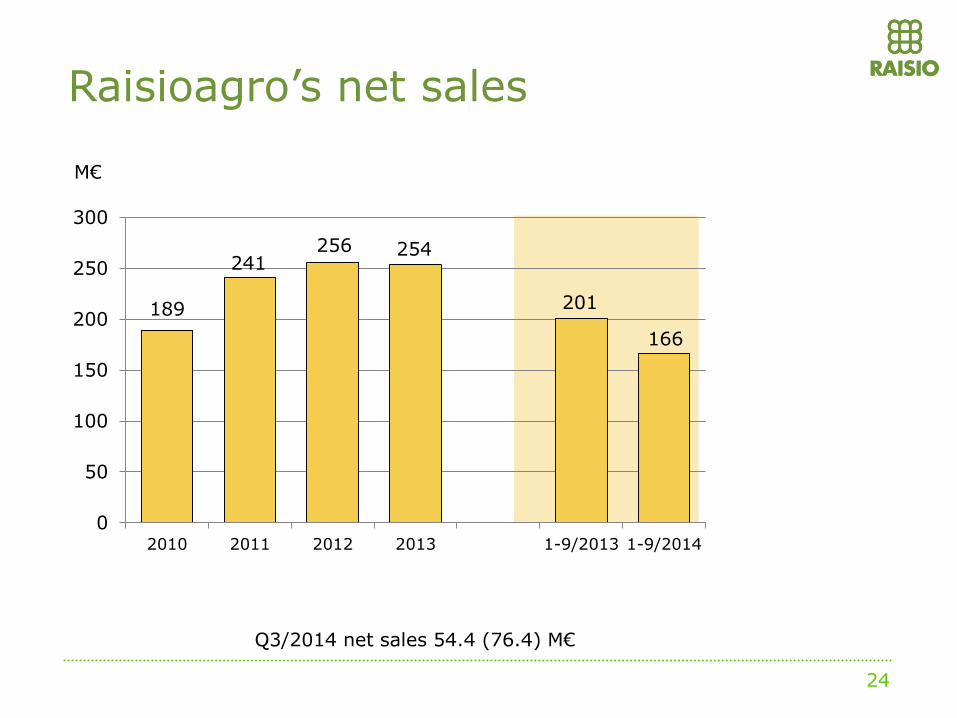
189
241 256 254
201
166
0
50
100
150
200
250
300
2010 2011 2012 2013 1-9/2013 1-9/2014
Raisioagro’s net sales
M€
24
Q3/2014 net sales 54.4 (76.4) M€
Studies

Scientific studies 2012–2014
• In addition to Finland, studies were conducted in Sweden, Holland and France

Scientific results, on average
• +2.6 kg of ECM
• +1.2 kg of milk
• +0.3 percentage points of fat
• +0.05 percentage points of protein
• +9 % better feed efficiency
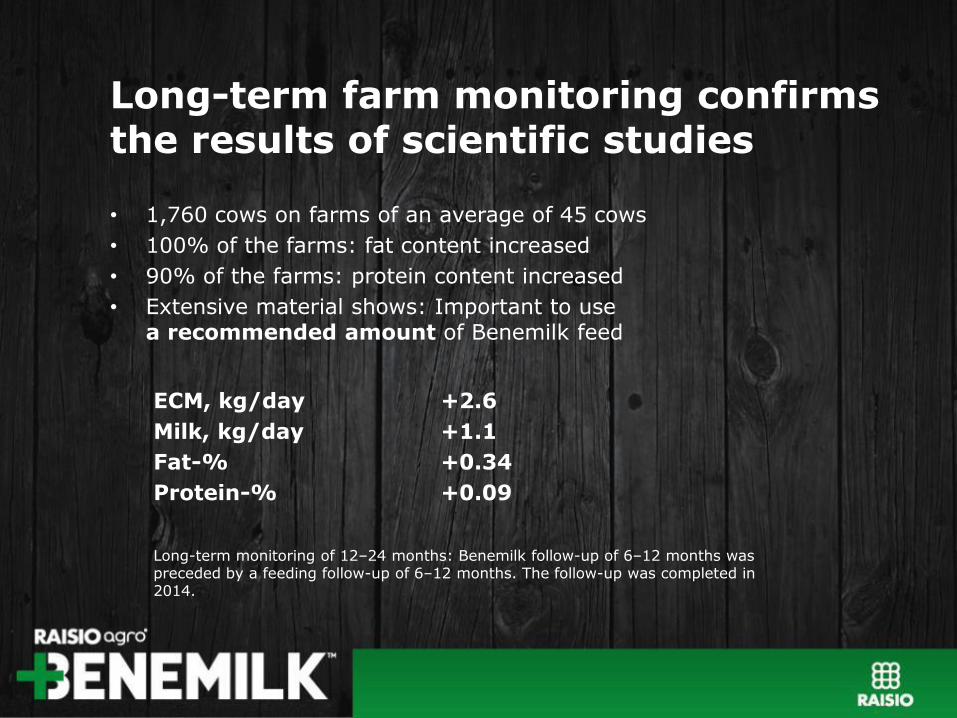
Long-term farm monitoring confirms the results of scientific studies
• 1,760 cows on farms of an average of 45 cows
• 100% of the farms: fat content increased
• 90% of the farms: protein content increased
• Extensive material shows: Important to use a recommended amount of Benemilk feed
ECM, kg/day +2.6
Milk, kg/day +1.1
Fat-% +0.34
Protein-% +0.09
Long-term monitoring of 12–24 months: Benemilk follow-up of 6–12 months was preceded by a feeding follow-up of 6–12 months. The follow-up was completed in 2014.

Scientific studies and farm monitoring prove the efficacy of Benemilk +2.6 kg ECM/day/cow

Milk solids index shows: the form of energy makes a difference
• Milk solids index is a new meter developed by Raisioagro
• It shows how effectively feed energy affects the composition of milk
• Index calculation is based on the fatty acid composition of a feed
• Benemilk feeds have effective, protected fatty acids as an energy source, so their energy is in a more efficient form and the milk solids index is high
The higher the feed’s milk solids index, the higher the contents of milk

All energy is not equal!
BENEMILK BLACK FEED C DIFFERENCE
Feed energy, MJ/kg DM 13.2 13.2 0
Milk solids index 65 25 +40
Kg ECM 34.8 31.4 +3.4
Protein, % 3.53 3.32 +0.21
Fat, % 4.03 3.60 +0.43 High index, higher contents
Benemilk Black vs. Feed C, Sweden 2013

Thank You!