Embed Size (px)
Citation preview
University Of Central Punjab F 13
Production & Operation Management P age 1
Executive Summary Inventory is an itemized catalog or lists of i tangible goods or property, or the
intangible attributes or qualities. Here we discuss inventory management in this
report, which means the overseeing, and controlling of the ordering, storage and
use of components that a company will use in the production of items, it wil l sell
as well as the overseeing and controlling the quantities of finished goods
products.
In this report we discuss importance of inventory, importance of inventory
management , types of inventory, inventory costs , inventory turnover ratios and
different sizes of inventory levels just like reorder point, maximum quantity,
EOQ, EPQ etc.
University Of Central Punjab F 13
Production & Operation Management P age 2
Inventory Inventory is the physical stock of goods maintained in an organization for its smooth
running, in accounting language it may mean stock of finished goods only. In a
manufacturing concern, it may include raw materials, work-in-process etc. in the
form of material or supplies to be consumed in the production process or in the
rendering of services.
The raw materials, work-in-process goods and completely finished goods that are
considered the portion of a business's assets that is ready or will be ready for sale.
Inventory represents one of the most important assets that most businesses possess,
because the turnover of inventory represents one of the primary sources of revenue
generation and subsequent earnings for the company's shareholders/owners.
Importance of Inventory
Inventory represents one of the most important assets that most business possesses,
because the turnover of inventory represents one of the primary sources of revenue
generation and subsequent earnings for the company’s shareholders/owners.
Inventory Management Activities employed in maintaining the optimum number or amount of each inventory
item. The objective of inventory management is to provide uninterrupted production,
sales, and/or customer-service levels at the minimum cost. Since for many companies
inventory is the largest item in the current assets category, inventory problems can
and do contribute to losses or even business failures. Also called inventory control.
Possessing a high amount of inventory for long periods is not usually good for a
business because of inventory storage, obsolescence and spoilage costs. However,
possessing too little inventory isn't good either, because the business runs the risk of
losing out on potential sales and potential market share as well.
Inventory management forecasts and strategies, such as a just-in-time inventory
system, can help minimize inventory costs because goods are created or received as
inventory only when needed.
Importance of Inventory Management
Managing your inventory in a cost-efficient way helps you optimize your profits. This
begins with negotiating the lowest costs with your suppliers. Buying in volume or
committing to suppliers in long-term relationships can help with this. Managing
inventory once you have it is vital as well. If you order too much inventory, you have
to pay more money for employees to organize it and manage it. You have more
expenses for storage areas where you hold it. You also risk waste on expired or rotted
items. Having too little inventory can lead to stock-outs, which is bad for customer
service.
University Of Central Punjab F 13
Production & Operation Management P age 3
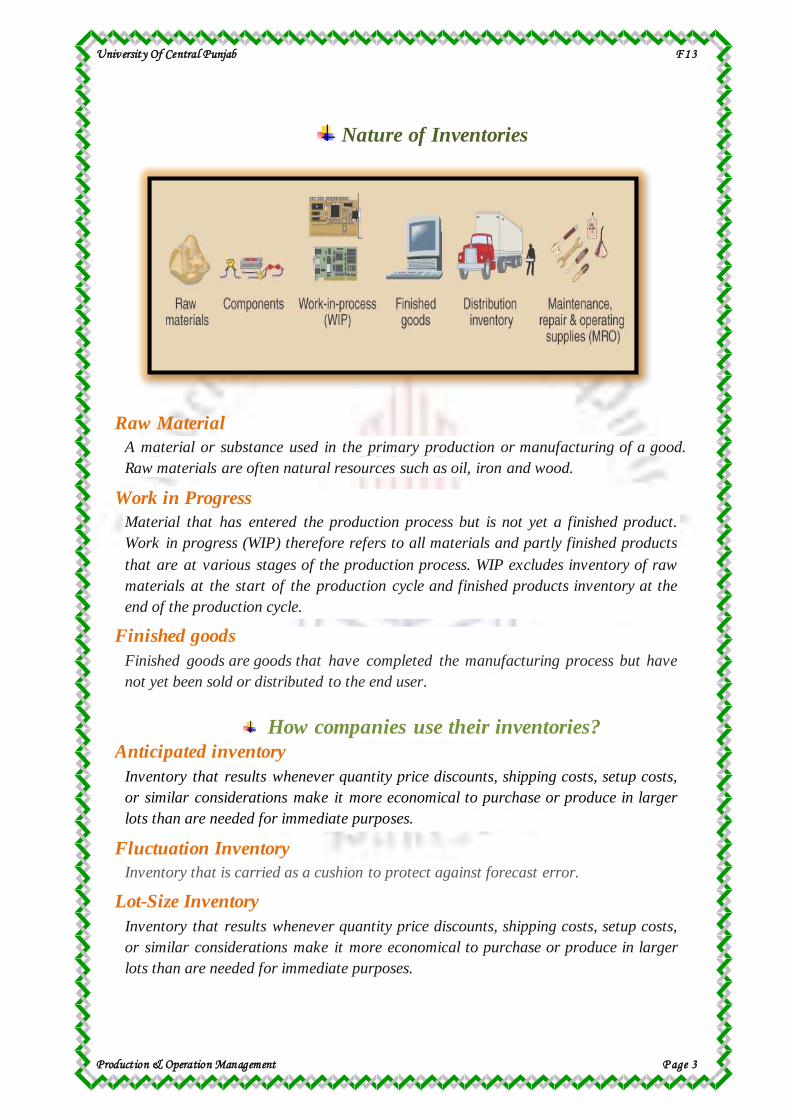
Nature of Inventories
Raw Material
A material or substance used in the primary production or manufacturing of a good.
Raw materials are often natural resources such as oil, iron and wood.
Work in Progress
Material that has entered the production process but is not yet a finished product.
Work in progress (WIP) therefore refers to all materials and partly finished products
that are at various stages of the production process. WIP excludes inventory of raw
materials at the start of the production cycle and finished products inventory at the
end of the production cycle.
Finished goods
Finished goods are goods that have completed the manufacturing process but have
not yet been sold or distributed to the end user.
How companies use their inventories?
Anticipated inventory
Inventory that results whenever quantity price discounts, shipping costs, setup costs,
or similar considerations make it more economical to purchase or produce in larger
lots than are needed for immediate purposes.
Fluctuation Inventory
Inventory that is carried as a cushion to protect against forecast error.
Lot-Size Inventory
Inventory that results whenever quantity price discounts, shipping costs, setup costs,
or similar considerations make it more economical to purchase or produce in larger
lots than are needed for immediate purposes.
University Of Central Punjab F 13
Production & Operation Management P age 4
Transportation inventory
Inventory in movement of location Transit between the manufacturing plant and the
distribution warehouse.
Speculative inventory
The term "speculative inventory" can mean different things, but in general, it refers to
inventory that a business obtains and holds in anticipation of future demand, rather
than to meet current demand. "Spec inventory" is most commonly a cost-saving
measure, though businesses also use it to get ahead of the market.
Maintenance, repair and operations
Maintenance, repair and operations (MRO) or maintenance, repair, and
overhaul involves fixing any sort of mechanical, plumbing or electrical device should
it become out of order or broken (known as repair, unscheduled, or casualty
maintenance). It also includes performing routine actions which keep the device in
working order (known as scheduled maintenance) or prevents trouble from arising
(preventive maintenance).
Objectives of Inventory Management
The objective of inventory management is to provide desired level of customer servive,
to allow cost-efficient operations, and to minimize the inventory investment.
Customer value
Delivering value to customers is important to managers, leaders, and entrepreneurs
alike. To be willing to pay, a customer must derive value from a market offer.
However, what is customer value? How does a supplier deliver customer value? The
definition above suggests that there are two aspects to customer value: desired value
and perceived value. Desired value refers to what customer’s desire in a product or
service. Perceived value is the benefit that a customer believes he or she received
from a product after it was purchased.
Provide desired customer service level:
Percentage of orders shipped on schedule.
Percentage of line items shipped on schedule.
Percentage of dollar volume shipped on schedule.
Idle time due to material and component shortages.
Provide for cost-efficient operations:
Buffer stock for smooth production flow.
Maintain a level work force.
Allowing longer production runs & quantity discounts.
Minimize inventory related investments:
Inventory turnover = Annual CGS/Avgas Inv ($).
Weeks (or days) of supply = Avg Inv ($)/Avg Wk Usage.
University Of Central Punjab F 13
Production & Operation Management P age 5
Percentage of Orders Shipped on Schedule
The percentage of orders shipped at the planned time.(Shipped means off the dock,
and in transit to its final destination).Note that the time to ship may be defined by the
customer, or it may be determined by the shipper in order to accommodate an On-
time Delivery. Good measure if orders have similar value. Does not capture value. If
one company represents 60% of your business but only 5% of your orders, 95% on
schedule could represent only 40% of value
Calculation
Number of order shipped on time / Total number of orders shipped
Percentage of Line Items Shipped on Schedule
Recognizes that not all orders are equal, but does not capture $ value of orders. More
expensive to measure. OK for finish. Goods. A 90% service level might mean shipping
225 items out of the total 250 line items totaled from 20 orders scheduled
Percentage of Dollar Volume Shipped on Schedule
Recognizes the differences in orders in terms of both line items and $ value
Cost such as scrap cost calibration cost and down time cost associated with
preparing the equipment for the next product being produced
Inventory Investment Measures Example:
The Coach Motor Home Company has annual cost of goods sold of $10,000,000. The
average inventory value at any point in time is $384,615. Calculate inventory
turnover and weeks/days of supply.
Minimum Inventory Investment Inventory as a company's goods on hand, which is often a significant current asset.
Inventory serves as a buffer between a company's sales of goods and its production or
purchase of goods. Companies strive to find the proper amount of inventory to avoid
lost sales, disruptions in production, high holding costs, etc.
Manufacturers usually have the following categories of inventories: raw materials,
work-in-process, finished goods, and manufacturing supplies. The amounts of these
categories are usually listed in the notes to its balance sheet.
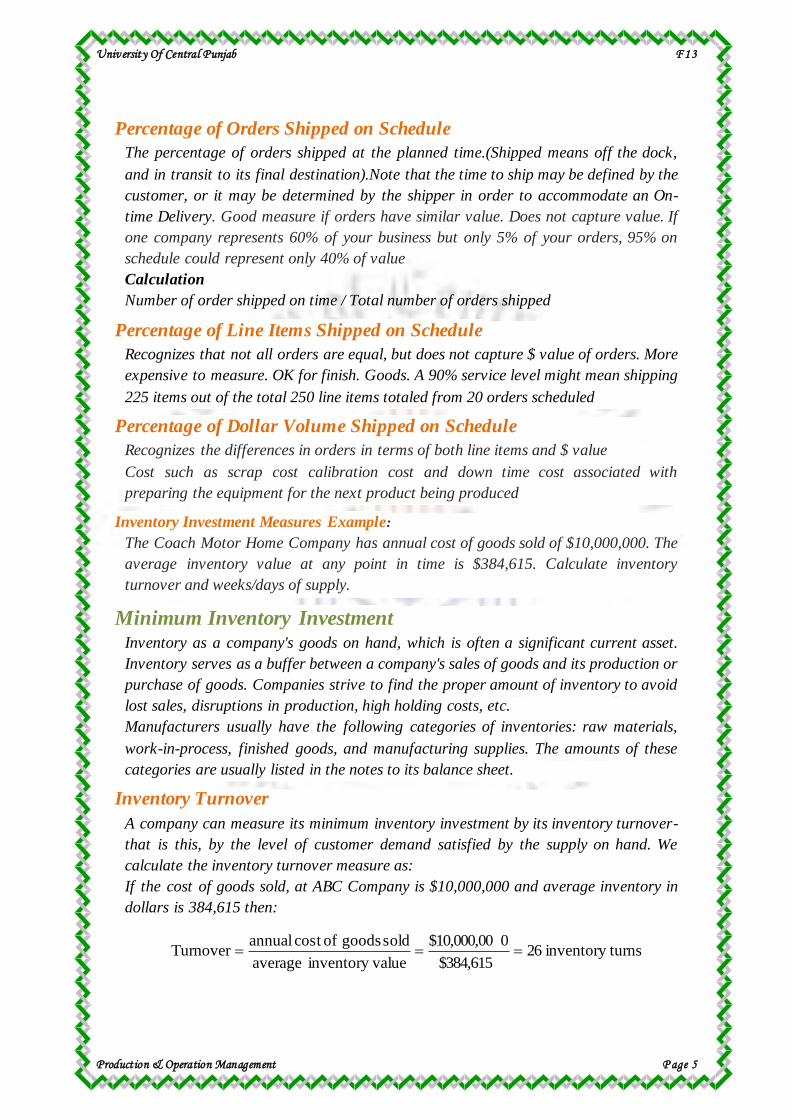
Inventory Turnover
A company can measure its minimum inventory investment by its inventory turnover-
that is this, by the level of customer demand satisfied by the supply on hand. We
calculate the inventory turnover measure as:
If the cost of goods sold, at ABC Company is $10,000,000 and average inventory in
dollars is 384,615 then:
turnsinventory 26$384,615
0$10,000,00
valueinventory average
sold goods ofcost annualTurnover
University Of Central Punjab F 13
Production & Operation Management P age 6
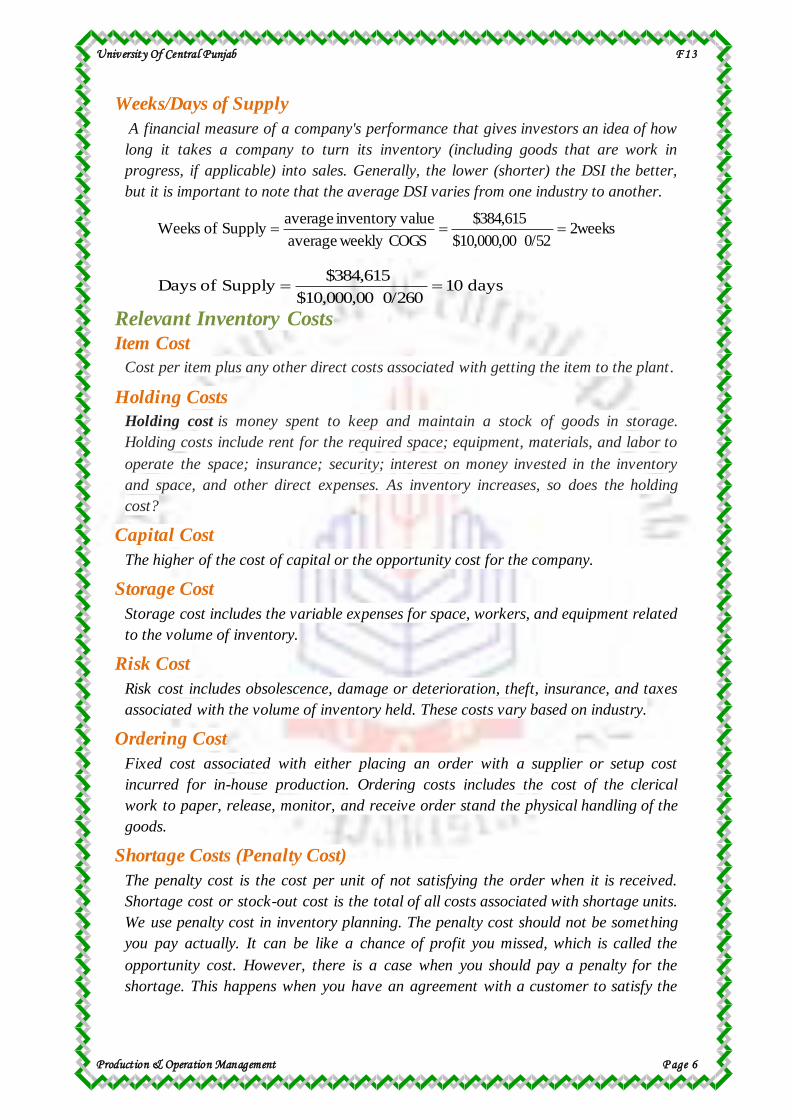
Weeks/Days of Supply
A financial measure of a company's performance that gives investors an idea of how
long it takes a company to turn its inventory (including goods that are work in
progress, if applicable) into sales. Generally, the lower (shorter) the DSI the better,
but it is important to note that the average DSI varies from one industry to another.
Relevant Inventory Costs
Item Cost
Cost per item plus any other direct costs associated with getting the item to the plant .
Holding Costs
Holding cost is money spent to keep and maintain a stock of goods in storage.
Holding costs include rent for the required space; equipment, materials, and labor to
operate the space; insurance; security; interest on money invested in the inventory
and space, and other direct expenses. As inventory increases, so does the holding
cost?
Capital Cost
The higher of the cost of capital or the opportunity cost for the company.
Storage Cost
Storage cost includes the variable expenses for space, workers, and equipment related
to the volume of inventory.
Risk Cost
Risk cost includes obsolescence, damage or deterioration, theft, insurance, and taxes
associated with the volume of inventory held. These costs vary based on industry.
Ordering Cost
Fixed cost associated with either placing an order with a supplier or setup cost
incurred for in-house production. Ordering costs includes the cost of the clerical
work to paper, release, monitor, and receive order stand the physical handling of the
goods.
Shortage Costs (Penalty Cost)
The penalty cost is the cost per unit of not satisfying the order when it is received.
Shortage cost or stock-out cost is the total of all costs associated with shortage units.
We use penalty cost in inventory planning. The penalty cost should not be something
you pay actually. It can be like a chance of profit you missed, which is called the
opportunity cost. However, there is a case when you should pay a penalty for the
shortage. This happens when you have an agreement with a customer to satisfy the
2weeks0/52$10,000,00
$384,615
COGS weekly average
valueinventory averageSupply of Weeks
days 100/260$10,000,00
$384,615Supply of Days
University Of Central Punjab F 13
Production & Operation Management P age 7
demand by a certain date with the right quantities, or you will pay a penalty for the
breach of contract.
Penalty cost includes loss of customer goodwill, back order handling, and lost sales
Shortage cost incurred due to two reasons.
Back Orders
Delaying delivery to the customers until the item becomes available.
Lost Sales
Occurs when the customer is not willing to wait for delivery.
Three Mathematical Models for Determining Order Quantity
Economic Order Quantity (EOQ or Q System)
A model used to find optimal order q. and RP (Reorder Point).
Part of continuous review system , which tracks on-hand inventory each time a withdrawal, is made
Economic Production Quantity (EPQ) A model that allows for incremental product delivery.
Quantity Discount Model Modifies the EOQ process to consider cases where quantity discounts are available.
Economic Order Quantity
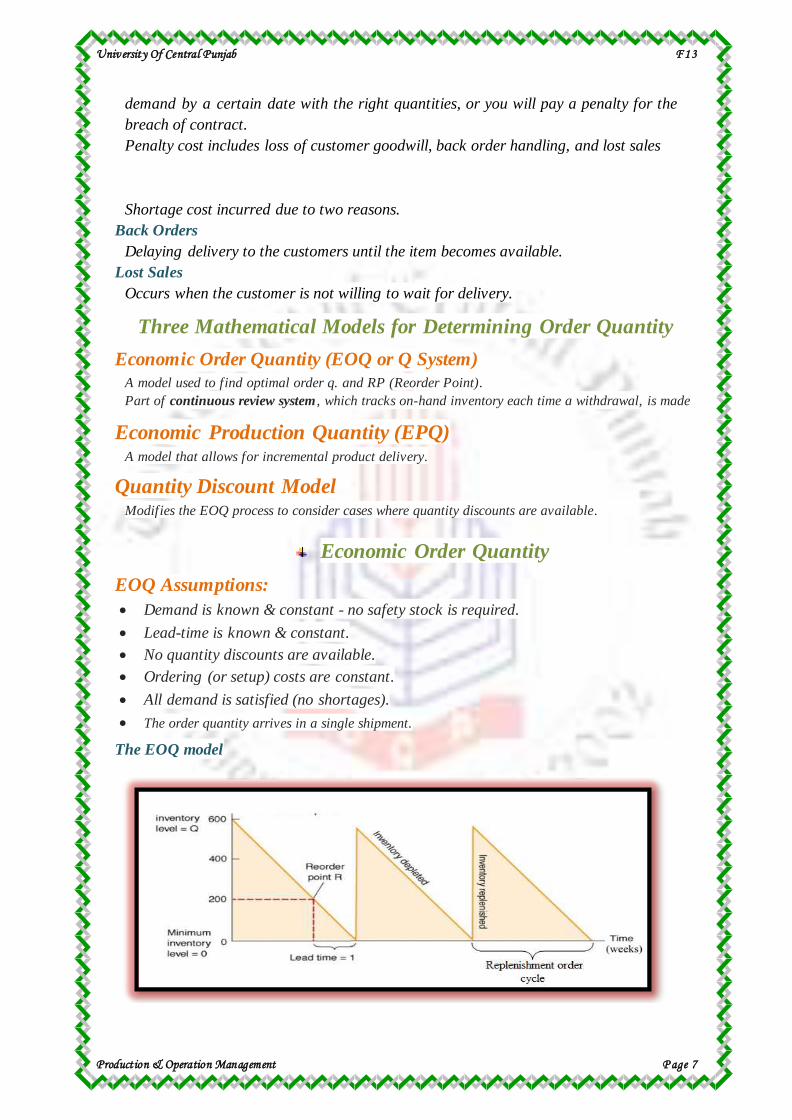
EOQ Assumptions:
Demand is known & constant - no safety stock is required.
Lead-time is known & constant.
No quantity discounts are available.
Ordering (or setup) costs are constant.
All demand is satisfied (no shortages).
The order quantity arrives in a single shipment.
The EOQ model
University Of Central Punjab F 13
Production & Operation Management P age 8
Reorder Point (R)
Is the level of inventory , which triggers an action to replenish that particular
inventory stock? It is normally calculated as the forecast usage during the
replenishment lead-time plus safety stock.
Formula for reorder point:
R = dL
Where
R = reorder point
d = average daily demand
L = lead time
Example:
A computer company has annual demand of 10,000. They want to determine EOQ for circuit
boards, which have an annual holding cost (H) of $6 per unit, and an ordering cost (S) of
$75. They want to calculate TC and the reorder point (R) if the purchasing lead-time is 5
days.
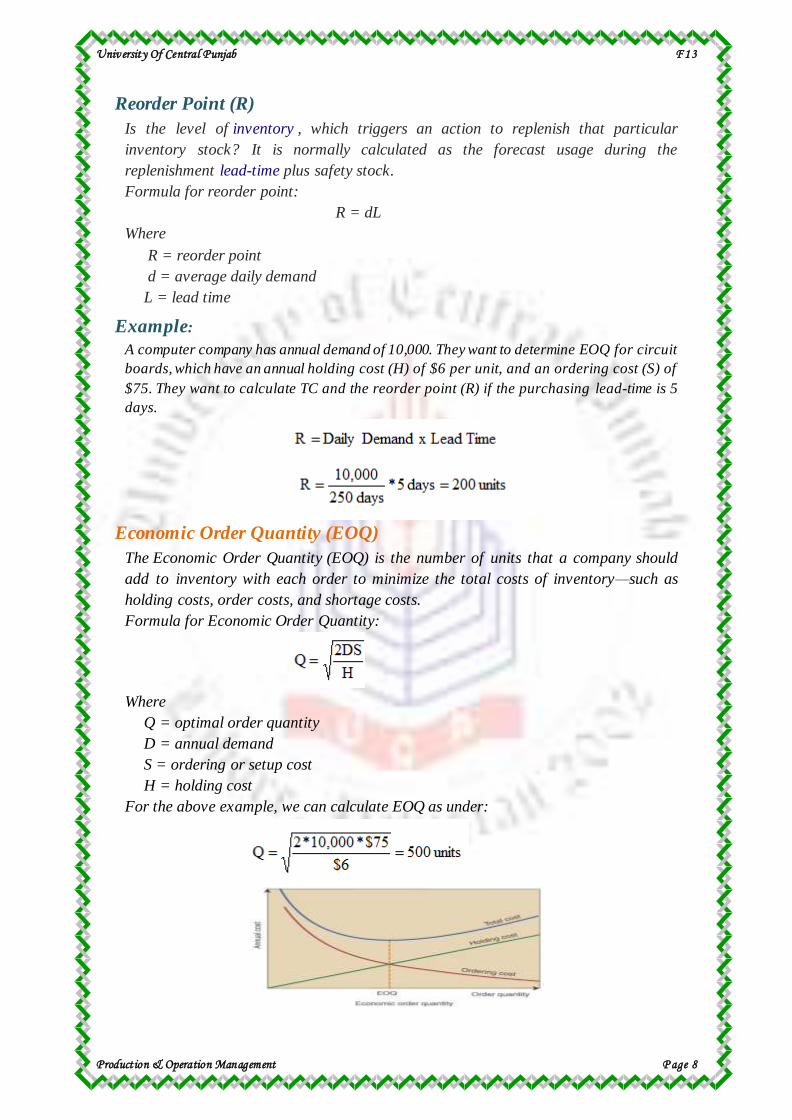
Economic Order Quantity (EOQ)
The Economic Order Quantity (EOQ) is the number of units that a company should
add to inventory with each order to minimize the total costs of inventory—such as
holding costs, order costs, and shortage costs.
Formula for Economic Order Quantity:
Where
Q = optimal order quantity
D = annual demand
S = ordering or setup cost
H = holding cost
For the above example, we can calculate EOQ as under:
University Of Central Punjab F 13
Production & Operation Management P age 9
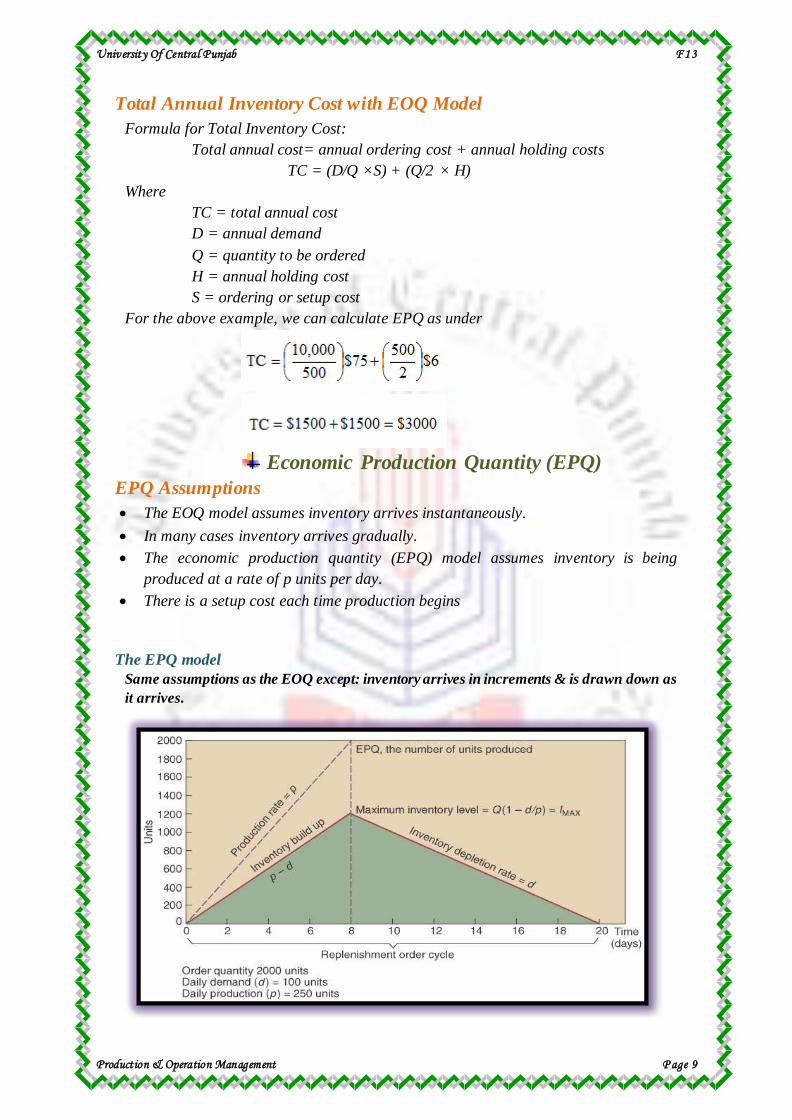
Total Annual Inventory Cost with EOQ Model
Formula for Total Inventory Cost:
Total annual cost= annual ordering cost + annual holding costs
TC = (D/Q ×S) + (Q/2 × H)
Where
TC = total annual cost
D = annual demand
Q = quantity to be ordered
H = annual holding cost
S = ordering or setup cost
For the above example, we can calculate EPQ as under
Economic Production Quantity (EPQ)
EPQ Assumptions
The EOQ model assumes inventory arrives instantaneously.
In many cases inventory arrives gradually.
The economic production quantity (EPQ) model assumes inventory is being
produced at a rate of p units per day.
There is a setup cost each time production begins
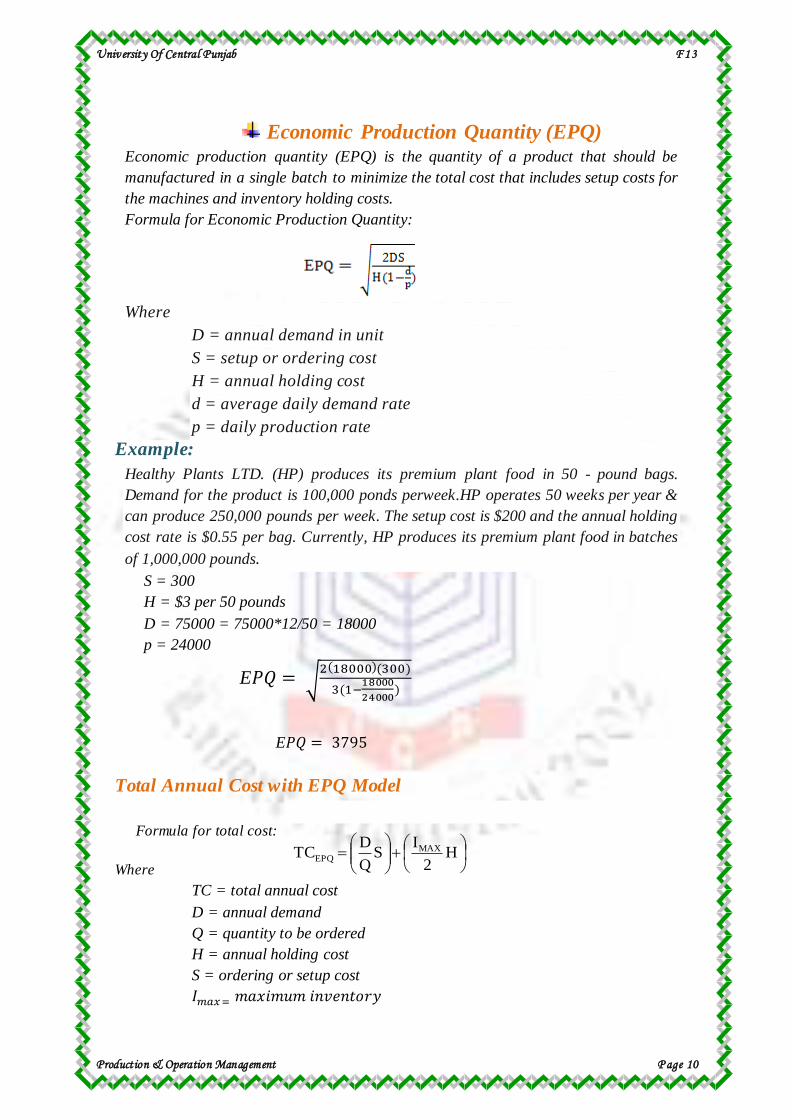
The EPQ model
Same assumptions as the EOQ except: inventory arrives in increments & is drawn down as
it arrives.
University Of Central Punjab F 13
Production & Operation Management P age 10
Economic Production Quantity (EPQ) Economic production quantity (EPQ) is the quantity of a product that should be
manufactured in a single batch to minimize the total cost that includes setup costs for
the machines and inventory holding costs. Formula for Economic Production Quantity:
Where
D = annual demand in unit
S = setup or ordering cost
H = annual holding cost
d = average daily demand rate
p = daily production rate
Example:
Healthy Plants LTD. (HP) produces its premium plant food in 50 - pound bags.
Demand for the product is 100,000 ponds perweek.HP operates 50 weeks per year &
can produce 250,000 pounds per week. The setup cost is $200 and the annual holding
cost rate is $0.55 per bag. Currently, HP produces its premium plant food in batches
of 1,000,000 pounds.
S = 300
H = $3 per 50 pounds
D = 75000 = 75000*12/50 = 18000
p = 24000
E𝑃𝑄 = √2(18000)(300)
3(1−18000
24000)
E𝑃𝑄 = 3795
Total Annual Cost with EPQ Model
Formula for total cost:
Where
TC = total annual cost
D = annual demand
Q = quantity to be ordered
H = annual holding cost
S = ordering or setup cost
𝐼𝑚𝑎𝑥 = 𝑚𝑎𝑥𝑖𝑚𝑢𝑚 𝑖𝑛𝑣𝑒𝑛𝑡𝑜𝑟𝑦
H
2
IS
Q
DTC MAX
EPQ
University Of Central Punjab F 13
Production & Operation Management P age 11
For the above example, we can calculate total cost as under:
Total Cost = (949/2 3) + 18,000 × 300/ 3795
Total Cost = 1423.50 + 1422.92
Total Cost = $2846.42
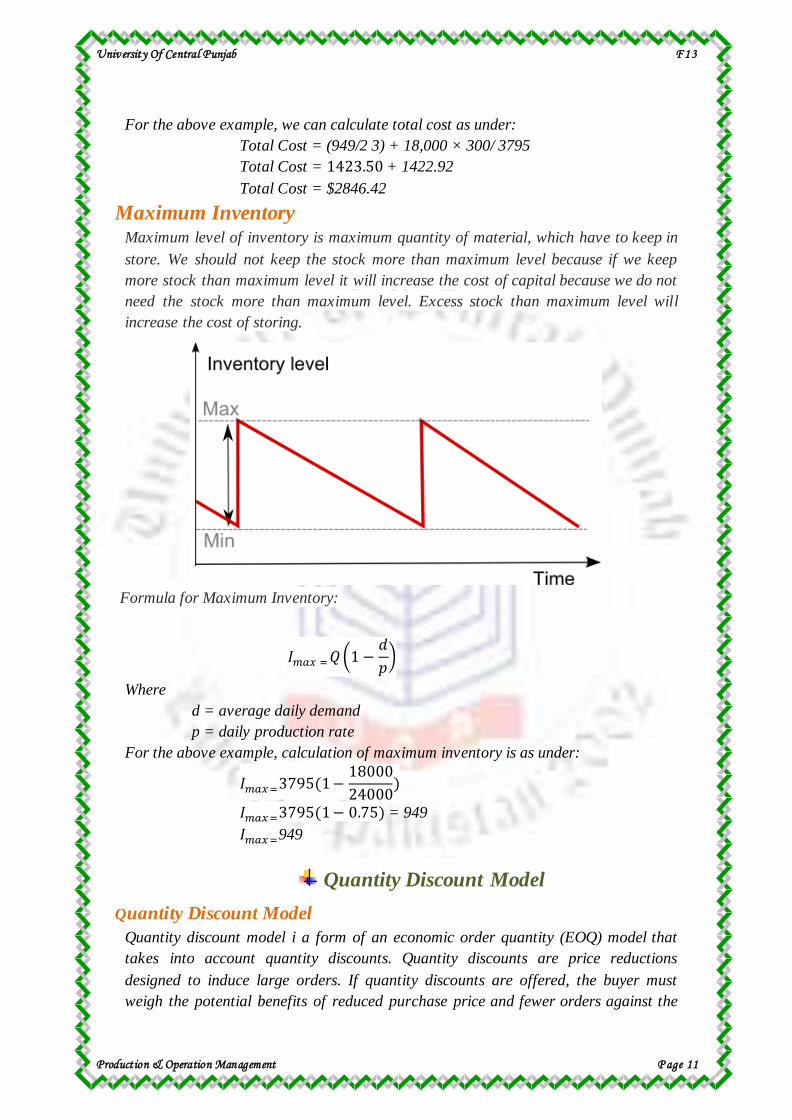
Maximum Inventory Maximum level of inventory is maximum quantity of material, which have to keep in
store. We should not keep the stock more than maximum level because if we keep
more stock than maximum level it will increase the cost of capital because we do not
need the stock more than maximum level. Excess stock than maximum level will
increase the cost of storing.
Formula for Maximum Inventory:
𝐼𝑚𝑎𝑥 = 𝑄 (1 −𝑑
𝑝)
Where
d = average daily demand
p = daily production rate
For the above example, calculation of maximum inventory is as under:
𝐼𝑚𝑎𝑥 =3795(1 −18000
24000)
𝐼𝑚𝑎𝑥 =3795(1 − 0.75) = 949
𝐼𝑚𝑎𝑥 =949
Quantity Discount Model
Quantity Discount Model
Quantity discount model i a form of an economic order quantity (EOQ) model that
takes into account quantity discounts. Quantity discounts are price reductions
designed to induce large orders. If quantity discounts are offered, the buyer must
weigh the potential benefits of reduced purchase price and fewer orders against the
University Of Central Punjab F 13
Production & Operation Management P age 12
increase in carrying costs caused by higher average inventories. Hence, the buyer’s
goal in this case is to select the order quantity that will minimize total costs, where
total cost is the sum of carrying cost, ordering cost, and purchase cost.
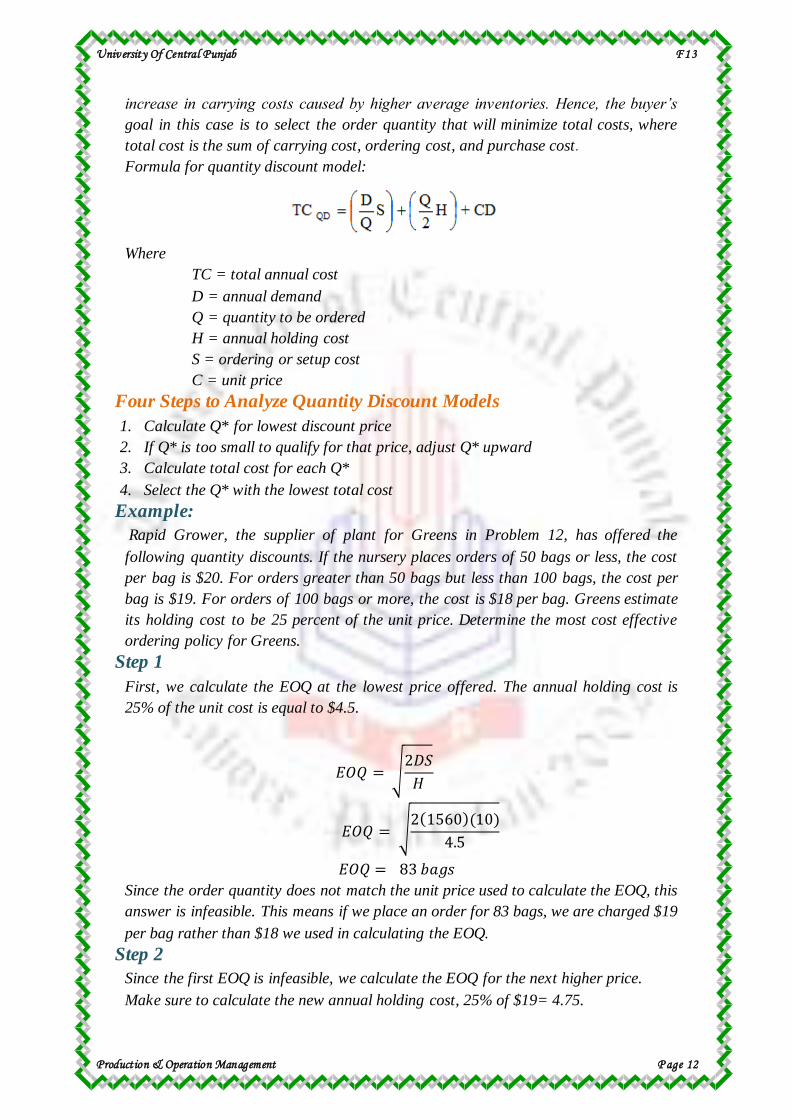
Formula for quantity discount model:
Where
TC = total annual cost
D = annual demand
Q = quantity to be ordered
H = annual holding cost
S = ordering or setup cost
C = unit price
Four Steps to Analyze Quantity Discount Models
1. Calculate Q* for lowest discount price
2. If Q* is too small to qualify for that price, adjust Q* upward
3. Calculate total cost for each Q*
4. Select the Q* with the lowest total cost
Example:
Rapid Grower, the supplier of plant for Greens in Problem 12, has offered the
following quantity discounts. If the nursery places orders of 50 bags or less, the cost
per bag is $20. For orders greater than 50 bags but less than 100 bags, the cost per
bag is $19. For orders of 100 bags or more, the cost is $18 per bag. Greens estimate
its holding cost to be 25 percent of the unit price. Determine the most cost effective
ordering policy for Greens.
Step 1
First, we calculate the EOQ at the lowest price offered. The annual holding cost is
25% of the unit cost is equal to $4.5.
𝐸𝑂𝑄 = √2𝐷𝑆
𝐻
𝐸𝑂𝑄 = √2(1560)(10)
4.5
𝐸𝑂𝑄 = 83 𝑏𝑎𝑔𝑠
Since the order quantity does not match the unit price used to calculate the EOQ, this
answer is infeasible. This means if we place an order for 83 bags, we are charged $19
per bag rather than $18 we used in calculating the EOQ.
Step 2
Since the first EOQ is infeasible, we calculate the EOQ for the next higher price.
Make sure to calculate the new annual holding cost, 25% of $19= 4.75.
University Of Central Punjab F 13
Production & Operation Management P age 13
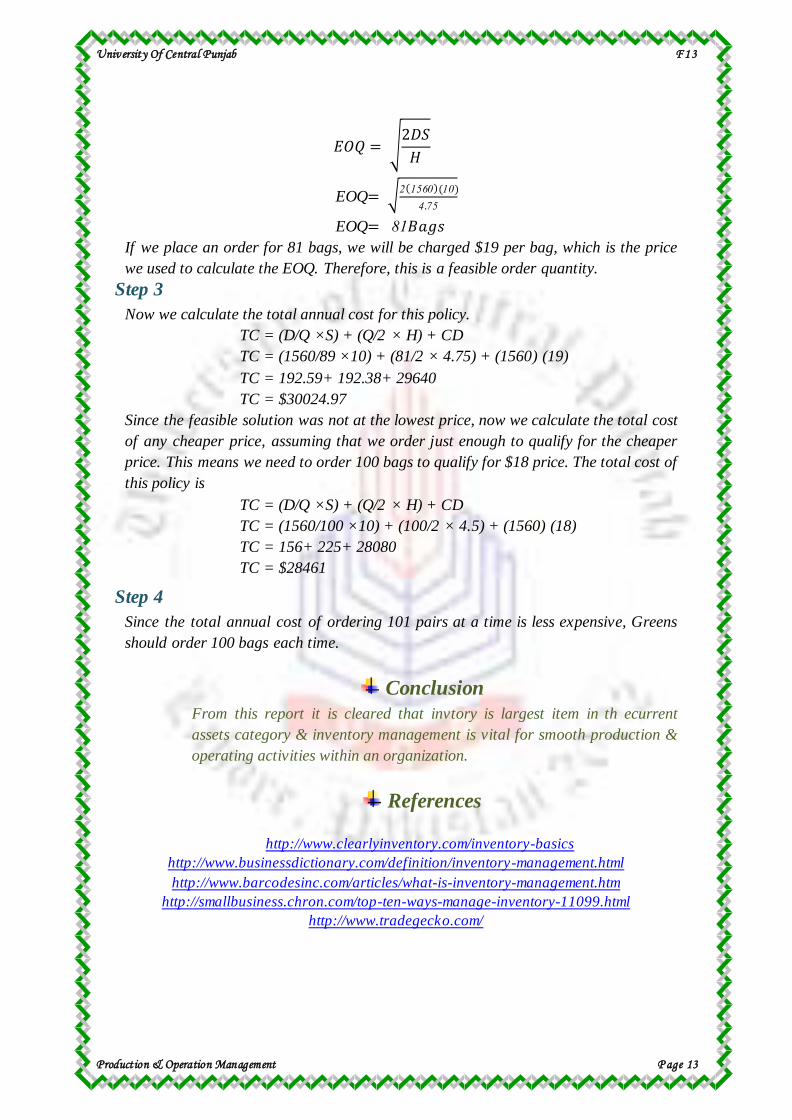
𝐸𝑂𝑄 = √2𝐷𝑆
𝐻
EOQ= √2(1560)(10)
4.75
EOQ= 81𝐵𝑎𝑔𝑠 If we place an order for 81 bags, we will be charged $19 per bag, which is the price
we used to calculate the EOQ. Therefore, this is a feasible order quantity.
Step 3
Now we calculate the total annual cost for this policy.
TC = (D/Q ×S) + (Q/2 × H) + CD
TC = (1560/89 ×10) + (81/2 × 4.75) + (1560) (19)
TC = 192.59+ 192.38+ 29640
TC = $30024.97
Since the feasible solution was not at the lowest price, now we calculate the total cost
of any cheaper price, assuming that we order just enough to qualify for the cheaper
price. This means we need to order 100 bags to qualify for $18 price. The total cost of
this policy is
TC = (D/Q ×S) + (Q/2 × H) + CD
TC = (1560/100 ×10) + (100/2 × 4.5) + (1560) (18)
TC = 156+ 225+ 28080
TC = $28461
Step 4
Since the total annual cost of ordering 101 pairs at a time is less expensive, Greens
should order 100 bags each time.
Conclusion
From this report it is cleared that invtory is largest item in th ecurrent
assets category & inventory management is vital for smooth production &
operating activities within an organization.
References
http://www.clearlyinventory.com/inventory-basics
http://www.businessdictionary.com/definition/inventory-management.html
http://www.barcodesinc.com/articles/what-is-inventory-management.htm
http://smallbusiness.chron.com/top-ten-ways-manage-inventory-11099.html
http://www.tradegecko.com/

University Of Central Punjab F 13
Production & Operation Management P age 14