Embed Size (px)
Citation preview
MEASURING SOCIAL MEDIA ROI
ANIL BATRA @ANILBATRA
HTTP://WWW.ANILBATRA.COM
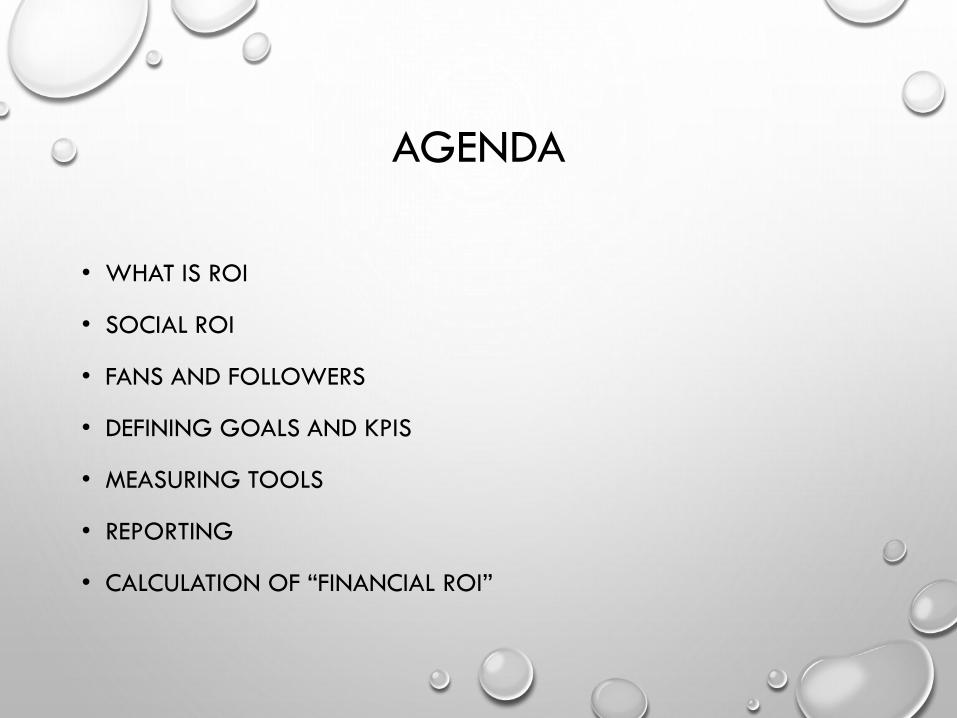
AGENDA
• WHAT IS ROI
• SOCIAL ROI
• FANS AND FOLLOWERS
• DEFINING GOALS AND KPIS
• MEASURING TOOLS
• REPORTING
• CALCULATION OF “FINANCIAL ROI”
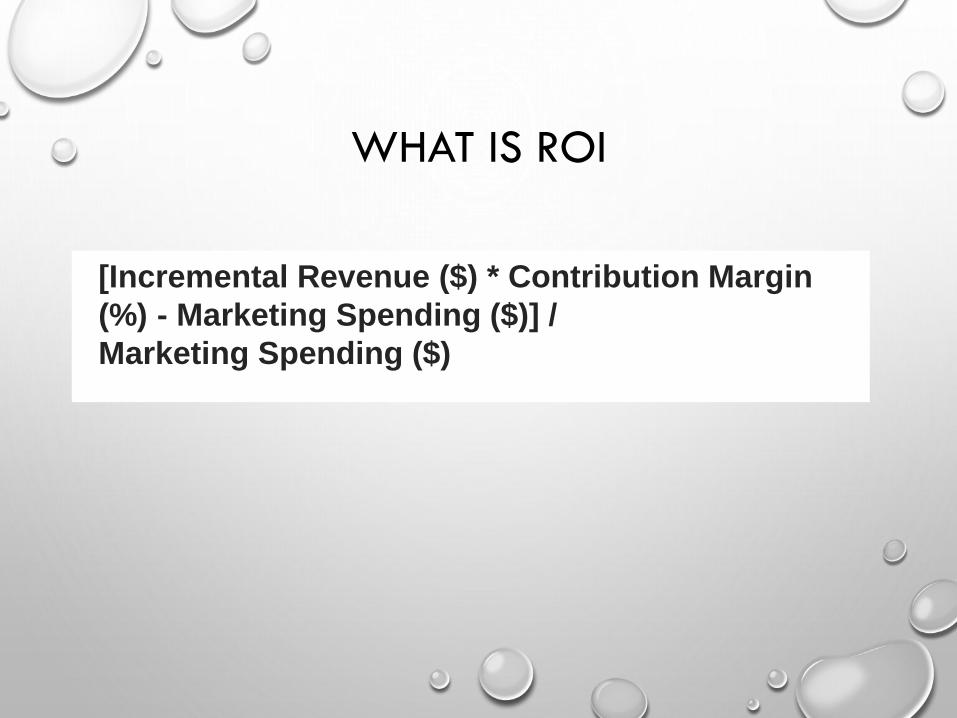
WHAT IS ROI
[Incremental Revenue ($) * Contribution Margin
(%) - Marketing Spending ($)] /
Marketing Spending ($)
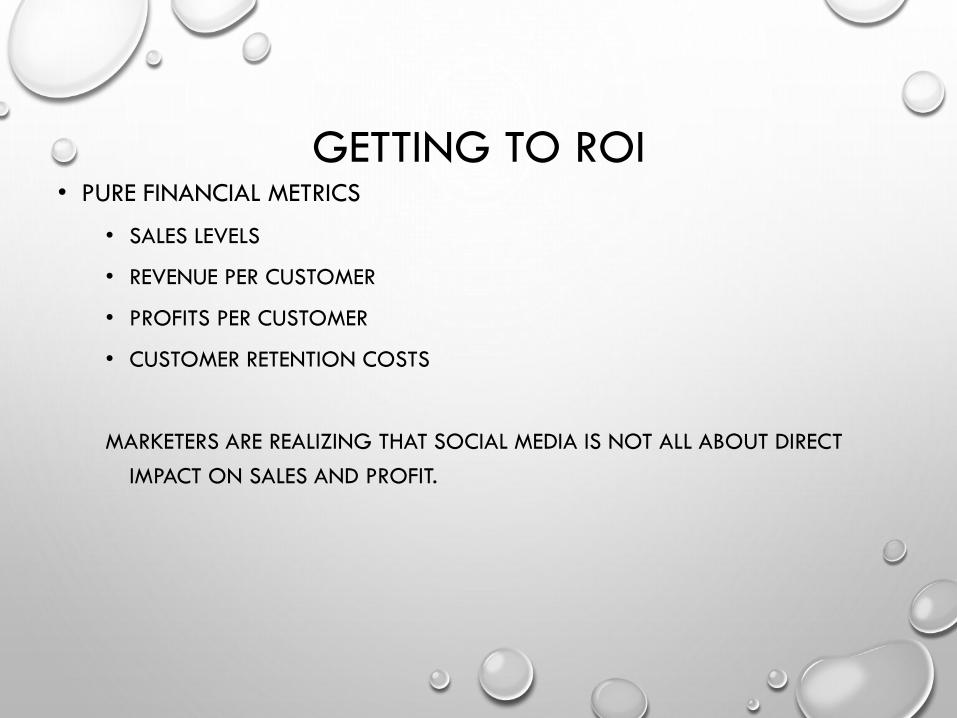
GETTING TO ROI • PURE FINANCIAL METRICS
• SALES LEVELS
• REVENUE PER CUSTOMER
• PROFITS PER CUSTOMER
• CUSTOMER RETENTION COSTS
MARKETERS ARE REALIZING THAT SOCIAL MEDIA IS NOT ALL ABOUT DIRECT
IMPACT ON SALES AND PROFIT.
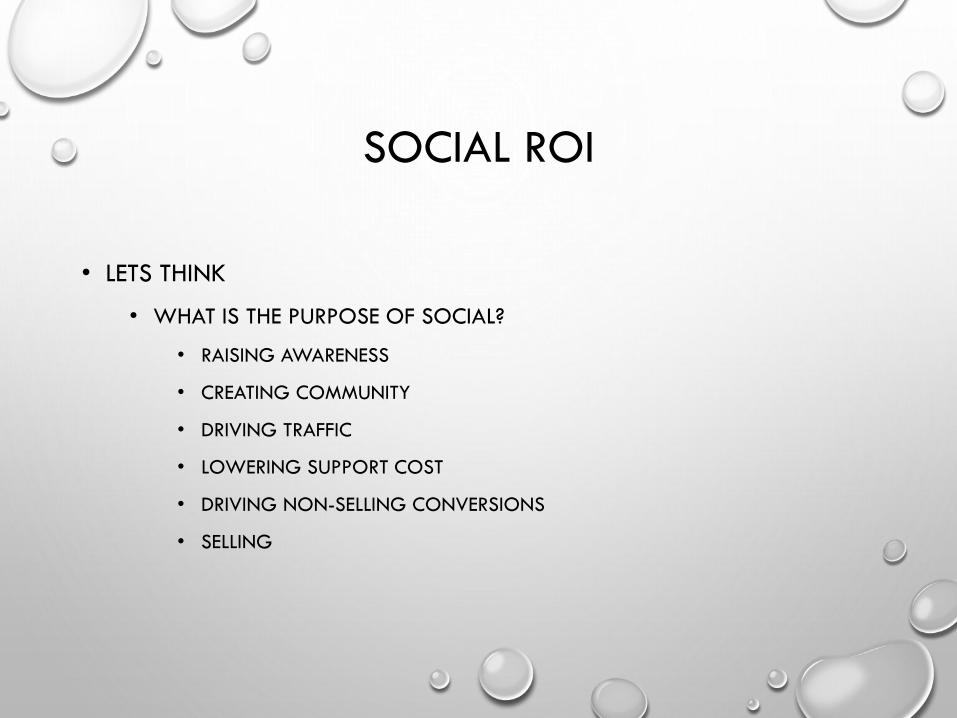
SOCIAL ROI
• LETS THINK
• WHAT IS THE PURPOSE OF SOCIAL?
• RAISING AWARENESS
• CREATING COMMUNITY
• DRIVING TRAFFIC
• LOWERING SUPPORT COST
• DRIVING NON-SELLING CONVERSIONS
• SELLING
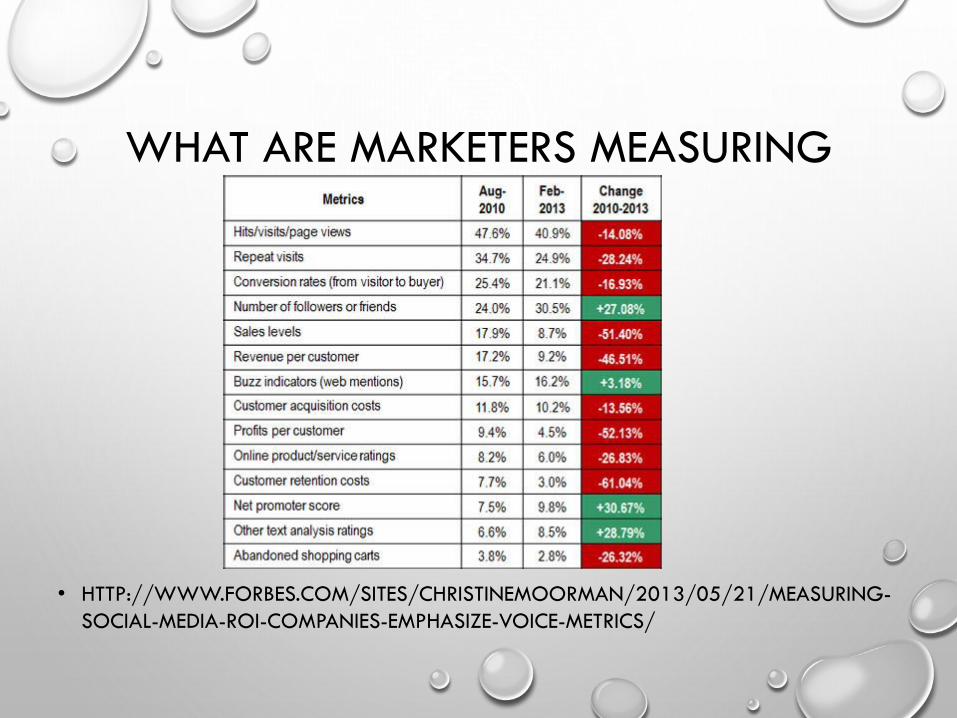
WHAT ARE MARKETERS MEASURING
• HTTP://WWW.FORBES.COM/SITES/CHRISTINEMOORMAN/2013/05/21/MEASURING-
SOCIAL-MEDIA-ROI-COMPANIES-EMPHASIZE-VOICE-METRICS/
FANS AND FOLLOWERS?
• FANS AND FOLLOWERS DO MATTER
• THEY ARE THE BASE
• ACQUIRE RIGHT KIND OF FANS AND FOLLOWERS
• DON’T STOP AT JUST COUNTING THEM
• TIE THEM TO BUSINESS GOALS
MEASURING SOCIAL MEDIA
• DEFINE YOUR SOCIAL MEDIA MARKETING GOALS
• DEFINE THE METRICS AND KPIS TO MEASURE THOSE GOALS
• IDENTIFY THE RIGHT TOOLS
• MEASURE “ROI” IN TERMS OF THOSE GOALS
• PROVIDE INSIGHTS THAT MOVES THE BUSINESS FORWARD
• COMBINE QUALITATIVE DATA WITH QUANTITATIVE DATA
• COMPARE TO COMPETITORS
• COMPARE TO BENCHMARKS
METRICS V/S KPIS
• KPI = KEY PERFORMANCE INDICATORS
• ALL KPIS ARE METRICS BUT NOT ALL METRICS ARE KPIS
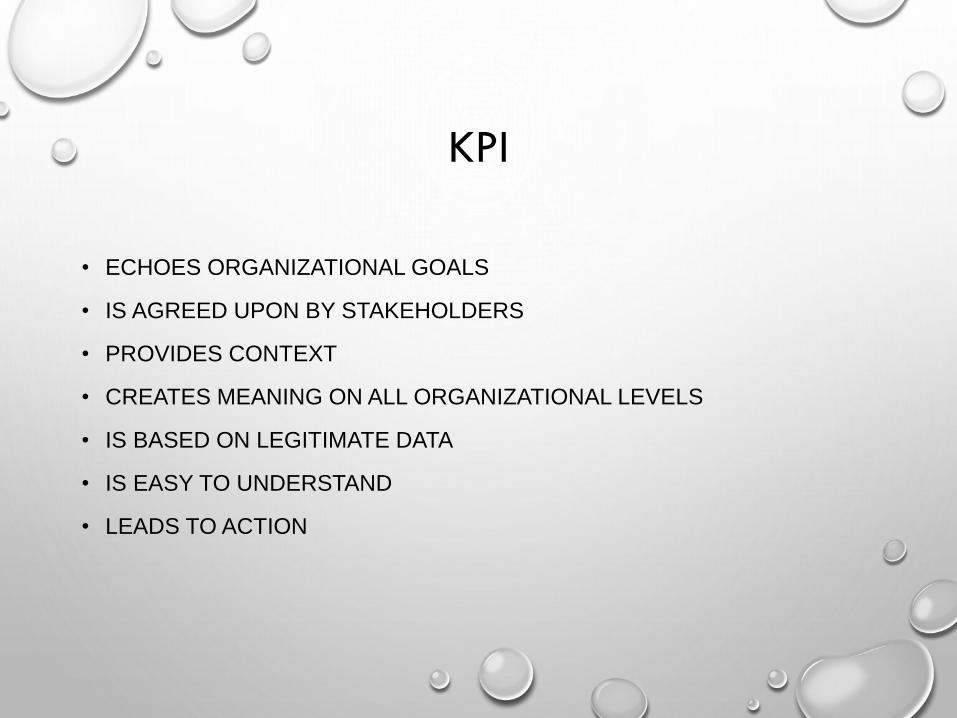
KPI
• ECHOES ORGANIZATIONAL GOALS
• IS AGREED UPON BY STAKEHOLDERS
• PROVIDES CONTEXT
• CREATES MEANING ON ALL ORGANIZATIONAL LEVELS
• IS BASED ON LEGITIMATE DATA
• IS EASY TO UNDERSTAND
• LEADS TO ACTION
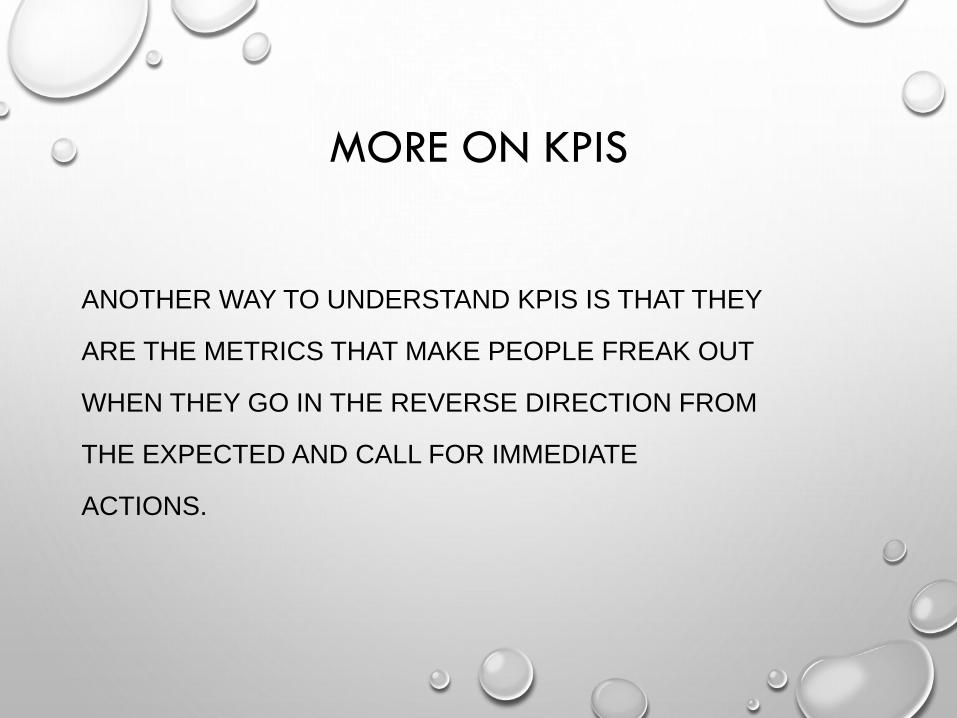
MORE ON KPIS
ANOTHER WAY TO UNDERSTAND KPIS IS THAT THEY
ARE THE METRICS THAT MAKE PEOPLE FREAK OUT
WHEN THEY GO IN THE REVERSE DIRECTION FROM
THE EXPECTED AND CALL FOR IMMEDIATE
ACTIONS.
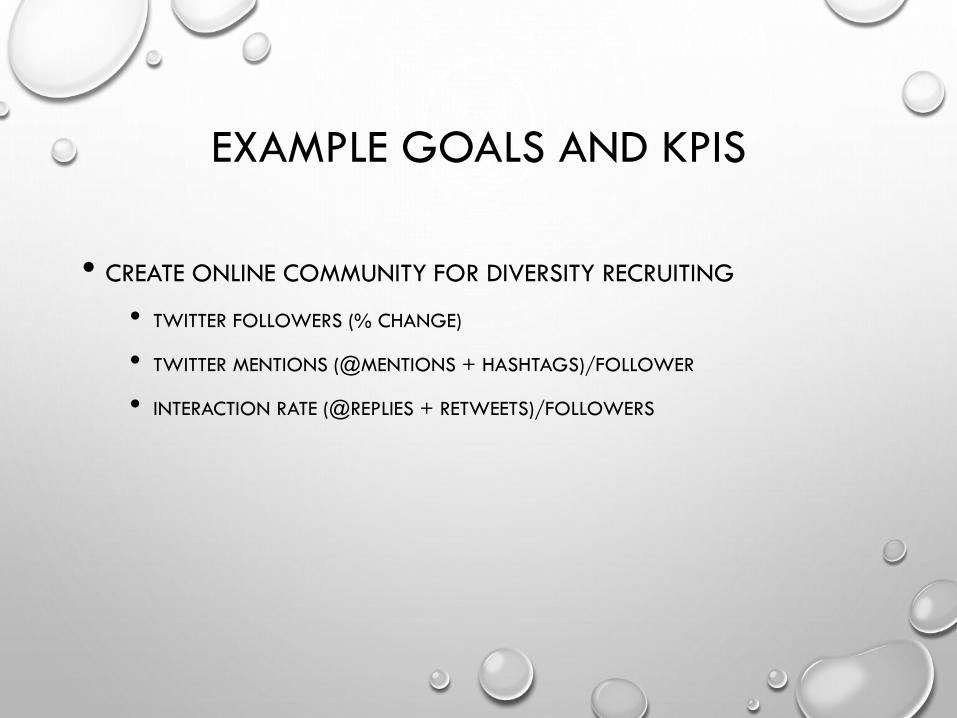
EXAMPLE GOALS AND KPIS
• CREATE ONLINE COMMUNITY FOR DIVERSITY RECRUITING
• TWITTER FOLLOWERS (% CHANGE)
• TWITTER MENTIONS (@MENTIONS + HASHTAGS)/FOLLOWER
• INTERACTION RATE (@REPLIES + RETWEETS)/FOLLOWERS
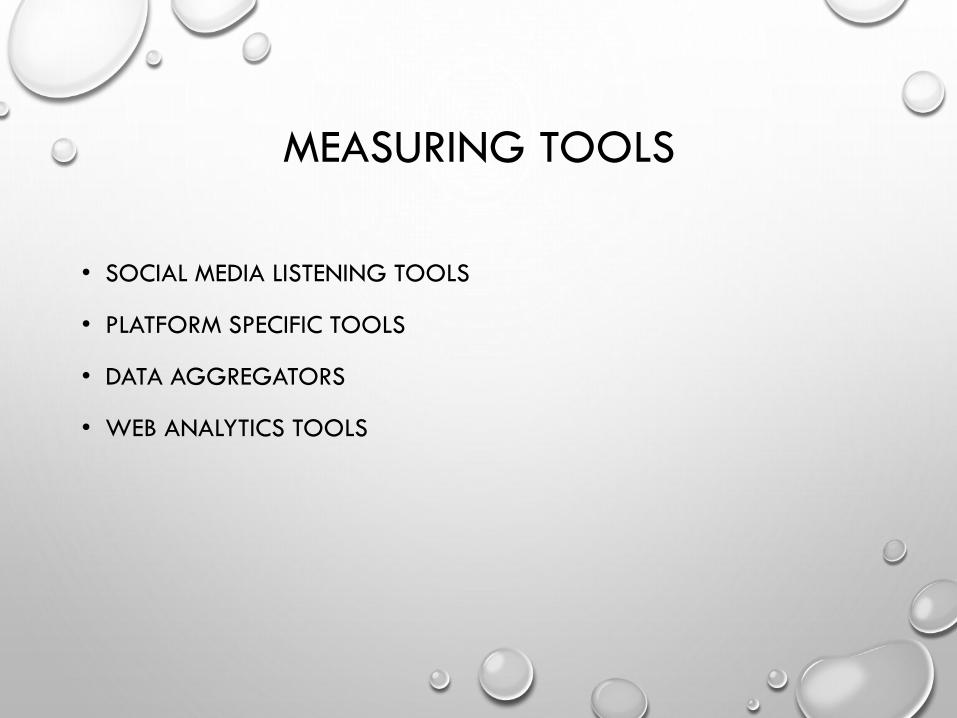
MEASURING TOOLS
• SOCIAL MEDIA LISTENING TOOLS
• PLATFORM SPECIFIC TOOLS
• DATA AGGREGATORS
• WEB ANALYTICS TOOLS
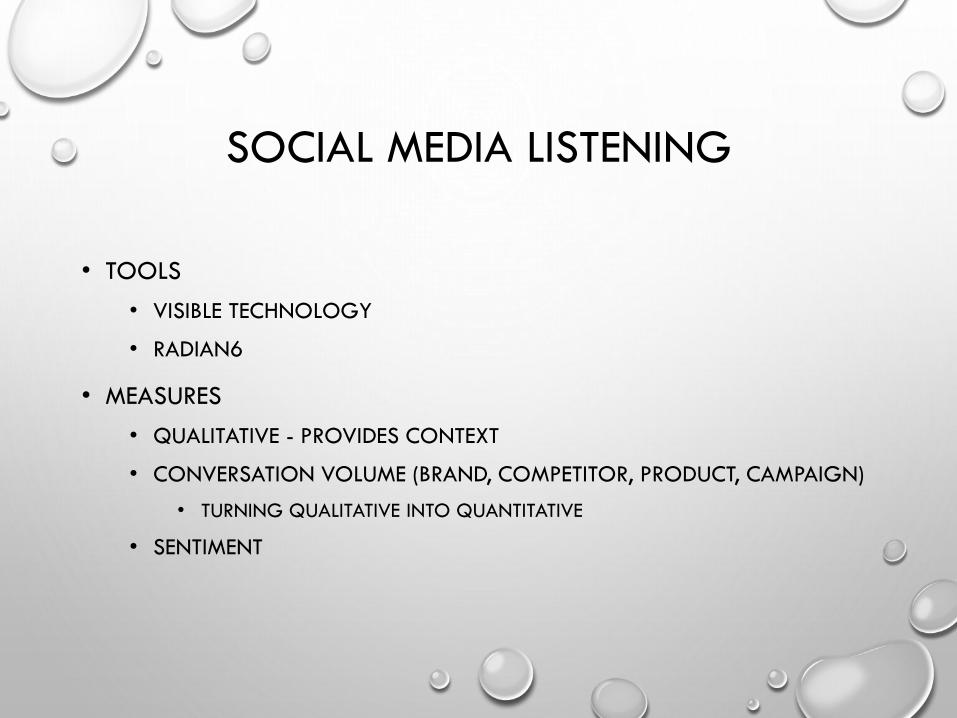
SOCIAL MEDIA LISTENING
• TOOLS
• VISIBLE TECHNOLOGY
• RADIAN6
• MEASURES
• QUALITATIVE - PROVIDES CONTEXT
• CONVERSATION VOLUME (BRAND, COMPETITOR, PRODUCT, CAMPAIGN)
• TURNING QUALITATIVE INTO QUANTITATIVE
• SENTIMENT
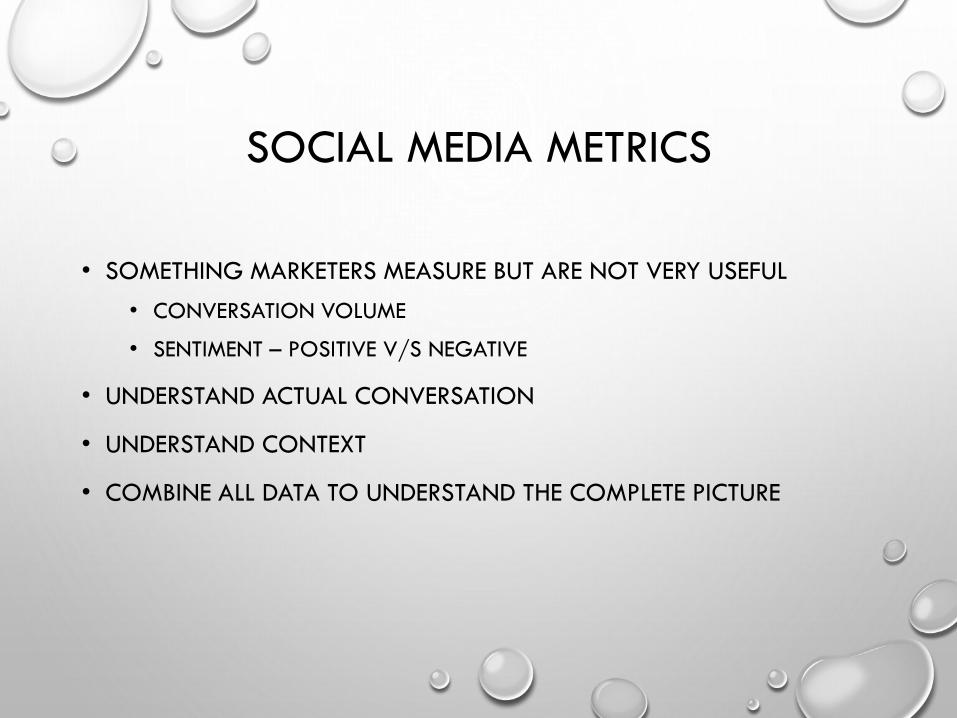
SOCIAL MEDIA METRICS
• SOMETHING MARKETERS MEASURE BUT ARE NOT VERY USEFUL
• CONVERSATION VOLUME
• SENTIMENT – POSITIVE V/S NEGATIVE
• UNDERSTAND ACTUAL CONVERSATION
• UNDERSTAND CONTEXT
• COMBINE ALL DATA TO UNDERSTAND THE COMPLETE PICTURE
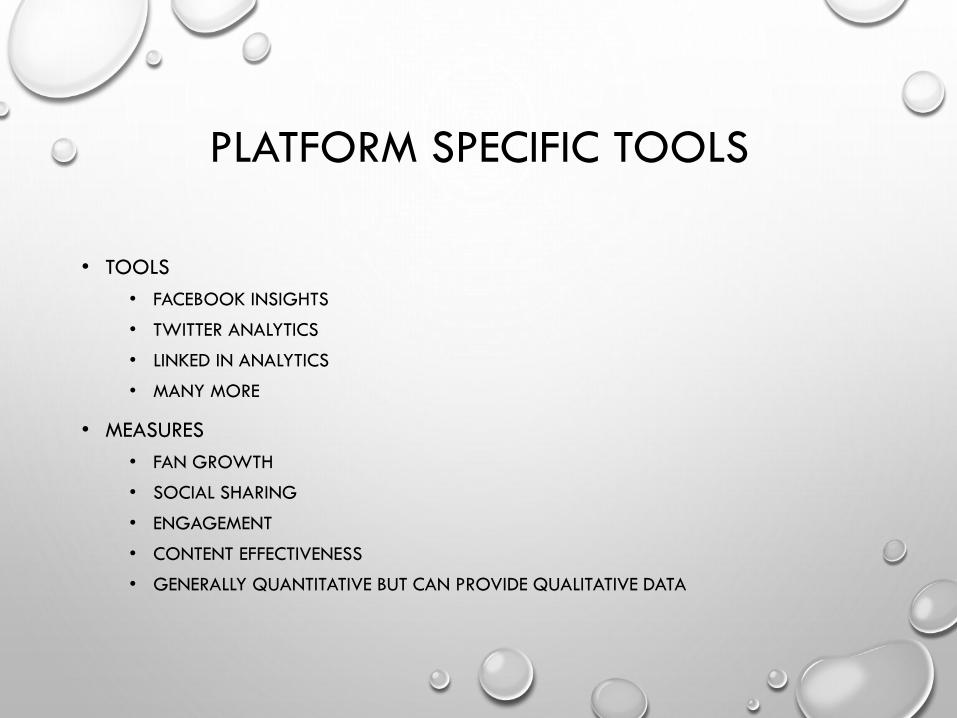
PLATFORM SPECIFIC TOOLS
• TOOLS
• FACEBOOK INSIGHTS
• TWITTER ANALYTICS
• LINKED IN ANALYTICS
• MANY MORE
• MEASURES
• FAN GROWTH
• SOCIAL SHARING
• ENGAGEMENT
• CONTENT EFFECTIVENESS
• GENERALLY QUANTITATIVE BUT CAN PROVIDE QUALITATIVE DATA
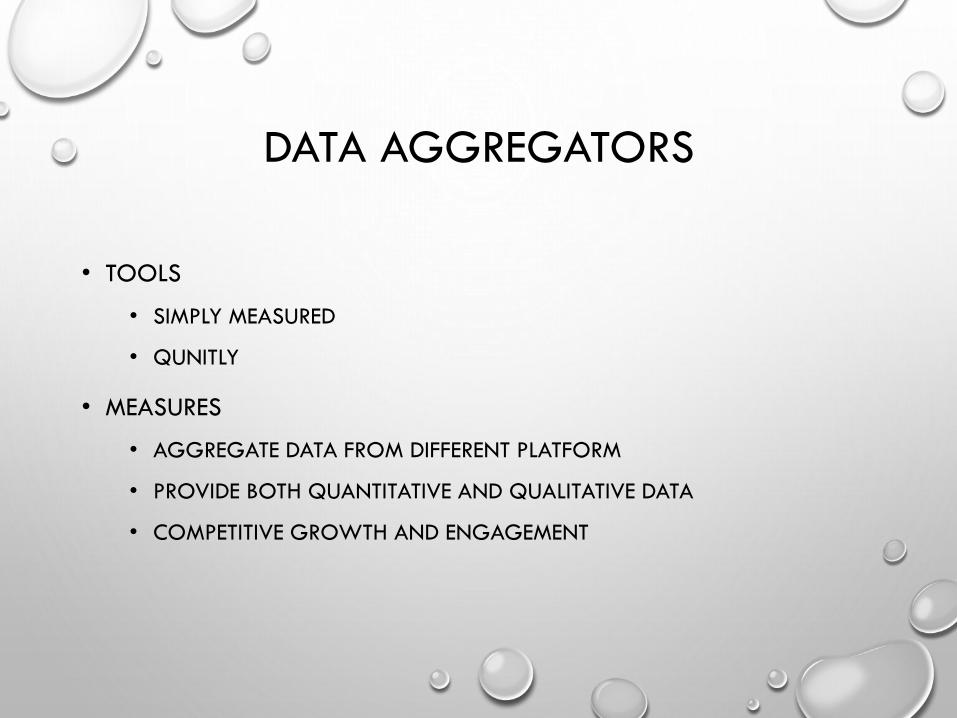
DATA AGGREGATORS
• TOOLS
• SIMPLY MEASURED
• QUNITLY
• MEASURES
• AGGREGATE DATA FROM DIFFERENT PLATFORM
• PROVIDE BOTH QUANTITATIVE AND QUALITATIVE DATA
• COMPETITIVE GROWTH AND ENGAGEMENT
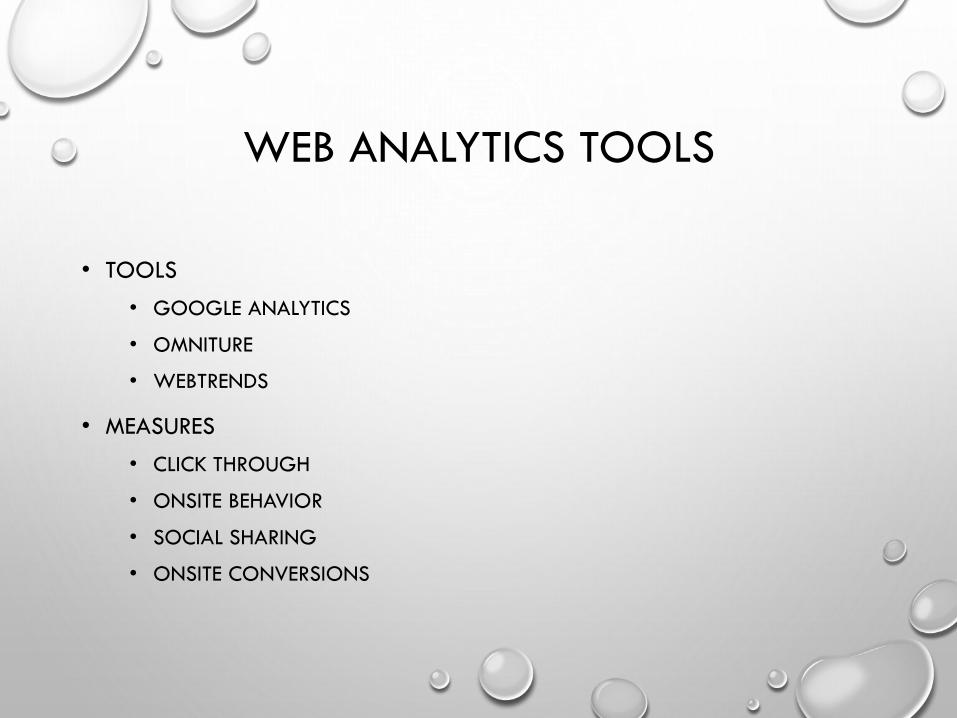
WEB ANALYTICS TOOLS
• TOOLS
• GOOGLE ANALYTICS
• OMNITURE
• WEBTRENDS
• MEASURES
• CLICK THROUGH
• ONSITE BEHAVIOR
• SOCIAL SHARING
• ONSITE CONVERSIONS
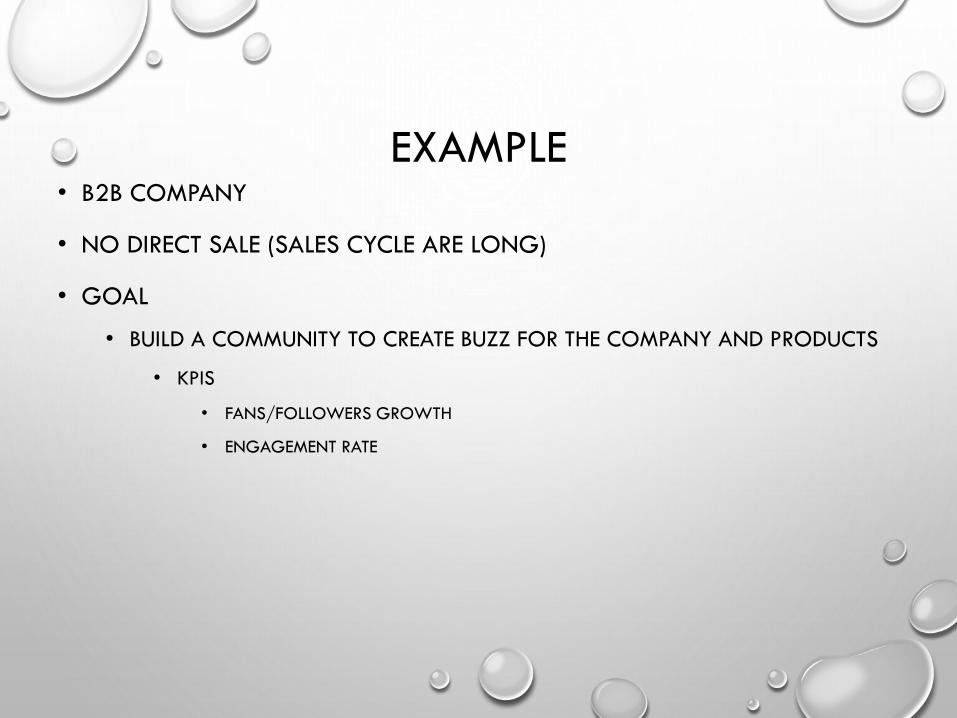
EXAMPLE • B2B COMPANY
• NO DIRECT SALE (SALES CYCLE ARE LONG)
• GOAL
• BUILD A COMMUNITY TO CREATE BUZZ FOR THE COMPANY AND PRODUCTS
• KPIS
• FANS/FOLLOWERS GROWTH
• ENGAGEMENT RATE
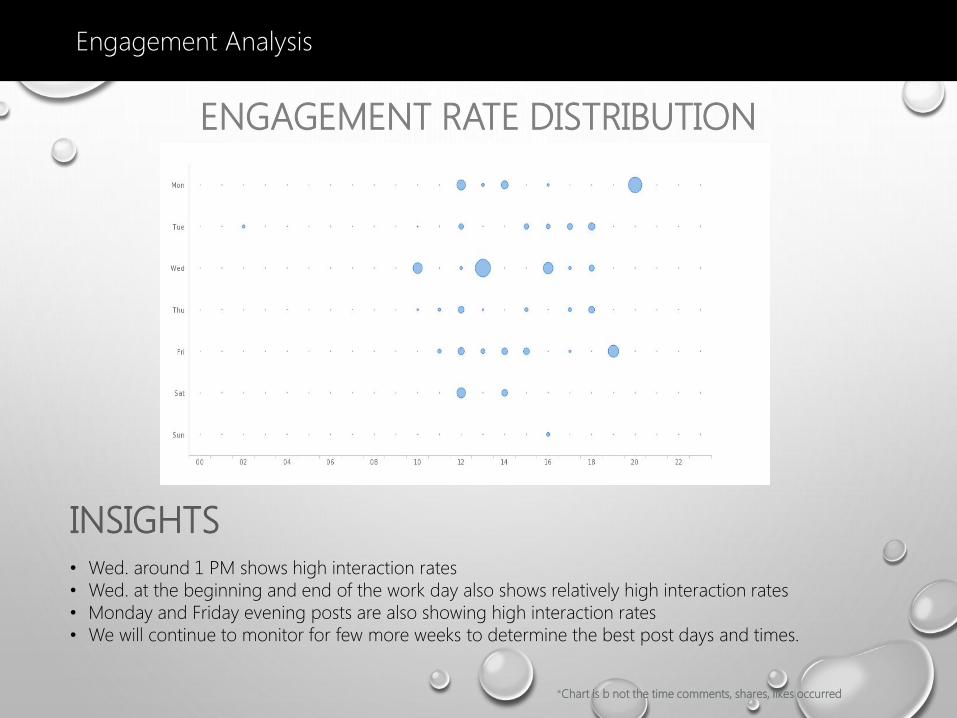
Engagement Analysis
ENGAGEMENT RATE DISTRIBUTION
• Wed. around 1 PM shows high interaction rates
• Wed. at the beginning and end of the work day also shows relatively high interaction rates
• Monday and Friday evening posts are also showing high interaction rates
• We will continue to monitor for few more weeks to determine the best post days and times.
INSIGHTS
*Chart is b not the time comments, shares, likes occurred
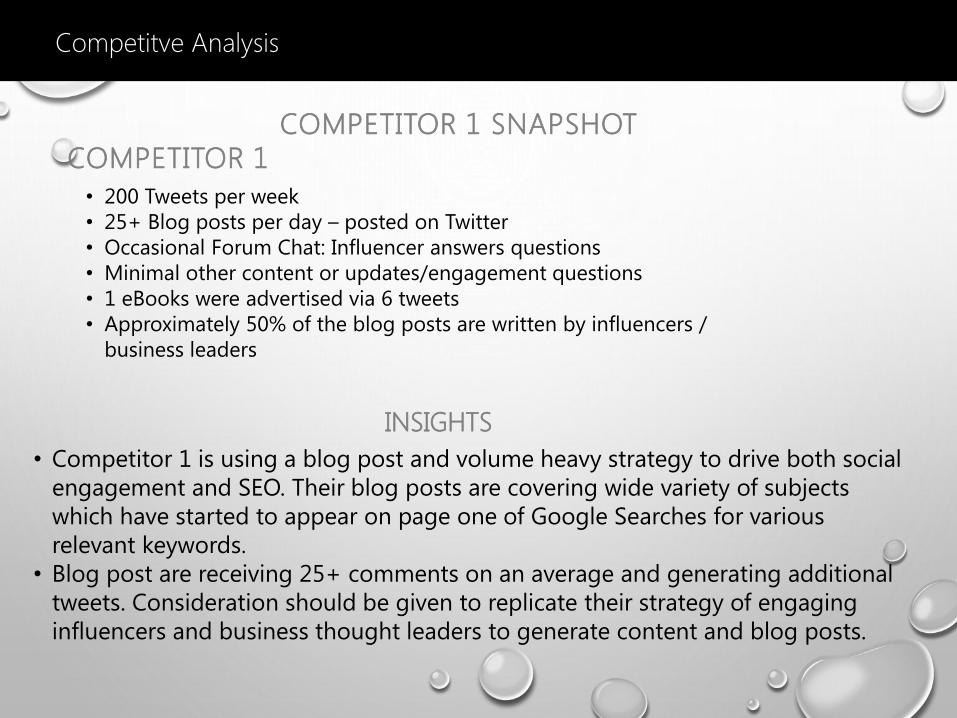
COMPETITOR 1 SNAPSHOT
COMPETITOR 1
• 200 Tweets per week
• 25+ Blog posts per day – posted on Twitter
• Occasional Forum Chat: Influencer answers questions
• Minimal other content or updates/engagement questions
• 1 eBooks were advertised via 6 tweets
• Approximately 50% of the blog posts are written by influencers /
business leaders
Competitve Analysis
• Competitor 1 is using a blog post and volume heavy strategy to drive both social
engagement and SEO. Their blog posts are covering wide variety of subjects
which have started to appear on page one of Google Searches for various
relevant keywords.
• Blog post are receiving 25+ comments on an average and generating additional
tweets. Consideration should be given to replicate their strategy of engaging
influencers and business thought leaders to generate content and blog posts.
INSIGHTS
Week of: Sept. 4 - Sept. 10
Total Mentions
Total Traffic
Started Quote Process
Completed Quote Process
Converted via Phone
Leads to 3rd Parties
* CR = Conversion Rate
4,715
VOLUME SHARE SENTIMENT
4,438
MentionsShare of
Voice
4,301 4,834
Sentiment
4,615 4,539 4,614
Site
Visits
Fans
Followers
4,715
Registrations
4,520 4,715 4,296
Site Facebook Klout Leads Lead CRCommunity
CR
KPIs
263
297 139 275 301 303148
267
223 142 194
313 269 220
267 271 218 125
296 247 218 249 236 244 188 318 282 144 214 257
308 139 257 214 137 121 308 233 167139
229 137 240 159
148
255
317 225 171 174 285 190 155 164 183
192 180 242 221 215 201
Sales
255 183 174 124
230 295 196
4,500 4,205
139
SALESREACH ENGAGEMENT LEADS
4,977 4,659
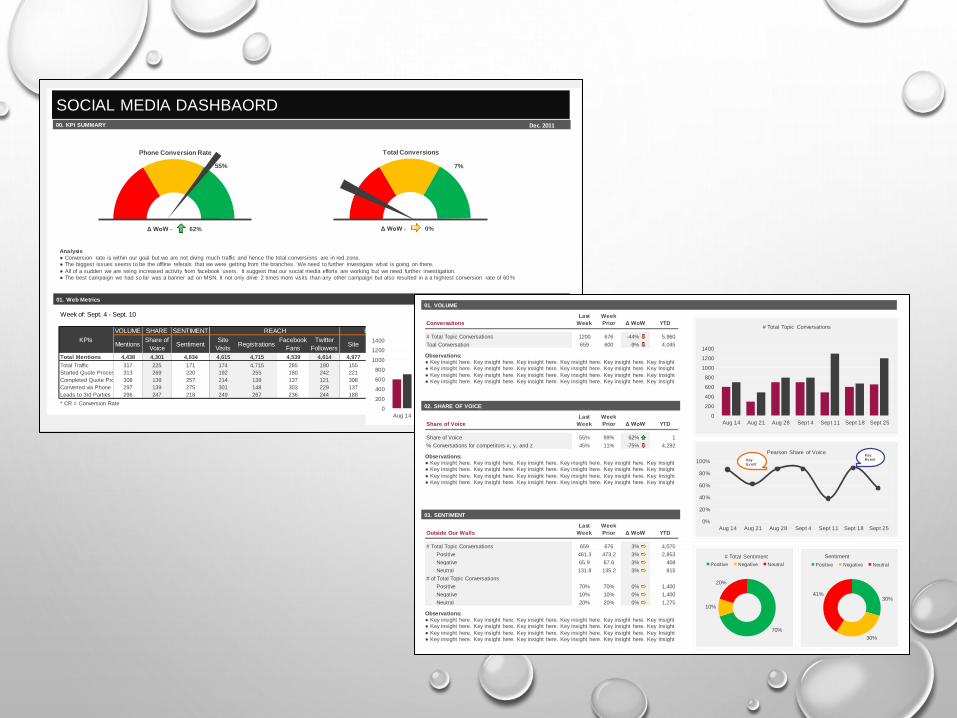
SOCIAL MEDIA DASHBAORD00. KPI SUMMARY
01. Web Metrics
55%
Phone Conversion Rate
Δ WoW - 62%
Total Conversions
Δ WoW - 0%
Analysis Conversion rate is within our goal but we are not diving much traffic and hence the total conversions are in red zone. The biggest issues seems to be the offline referals that we were getting from the branches. We need to further investigate what is going on there.
All of a sudden we are seing increased activity from facebook users. It suggest that our social media efforts are working but we need further investigation. The best campaign we had so far was a banner ad on MSN. It not only drive 2 times more visits than any other campaign but also resulted in a a hightest conversion rate of 60%
7%
Dec. 2011
0
200
400
600
800
1000
1200
1400
Sept 25Sept 18Sept 11Sept 4Aug 28Aug 21Aug 14
# Total Topic ConversationsConversations
# Total Topic Conversations
Toal Conversation
Share of Voice
Share of Voice
% Conversations for competitors x, y, and z
Outside Our Walls
# Total Topic Conversations
Positive
Negative
Neutral
# of Total Topic Conversations
Positive
Negative
Neutral
659 600 -9% 4,045
45% 11%
55% 89% 62% 1
659 676 3% 4,075
461.3 473.2 3% 2,853
65.9 67.6 3% 408
131.8 135.2 3% 815
10% 10% 0% 1,400
20% 20% 0% 1,275
YTD Δ WoW
Week
Prior
Last
Week
Last
Week
Week
Prior Δ WoW YTD
Last
Week
Week
Prior Δ WoW YTD
-75% 4,292
1200 676 -44% 5,960
70% 70% 0% 1,400
01. VOLUME
02. SHARE OF VOICE
03. SENTIMENT
0
200
400
600
800
1000
1200
1400
Sept 25Sept 18Sept 11Sept 4Aug 28Aug 21Aug 14
# Total Topic Conversations
70%
10%
20%
# Total Sentiment
Positive Negative Neutral
30%
30%
41%
Sentiment
Positive Negative Neutral
Observations: Key insight here. Key insight here. Key insight here. Key insight here. Key insight here. Key Insight Key insight here. Key insight here. Key insight here. Key insight here. Key insight here. Key Insight
Key insight here. Key insight here. Key insight here. Key insight here. Key insight here. Key Insight Key insight here. Key insight here. Key insight here. Key insight here. Key insight here. Key Insight
0%
20%
40%
60%
80%
100%
Sept 25Sept 18Sept 11Sept 4Aug 28Aug 21Aug 14
Pearson Share of VoiceKey Ev entKey
Ev ent
ROI
• WE SET THE BASELINE
• COMPARED AGAINST COMPETITORS
• CREATED PROJECTIONS
• COMPARED AGAINST PROJECTIONS

IF YOU REALLY WANT PURE FINANCIAL METRICS
• DIRECT CONVERSIONS
• INDICATORS THAT LEAD TO CONVERSIONS
• DOWNLOADS
• EVENT SIGNUPS
• REGISTRATIONS
• EARNED VALUE – AD EXPOSURE
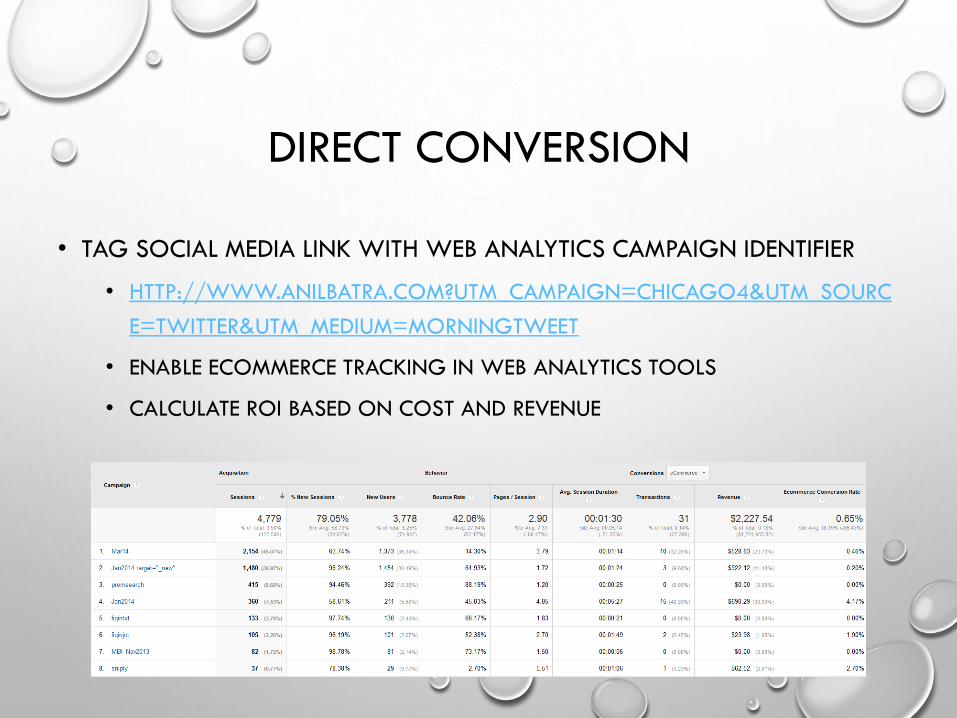
DIRECT CONVERSION
• TAG SOCIAL MEDIA LINK WITH WEB ANALYTICS CAMPAIGN IDENTIFIER
• HTTP://WWW.ANILBATRA.COM?UTM_CAMPAIGN=CHICAGO4&UTM_SOURC
E=TWITTER&UTM_MEDIUM=MORNINGTWEET
• ENABLE ECOMMERCE TRACKING IN WEB ANALYTICS TOOLS
• CALCULATE ROI BASED ON COST AND REVENUE
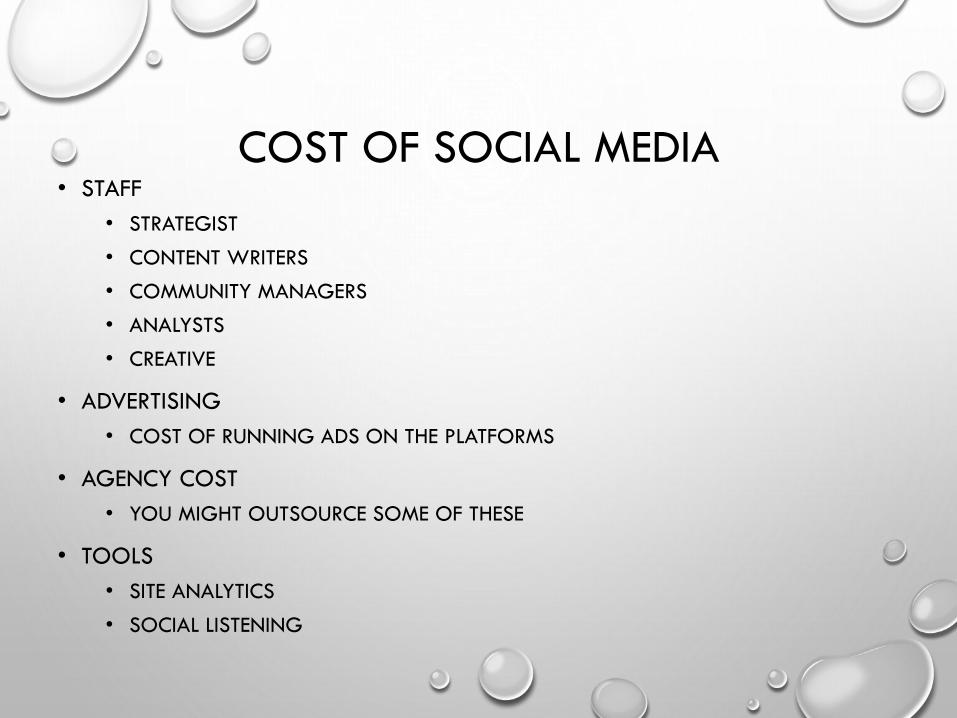
COST OF SOCIAL MEDIA • STAFF
• STRATEGIST
• CONTENT WRITERS
• COMMUNITY MANAGERS
• ANALYSTS
• CREATIVE
• ADVERTISING
• COST OF RUNNING ADS ON THE PLATFORMS
• AGENCY COST
• YOU MIGHT OUTSOURCE SOME OF THESE
• TOOLS
• SITE ANALYTICS
• SOCIAL LISTENING
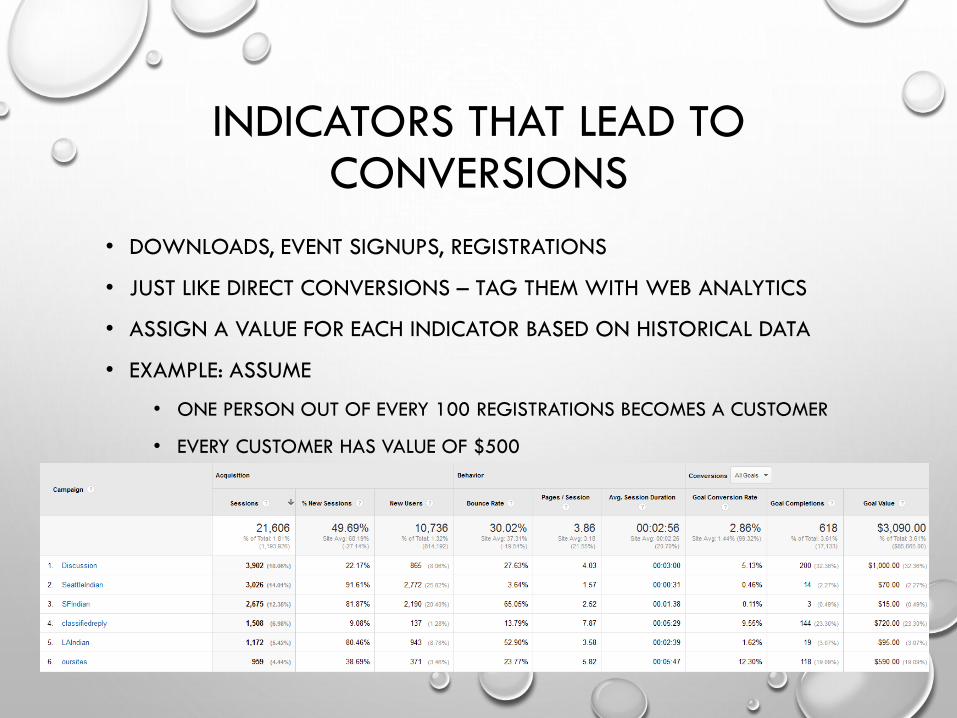
INDICATORS THAT LEAD TO CONVERSIONS
• DOWNLOADS, EVENT SIGNUPS, REGISTRATIONS
• JUST LIKE DIRECT CONVERSIONS – TAG THEM WITH WEB ANALYTICS
• ASSIGN A VALUE FOR EACH INDICATOR BASED ON HISTORICAL DATA
• EXAMPLE: ASSUME
• ONE PERSON OUT OF EVERY 100 REGISTRATIONS BECOMES A CUSTOMER
• EVERY CUSTOMER HAS VALUE OF $500
• WHICH MEAN EVERY REGISTRATION IS WORTH $5 - (1/100)*500
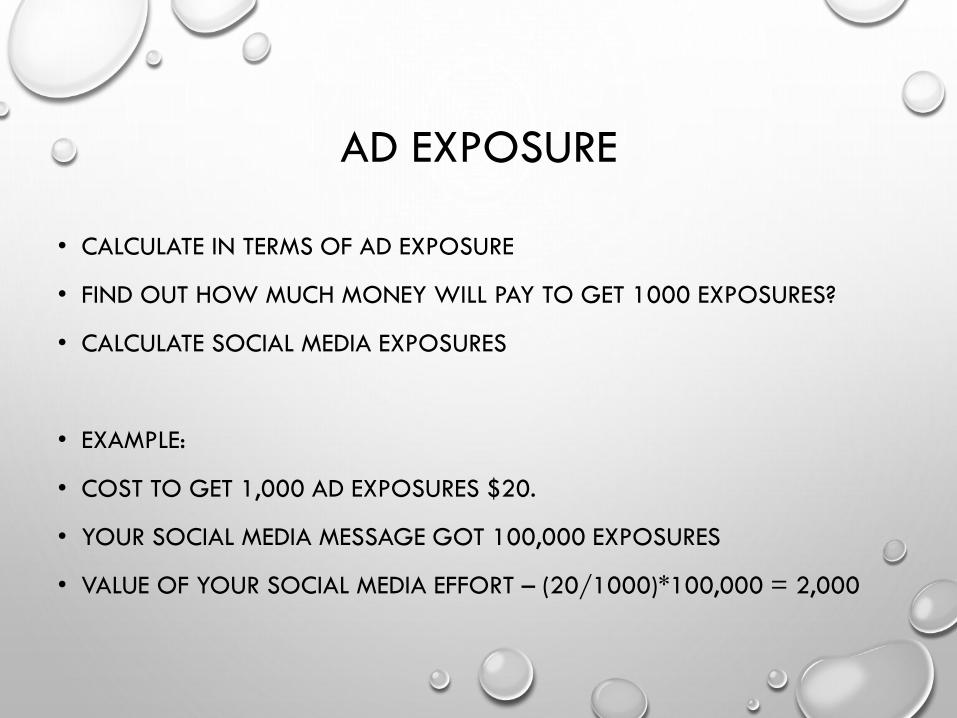
AD EXPOSURE
• CALCULATE IN TERMS OF AD EXPOSURE
• FIND OUT HOW MUCH MONEY WILL PAY TO GET 1000 EXPOSURES?
• CALCULATE SOCIAL MEDIA EXPOSURES
• EXAMPLE:
• COST TO GET 1,000 AD EXPOSURES $20.
• YOUR SOCIAL MEDIA MESSAGE GOT 100,000 EXPOSURES
• VALUE OF YOUR SOCIAL MEDIA EFFORT – (20/1000)*100,000 = 2,000
QUESTIONS?
ANIL BATRA
@ANILBATRA
HTTP://WWW.ANILBATRA.COM