Embed Size (px)
Citation preview

Cox Communications
Cox Communications


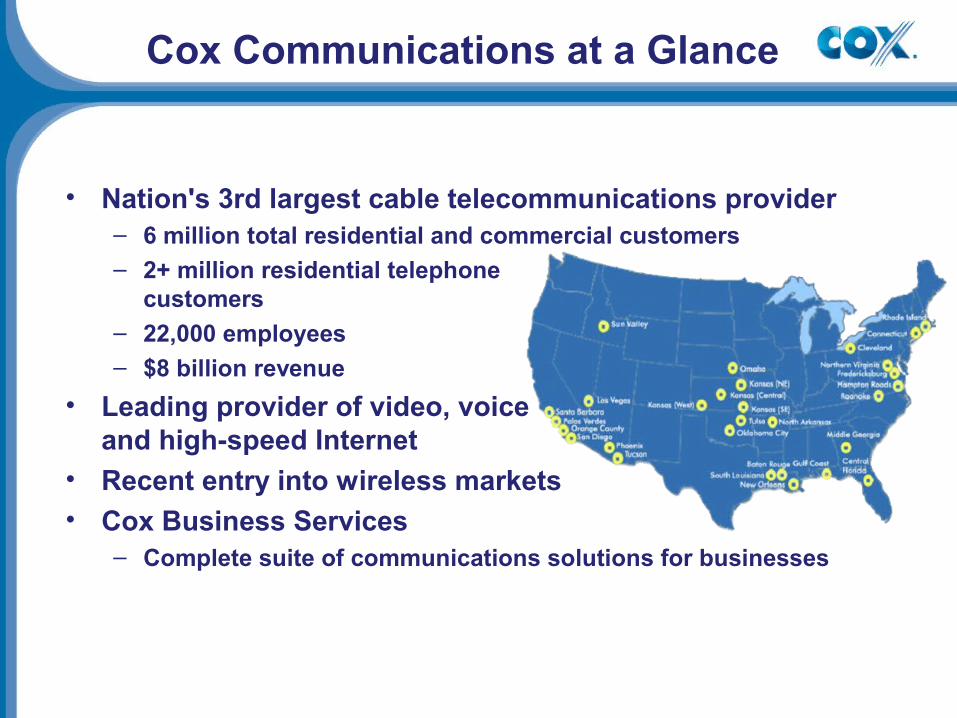
Cox Communications at a Glance
• Nation's 3rd largest cable telecommunications provider– 6 million total residential and commercial customers– 2+ million residential telephone
customers
– 22,000 employees– $8 billion revenue
• Leading provider of video, voiceand high-speed Internet
• Recent entry into wireless markets• Cox Business Services
– Complete suite of communications solutions for businesses
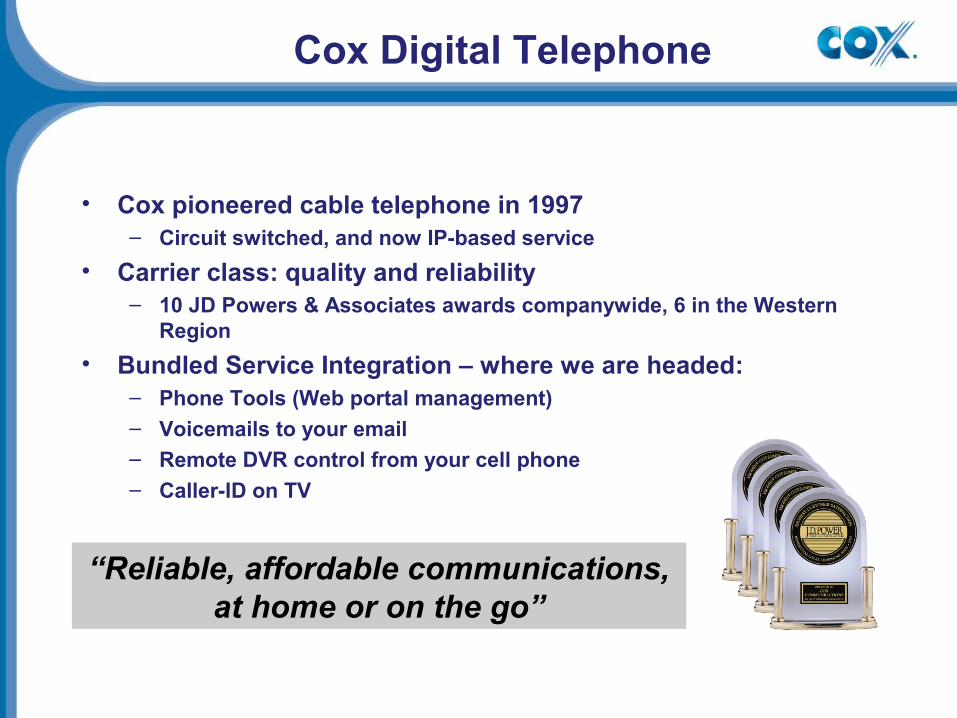
Cox Digital Telephone
• Cox pioneered cable telephone in 1997– Circuit switched, and now IP-based service
• Carrier class: quality and reliability– 10 JD Powers & Associates awards companywide, 6 in the Western
Region
• Bundled Service Integration – where we are headed:– Phone Tools (Web portal management)– Voicemails to your email– Remote DVR control from your cell phone– Caller-ID on TV
“Reliable, affordable communications,at home or on the go”
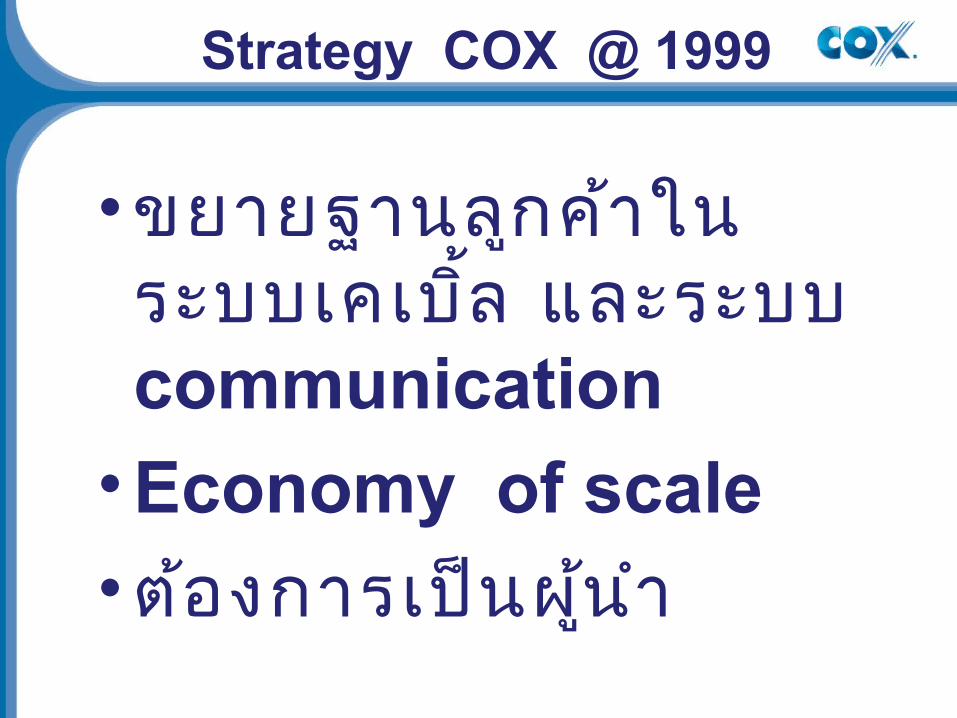
Strategy COX @ 1999
•ขยายฐานลูกค ้าในระบบเคเบ ิ้ล และระบบ communication •Economy of scale •ต้องการเป ็นผ ู้น ำา
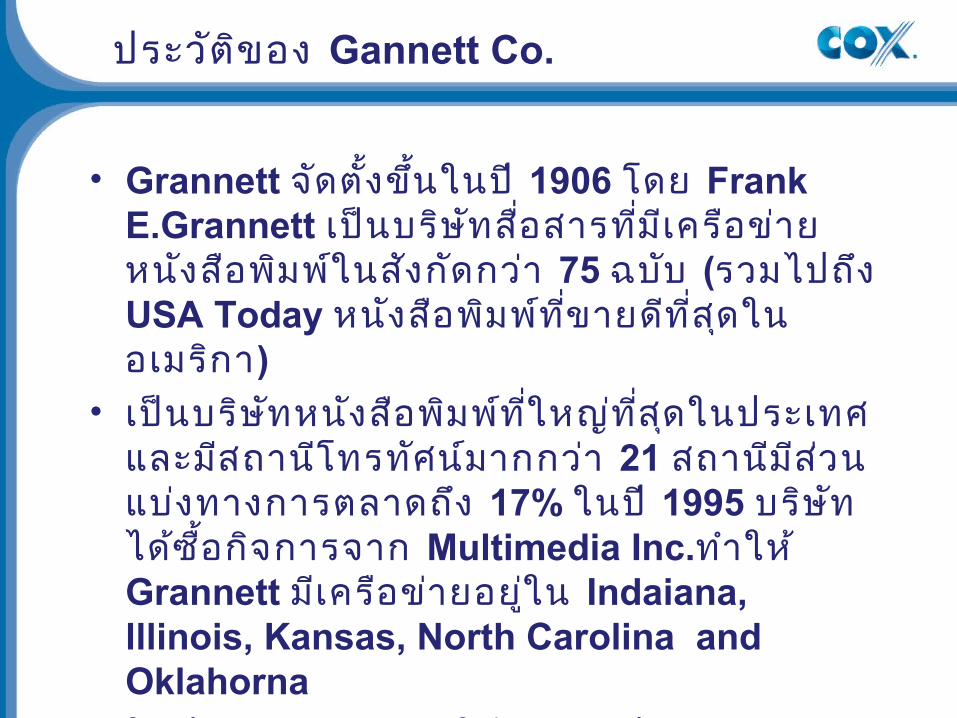
ประว ัตขิอง Gannett Co.
• Grannett จัดต ั้งข ึ้นในปี 1906 โดย Frank E.Grannett เป ็นบร ิษทัส ือ่สารทีม่ เีคร ือข ่ายหนงัส ือพมิพใ์นสังก ัดกว ่า 75 ฉบับ (รวมไปถึง USA Today หนงัสอืพมิพท์ ีข่ายดที ี่สดุในอเมร ิกา)
• เป ็นบร ิษทัหนงัส ือพมิพท์ ีใ่หญ่ท ีส่ดุในประเทศและมสีถานโีทรทศัน ์มากกว่า 21 สถานมีสีว่นแบ่งทางการตลาดถึง 17% ในปี 1995 บริษ ัทไดซ้ ื้อก ิจการจาก Multimedia Inc.ทำาให ้Grannett มเีคร ือข ่ายอยูใ่น Indaiana, lllinois, Kansas, North Carolina and Oklahorna
• ในปี 1999 มสีมาชิกใช้บร ิการประมาณ 522,000 ราย
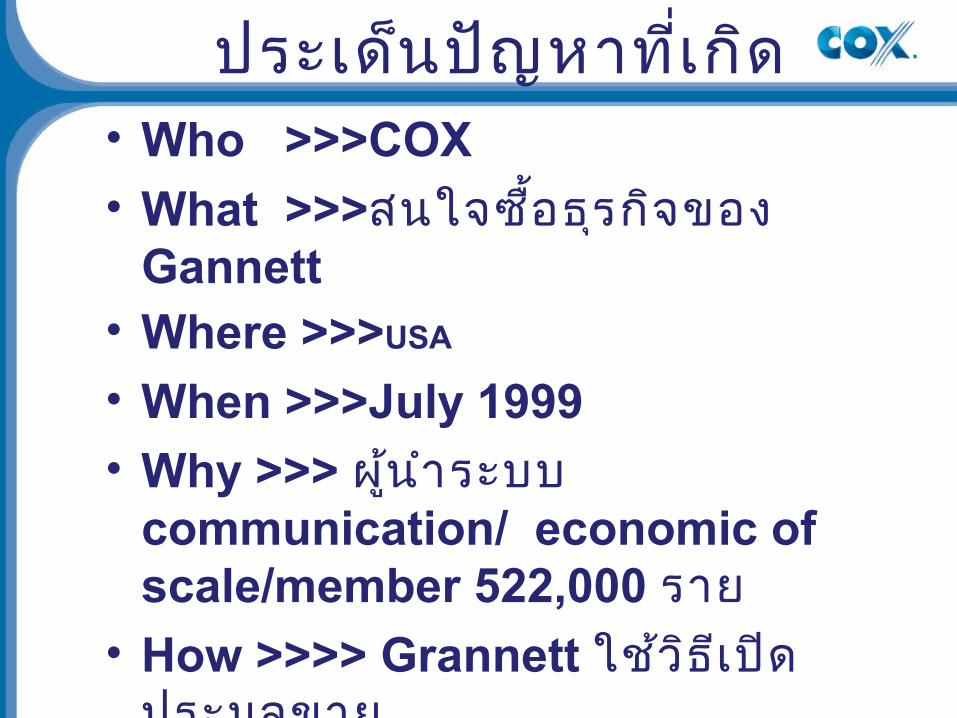
ประเดน็ปญัหาทีเ่กดิ• Who >>>COX
• What >>>สนใจซื้อธรุก ิจของ Gannett
• Where >>>USA
• When >>>July 1999• Why >>> ผู้น ำาระบบ
communication/ economic of scale/member 522,000 ราย
• How >>>> Grannett ใช้ว ิธ เีป ิดประมลูขาย
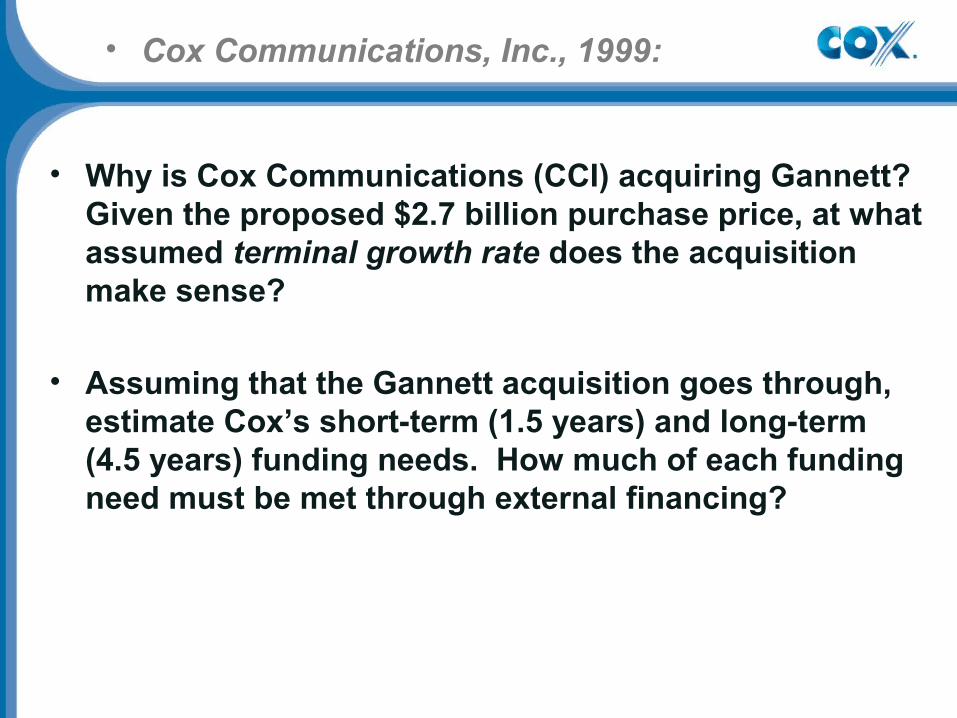
• Why is Cox Communications (CCI) acquiring Gannett? Given the proposed $2.7 billion purchase price, at what assumed terminal growth rate does the acquisition make sense?
• Assuming that the Gannett acquisition goes through, estimate Cox’s short-term (1.5 years) and long-term (4.5 years) funding needs. How much of each funding need must be met through external financing?
• Cox Communications, Inc., 1999:
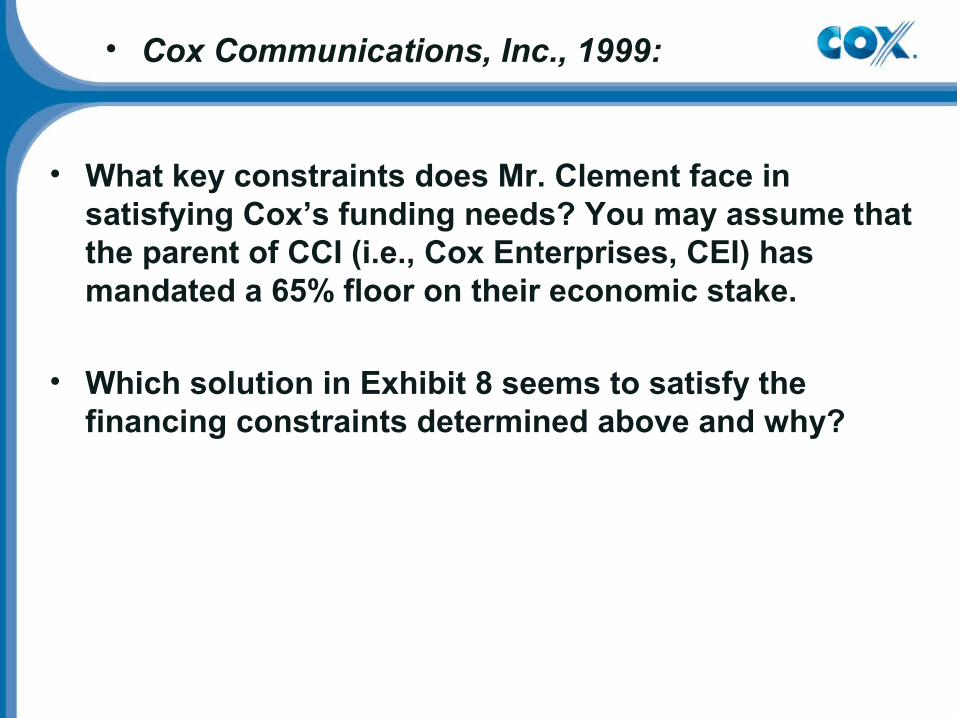
• What key constraints does Mr. Clement face in satisfying Cox’s funding needs? You may assume that the parent of CCI (i.e., Cox Enterprises, CEI) has mandated a 65% floor on their economic stake.
• Which solution in Exhibit 8 seems to satisfy the financing constraints determined above and why?
• Cox Communications, Inc., 1999:
дѥі ѠѠдшіѥѥіў ьѨҟўіѪѠдѥі дѬҖѕ Ѫєѝ
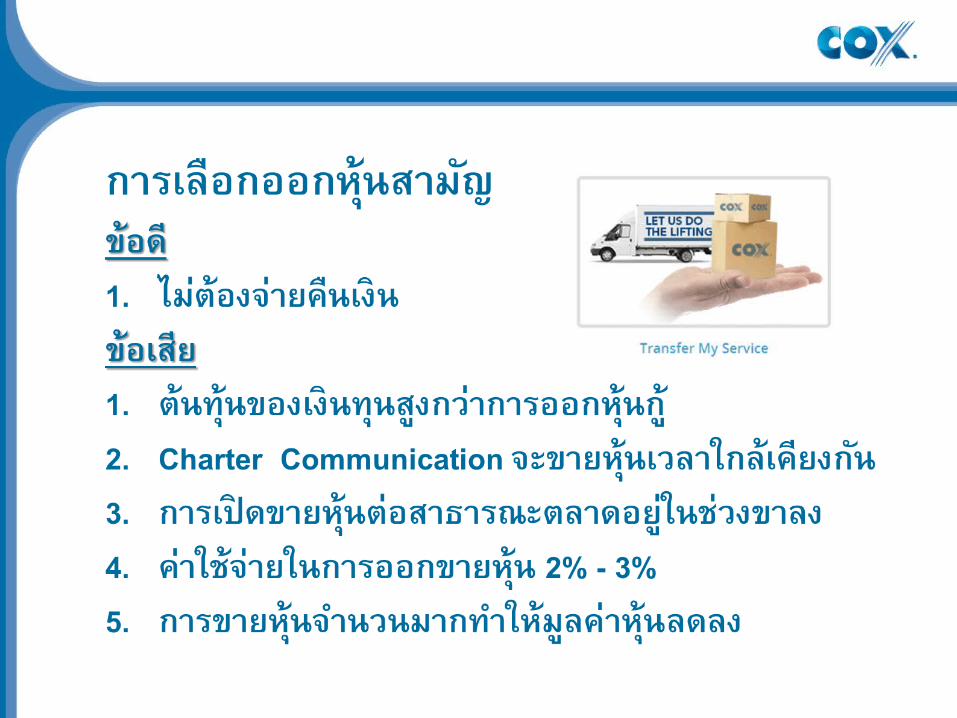
юіѣѱѕньҙѰјѣеҖѠлѼѥдѤчѲьдѥіѠѠдшіѥѥіўьѨҟўіѪѠдѥідѬҖѕѪєеѠкѝ COX
юі ѣѱѕ н ь ҙ е ҖѠлѼѥд Ѥч 1. шҖьъѫьъѥкші кѰј ѣшҖьъѫьъѥкѠҖѠєеѠкдѥі ѠѠдші ѥ
ѥі ў ьѨѸшѼѷѥдњҕѥшҖьъѫьѲьдѥі ѠѠдў ѫҖь ѥєѤрѝ ѝ 2. шҖьъѫьдѥі чѼѥѯьѧькѥьлѣщѬддњҕѥюі ѣєѥц 2%
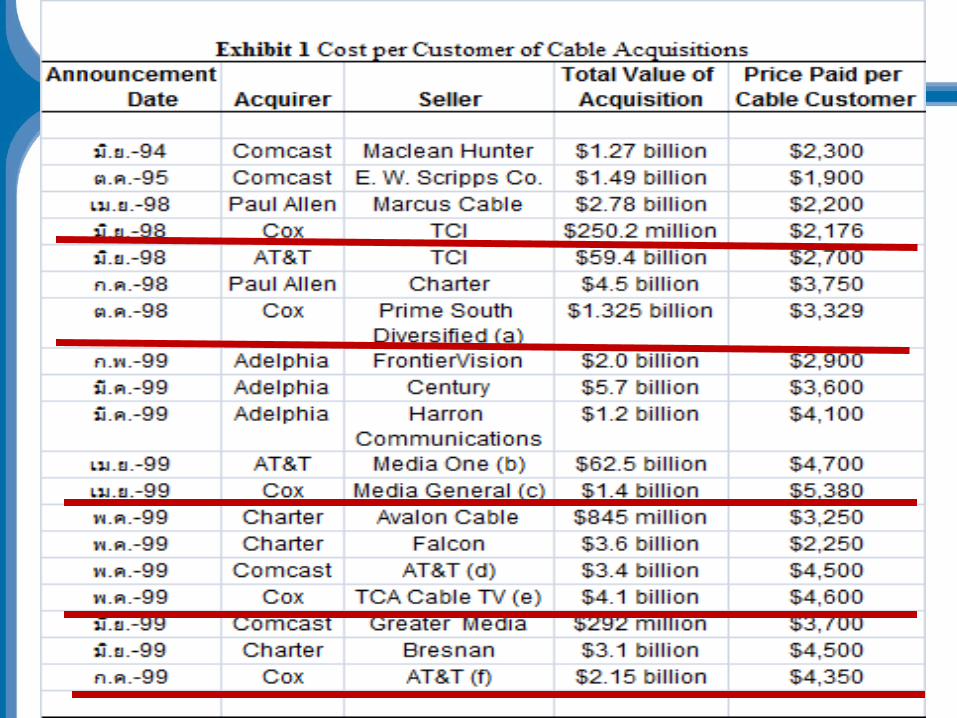
1. COX єѨз њѥєдѤкњј ѯдѨѷѕњдѤэяј ді ѣъэч Җѥьдѥі ѯкѧьѰј ѣі ѣєѤчі ѣњѤкѲьдѥі лѣѠѠдші ѥ ѥі ў ьѨѸѯьѪѷѠклѥдѝѯєѪѷѠюѨ 1995 Cox єѨші ѥ ѥі ў ьѨѸѯё ѧѷєеѩѸьѝ 1.9 ё Ѥьј ҖѥьчѠј ј ѥі ҙші ѥ ѥі ў ьѨѸєѨѠѥѕѫі ѣў њҕѥкѝ 5 - 30 юѨѰј ѣєѨяјшѠэѰъьѲьнҕњк 65-115 Basis point
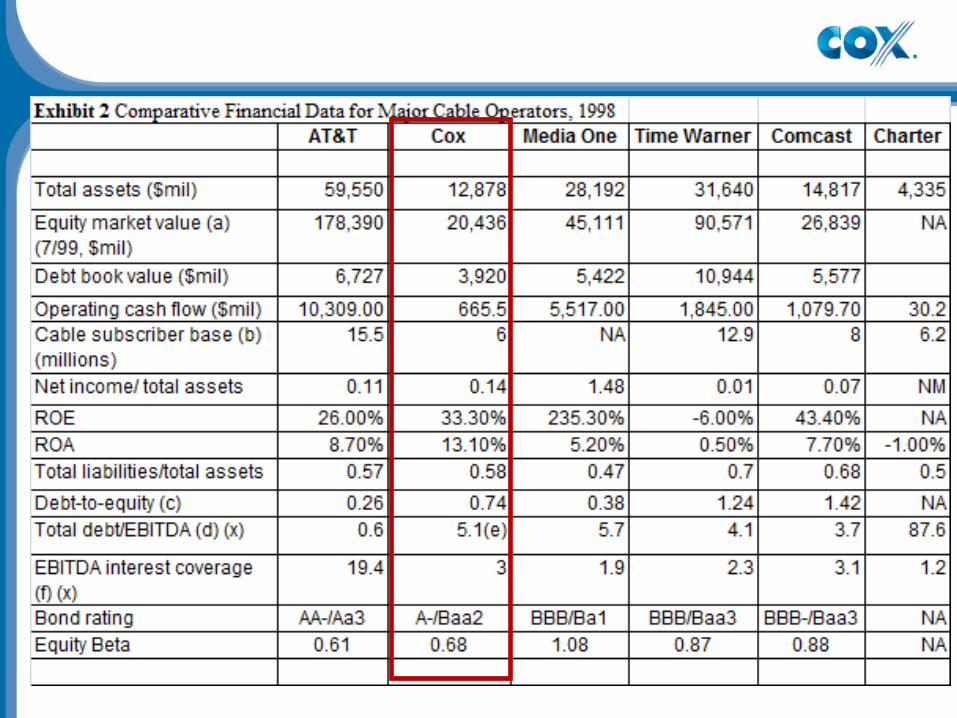
2. COX ѯюѶьэ і ѧќ ѤъѕҕѠѕъ ѨѷєѨші ѥ ѥі ў ьѨѸѲў р ҕъѨѷѫчѲьѝ ѝдј ѫҕєеѠк CEI
3. дѥі ѠѠдѤчҕњьеѠкшіѥѥіўьѨѸшҖѠкѯўєѥѣєдѤэѝ ѝ ѝ ѝші ѥ ѥі ъѫьеѠкэі ѧќ Ѥъѝ
4. ѤчҕњьеѠкўьѨѸѧьѝѝ ѝ /дѼѥѳі дҕѠьў Ѥдѓ ѥќ ѨчѠдѯэ ѨѸѕлҕѥѕѰјѣзҕѥѯ ѪѷѠєіѥз ѥѝ (DEBT/EBITDA)
5. ѯюҖѥўєѥѕ ѤчҕњьеѠкўьѨѸѧьѝ ѝ ѝ /дѼѥѳі дҕѠьў Ѥдѓ ѥќ ѨчѠдѯэѨѸѕлҕѥѕѰј ѣзҕѥѯѪѷѠєіѥзѥѲўҖѳєҕѯдѧьѝ 5 о ѩѷкѯюѶьѠѤші ѥ Ѭк ѫчѝ ѝ
6. і Ѥдќ ѥдѥі лѤчѯді чў і ѪѠѠѤьчѤэдѥі ј къѫьѳєҕѲў ҖшѼѷѥдњҕѥѯч ѧє ъѨѷяѬҖэі ѧў ѥі ѕѠєі Ѥэѳч Җэі ѧќ ѤъєѨз њѥєєѤѷьз к
7. яј ді ѣъэеѠкшј ѥчѲьдѥі ѠѠдші ѥ ѥі ў ьѨѸѝ (дѤэў ѫҖьеѠк Cox) лѣѠѕѬҕъ Ѩѷ1%-2%
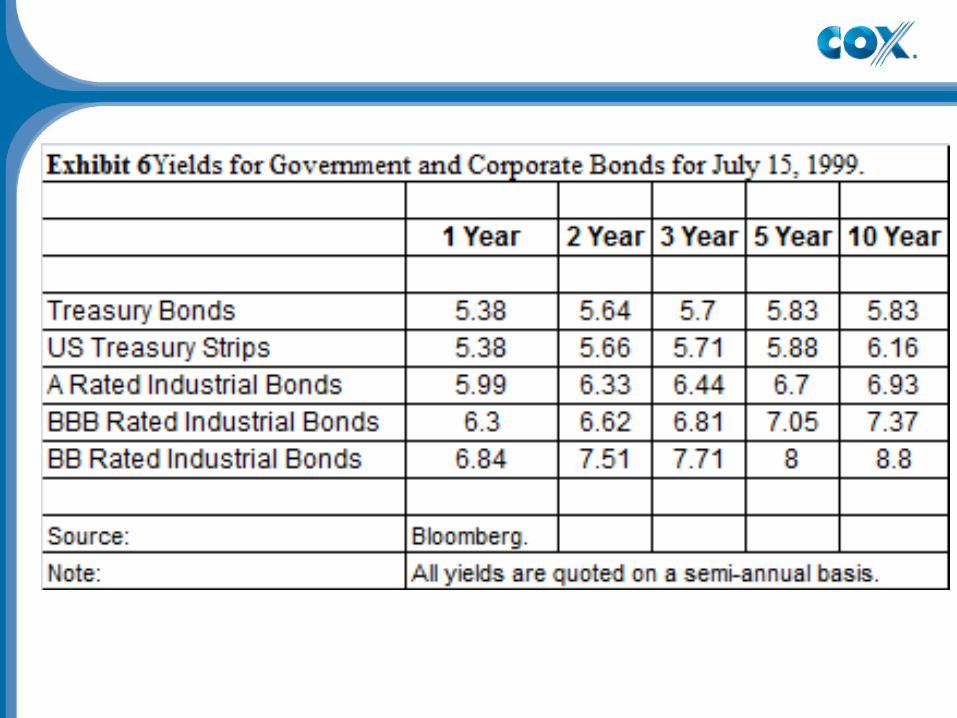
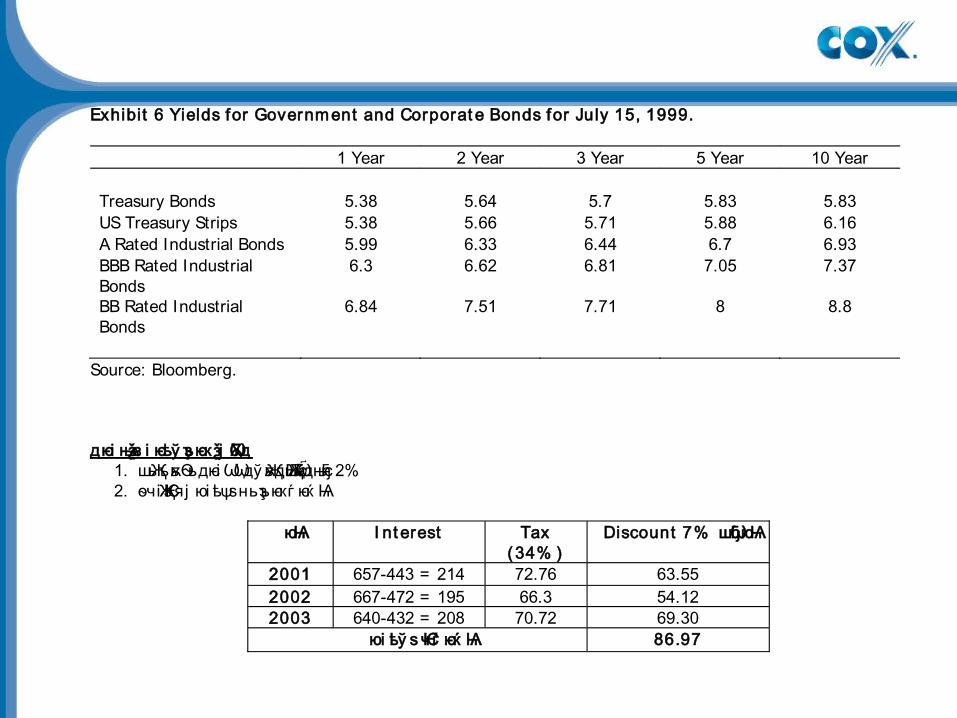
Exhibit 6 Yields for Government and Corporat e Bonds for July 15, 1999.
1 Year 2 Year 3 Year 5 Year 10 Year Treasury Bonds 5.38 5.64 5.7 5.83 5.83 US Treasury Strips 5.38 5.66 5.71 5.88 6.16 A Rated Industrial Bonds 5.99 6.33 6.44 6.7 6.93 BBB Rated Industrial Bonds
6.3 6.62 6.81 7.05 7.37
BB Rated Industrial Bonds
6.84 7.51 7.71 8 8.8
Source: Bloomberg.
дѥі њѧѯз і ѥѣў ҙъѥкѯј ѪѠд1. шҖьъѫьѲьдѥі ѠѠдў ѫҖьдѬҖшѼѷѥдњҕѥ 2% 2. ѳч Җі Ѥэяј юі ѣѱѕньҙъѥкѓ ѥќ Ѩ
юѨ I nt erest Tax
(34% ) Discount 7% шҕѠюѨ
2001 657-443 = 214 72.76 63.55 2002 667-472 = 195 66.3 54.12 2003 640-432 = 208 70.72 69.30
юі ѣў ѕ Ѥч ѓ ѥќ Ѩ 86.97

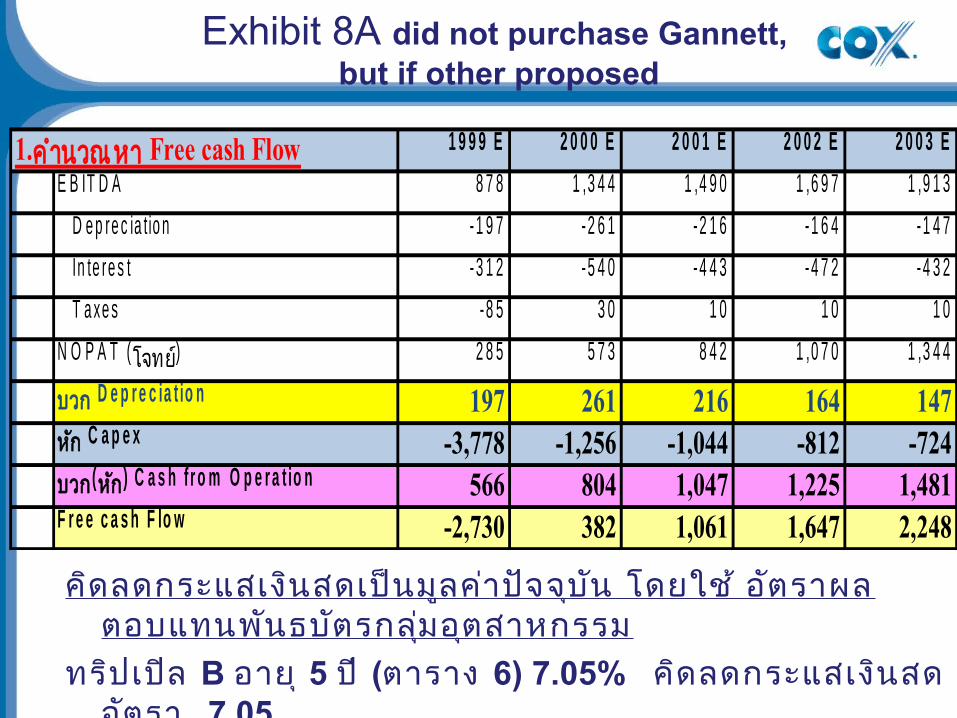
1.ค ำำนวณ หำ Free cash Flow 1 9 9 9 E 2 0 0 0 E 2 0 0 1 E 2 0 0 2 E 2 0 0 3 E
E B IT D A 8 7 8 1 ,3 4 4 1 ,4 9 0 1 ,6 9 7 1 ,9 1 3
D e p re c ia t io n - 1 9 7 -2 6 1 -2 1 6 -1 6 4 -1 4 7
In te re s t - 3 1 2 -5 4 0 -4 4 3 -4 7 2 -4 3 2
T a xe s -8 5 3 0 1 0 1 0 1 0
N O P A T (โจทย์) 2 8 5 5 7 3 8 4 2 1 ,0 7 0 1 ,3 4 4
บวก D e p r e c ia t io n 197 261 216 164 147หกั C a p e x -3,778 -1,256 -1,044 -812 -724บวก (หกั ) C a s h f r o m O p e r a t io n 566 804 1,047 1,225 1,481F r e e c a s h F lo w -2,730 382 1,061 1,647 2,248
คดิลดกระแสเงนิสดเปน็ม ูลคำ่ปจัจบุนั โดยใช ้อ ัตรำผลตอบแทนพันธบตัรกล ุม่อตุสำหกรรม
ทร ิปเปลิ B อำย ุ5 ป ี(ตำรำง 6) 7.05% คดิลดกระแสเงนิสดอัตรำ 7.05
NPVกระแสเงนิสดสทุธ ิ 1.607 IRR 25.30%
Exhibit 8A did not purchase Gannett, but if other proposed
ประมำณกำรกระแสเง ินสดสำำหร ับกำรต ิดตอ่ส ื่อสำร Cox ถ้ำซ ื้อแกนเนตตโ์ดยกำรออกตรำสำรหนี ้(หลกั : ล้ำนดอลลำร ์)
• Exhibit 8B
1.คำำนวณหำ Free cash FlowEBITDA 878 1,495 1,653 1,873 2,103
Depreciation -197 -267 -221 -169 -152
Interest -312 -540 -657 -667 -640
Taxes -85 30 10 10 10
NOPAT (โจทย์) 284 718 785 1047 1321
บวก Depreciation 197 267 221 169 152หัก Capex -3,778 -3,986 -1,069 -837 -749บวก(หัก) Cash from Operation 566 955 996 1,207 1,463Free cash Flow -2,731 -2,046 933 1,586 2,187
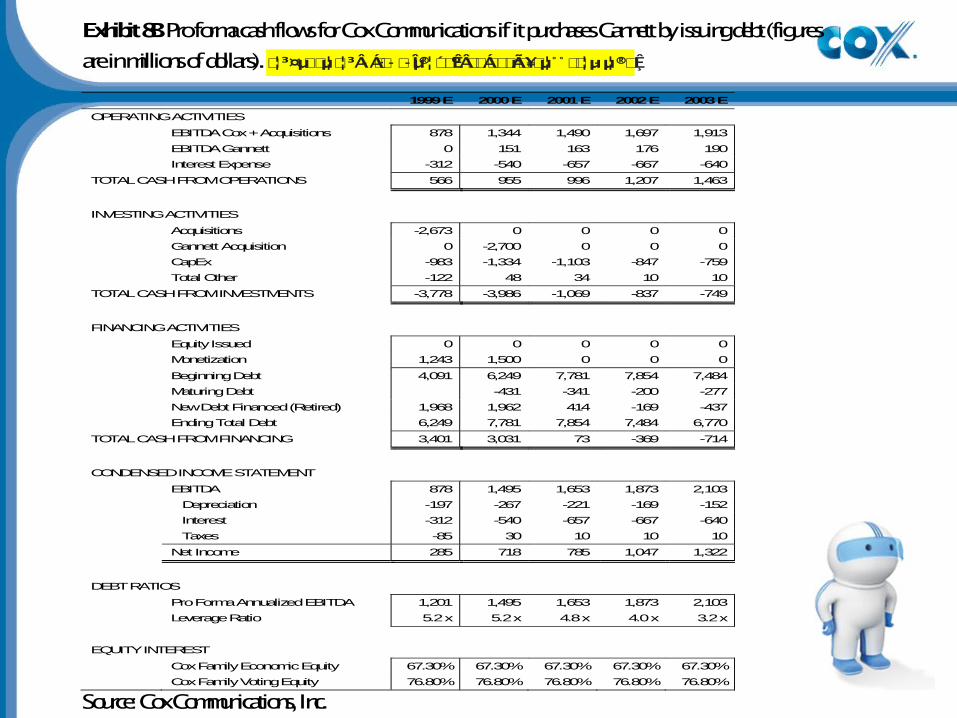
Exhibit 8B Pro forma cash flows for Cox Communications if it purchases Gannett by issuing debt (figures
are in millions of dollars). �¦³¤µ��µ¦�¦³ÂÁ���宦�́�ºÊ°Â��Á���rÃ�¥�µ¦ ° °��¦µµ¦®�̧Ê·
1999 E 2000 E 2001 E 2002 E 2003 E
OPERATING ACTIVITIES EBITDA Cox + Acquisitions 878 1,344 1,490 1,697 1,913
EBITDA Gannett 0 151 163 176 190
Interest Expense -312 -540 -657 -667 -640
TOTAL CASH FROM OPERATIONS 566 955 996 1,207 1,463
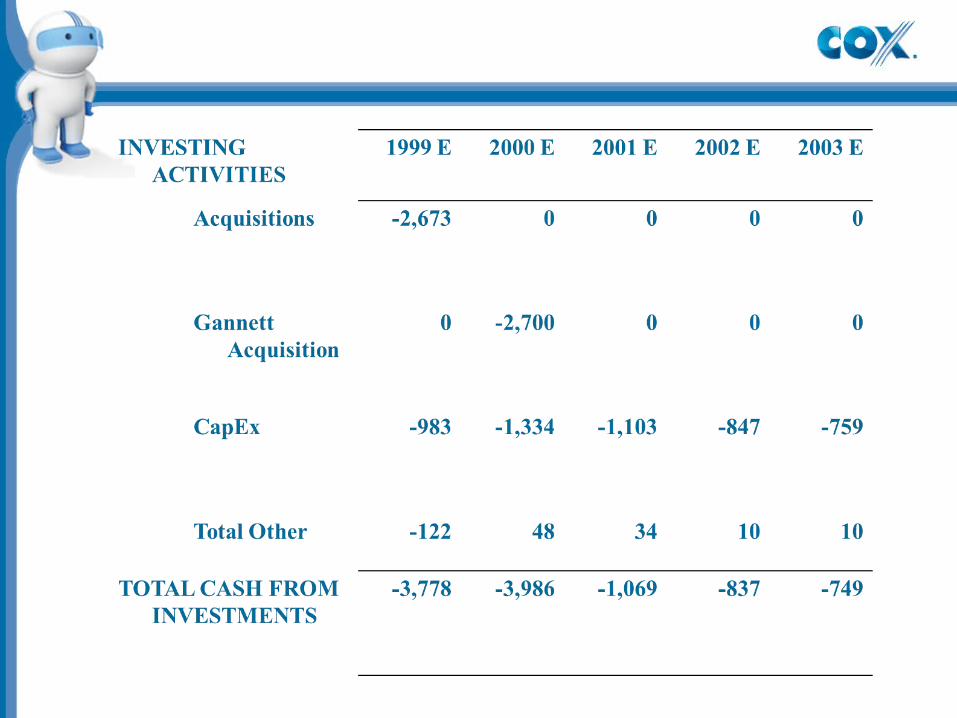
INVESTING ACTIVITIES Acquisitions -2,673 0 0 0 0
Gannett Acquisition 0 -2,700 0 0 0
CapEx -983 -1,334 -1,103 -847 -759
Total Other -122 48 34 10 10
TOTAL CASH FROM INVESTMENTS -3,778 -3,986 -1,069 -837 -749
FINANCING ACTIVITIES Equity Issued 0 0 0 0 0
Monetization 1,243 1,500 0 0 0
Beginning Debt 4,091 6,249 7,781 7,854 7,484
Maturing Debt -431 -341 -200 -277
New Debt Financed (Retired) 1,968 1,962 414 -169 -437
Ending Total Debt 6,249 7,781 7,854 7,484 6,770
TOTAL CASH FROM FINANCING 3,401 3,031 73 -369 -714
CONDENSED INCOME STATEMENT EBITDA 878 1,495 1,653 1,873 2,103
Depreciation -197 -267 -221 -169 -152
Interest -312 -540 -657 -667 -640
Taxes -85 30 10 10 10
Net Income 285 718 785 1,047 1,322
DEBT RATIOS Pro Forma Annualized EBITDA 1,201 1,495 1,653 1,873 2,103
Leverage Ratio 5.2 x 5.2 x 4.8 x 4.0 x 3.2 x
EQUITY INTEREST Cox Family Economic Equity 67.30% 67.30% 67.30% 67.30% 67.30%
Cox Family Voting Equity 76.80% 76.80% 76.80% 76.80% 76.80%
Source: Cox Communications, Inc.
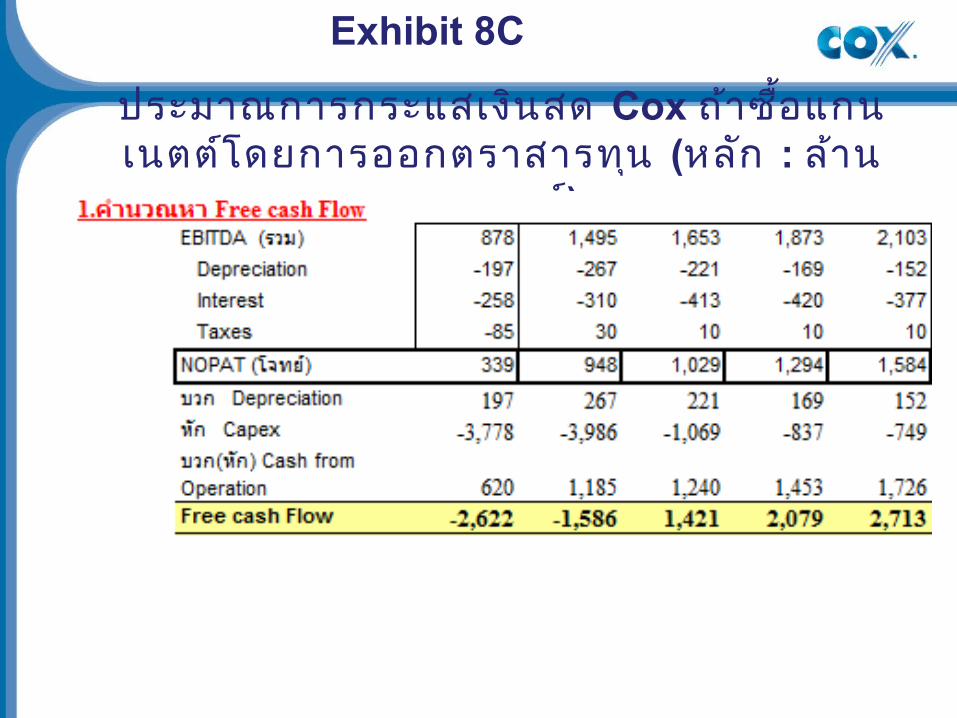
ประมำณกำรกระแสเง ินสด Cox ถ้ำซ ื้อแกนเนตตโ์ดยกำรออกตรำสำรทุน (หลกั : ลำ้น
ดอลลำร ์)
Exhibit 8C
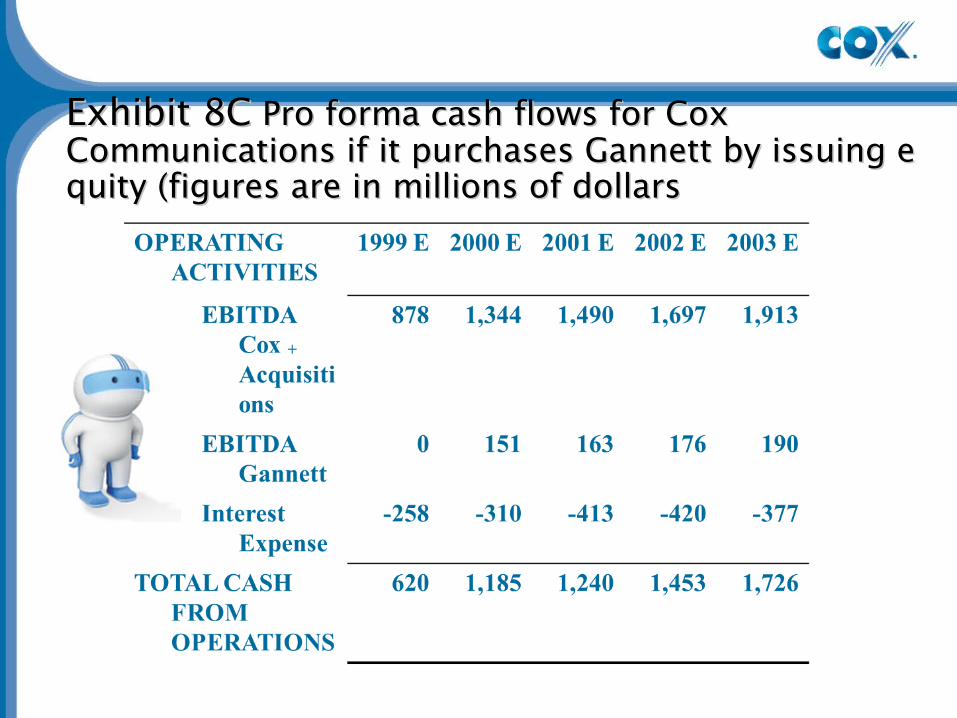
Exhibit 8CExhibit 8C Pro forma cash flows for Cox Pro forma cash flows for Cox Communications if it purchases Gannett by issuing eCommunications if it purchases Gannett by issuing equity (figures are in millions of dollarsquity (figures are in millions of dollars
Suggested Format for Case Analyses: Cox Communications, Inc., 1999:
1. Why is Cox Communications (CCI) acquiring Gannett? Given the proposed $2.7 billion purchase price, at what assumed terminal growth rate does the acquisition make sense?

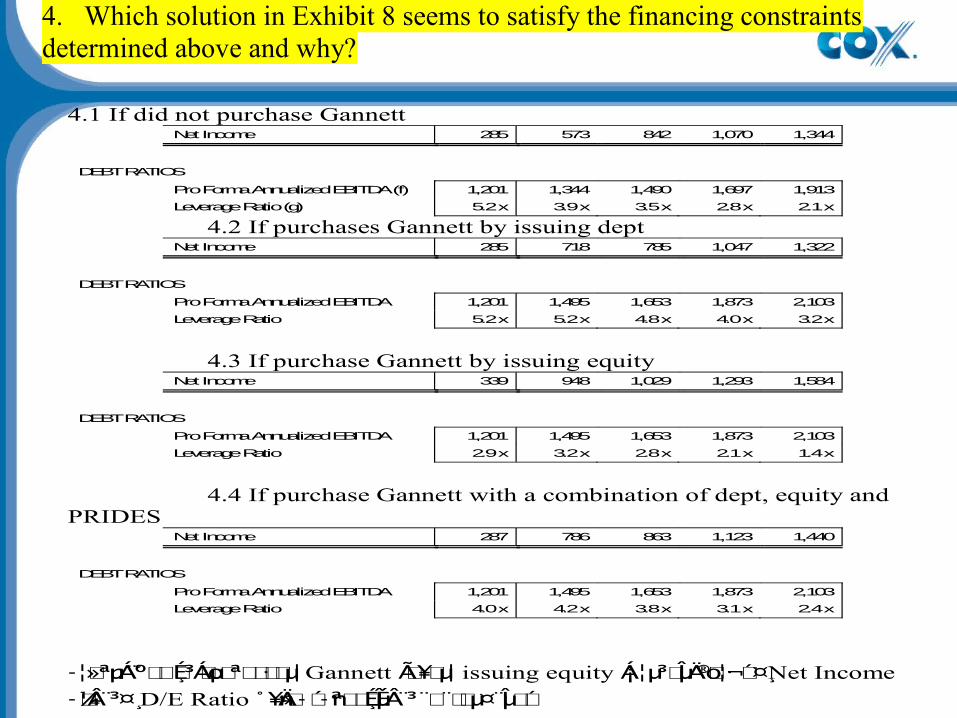
4. Which solution in Exhibit 8 seems to satisfy the financing constraints determined above and why?
4.1 If did not purchase Gannett Net Income 285 573 842 1,070 1,344
DEBT RATIOS Pro Forma Annualized EBITDA (f) 1,201 1,344 1,490 1,697 1,913
Leverage Ratio (g) 5.2 x 3.9 x 3.5 x 2.8 x 2.1 x
4.2 If purchases Gannett by issuing dept Net Income 285 718 785 1,047 1,322
DEBT RATIOS Pro Forma Annualized EBITDA 1,201 1,495 1,653 1,873 2,103
Leverage Ratio 5.2 x 5.2 x 4.8 x 4.0 x 3.2 x
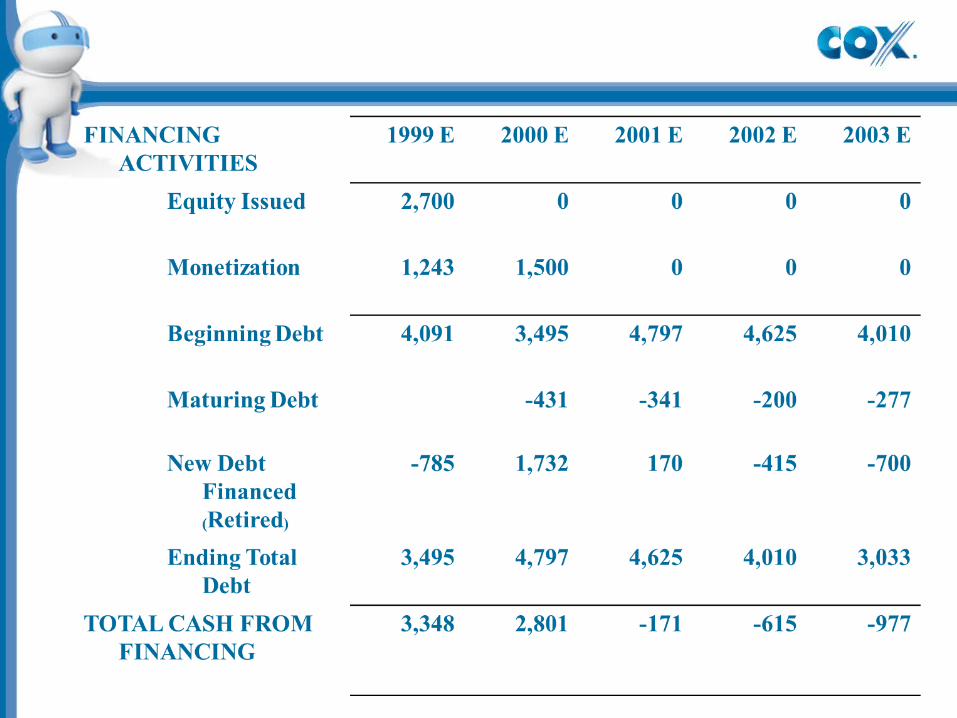
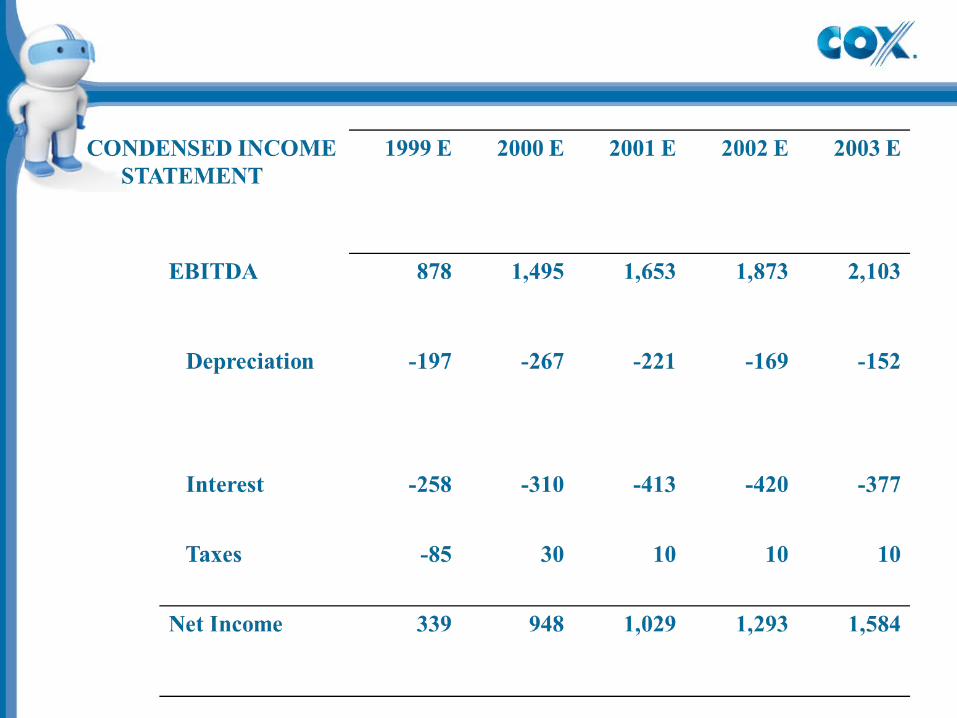
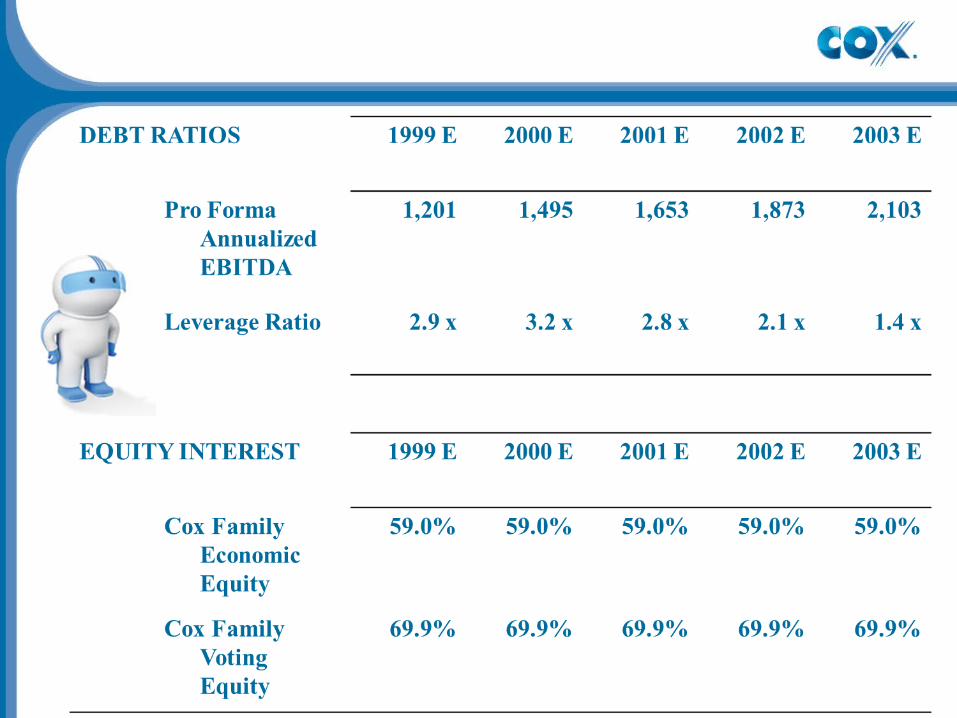
4.3 If purchase Gannett by issuing equity Net Income 339 948 1,029 1,293 1,584
DEBT RATIOS Pro Forma Annualized EBITDA 1,201 1,495 1,653 1,873 2,103
Leverage Ratio 2.9 x 3.2 x 2.8 x 2.1 x 1.4 x
4.4 If purchase Gannett with a combination of dept, equity and PRIDES Net Income 287 786 863 1,123 1,440
DEBT RATIOS Pro Forma Annualized EBITDA 1,201 1,495 1,653 1,873 2,103
Leverage Ratio 4.0 x 4.2 x 3.8 x 3.1 x 2.4 x
¦»�ªnµÁ̈º°��̧É�³Á�oµ�ª����µ¦· Gannett Ã�¥�µ¦ issuing equity Á¡ ¦µ³�εĮo�¦¬́�¤̧· Net Income
¼�Â̈³¤̧D/E Ratio °¥»nÄ��́nª��̧É�ÎɵÂ̈³ �̈̈��µ¤̈ ε�́�

Thank you


![Edinburgh Research Explorer · CLEC-2 surface expression on platelets was first demonstrated in humans [16] and soon after in mouse [17] and chicken [18]. The expression of CLEC-2](https://img.pdfslide.us/doc/110x75/5f2cf73de83043085e402122/edinburgh-research-explorer-clec-2-surface-expression-on-platelets-was-first-demonstrated.jpg)