Embed Size (px)
Citation preview

PEOPLE, PLACE, & OPPORTUNITY
Planning for the Commonwealth’s Economic ReboundJanuary 12, 2009Massachusetts State House
Jason Reece, AICPSenior Researcher
The Kirwan Institute for the Study of Race & Ethnicity
The Ohio State University
Funded by Massachusetts Legal Services Programs

Introduction
Today’s discussion Opportunity matters Mapping opportunity
Why and how… Opportunity mapping in MA
Results The intersection of opportunity
race and class Opportunity, housing and the
foreclosure crisis
Section 1

Opportunity Matters: Space, Place, and Life Outcomes
“Opportunity” is a situation or condition that places individuals in a position to be more likely to succeed or excel.
Opportunity structures are critical to opening pathways to success: High-quality education Healthy and safe environment Stable housing Sustainable employment Political empowerment Outlets for wealth-building Positive social networks
Section 2

44
Opportunity Matters: Opportunity Matters: Neighborhoods & Access to OpportunityNeighborhoods & Access to Opportunity
Five decades of research indicate Five decades of research indicate that your environment has a that your environment has a profound impact on your access to profound impact on your access to opportunity and likelihood of opportunity and likelihood of successsuccess
High poverty areas with poor High poverty areas with poor employment, underperforming employment, underperforming schools, distressed housing and schools, distressed housing and public health/safety risks depress public health/safety risks depress life outcomeslife outcomes A system of disadvantageA system of disadvantage Many manifestationsMany manifestations
Urban, rural, suburbanUrban, rural, suburban People of color are far more likely People of color are far more likely
to live in opportunity deprived to live in opportunity deprived neighborhoods and communitiesneighborhoods and communities

55
Which school will children succeed in?Which school will children succeed in?

66
Which community has better economic prospects?Which community has better economic prospects?

77
Which community is safer and supports Which community is safer and supports positive health outcomes?positive health outcomes?
What are the implications of opportunity isolation?
Individual Poor economic outcomes, lower educational outcomes, degraded
asset development Poor health conditions, higher exposure and risk from crime Psychological distress, weak social and professional networks
Community/Economy High social costs, distressed and stressed communities, fiscal
challenges Weakened civic engagement and democratic participation Underdeveloped human capital, poor labor outlook, poor
economic development prospects

Inequality has a geographic footprint
Maps can visually track the history and presence of discriminatory and exclusionary policies that spatially segregate people
Identifying places with gaps in opportunity can help direct future investment and identify structures which impede access to opportunity
Section 3
Mapping Opportunity: Why and How

Mapping Opportunity: Why and How
The Kirwan Institute has conducted “opportunity mapping” for states and metropolitan regions across the US
Why identify the “State of Opportunity” How are low-income groups situated in
the State? How are racial and ethnic groups
situated? What can be done to improve the
opportunity landscape?

Mapping Communities of Opportunity: Methods and Indicators
How do you map opportunity? Data representing community conditions was
gathered for neighborhood (census tracts) across the state Data for all indicators of community conditions was
aggregated to the Census Tract level and analyzed to create a comprehensive opportunity index for the census tracts (neighborhoods) throughout the state
The opportunity index is then mapped and census tracts are broken into quintiles based on their opportunity score Very Low, Low, Moderate, High, Very High
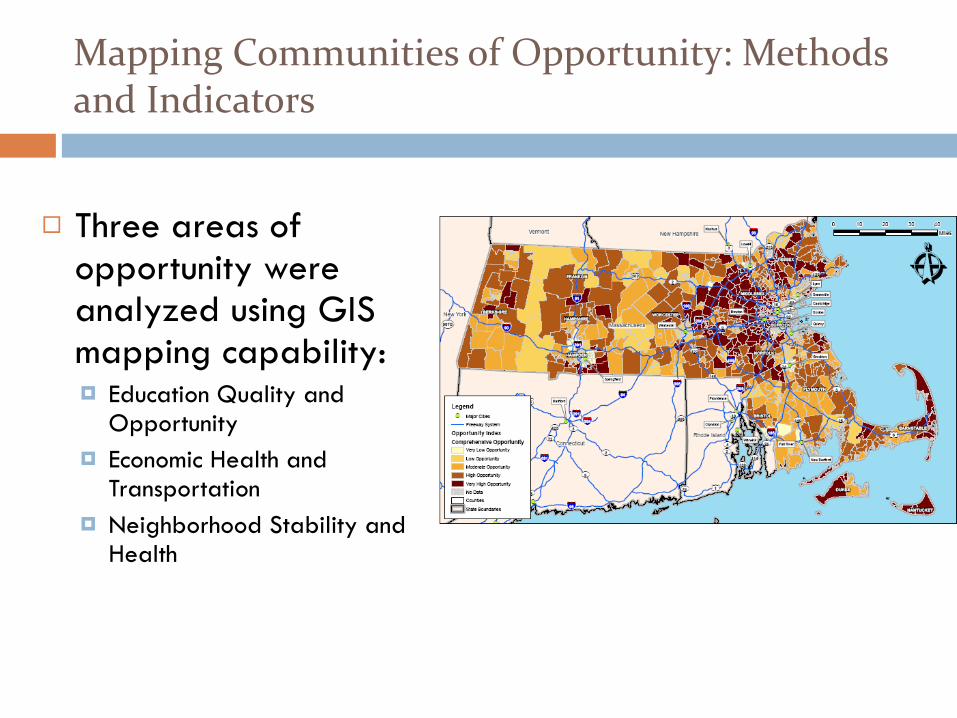
Mapping Communities of Opportunity: Methods and Indicators
Three areas of opportunity were analyzed using GIS mapping capability: Education Quality and
Opportunity Economic Health and
Transportation Neighborhood Stability and
Health

Opportunity Mapping
Education Quality and Opportunity Student Expenditures Student Poverty Rate Test Scores for Schools Graduation and Dropout Rates Teacher Qualifications
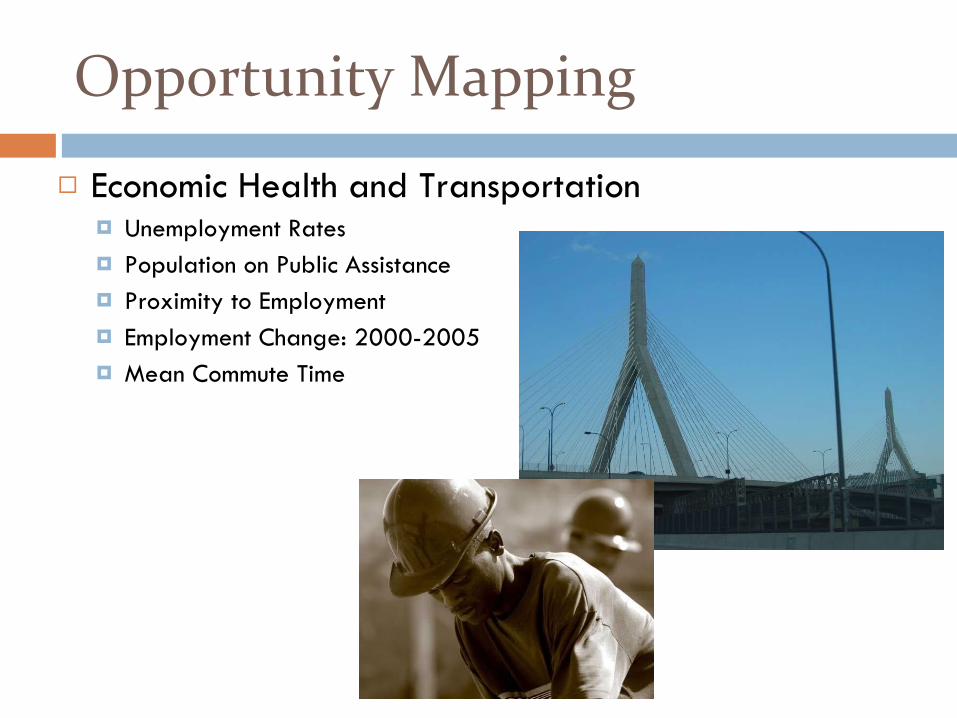
Opportunity Mapping
Economic Health and Transportation Unemployment Rates Population on Public Assistance Proximity to Employment Employment Change: 2000-2005 Mean Commute Time
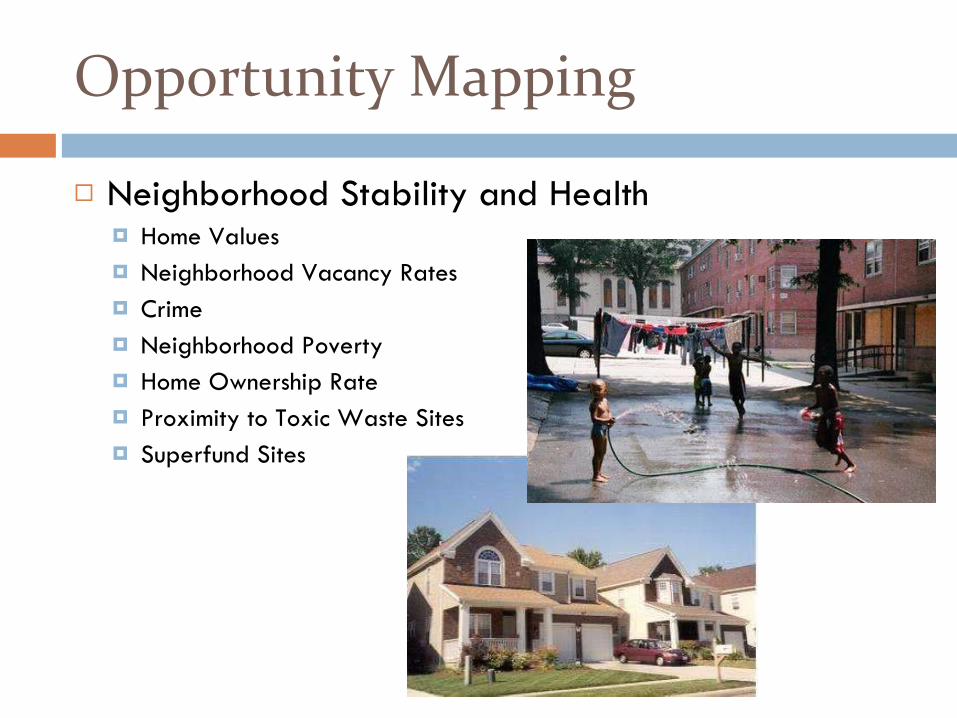
Opportunity Mapping
Neighborhood Stability and Health Home Values Neighborhood Vacancy Rates Crime Neighborhood Poverty Home Ownership Rate Proximity to Toxic Waste Sites Superfund Sites

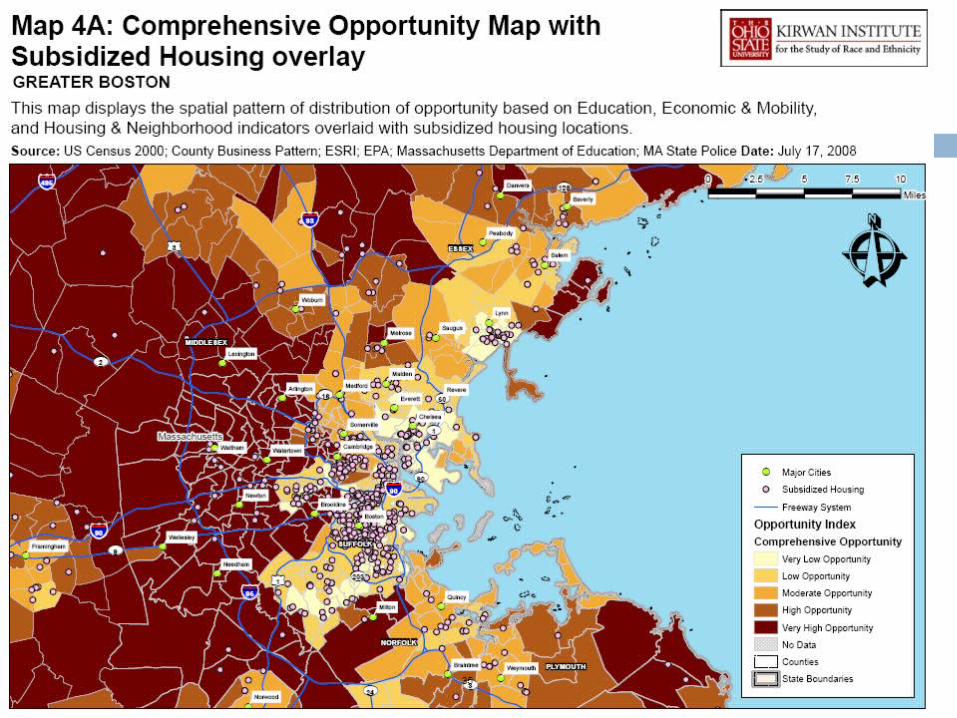
Comprehensive Opportunity Map

Comprehensive Opportunity Map: Greater Boston
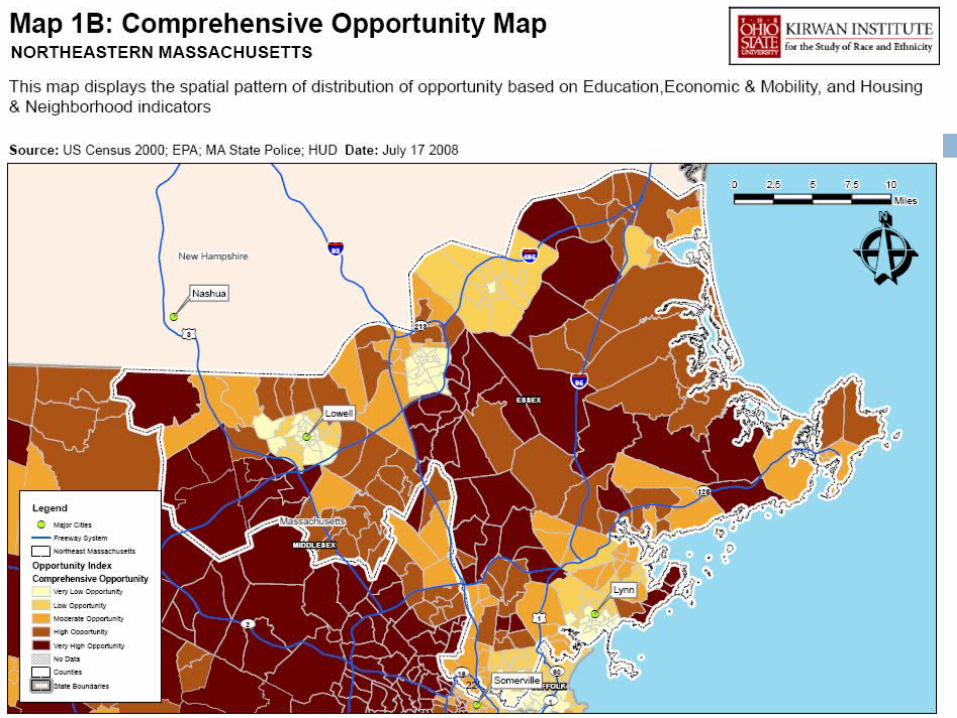
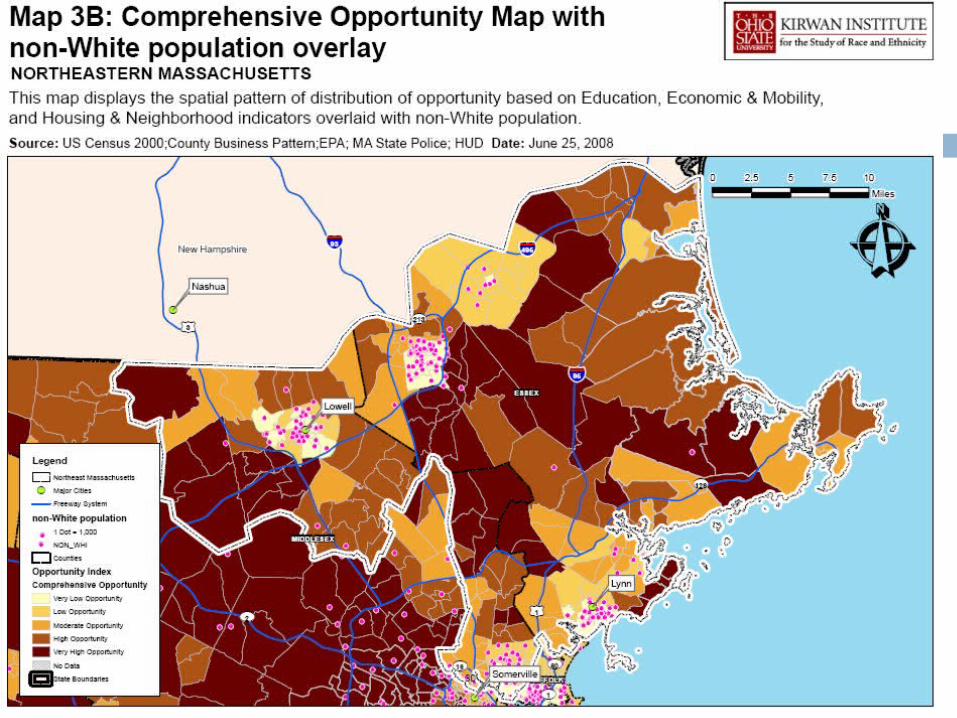
Comprehensive Opportunity Map: Northeastern Massachusetts


Access to Opportunity: Race, Ethnicity, and Class
Racialized isolation from neighborhoods of opportunity is stunning in Massachusetts
Immigrants from Africa and Latin America were found to be disproportionately concentrated in low-opportunity neighborhoods
Racial isolation into low-opportunity neighborhoods is more pronounced than class-based segregation into these communities

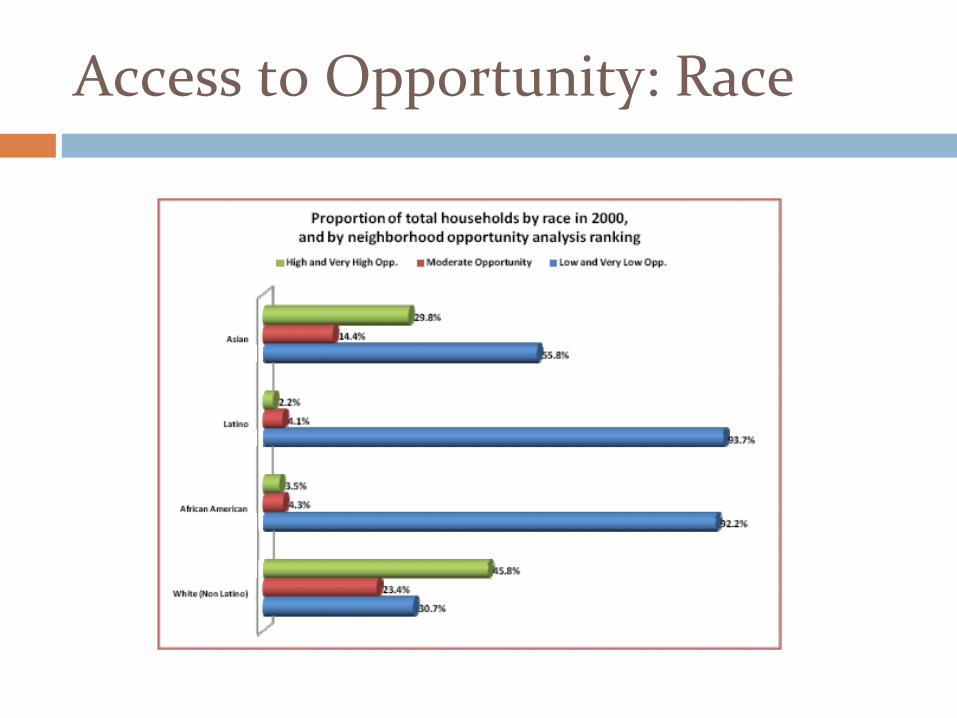
Access to Opportunity: Race
Racialized isolation from neighborhoods of opportunity in Massachusetts: More than 90% of African-American and Latino
households in were isolated in the lowest opportunity neighborhoods in the State
Over 55% of Asian households were found in low-opportunity neighborhoods
By contrast, only 31% of White, Non-Latino households were found in low-opportunity neighborhoods
Access to Opportunity: Race


Access to Opportunity: Immigrants
Non-native born Africans and Latinos are disproportionately concentrated in low-opportunity neighborhoods: 42% of European-born and 46% of Asian-born
residents live in low-opportunity neighborhoods By contrast, more 70% of non-native born African and
Latin American residents live in low-opportunity neighborhoods

Access to Opportunity: Class
Racial isolation into low-opportunity neighborhoods is more pronounced than class-based segregation into these communities 42% of low-income White households live in low-
opportunity communities, while 33% live in high-opportunity community areas
By contrast, more than 95% of low-income Latinos, 93% of low-income African-Americans, and 71% of low-income Asians live in low-opportunity communities
Approximately 90% of high-income African-Americans and Latinos live in low-opportunity communities

Subsidized Housing and Communities of Opportunity
Housing is a strategic intervention point into opportunity and advancement However, 100,000 (nearly 76%) subsidized housing
units in the State is in low-opportunity communities Only 17,000 units (roughly 12%) of subsidized housing
are in high-opportunity communities

Subsidized Housing and Communities of Opportunity
Comprehensive Opportunity Map: Southeastern Massachusetts

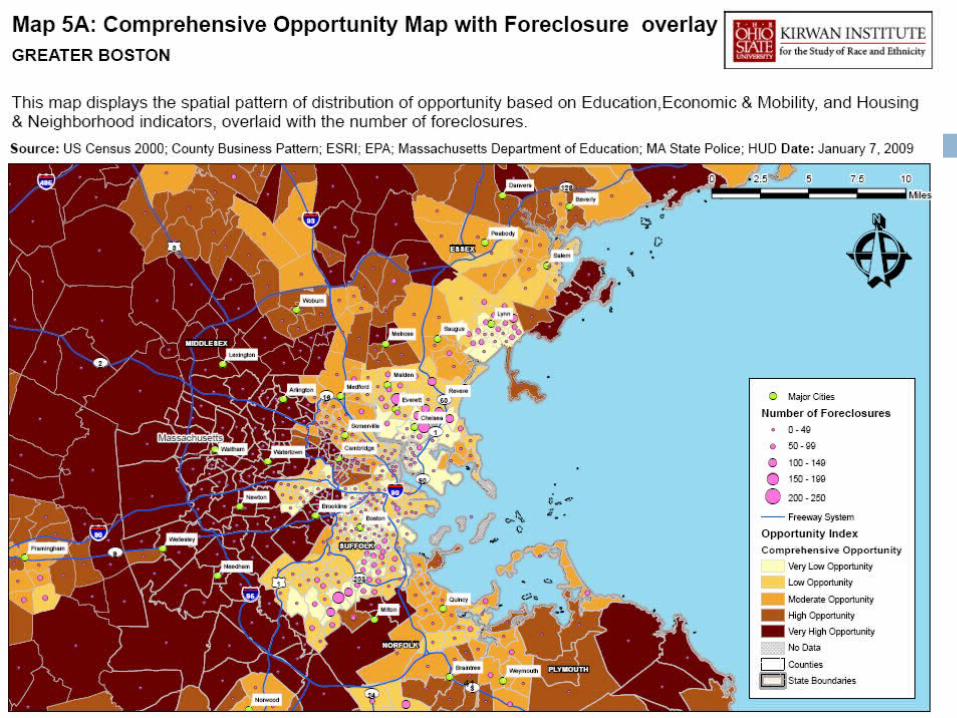
Residential Foreclosure and Opportunity
Over half of the State’s estimated amount of high-cost HMDA loans, residential foreclosures, and 90-day residential foreclosures were located in low-opportunity neighborhoods
This data shows the strong relationship between poor lending practices, foreclosure, and vacancy, all of which have been disproportionately concentrated in low-opportunity neighborhoods

Residential Foreclosure and Opportunity
Distribution of Residential Factors Across the Community Opportunity Spectrum


Reflecting on these findings….
What does our analysis find and suggest? People of color are disproportionately concentrated in
opportunity deprived communities Which places them within a system of disadvantage that
ultimately impacts life outcomes Creating both an individual and societal tragedy
Subsidized housing reinforces this opportunity isolation Foreclosures will widen the “opportunity divide” in the
State of Massachusetts What are the implications of this challenge and how
can we formulate a response?

4444
To access this report and other resources please visit us on-To access this report and other resources please visit us on-line at: line at: www.kirwaninstitute.orgwww.kirwaninstitute.org