Embed Size (px)
Citation preview

PGBM01
Financial Management & Control
Lecture 9 Long-term decision making
By
Andy Turton.
The University of Sunderland
School of Business & Law

Learning Objectives Characteristics of long-term decision making
Processes of decision making
Major techniques for decision making
Advantages and disadvantages of these methods
Other factors for decision making
2

Characteristics Commitment of a large amount of company resources
Links to strategic and tactical business decisions
Extremely expensive and difficult to reverse a long term investment decision
The risk and uncertainty of undertaking a long-term investment can be high
3
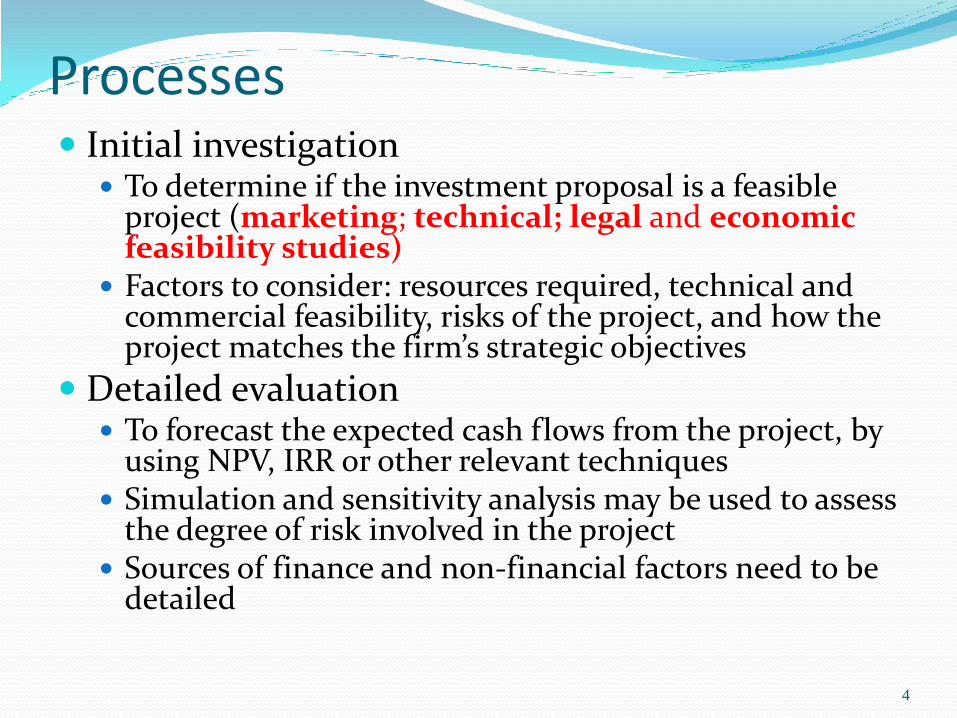
Processes Initial investigation To determine if the investment proposal is a feasible
project (marketing; technical; legal and economic feasibility studies)
Factors to consider: resources required, technical and commercial feasibility, risks of the project, and how the project matches the firm’s strategic objectives
Detailed evaluation To forecast the expected cash flows from the project, by
using NPV, IRR or other relevant techniques Simulation and sensitivity analysis may be used to assess
the degree of risk involved in the project Sources of finance and non-financial factors need to be
detailed
4

Processes
Authorisation
Ranking of proposals in order of priority
The proposal meets the profitability criteria and is compatible with the overall strategy of the business
The decision should be made by senior management, or the board of directors if necessary
Project implementation
The appointment of a project manager or assignment of responsibility
The required resources are allocated and the specified targets are set to be achieved
5

Processes
Monitoring the project
Feedforward principles employed to reassess the expected costs and benefits
The corrective action taken to rectify any adverse variance
Post-completion audit
To monitor and report on the progress and to identify aspects which could be improved for future project planning
6

Methods of Investment Appraisal Payback period (PP)
The length of time: cash proceeds recover the initial capital
expenditure
Accounting Rate of Return (ARR)
A return measurement by using average annual profits
Net Present Value (NPV)
The present value of the net cash inflows less the initial
investment
Internal Rate of Return (IRR)
A return measurement takes into account the time value of
money
7
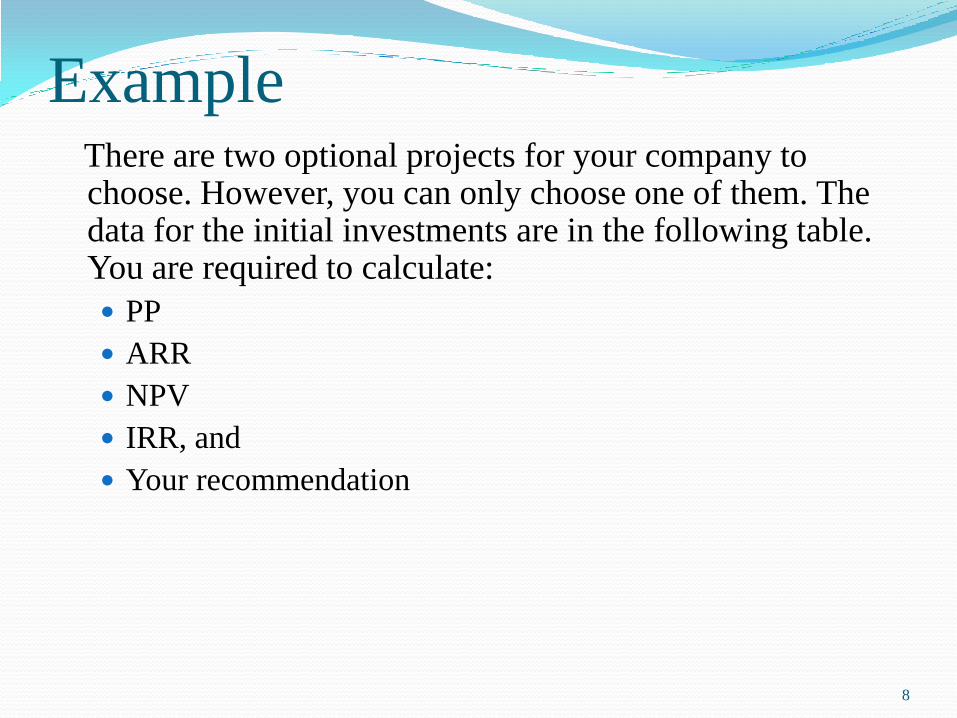
Example There are two optional projects for your company to
choose. However, you can only choose one of them. The data for the initial investments are in the following table. You are required to calculate:
PP
ARR
NPV
IRR, and
Your recommendation
8

Data for the Projects
Project A Project B
Initial investment £100,000 £100,000
Net cash inflows
Year 1 £45,000 £30,000
Year 2 £40,000 £30,000
Year 3 £25,000 £44,000
Year 4 £30,000 £46,000
9
• The depreciation is £20,000 per year.
• The residual value for both projects is the same, £20,000.

Payback Period The Payback period = the point in time at which
cash flows turn from negative to positive
Project A Cash flows Cumulative cash flow
Year 0 -100,000 -100,000
Year 1 45,000 -55,000
Year 2 40,000 -15,000
Year 3 25,000 +10,000
Year 4 50,000 +60,000
10

Payback Period
Project B Cash flows Cumulative cash flow
Year 0 -100,000 -100,000
Year 1 30,000 -70,000
Year 2 30,000 -40,000
Year 3 44,000 +4,000
Year 4 66,000 +70,000
11
Payback Period
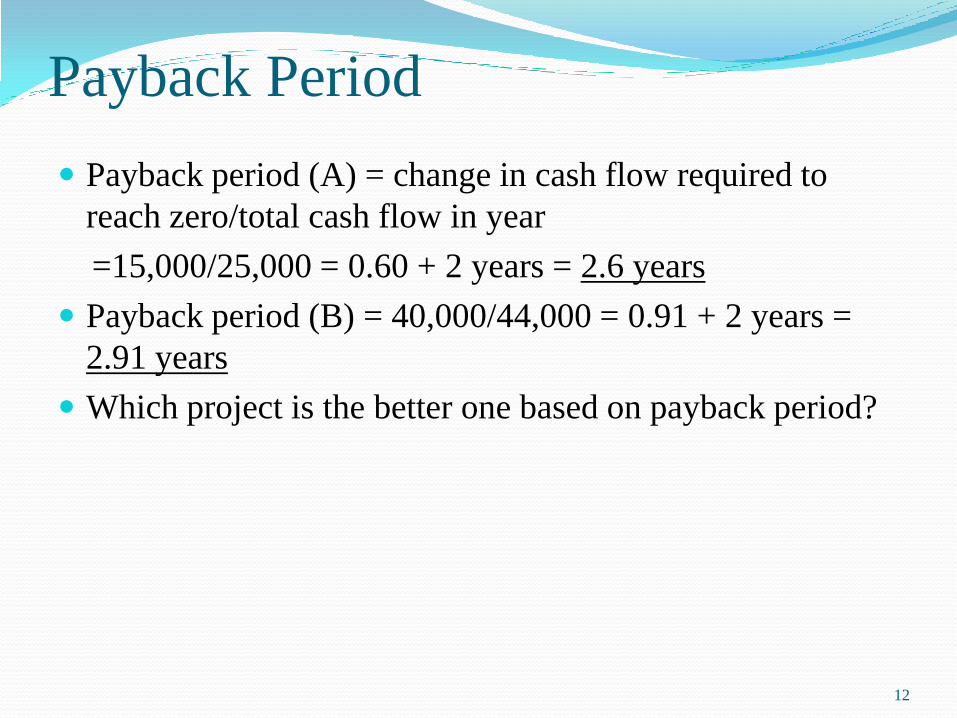
Payback period (A) = change in cash flow required to
reach zero/total cash flow in year
=15,000/25,000 = 0.60 + 2 years = 2.6 years
Payback period (B) = 40,000/44,000 = 0.91 + 2 years =
2.91 years
Which project is the better one based on payback period?
12

ARR Step 1: calculate annual profit
Annual profit = net cash inflow - depreciation
Step 2: calculate average profit
Average profit = total profits / number of years
Step 3: calculate average capital invested
Average capital invested = (initial cost + residual value) /2
Step 4: calculate ARR
ARR = (average profit/average capital invested)x 100%
13

ARR Project A
Average profit = (25,000 + 20,000 + 5,000 + 30,000)/4 =
80,000/4 = 20,000
Average capital invested = (100,000+20,000) /2 = 60,000
ARR = (20,000/60,000)x 100 = 33%
Project B
Average profit = (10,000 + 10,000 + 24,000 + 46,000)/4 =
22,500
Average capital invested = (100,000 + 20,000)/2 = 60,000
ARR = (22,500/60,000) x 100 = 38%
Which project is the better one?
14

The Time Value of Money What is the difference between £1 now and £1 in a year’s
time?
Factors change the value of money
Interest lost (an opportunity cost)
Inflation (loss of purchasing power)
Other risks to materialise the money (the level of demand
for a given project)
15

The Time Value of Money For example: the annual interest rate is 10%, I lend you £1
now and will get it back after 1 year, how much worth of
that £1 in a year’s time?
? x (1+10%) = £1
? = £0.91
The formula is 1
(1 + r)n
10% is called “cost of capital”; “0.91” is called the
“discount factor”
16

NPV
Assume that your company’s cost of capital is 10%
Discount factors at 10% are:
Year 1 0.909
Year 2 0.826
Year 3 0.751
Year 4 0.683
Present value table distributed (page 559 in core textbook)
17

NPV
Project A Cash flow Disc. Factor (10%) Dis.d cash flow
Year 0 -100,000 1.00 (100,000)
Year 1 45,000 0.909 40,905
Year 2 40,000 0.826 33,040
Year 3 25,000 0.751 18,775
Year 4 50,000 0.683 34,150
NPV £26,870
18

NPV Project B Cash flow Dis. Factor (10%) Dis.d cash flow
Year 0 -100,000 1.00 (100,000)
Year 1 30,000 0.909 27,270
Year 2 30,000 0.826 24,780
Year 3 44,000 0.751 33,044
Year 4 66,000 0.683 45,078
NPV £30,172
19
• Which project is the better one based on NPV?
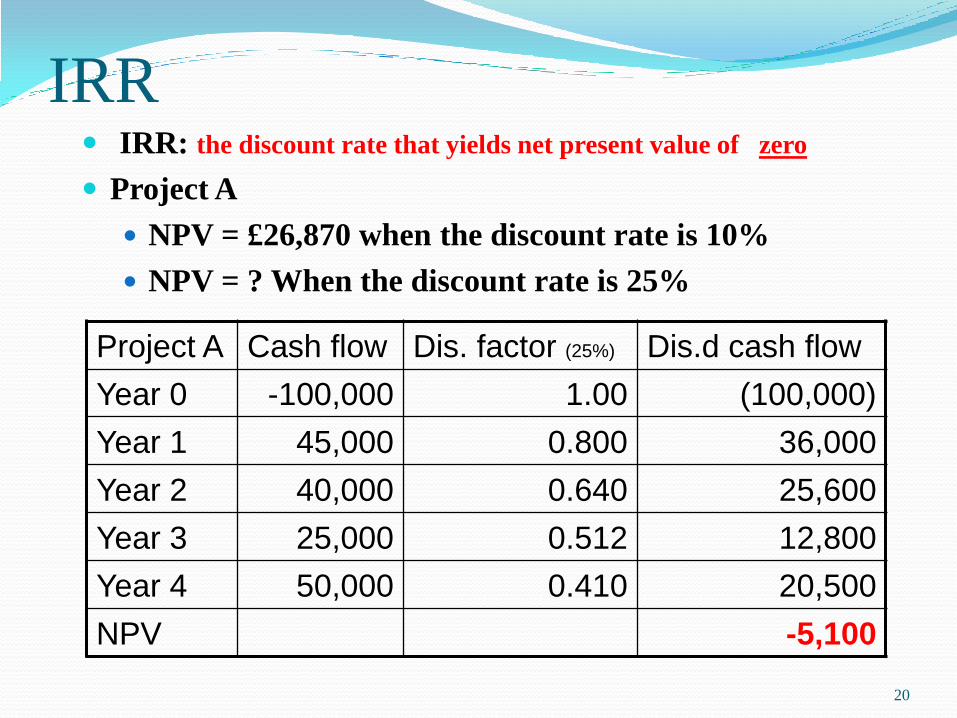
IRR IRR: the discount rate that yields net present value of zero
Project A
NPV = £26,870 when the discount rate is 10%
NPV = ? When the discount rate is 25%
Project A Cash flow Dis. factor (25%) Dis.d cash flow
Year 0 -100,000 1.00 (100,000)
Year 1 45,000 0.800 36,000
Year 2 40,000 0.640 25,600
Year 3 25,000 0.512 12,800
Year 4 50,000 0.410 20,500
NPV -5,100
20

IRR Project B
NPV = £30,172 when the discount rate is 10%
NPV = ? When the discount rate is 25%
Project B Cash flow Disc. factor (25%) Dis.d cash flow
Year 0 -100,000 1.00 (100,000)
Year 1 30,000 0.800 24,000
Year 2 30,000 0.640 19,200
Year 3 44,000 0.512 22,258
Year 4 66,000 0.410 27,060
NPV -7,482
21
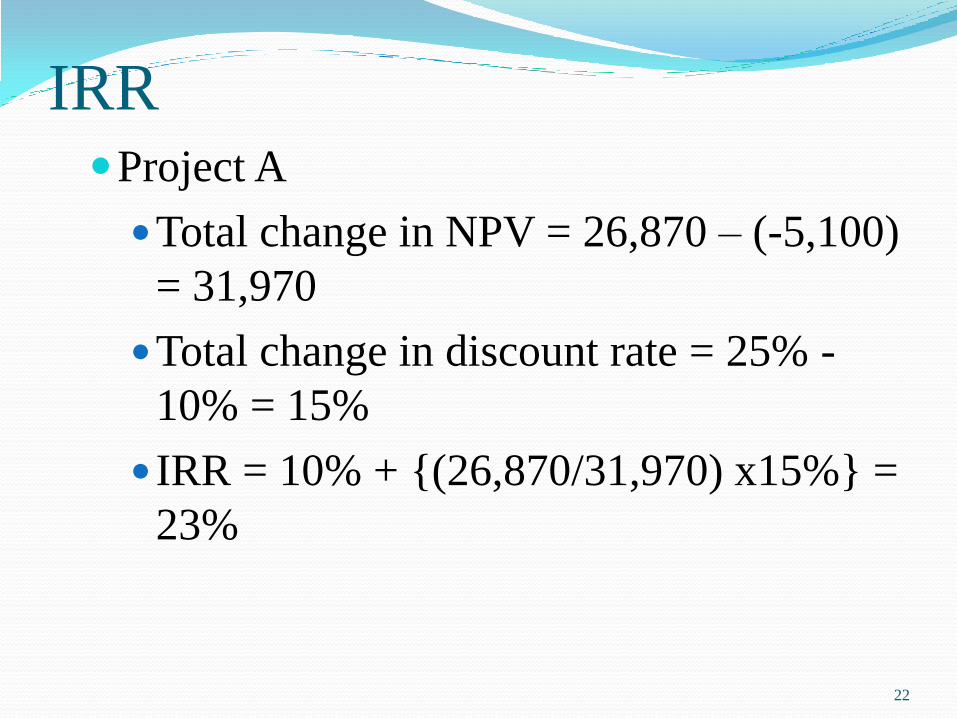
IRR Project A
Total change in NPV = 26,870 – (-5,100)
= 31,970
Total change in discount rate = 25% -
10% = 15%
IRR = 10% + {(26,870/31,970) x15%} =
23%
22

IRR Project B
Total change in NPV = 30,172 – (-7,482)
= 37,654
Total change in discount rate = 25% -
10% = 15%
IRR = 10% + {(30,172/37,654) x15%} =
22%
23

Project Selection
Methods Single project Choice of projects A or B?
Payback Less than the target
period
Shortest payback
period
A
ARR Above the target
rate
With the highest
ARR
B
NPV A positive NPV With the highest
NPV
B
IRR Higher than the
target rate (cost of
capital)
With the highest IRR A
24

Advantages & Disadvantages
Method Advantages Disadvantages
Payback • Simple and easy to understand and
use
• Objective – using cash flows
• Liquidity – commercially realistic
• Cautious & risk averse – ignores
later cash flows
• Ignores the time value
of money
• Ignores cash flows
after the payback
period
ARR • Simple and easy to understand and
use
• Aids internal and external
comparisons
• Looks at the whole life of the project
•A useful tool to measure divisional
managerial performance
• Subjective – profit,
not cash flows
• Ignores the time value
of money
• Difficulty in use when
with same ARR and
various project sizes
25

Advantages & Disadvantages
Method Advantages Disadvantages
NPV • Takes account of the time value
of money
• Concerns of shareholder wealth
• Takes account of risk
• Looks at the whole life of the
project
• Difficult to be understood
by managers
• Adverse effects on
accounting profits in the
short run
• How to choose discount
rate?
IRR • Takes account of the time value
of money
• Easy to be understood by
managers
• Difficult to use in choosing
projects of varying sizes
• Difficult to choose when
have the same IRR
26

Conclusion Why NPV is more commonly used than ARR and PP?
What are disadvantages of NPV and IRR?
How to overcome disadvantages of NPV and IRR?
What are other factors needed to consider for a long-term investment?
27


![MBA & MBA+MSDT HANDBOOKquestromworld.bu.edu/.../FT-MBA-_-MBAMSDT-Handbook... · [ 3 ] FT MBA & MBA+MSDT INTRODUCTION The MBA and MBA+MSDT Full-Time Handbook is a reference document](https://img.pdfslide.us/doc/110x75/60bda8e811233a4a927a3ca9/mba-mbamsdt-h-3-ft-mba-mbamsdt-introduction-the-mba-and-mbamsdt.jpg)