Embed Size (px)
Citation preview

Pension system
in the Republic of Cataliua Tatyana Bogomolova
World Bank, HDNSP
April, 2013

System Design
Contribution rate: 20% from employers
Retirement age: 60 for men and 55 for women (no early retirement)
Benefit formula: generous accrual rate of 2.2% per year based on final salary
Indexation: post-retirement benefits are indexed to wage growth
No restrictions on minimum and maximum pension (for simplicity)
2

Current status
Mature system
Coverage rate: ~40% of population age 18 to retirement
System Dependency Rate: 22% (all pensioners/contributors)
Average replacement rates for existing old-age pensioners: ~ 80%
Total expenditure is 3.2% of GDP, total revenue is 34.5% of GDP and the system is in surplus
3

4
Projections:
No-Reform (Baseline) Scenario

Demographic Assumptions
Year 0 Year 5 Year 10 Year 20 Year 30 Year 60 Year 70
Male:
At Birth 63.4 65.5 66.7 68.5 69.7 70.9 75.2
At Age 65 12.4 12.7 12.9 13.4 13.7 14.2 16.0
At Retirement: 60 15.6 16.0 16.2 16.7 17.2 17.7 19.8
Female:
At Birth 69.4 71.7 73.1 75.0 76.2 77.5 81.8
At Age 60 18.2 18.9 19.5 20.3 21.0 21.7 24.3
At Age 65 14.5 15.1 15.6 16.4 17.0 17.6 20.0
At Retirement: 55 22.2 23.0 23.6 24.6 25.3 26.0 28.8
Fertility 3.1 2.8 2.4 2.3 2.3 2.2 2.1
5

Population Pyramids
Female
109 59 9 41 91
1
7
13
19
25
31
37
43
49
55
61
67
73
79
85
91
97
Year 0
109 59 9 41 91
1
7
13
19
25
31
37
43
49
55
61
67
73
79
85
91
97
Year 70
6

Macroeconomic Assumptions
Year 1 Year 10 Year 20 Year 30 Year 40 Year 70
Real GDP growth 5.0% 4.5% 4.0% 3.5% 2.2% 2.2%
Inflation 3.0% 3.0% 3.0% 3.0% 3.0% 3.0%
Real wage growth 2.2% 2.1% 2.4% 2.4% 2.0% 2.0%
7

0
2,000
4,000
6,000
8,000
10,000
12,000
14,000
16,000
0 5 10 15 20 25 30 35 40 45 50 55 60 65 70
Baseline: Population (thousand persons)
total population age 0-14 age 15-ret.age ret.age+8

0
500
1,000
1,500
2,000
2,500
3,000
3,500
0 5 10 15 20 25 30 35 40 45 50 55 60 65 70
Baseline: Number of System Members (thousand persons)
contributors all pensioners9
0%
10%
20%
30%
40%
50%
60%
70%
80%
90%
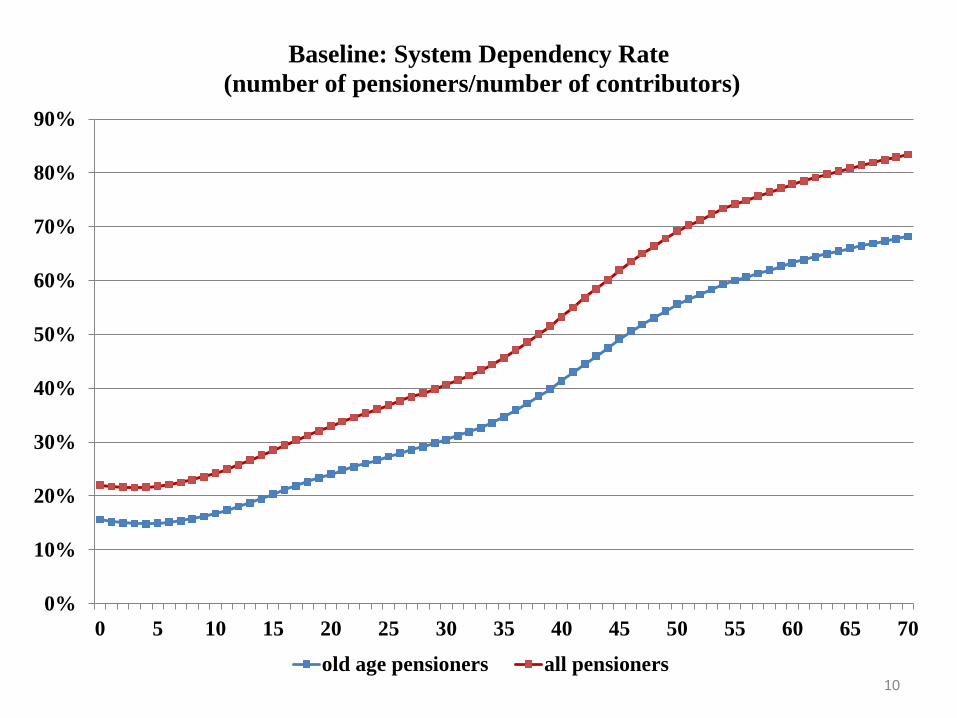
0 5 10 15 20 25 30 35 40 45 50 55 60 65 70
Baseline: System Dependency Rate
(number of pensioners/number of contributors)
old age pensioners all pensioners10

0%
10%
20%
30%
40%
50%
60%
70%
80%
90%
100%
0 5 10 15 20 25 30 35 40 45 50 55 60 65 70
Baseline: Average Replacement Rates for Old Age Pensioners
(% of average wage)
new pensioners all existing11

-15.0%
-10.0%
-5.0%
0.0%
5.0%
10.0%
15.0%
20.0%
0 5 10 15 20 25 30 35 40 45 50 55 60 65 70
Baseline: System Finances, % of GDP
revenues expenditures balance12

Key Issues
Growing total dependency rate due to population aging: from current 22% to 83% in the long-run
Generous benefit formula (high accrual rate, final salary feature)
Expensive indexation policy
System is financially unsustainable: deficits reach 10% of GDP in the long-run
So, risk of defaulting on the promise in the future is high
Estimated IPD: ~ 140% of GDP (at 4% real discount rate)
Large uncovered population (farmers)
13

Sensitivity Tests
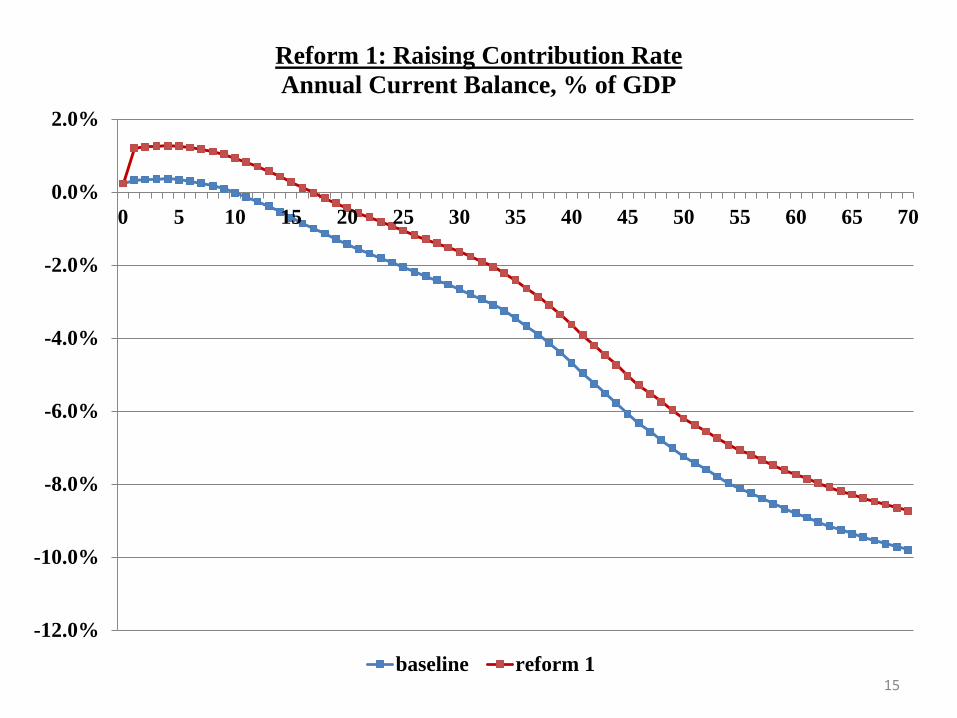
Reform 1: increasing contribution rate from 20% to 25%
Reform 2: decreasing accrual rate from 2.2% to 1.5%, applied to post-reform years
Reform 3: gradual increase in averaging period from last year to lifetime average earnings valorized to wage growth
Reform 4: switching from wage to price indexation of pensions
Reform 5: increasing retirement age from 60/55 for men/women to 65 for both genders over the next 20 years and then in line with life expectancy (to 69 by 2080)
14
15
-12.0%
-10.0%
-8.0%
-6.0%
-4.0%
-2.0%
0.0%
2.0%
0 5 10 15 20 25 30 35 40 45 50 55 60 65 70
Reform 1: Raising Contribution Rate
Annual Current Balance, % of GDP
baseline reform 1

16
0%
10%
20%
30%
40%
50%
60%
70%
80%
90%
100%
0 5 10 15 20 25 30 35 40 45 50 55 60 65 70
Reform 2: Decreasing Accrual Rate
Average Replacement Rates for New Old Age Pensioners
(% of average wage)
baseline reform 2

17
0%
10%
20%
30%
40%
50%
60%
70%
80%
90%
0 5 10 15 20 25 30 35 40 45 50 55 60 65 70
Reform 2: Decreasing Accrual Rate
Average Replacement Rates for All Old Age Pensioners
(% of average wage)
baseline reform 2

18
-12.0%
-10.0%
-8.0%
-6.0%
-4.0%
-2.0%
0.0%
2.0%
0 5 10 15 20 25 30 35 40 45 50 55 60 65 70
Reform 2: Decreasing Accrual Rate
Annual Current Balance, % of GDP
baseline reform 2

19
0%
10%
20%
30%
40%
50%
60%
70%
80%
90%
100%
0 5 10 15 20 25 30 35 40 45 50 55 60 65 70
Reform 3: Increasing Averaging Period
Average Replacement Rates for New Old Age Pensioners
(% of average wage)
baseline reform 3

20
0%
10%
20%
30%
40%
50%
60%
70%
80%
90%
0 5 10 15 20 25 30 35 40 45 50 55 60 65 70
Reform 3: Increasing Averaging Period
Average Replacement Rates for All Old Age Pensioners
(% of average wage)
baseline reform 3

21
-12.0%
-10.0%
-8.0%
-6.0%
-4.0%
-2.0%
0.0%
2.0%
0 5 10 15 20 25 30 35 40 45 50 55 60 65 70
Reform 3: Increasing Averaging Period
Annual Current Balance, % of GDP
baseline reform 3

22
0%
10%
20%
30%
40%
50%
60%
70%
80%
90%
0 5 10 15 20 25 30 35 40 45 50 55 60 65 70
Reform 4: Switching from Wage to Price Indexation
Average Replacement Rates for All Old Age Pensioners
(% of average wage)
baseline reform 4

23
-12.0%
-10.0%
-8.0%
-6.0%
-4.0%
-2.0%
0.0%
2.0%
0 5 10 15 20 25 30 35 40 45 50 55 60 65 70
Reform 4: Switching from Wage to Price Indexation
Annual Current Balance, % of GDP
baseline reform 4

24
0%
10%
20%
30%
40%
50%
60%
70%
80%
90%
0 5 10 15 20 25 30 35 40 45 50 55 60 65 70
Reform 5: Raising Retirement Age
System Dependency Rate
(number of all pensioners/number of contributors)
baseline reform 5

25
0%
20%
40%
60%
80%
100%
120%
0 5 10 15 20 25 30 35 40 45 50 55 60 65 70
Reform 5: Raising Retirement Age
Average Replacement Rates for New Old Age Pensioners
(% of average wage)
baseline reform 5

26
0%
20%
40%
60%
80%
100%
120%
0 5 10 15 20 25 30 35 40 45 50 55 60 65 70
Reform 5: Raising Retirement Age
Average Replacement Rates for All Old Age Pensioners
(% of average wage)
baseline reform 5

27
-12.0%
-10.0%
-8.0%
-6.0%
-4.0%
-2.0%
0.0%
2.0%
0 5 10 15 20 25 30 35 40 45 50 55 60 65 70
Reform 5: Raising Retirement Age
Annual Current Balance, % of GDP
baseline reform 5