Embed Size (px)
Citation preview
Primavera P6 Analytics Product Overview & RoadmapProduct Overview & RoadmapShawn LaffertyO l P i D l tOracle Primavera [email protected]
The following information is intended to outline our general product direction.
It is intended for information purposes only and may notIt is intended for information purposes only, and may not be incorporated into any contract. It is not a commitment to deliver any material, code, or functionality, and shouldto deliver any material, code, or functionality, and should not be relied upon in making purchasing decisions.
The development, release, and timing of any features or functionality described for Oracle’s products remains at the sole discretion of Oracle
Copyright © 2013, Oracle and/or its affiliates. All rights reserved.2
the sole discretion of Oracle.
Contents
Primavera P6 Analyticsy
Think Beyond Dashboards
Today: P6 Analytics Today: P6 Analytics
Tomorrow: Primavera Analytics
Copyright © 2013, Oracle and/or its affiliates. All rights reserved.3
Overview P i P6 A l tiPrimavera P6 Analytics
Copyright © 2013, Oracle and/or its affiliates. All rights reserved.4
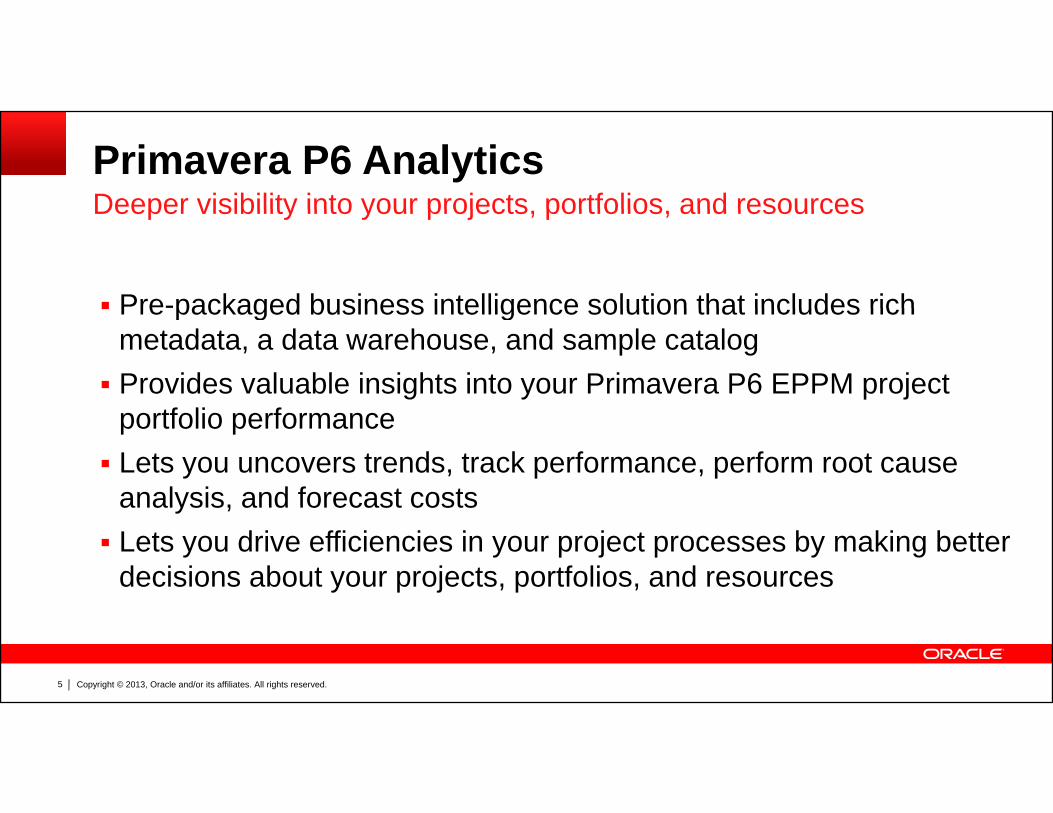
Primavera P6 AnalyticsDeeper visibility into your projects portfolios and resources
Pre-packaged business intelligence solution that includes rich
Deeper visibility into your projects, portfolios, and resources
Pre-packaged business intelligence solution that includes rich metadata, a data warehouse, and sample catalog Provides valuable insights into your Primavera P6 EPPM project
portfolio performance Lets you uncovers trends, track performance, perform root cause
analysis, and forecast costsanalysis, and forecast costs Lets you drive efficiencies in your project processes by making better
decisions about your projects, portfolios, and resources
Copyright © 2013, Oracle and/or its affiliates. All rights reserved.5
Copyright © 2013, Oracle and/or its affiliates. All rights reserved.6
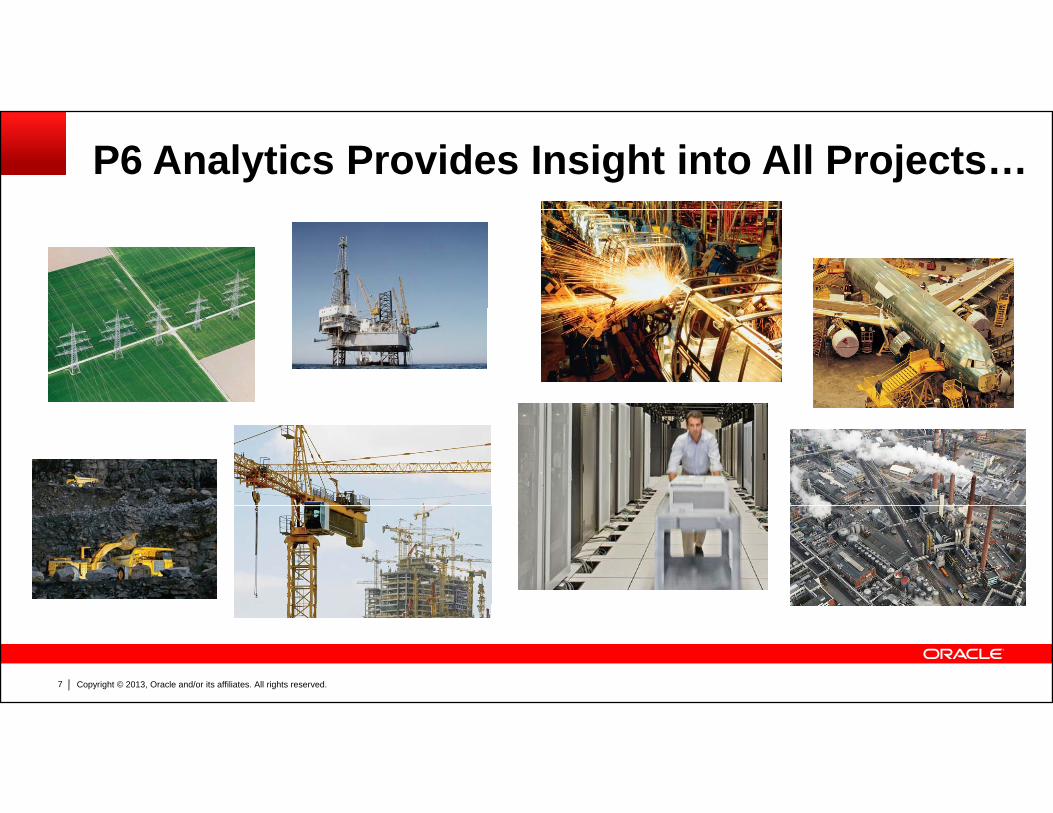
P6 Analytics Provides Insight into All Projects…
Copyright © 2013, Oracle and/or its affiliates. All rights reserved.7
Copyright © 2013, Oracle and/or its affiliates. All rights reserved.8
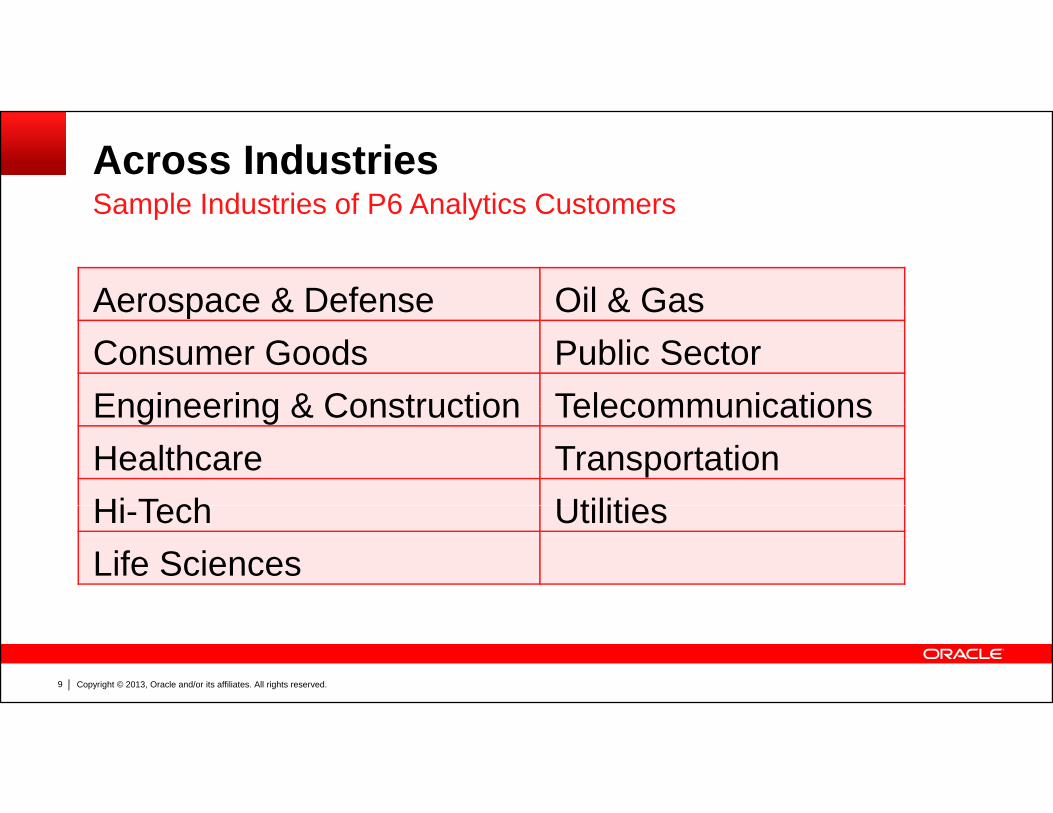
Across IndustriesSample Industries of P6 Analytics CustomersSample Industries of P6 Analytics Customers
Aerospace & Defense Oil & GasAerospace & Defense Oil & GasConsumer Goods Public SectorEngineering & Construction TelecommunicationsEngineering & Construction TelecommunicationsHealthcare TransportationHi Tech UtilitiesHi-Tech UtilitiesLife Sciences
Copyright © 2013, Oracle and/or its affiliates. All rights reserved.9
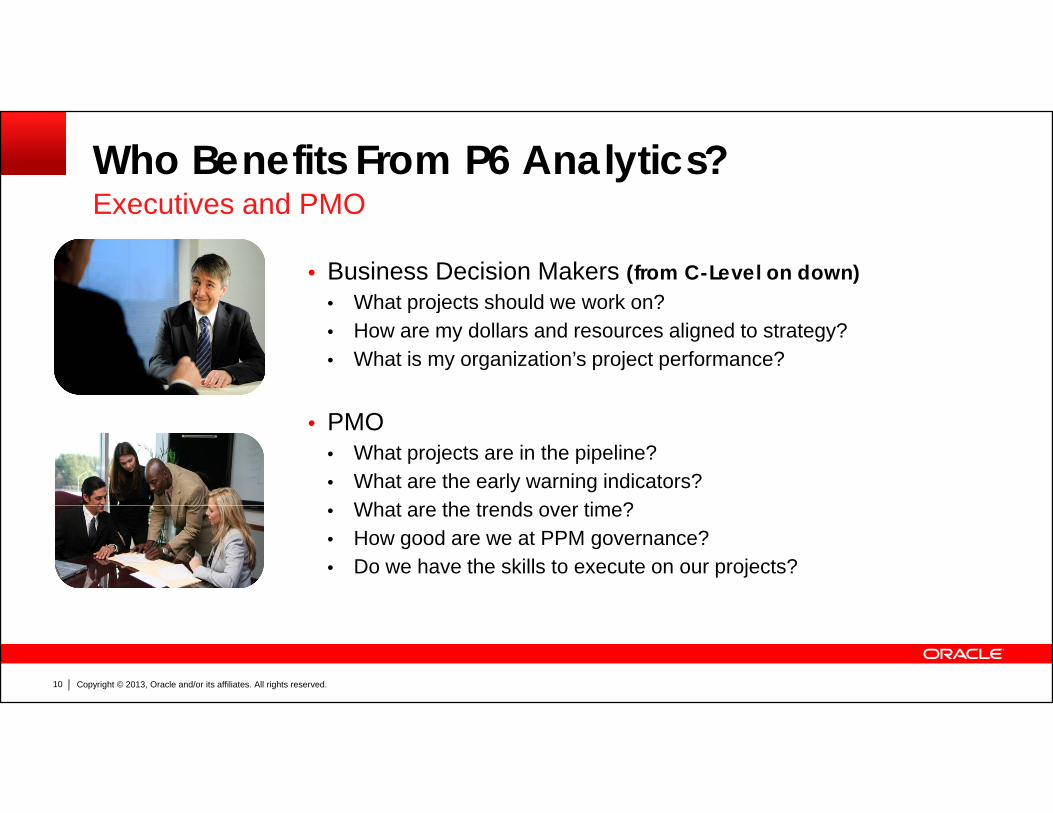
Who Benefits From P6 Analytics?Executives and PMO
• Business Decision Makers (from C-Level on down)• What projects should we work on?
Executives and PMO
What projects should we work on?• How are my dollars and resources aligned to strategy?• What is my organization’s project performance?
• PMO• What projects are in the pipeline?• What are the early warning indicators?
Wh t th t d ti ?• What are the trends over time?• How good are we at PPM governance?• Do we have the skills to execute on our projects?
Copyright © 2013, Oracle and/or its affiliates. All rights reserved.10
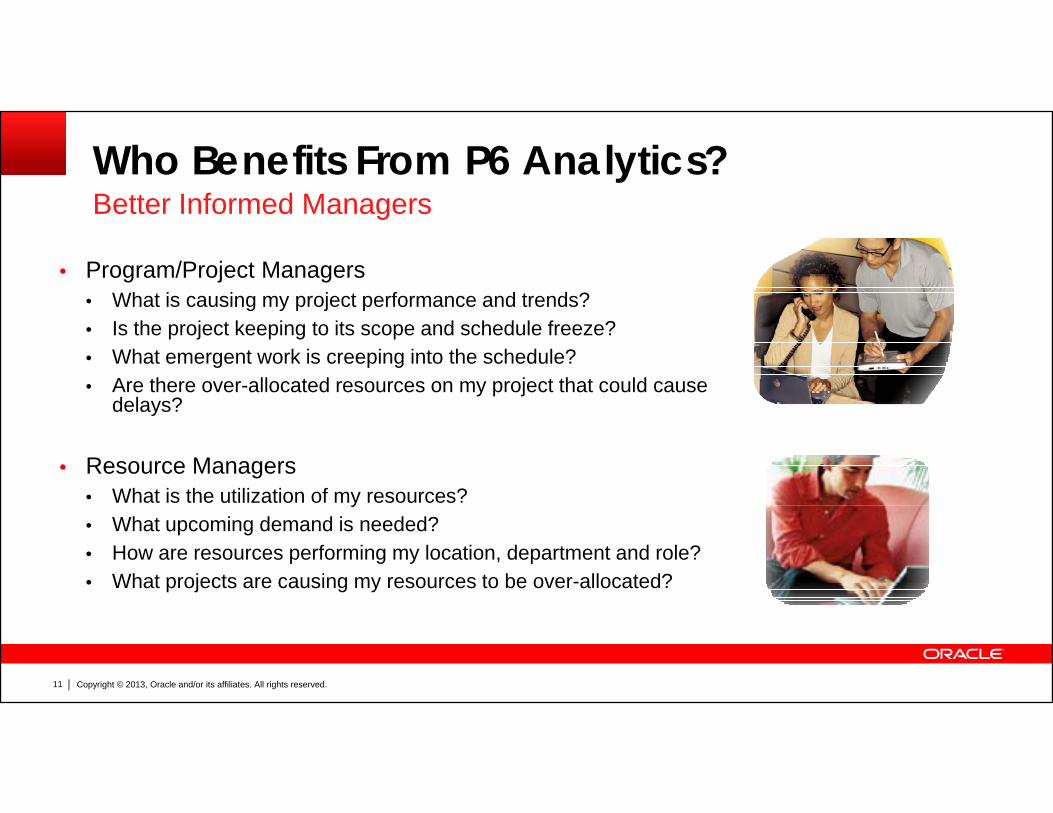
Who Benefits From P6 Analytics?Better Informed Managers
• Program/Project Managers• What is causing my project performance and trends?
Better Informed Managers
g y p j p• Is the project keeping to its scope and schedule freeze?• What emergent work is creeping into the schedule?• Are there over-allocated resources on my project that could cause
delays?delays?
• Resource Managers• What is the utilization of my resources?y• What upcoming demand is needed?• How are resources performing my location, department and role?• What projects are causing my resources to be over-allocated?
Copyright © 2013, Oracle and/or its affiliates. All rights reserved.11
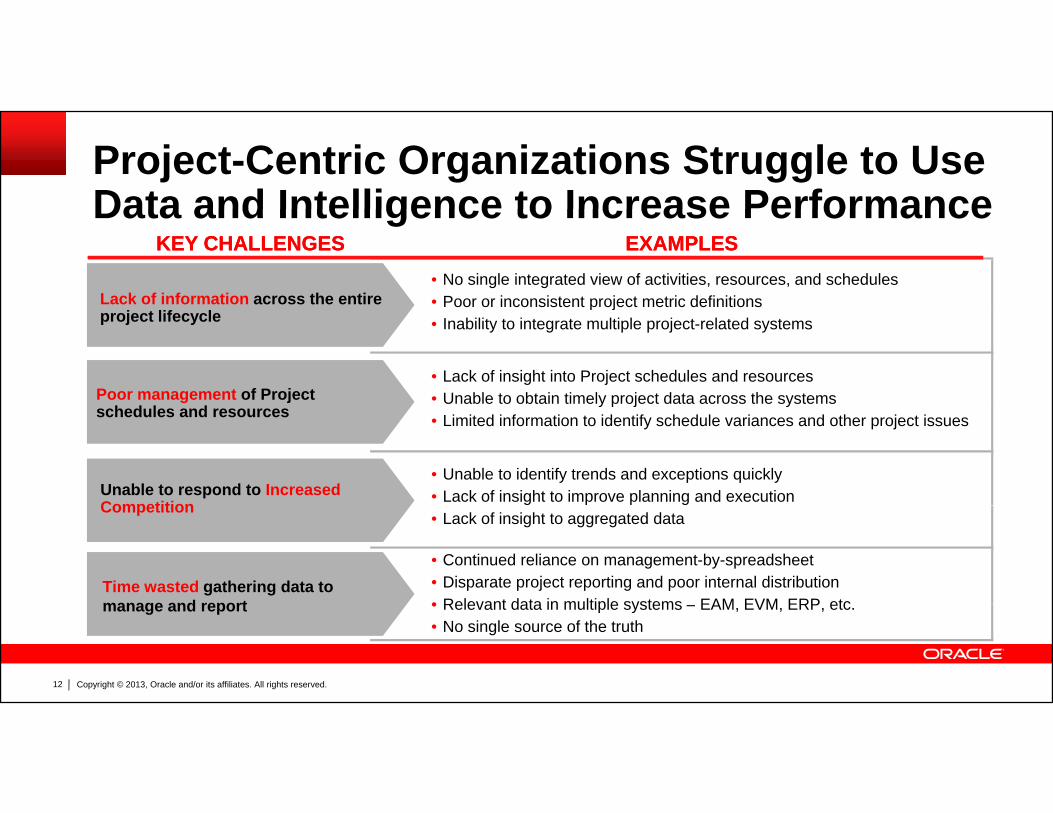
Project-Centric Organizations Struggle to Use Data and Intelligence to Increase Performance
Lack of information across the entire • No single integrated view of activities, resources, and schedules• Poor or inconsistent project metric definitions
EXAMPLESEXAMPLESKEY CHALLENGESKEY CHALLENGESData and Intelligence to Increase Performance
project lifecycle
Poor management of Project h d l d
p j• Inability to integrate multiple project-related systems
• Lack of insight into Project schedules and resources• Unable to obtain timely project data across the systems
schedules and resourcesy p j y
• Limited information to identify schedule variances and other project issues
• Unable to identify trends and exceptions quickly• Lack of insight to improve planning and executionUnable to respond to Increased
Competition
Time wasted gathering data to manage and report
• Continued reliance on management-by-spreadsheet• Disparate project reporting and poor internal distribution• Relevant data in multiple systems EAM EVM ERP etc
• Lack of insight to aggregated dataCompetition
Copyright © 2013, Oracle and/or its affiliates. All rights reserved.12
manage and report • Relevant data in multiple systems – EAM, EVM, ERP, etc.• No single source of the truth
Primavera P6 Analytics Sample DashboardsRich Solution for Project-Centric Organizations (slide 1 of 2)
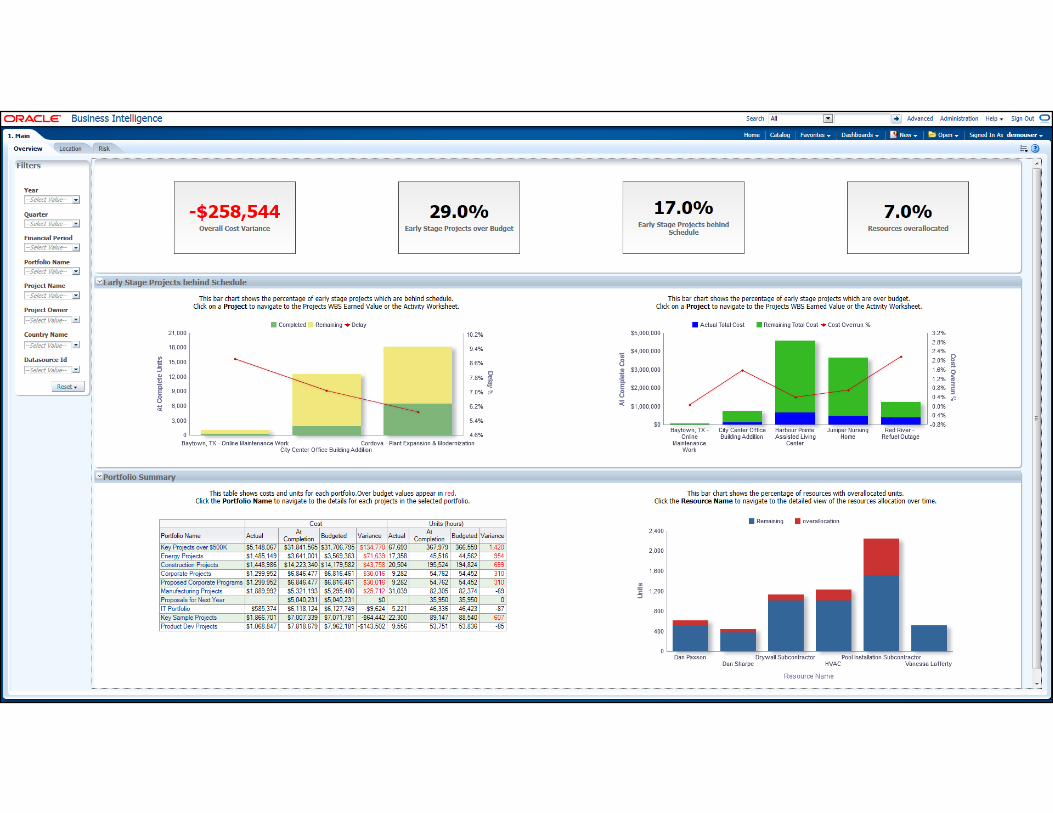
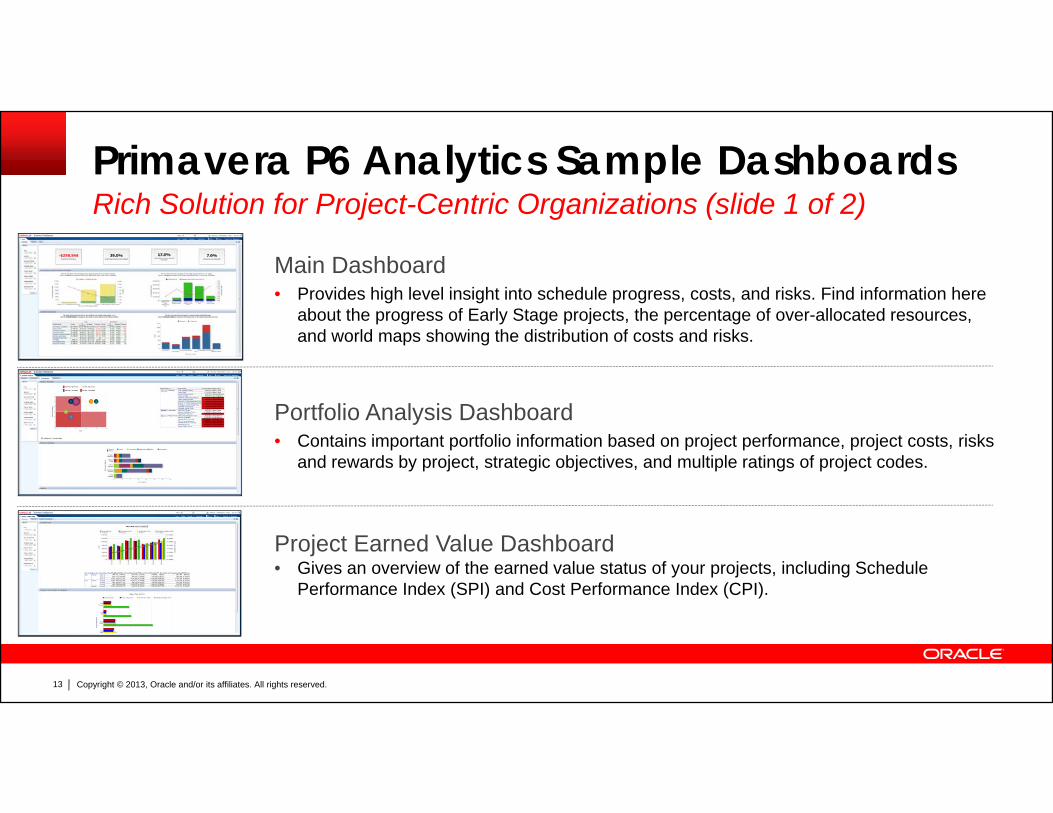
Main Dashboard• Provides high level insight into schedule progress, costs, and risks. Find information here
b h f E l S j h f ll d
Rich Solution for Project Centric Organizations (slide 1 of 2)
P tf li A l i D hb d
about the progress of Early Stage projects, the percentage of over-allocated resources, and world maps showing the distribution of costs and risks.
Portfolio Analysis Dashboard• Contains important portfolio information based on project performance, project costs, risks
and rewards by project, strategic objectives, and multiple ratings of project codes.
Project Earned Value Dashboard• Gives an overview of the earned value status of your projects, including Schedule
Performance Index (SPI) and Cost Performance Index (CPI).
Copyright © 2013, Oracle and/or its affiliates. All rights reserved.13
Primavera P6 Analytics Sample DashboardsRich Solution for Project-Centric Organizations (slide 2 of 2)
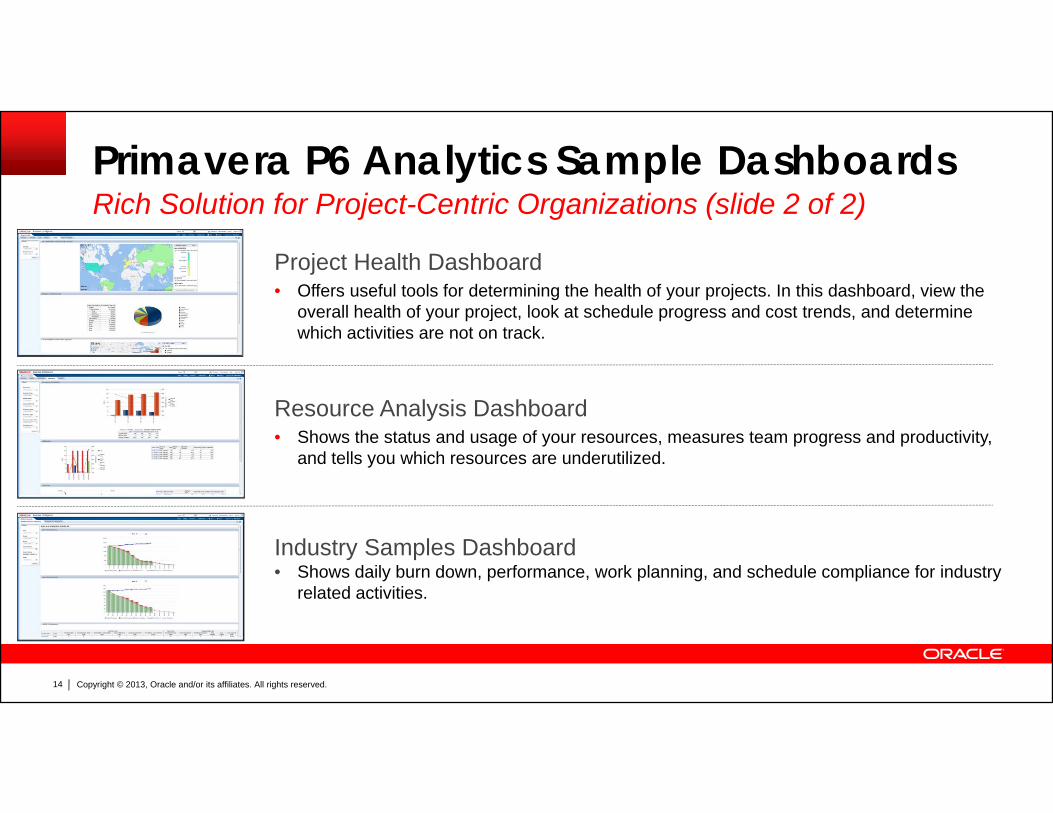
Project Health Dashboard• Offers useful tools for determining the health of your projects. In this dashboard, view the
ll h lth f j t l k t h d l d t t d d d t i
Rich Solution for Project Centric Organizations (slide 2 of 2)
Resource Analysis Dashboard
overall health of your project, look at schedule progress and cost trends, and determine which activities are not on track.
Resource Analysis Dashboard• Shows the status and usage of your resources, measures team progress and productivity,
and tells you which resources are underutilized.
Industry Samples Dashboard• Shows daily burn down, performance, work planning, and schedule compliance for industry
related activities.
Copyright © 2013, Oracle and/or its affiliates. All rights reserved.14
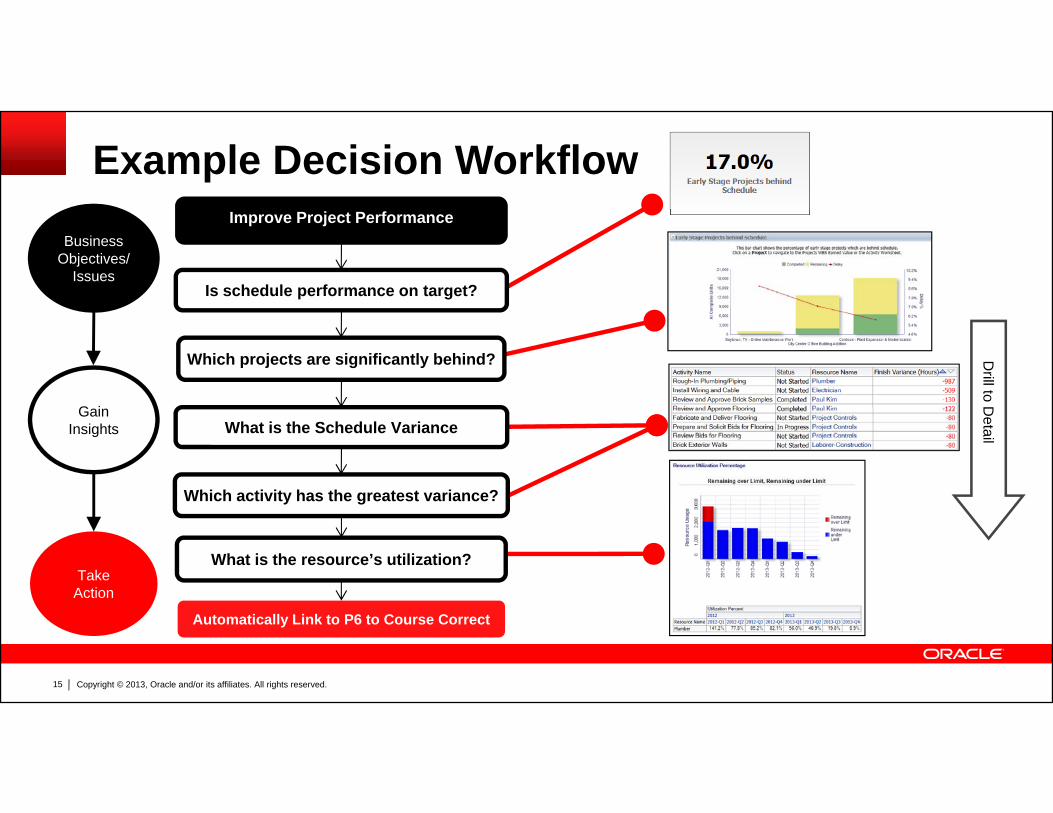
Example Decision Workflow
Is schedule performance on target?
Improve Project PerformanceBusiness
Objectives/Issues
Which projects are significantly behind? Drill to
G iWhat is the Schedule Variance
Which activity has the greatest variance?
Detail
GainInsights
What is the resource’s utilization?Take
Action
Copyright © 2013, Oracle and/or its affiliates. All rights reserved.15
Automatically Link to P6 to Course Correct
FlexibleThi k B d D hb dThink Beyond Dashboards
Copyright © 2013, Oracle and/or its affiliates. All rights reserved.16
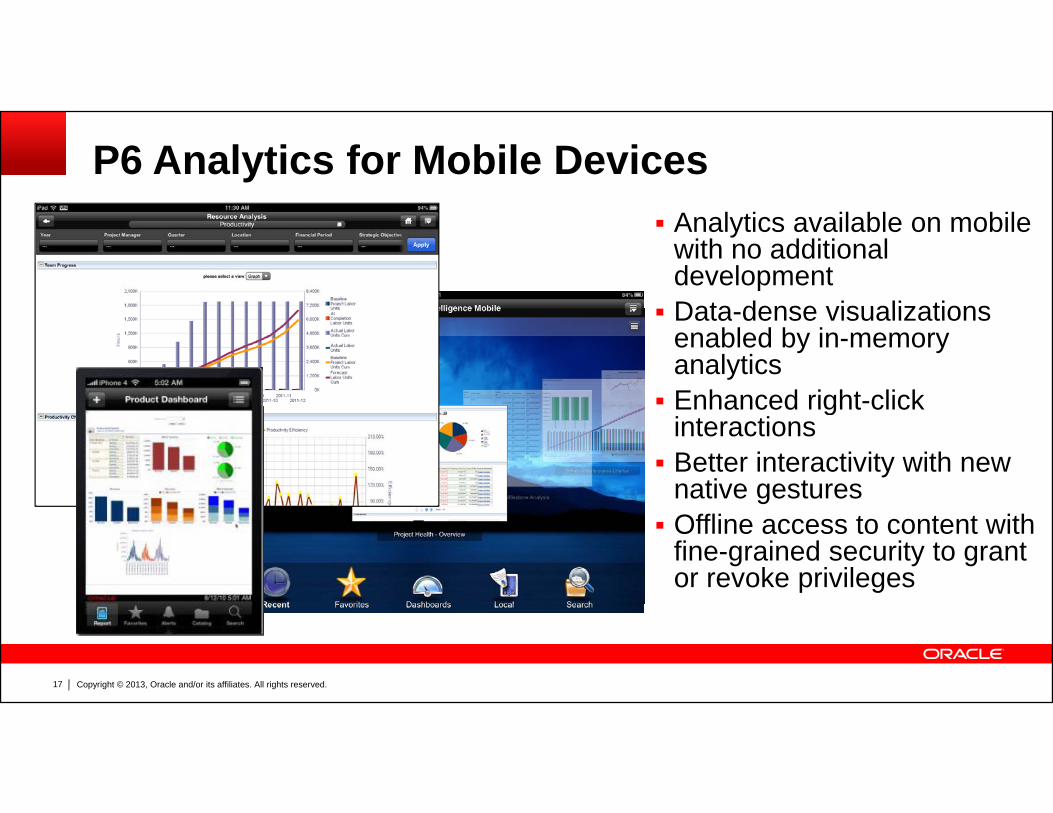
P6 Analytics for Mobile Devices Analytics available on mobile
with no additional developmentData dense visualizations Data-dense visualizations enabled by in-memory analytics Enhanced right-clickEnhanced right click
interactions Better interactivity with new
native gestures Offline access to content with
fine-grained security to grant or revoke privileges
Copyright © 2013, Oracle and/or its affiliates. All rights reserved.17
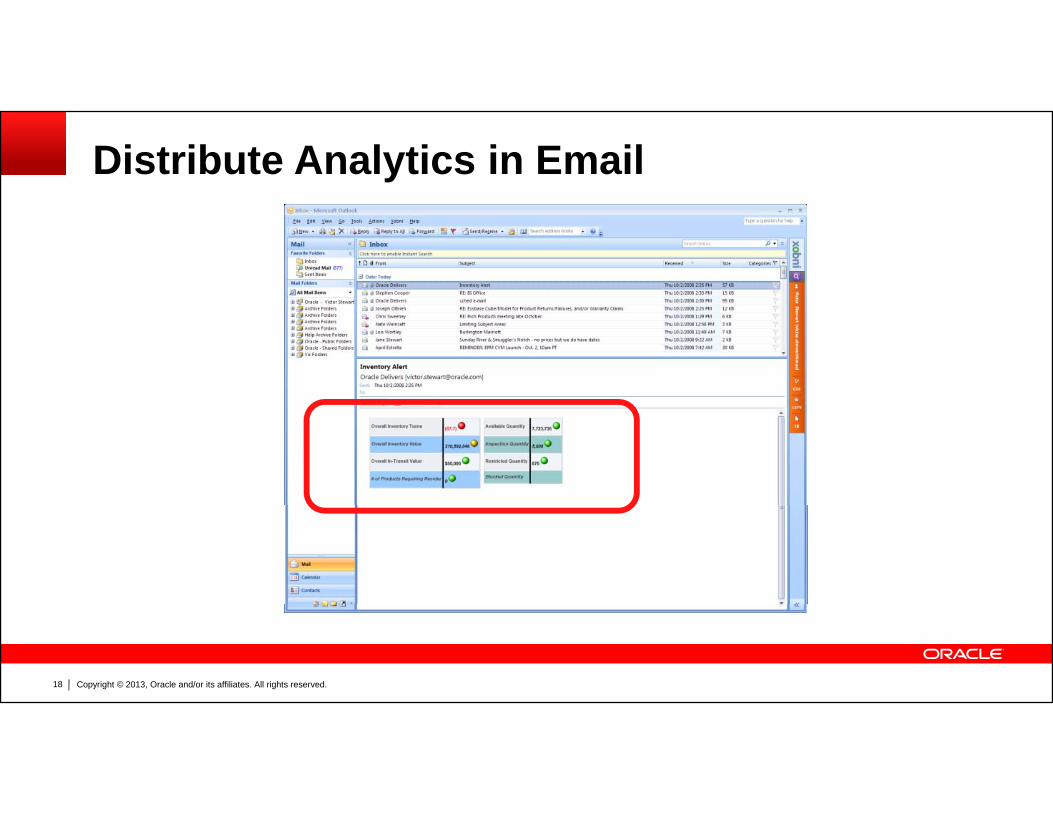
Distribute Analytics in Email
Copyright © 2013, Oracle and/or its affiliates. All rights reserved.18
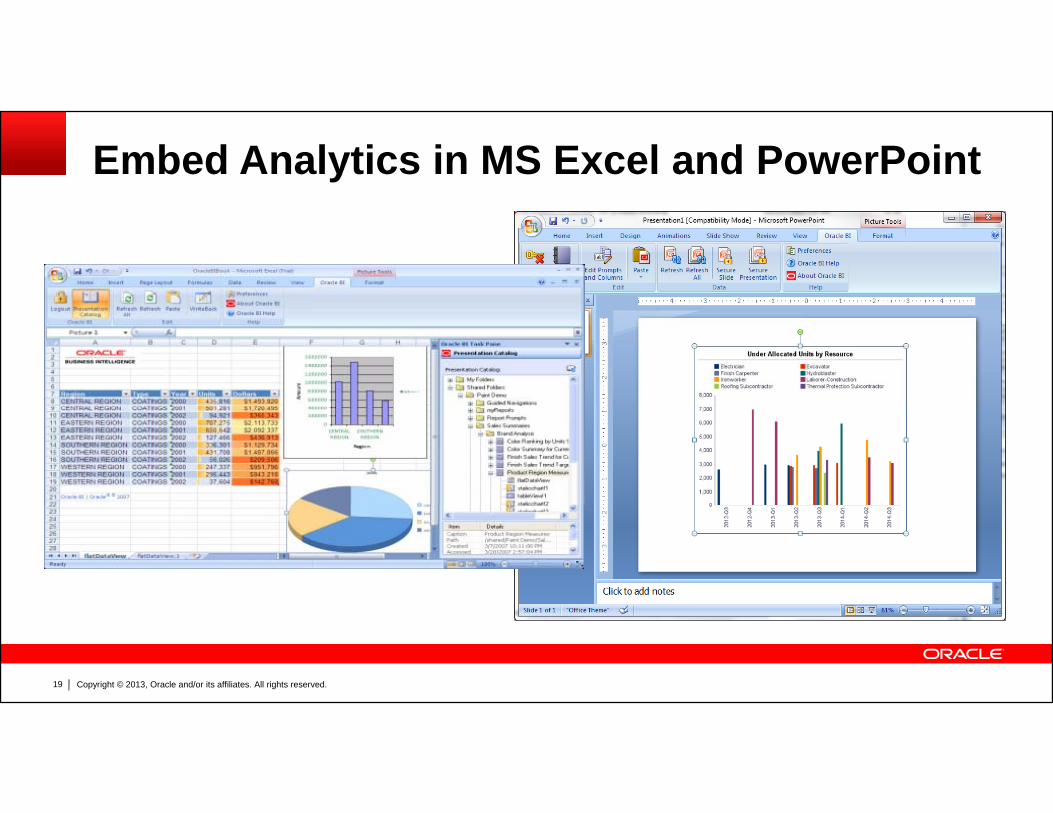
Embed Analytics in MS Excel and PowerPoint
Copyright © 2013, Oracle and/or its affiliates. All rights reserved.19
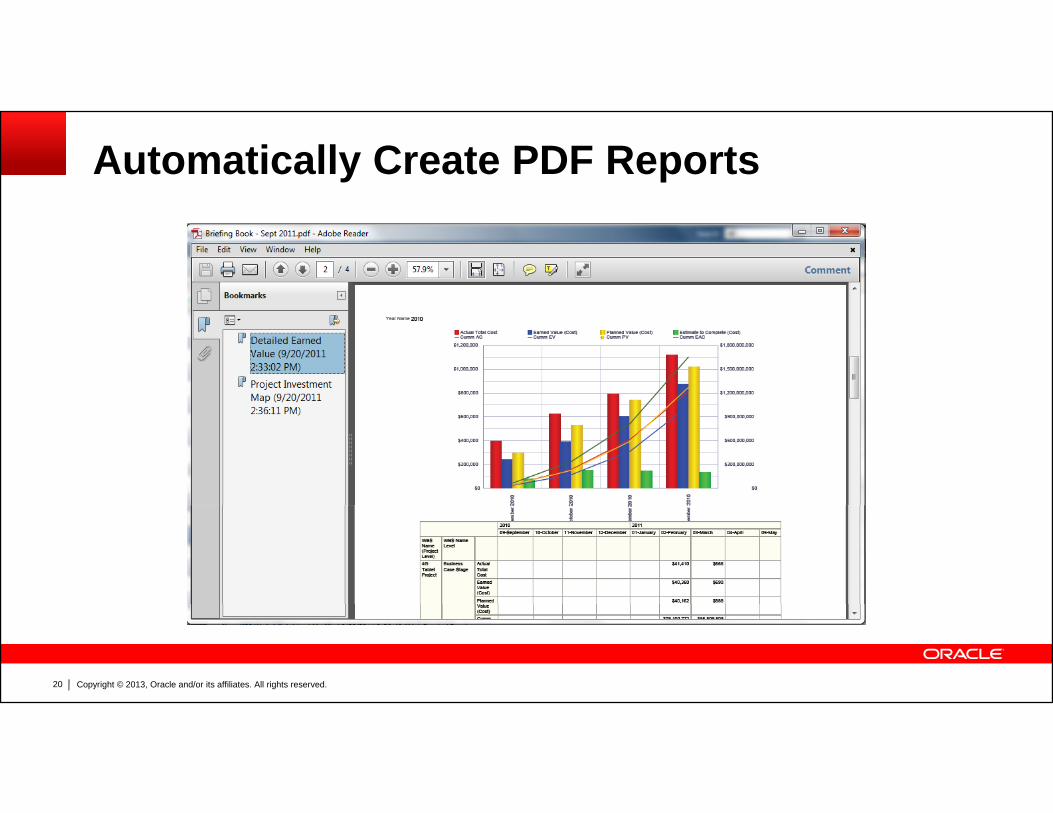
Automatically Create PDF Reports
Copyright © 2013, Oracle and/or its affiliates. All rights reserved.20
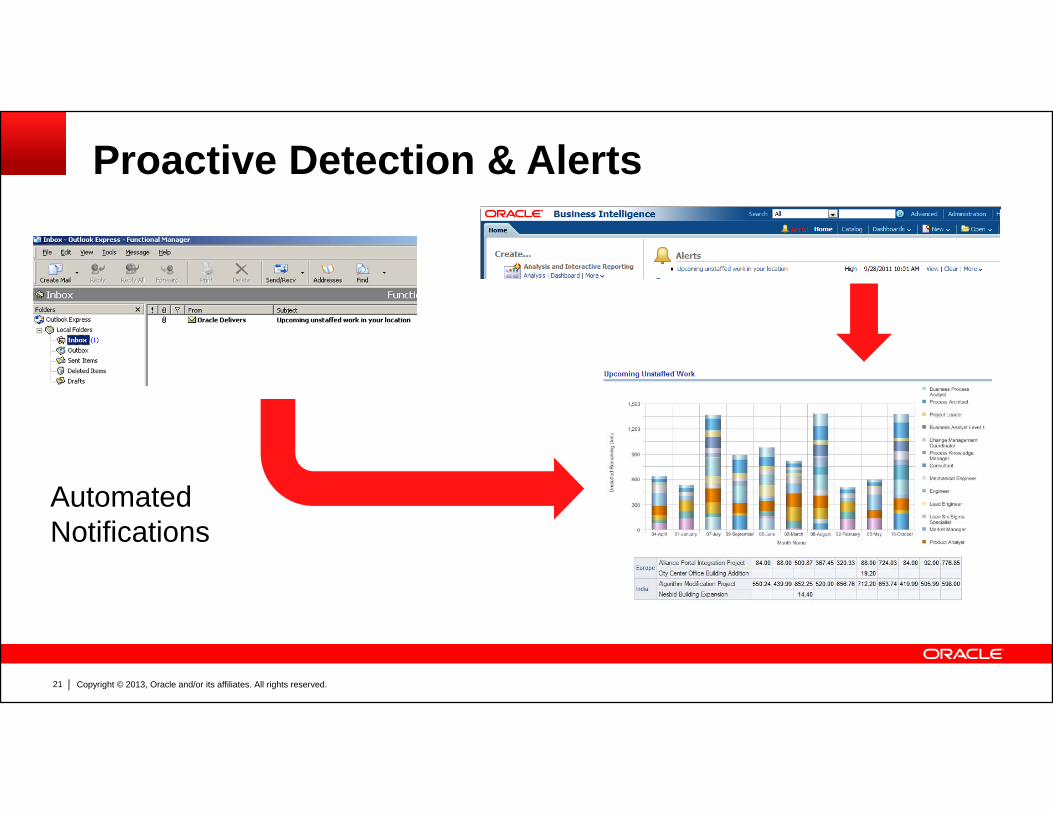
Proactive Detection & Alerts
AutomatedAutomated Notifications
Copyright © 2013, Oracle and/or its affiliates. All rights reserved.21
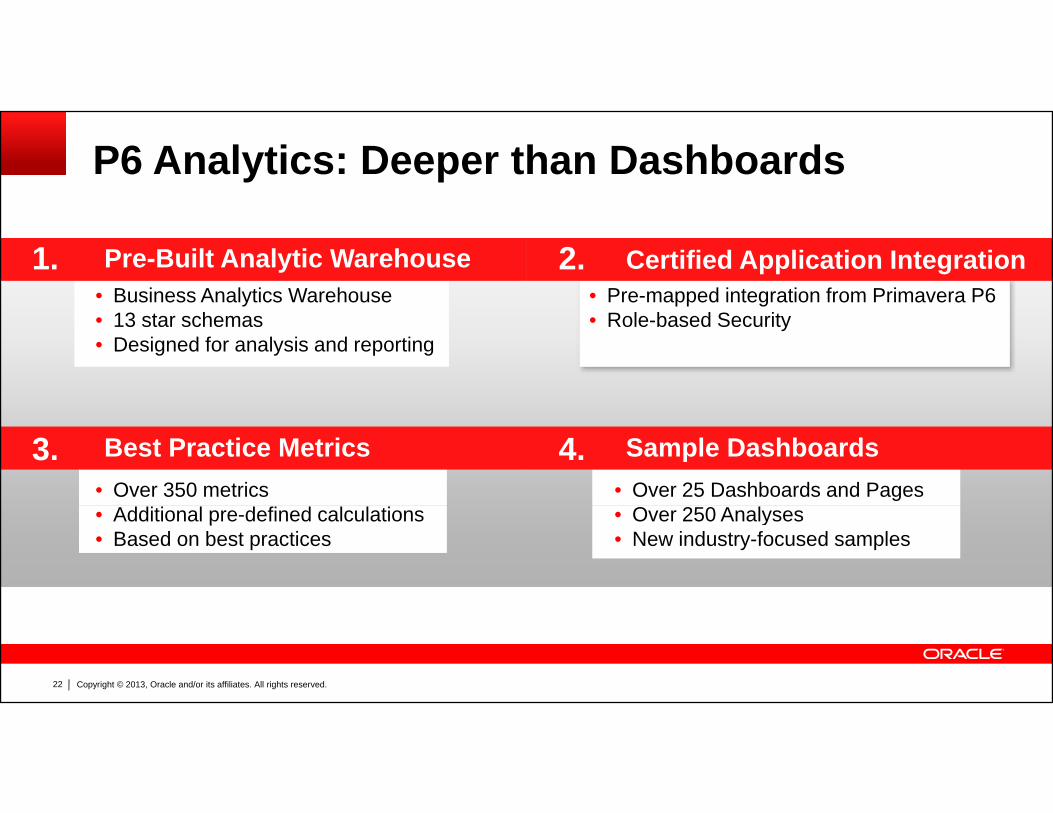
P6 Analytics: Deeper than Dashboards
Pre-Built Analytic Warehouse1.• Business Analytics Warehouse
2.• Pre-mapped integration from Primavera P6
Certified Application Integration
• 13 star schemas • Designed for analysis and reporting
• Role-based Security
Sample DashboardsBest Practice Metrics3. 4.• Over 350 metrics • Over 25 Dashboards and Pages• Additional pre-defined calculations• Based on best practices
• Over 250 Analyses• New industry-focused samples
Copyright © 2013, Oracle and/or its affiliates. All rights reserved.22
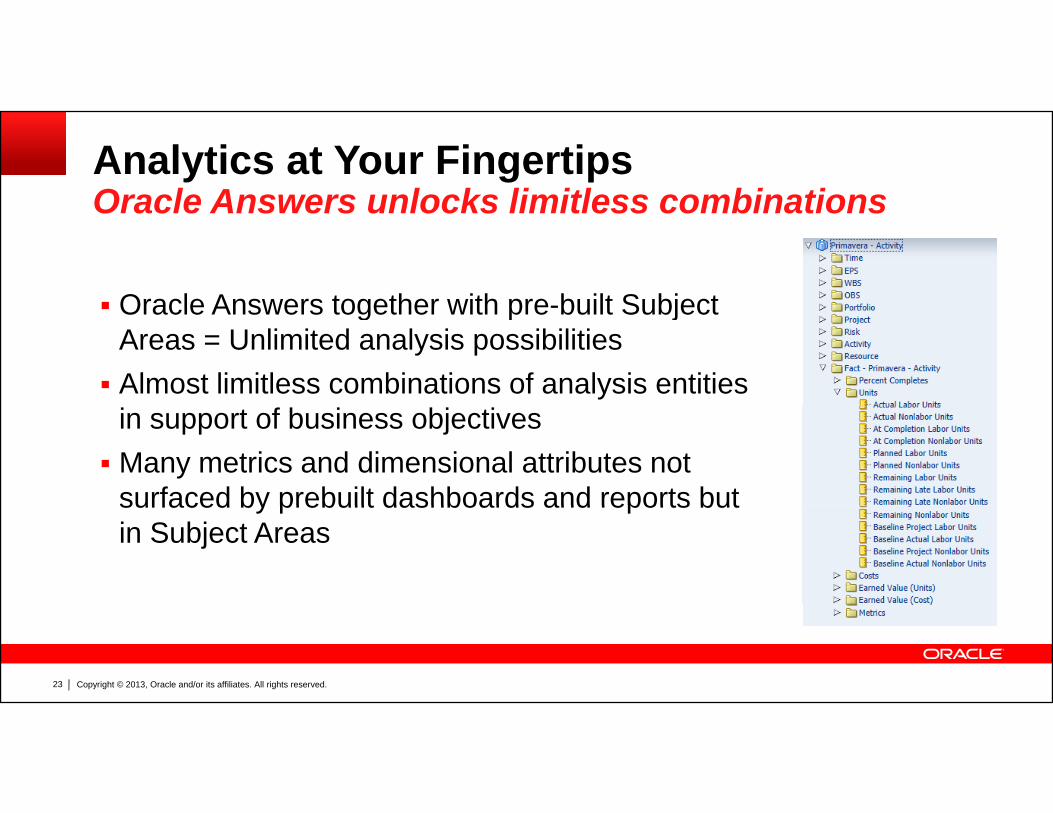
Analytics at Your FingertipsOracle Answers unlocks limitless combinationsOracle Answers unlocks limitless combinations
Oracle Answers together with pre-built Subject Oracle Answers together with pre-built Subject Areas = Unlimited analysis possibilities Almost limitless combinations of analysis entities
in support of business objectives Many metrics and dimensional attributes not
surfaced by prebuilt dashboards and reports butsurfaced by prebuilt dashboards and reports but in Subject Areas
Copyright © 2013, Oracle and/or its affiliates. All rights reserved.23
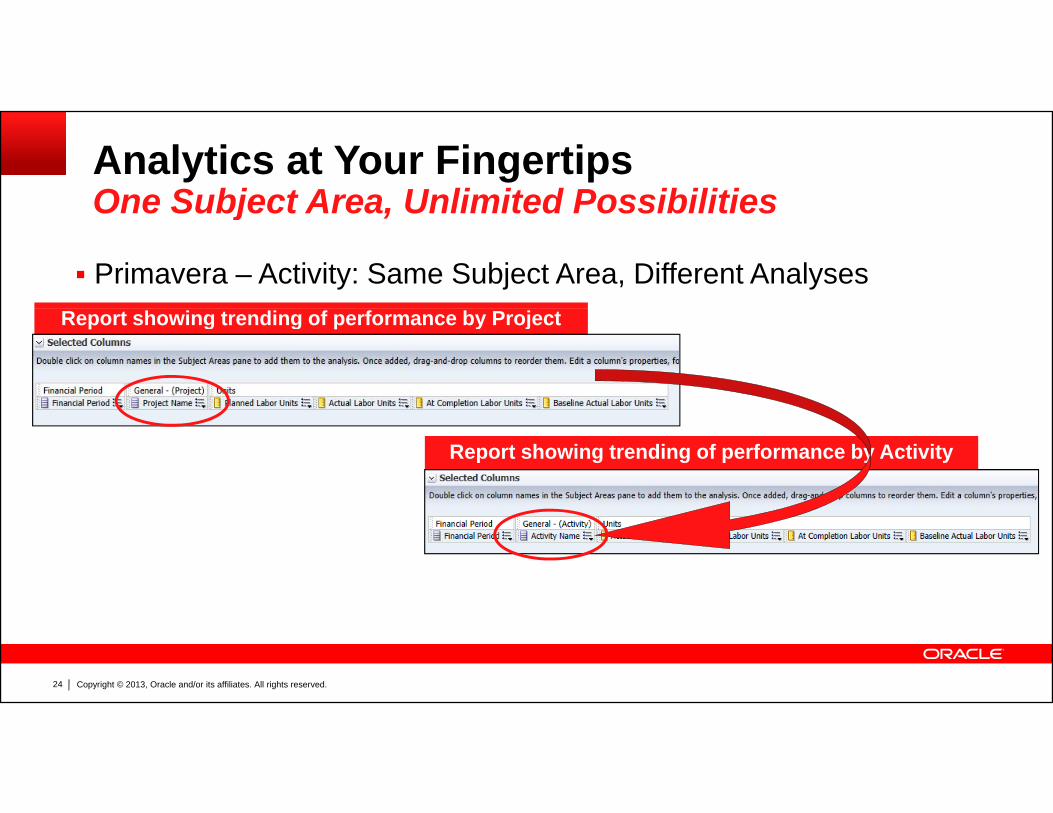
Analytics at Your Fingertips One Subject Area, Unlimited PossibilitiesOne Subject Area, Unlimited Possibilities
Primavera – Activity: Same Subject Area, Different AnalysesReport showing trending of performance by Project
Report showing trending of performance by Activity
Copyright © 2013, Oracle and/or its affiliates. All rights reserved.24
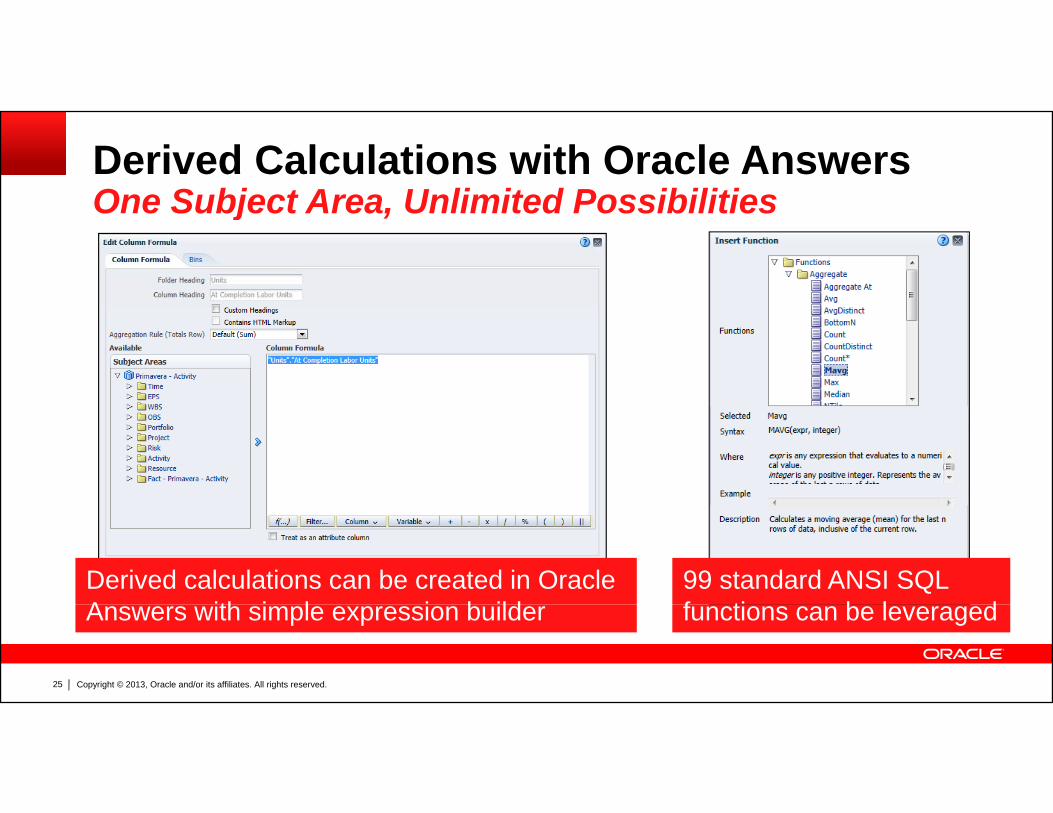
Derived Calculations with Oracle AnswersOne Subject Area, Unlimited PossibilitiesOne Subject Area, Unlimited Possibilities
Derived calculations can be created in Oracle A ith i l i b ild
99 standard ANSI SQL f ti b l d
Copyright © 2013, Oracle and/or its affiliates. All rights reserved.25
Answers with simple expression builder functions can be leveraged
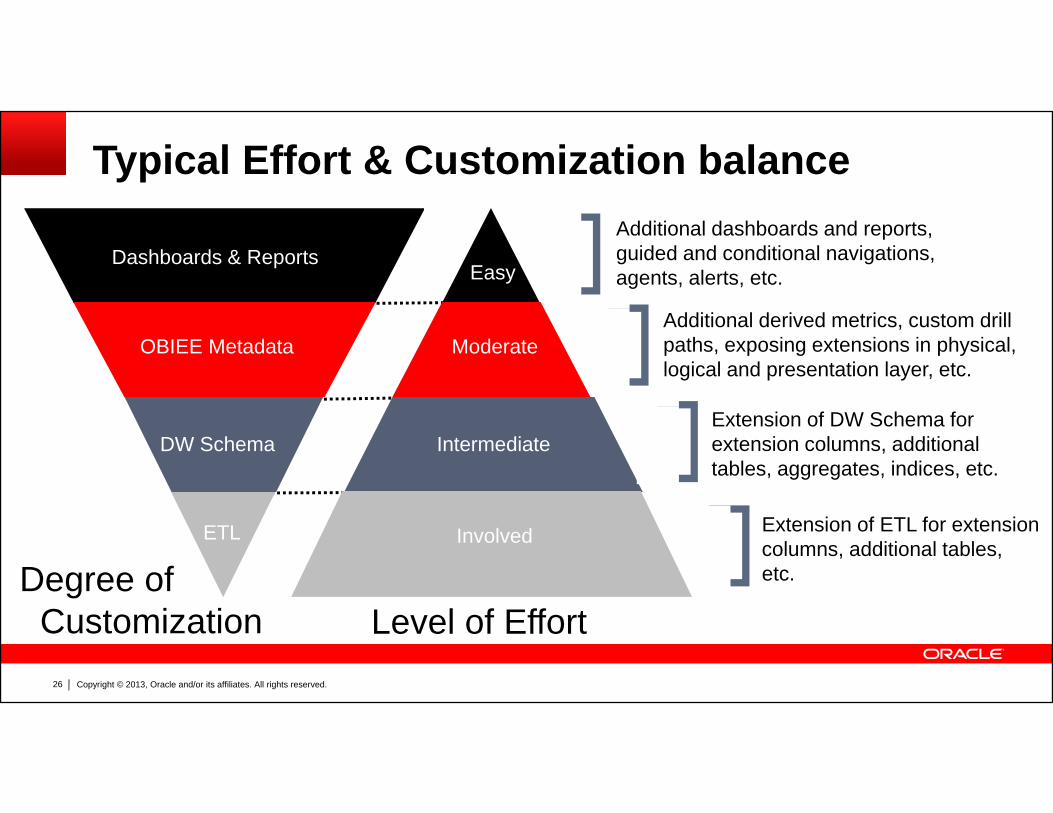
Typical Effort & Customization balanceAdditional dashboards and reports, guided and conditional navigations, agents, alerts, etc.Easy
Dashboards & Reports
Additional derived metrics, custom drill paths, exposing extensions in physical, logical and presentation layer, etc.
ModerateOBIEE Metadata
Extension of DW Schema for extension columns, additional tables, aggregates, indices, etc.
IntermediateDW Schema
Extension of ETL for extension columns, additional tables, etc.Degree of
InvolvedETL
Copyright © 2013, Oracle and/or its affiliates. All rights reserved.26
Level of EffortCustomization
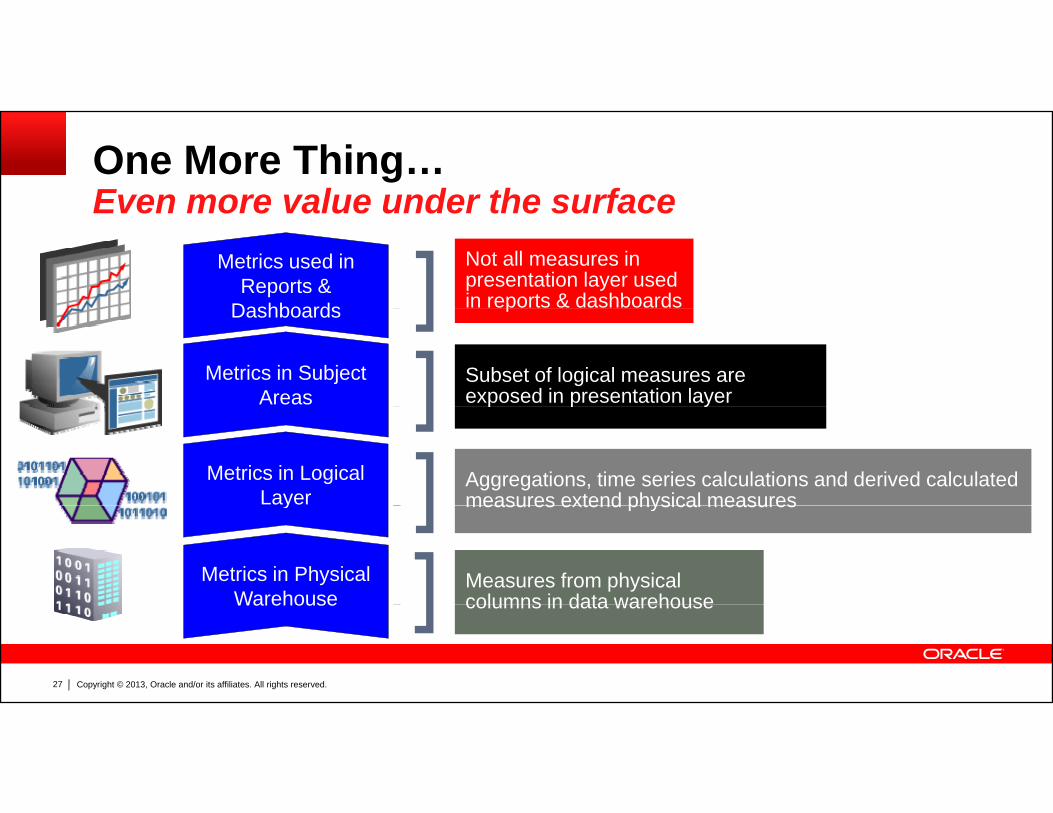
One More Thing…Even more value under the surfaceEven more value under the surface
Not all measures in presentation layer used in reports & dashboards
Metrics used in Reports &
Dashboards
Subset of logical measures are exposed in presentation layer
pDashboards
Metrics in Subject Areas
Aggregations, time series calculations and derived calculated measures extend physical measures
y
Metrics in Logical Layer
Measures from physical columns in data warehouse
measures extend physical measures
Metrics in Physical Warehouse
y
Copyright © 2013, Oracle and/or its affiliates. All rights reserved.27
columns in data warehouseWarehouse
Today C t R lCurrent Releases
Copyright © 2013, Oracle and/or its affiliates. All rights reserved.28
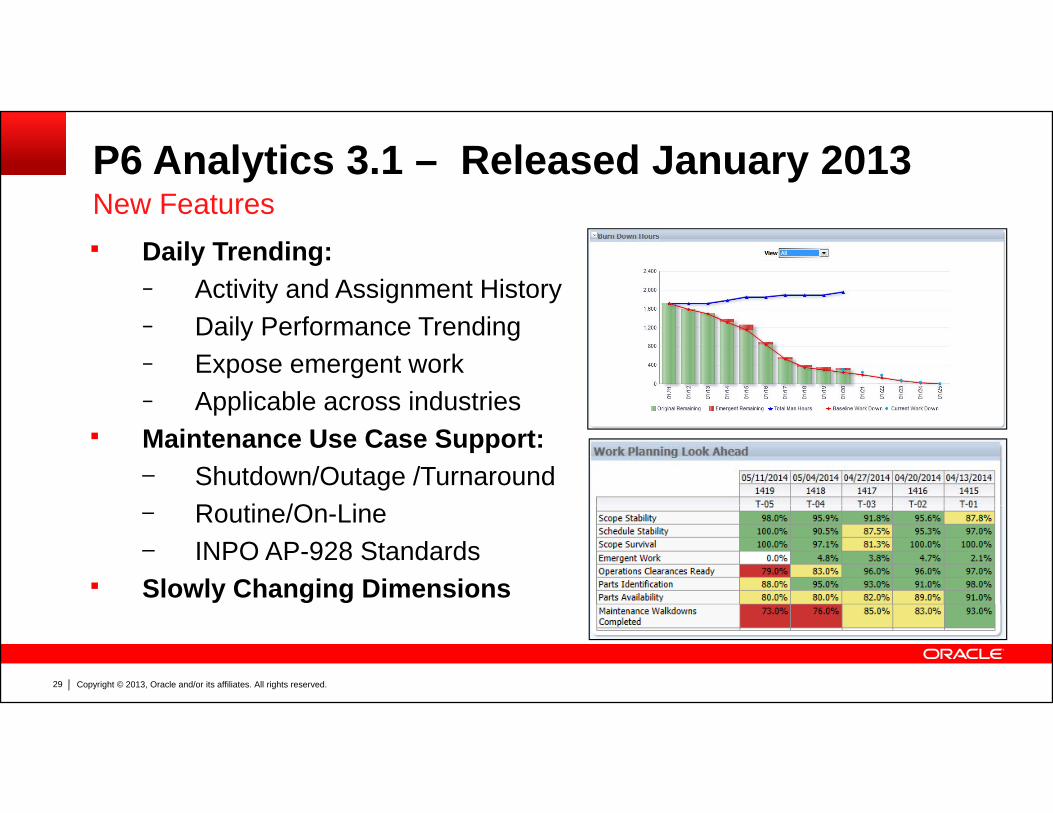
P6 Analytics 3.1 – Released January 2013New Features Daily Trending:
− Activity and Assignment History
New Features
− Daily Performance Trending− Expose emergent work− Applicable across industriesApplicable across industries
Maintenance Use Case Support:– Shutdown/Outage /Turnaround
R ti /O Li– Routine/On-Line– INPO AP-928 Standards
Slowly Changing Dimensions
Copyright © 2013, Oracle and/or its affiliates. All rights reserved.29
Why P6 Analytics for Maintenance?Control Compliance and Risk Mitigation
• Large assets need to operate efficiently and safely
Control, Compliance, and Risk Mitigation
Large assets need to operate efficiently and safely• Unexpected surprises can have a major impact to an asset
owner, including financial, legal, safety, and environmentalP6 A l ti id t i ibilit d t l i t• P6 Analytics provides greater visibility and control into planning and execution and helps to: Minimize downtime Quickly address risks to the schedule Increase the odds of a safely operating asset In some industries help meet regulatory guidelines
Copyright © 2013, Oracle and/or its affiliates. All rights reserved.30
In some industries, help meet regulatory guidelines
NewP6 A l ti 3 2P6 Analytics 3.2
Copyright © 2013, Oracle and/or its affiliates. All rights reserved.31
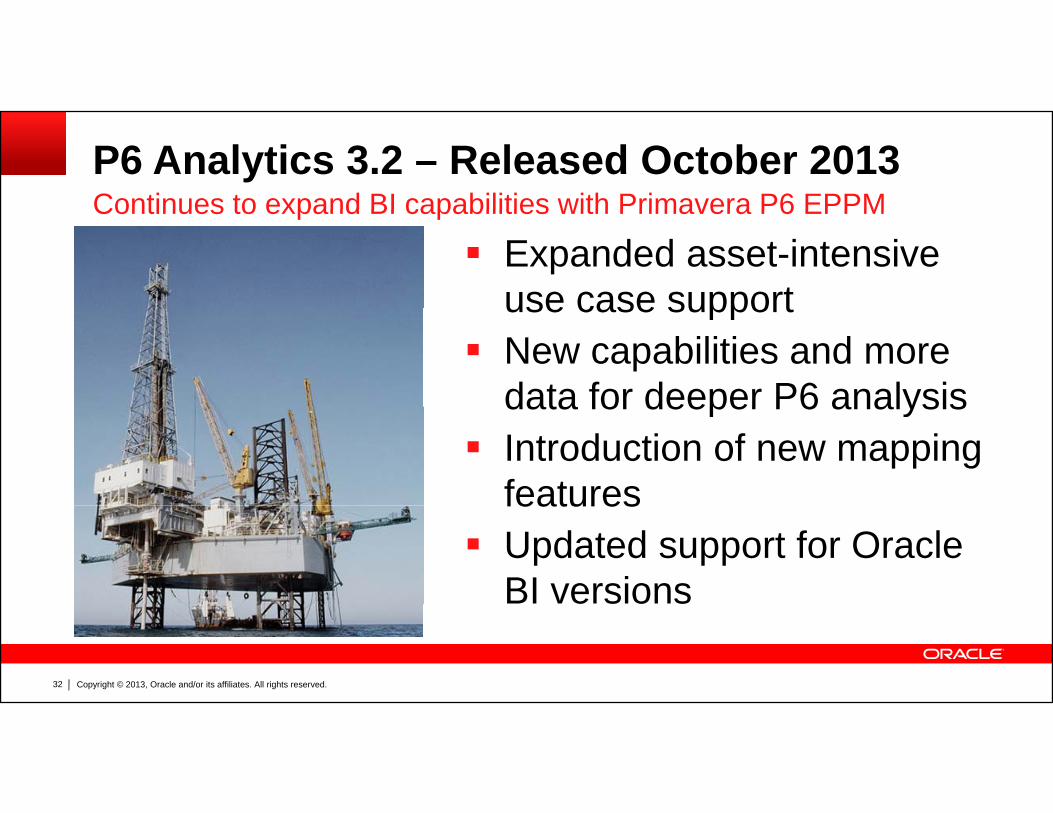
P6 Analytics 3.2 – Released October 2013Continues to expand BI capabilities with Primavera P6 EPPMContinues to expand BI capabilities with Primavera P6 EPPM
Expanded asset-intensive use case supportuse case support
New capabilities and more data for deeper P6 analysisdata for deeper P6 analysis
Introduction of new mapping featuresfeatures
Updated support for Oracle BI versions
Copyright © 2013, Oracle and/or its affiliates. All rights reserved.32
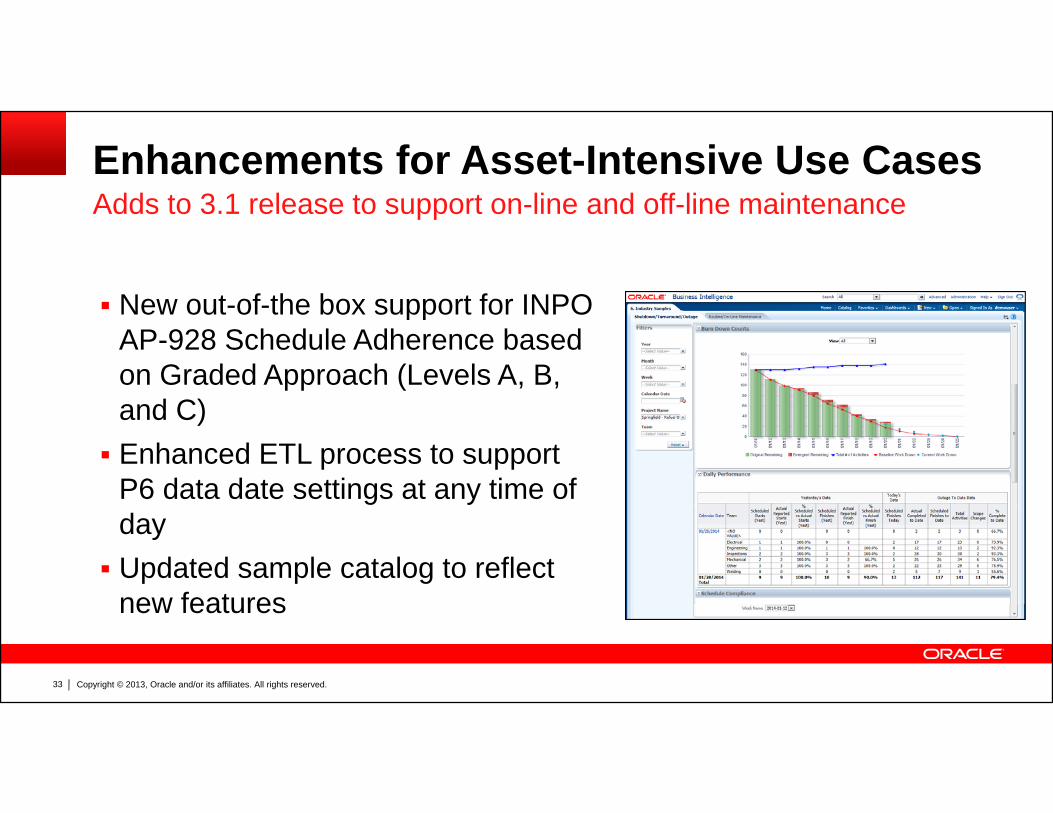
Enhancements for Asset-Intensive Use CasesAdds to 3 1 release to support on-line and off-line maintenance
New out-of-the box support for INPO
Adds to 3.1 release to support on line and off line maintenance
New out-of-the box support for INPO AP-928 Schedule Adherence based on Graded Approach (Levels A, B, and C)and C) Enhanced ETL process to support
P6 data date settings at any time of day Updated sample catalog to reflect
new features
Copyright © 2013, Oracle and/or its affiliates. All rights reserved.33
new features
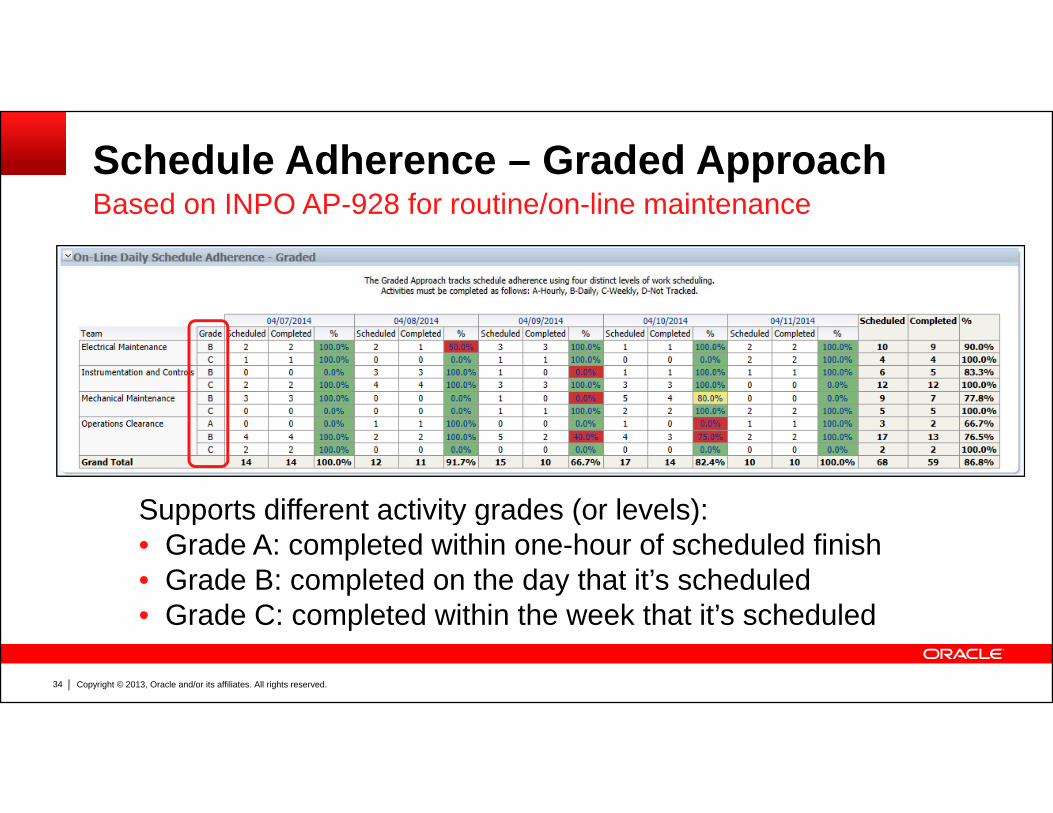
Schedule Adherence – Graded ApproachBased on INPO AP-928 for routine/on-line maintenanceBased on INPO AP 928 for routine/on line maintenance
Supports different activity grades (or levels):Supports different activity grades (or levels):• Grade A: completed within one-hour of scheduled finish• Grade B: completed on the day that it’s scheduled
G d C l d i hi h k h i ’ h d l d
Copyright © 2013, Oracle and/or its affiliates. All rights reserved.34
• Grade C: completed within the week that it’s scheduled
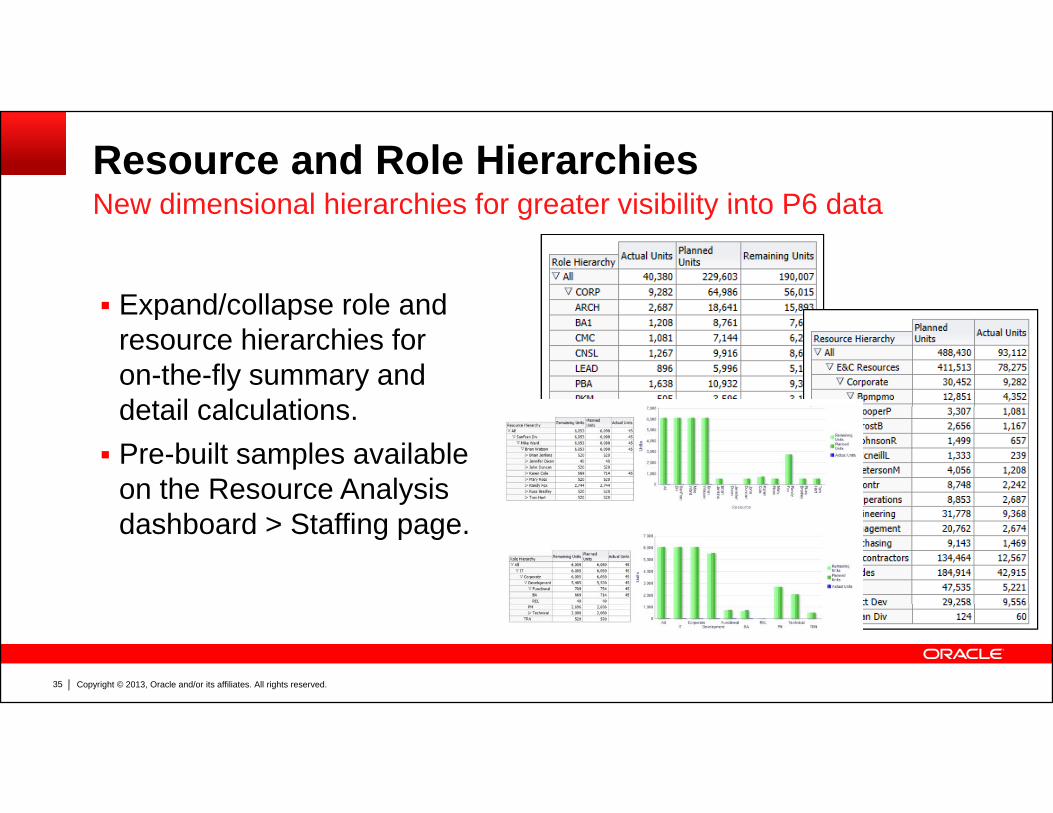
Resource and Role HierarchiesNew dimensional hierarchies for greater visibility into P6 dataNew dimensional hierarchies for greater visibility into P6 data
Expand/collapse role and Expand/collapse role and resource hierarchies for on-the-fly summary and detail calculationsdetail calculations. Pre-built samples available
on the Resource Analysis dashboard > Staffing page.
Copyright © 2013, Oracle and/or its affiliates. All rights reserved.35
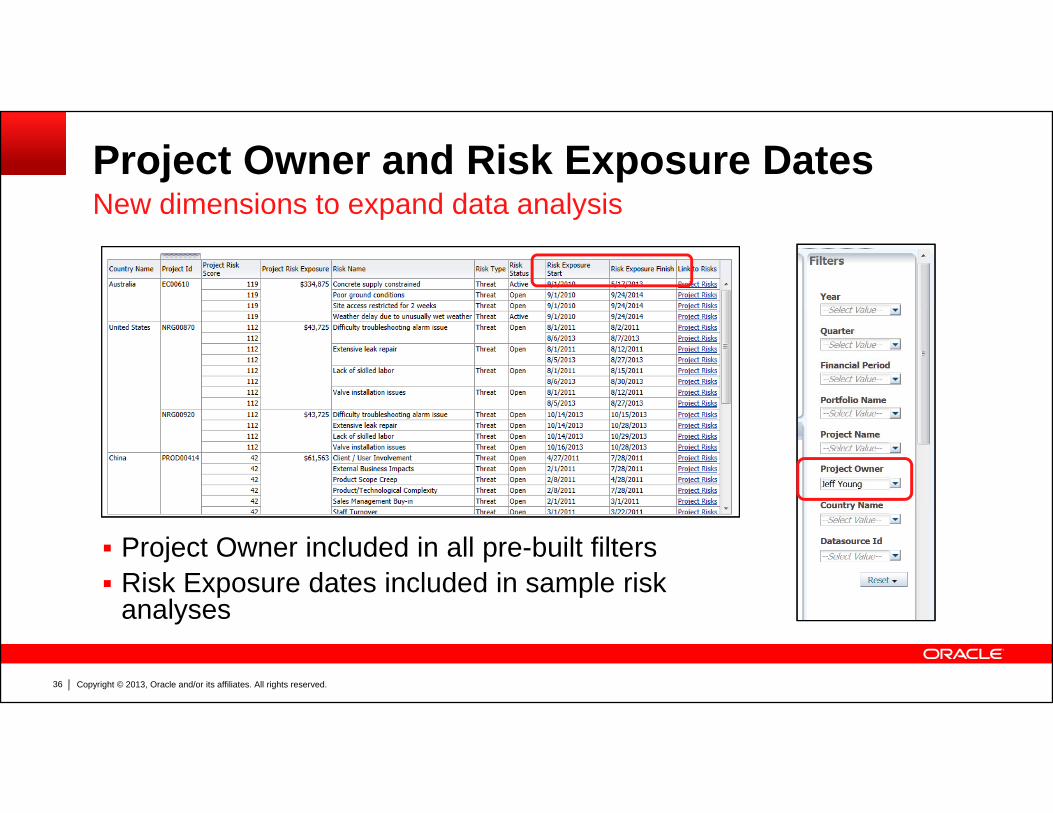
Project Owner and Risk Exposure DatesNew dimensions to expand data analysisNew dimensions to expand data analysis
Project Owner included in all pre-built filters Risk Exposure dates included in sample risk
anal ses
Copyright © 2013, Oracle and/or its affiliates. All rights reserved.36
analyses
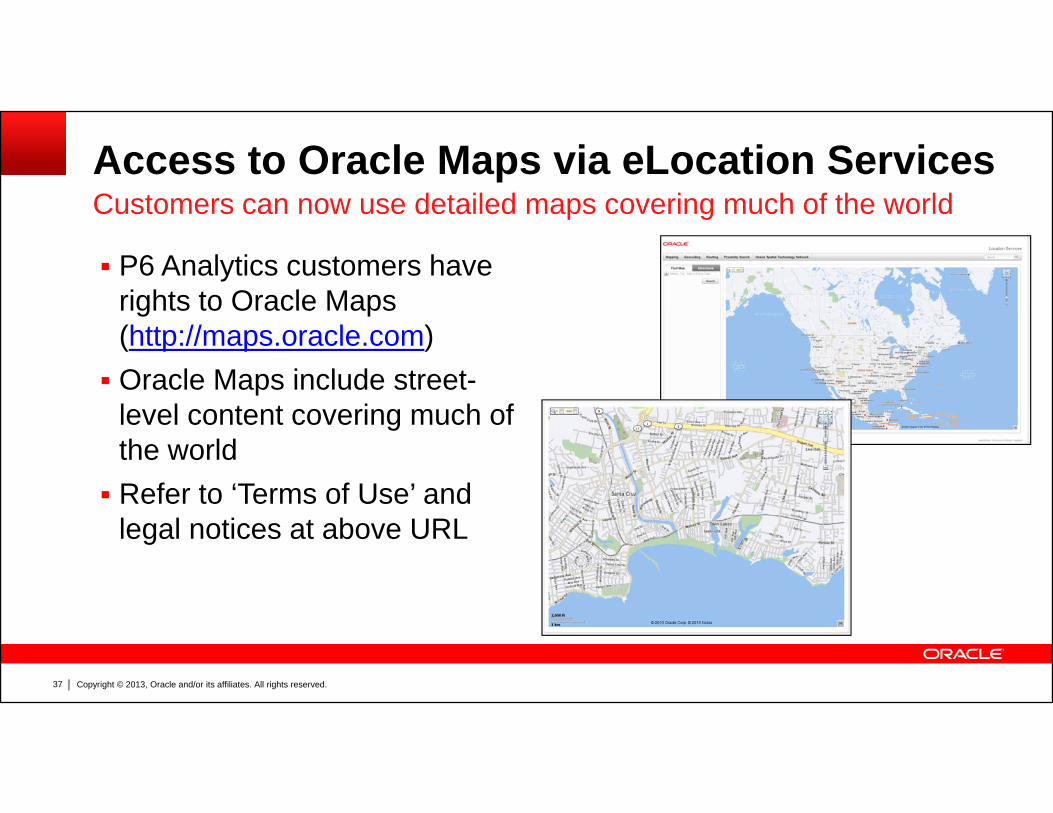
Access to Oracle Maps via eLocation ServicesCustomers can now use detailed maps covering much of the world
P6 Analytics customers have rights to Oracle Maps
Customers can now use detailed maps covering much of the world
rights to Oracle Maps (http://maps.oracle.com) Oracle Maps include street-
l l t t i h flevel content covering much of the world Refer to ‘Terms of Use’ and
legal notices at above URL
Copyright © 2013, Oracle and/or its affiliates. All rights reserved.37
Additional EnhancementsNew Catalog and Platform Updates
Enhanced sample catalog includes new analyses new features
New Catalog and Platform Updates
Enhanced sample catalog includes new analyses, new features of OBI, as well as minor bug fixes. Platforms and version updates:
– New parallel release of Primavera Reporting Database R3.2– P6 Analytics R3.2 Supported on Primavera P6 8.2 SP1+ and 8.3+
Supports Oracle BI 11 1 1 7+ on Oracle WebLogic (OBI 11 1 1 6+– Supports Oracle BI 11.1.1.7+ on Oracle WebLogic (OBI 11.1.1.6+ still supported, too)
Copyright © 2013, Oracle and/or its affiliates. All rights reserved.38
New CertificationOBIEE 11 1 1 7OBIEE 11.1.1.7
Copyright © 2013, Oracle and/or its affiliates. All rights reserved.40
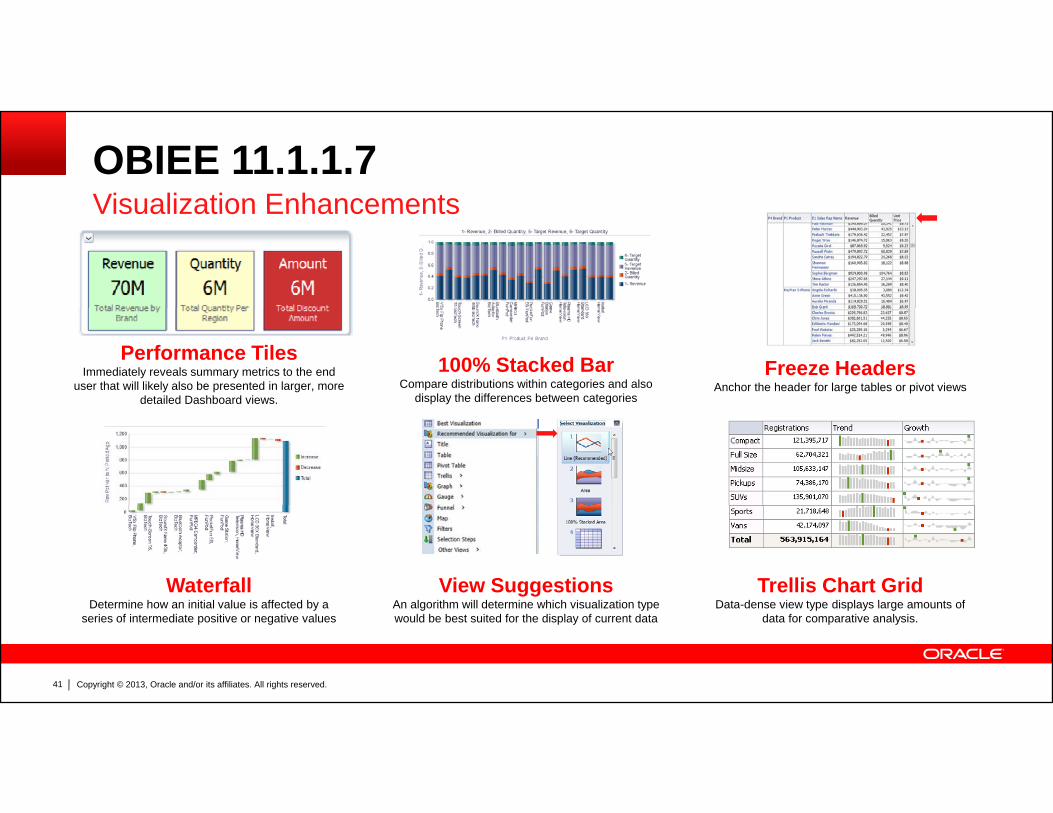
OBIEE 11.1.1.7Visualization EnhancementsVisualization Enhancements
100% Stacked BarCompare distributions within categories and also
display the differences between categories
Freeze HeadersAnchor the header for large tables or pivot views
Performance TilesImmediately reveals summary metrics to the end
user that will likely also be presented in larger, more detailed Dashboard views.
View SuggestionsAn algorithm will determine which visualization type
Trellis Chart GridData dense view type displays large amounts of
WaterfallDetermine how an initial value is affected by a
Copyright © 2013, Oracle and/or its affiliates. All rights reserved.41
An algorithm will determine which visualization type would be best suited for the display of current data
Data-dense view type displays large amounts of data for comparative analysis.
Determine how an initial value is affected by a series of intermediate positive or negative values
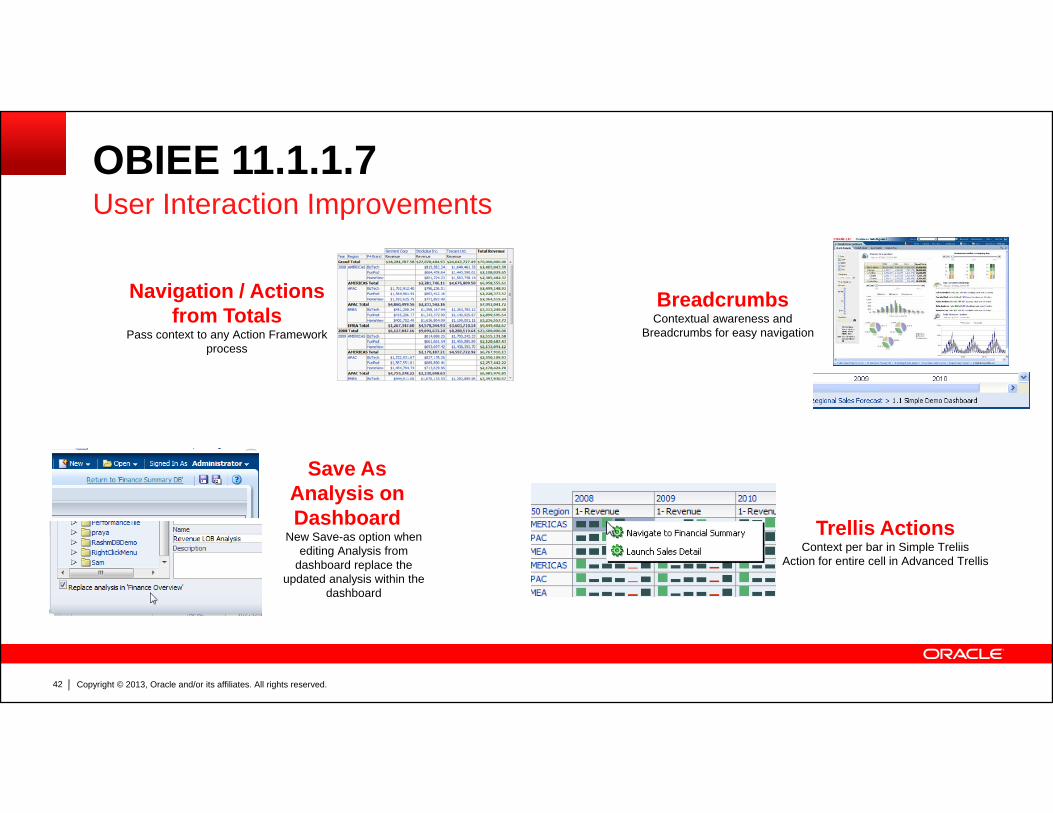
OBIEE 11.1.1.7User Interaction ImprovementsUser Interaction Improvements
BreadcrumbsNavigation / Actions f T t l Contextual awareness and
Breadcrumbs for easy navigationfrom Totals
Pass context to any Action Framework process
Save As Analysis on Dashboard
New Save-as option when editing Analysis from
dashboard replace the updated analysis within the
dashboard
Trellis ActionsContext per bar in Simple Treliis
Action for entire cell in Advanced Trellis
Copyright © 2013, Oracle and/or its affiliates. All rights reserved.42
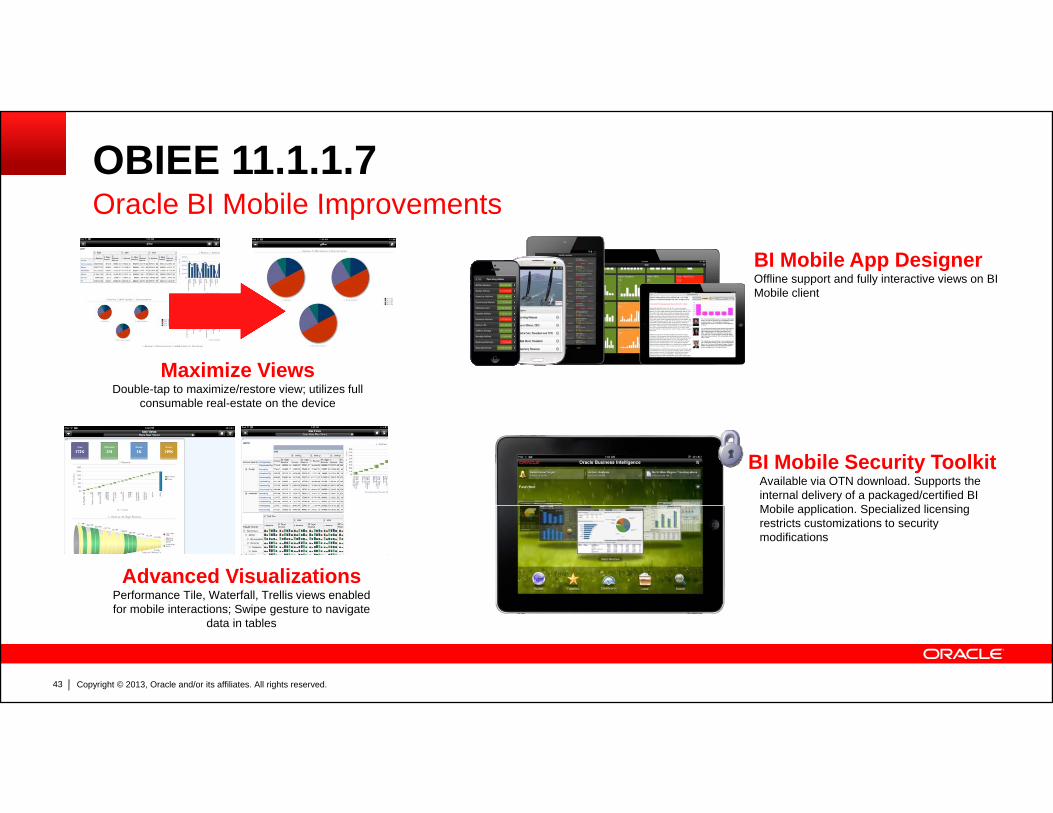
OBIEE 11.1.1.7Oracle BI Mobile ImprovementsOracle BI Mobile Improvements
BI Mobile App DesignerOffline support and fully interactive views on BI Mobile client
Maximize ViewsDouble-tap to maximize/restore view; utilizes full
consumable real-estate on the deviceconsumable real estate on the device
BI Mobile Security ToolkitAvailable via OTN download. Supports the internal delivery of a packaged/certified BI M bil li ti S i li d li i
Advanced VisualizationsPerformance Tile, Waterfall, Trellis views enabled
Mobile application. Specialized licensing restricts customizations to security modifications
Copyright © 2013, Oracle and/or its affiliates. All rights reserved.43
for mobile interactions; Swipe gesture to navigate data in tables
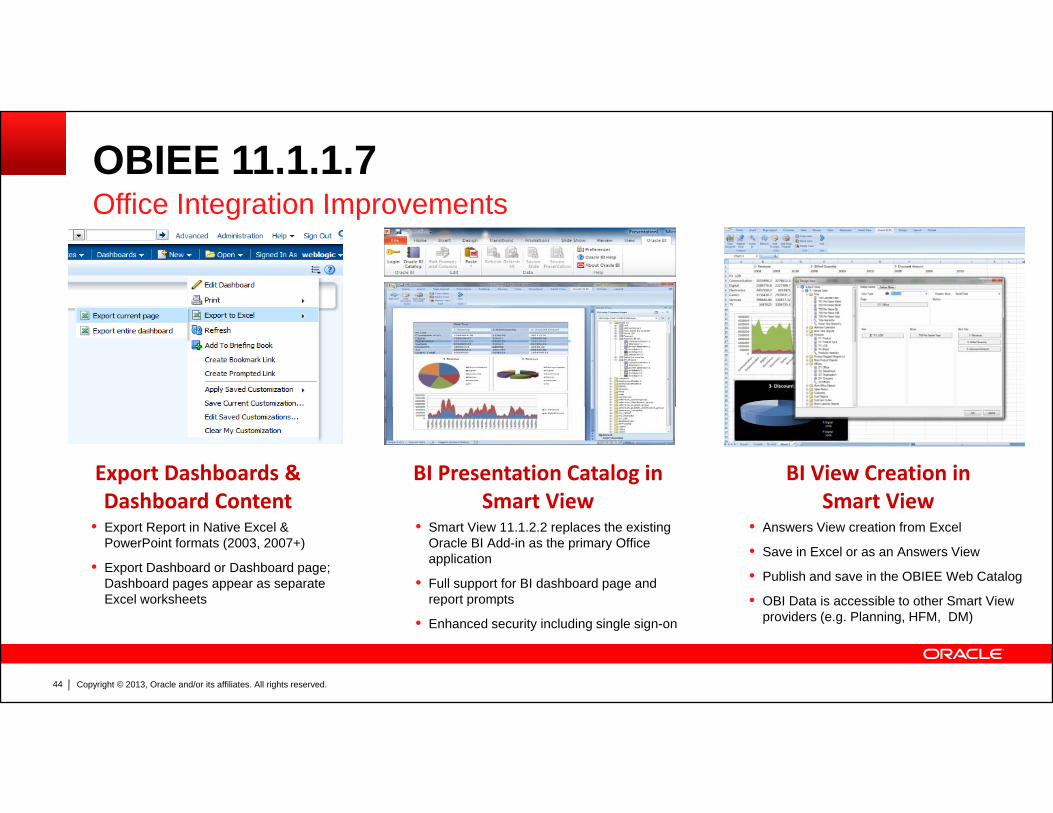
OBIEE 11.1.1.7Office Integration ImprovementsOffice Integration Improvements
BI Presentation Catalog in Smart View
Export Dashboards &Dashboard Content
BI View Creation in Smart ViewSmart View
• Smart View 11.1.2.2 replaces the existing Oracle BI Add-in as the primary Office application
• Full support for BI dashboard page and report prompts
Dashboard Content• Export Report in Native Excel &
PowerPoint formats (2003, 2007+)
• Export Dashboard or Dashboard page; Dashboard pages appear as separate Excel worksheets
Smart View• Answers View creation from Excel
• Save in Excel or as an Answers View
• Publish and save in the OBIEE Web Catalog
• OBI Data is accessible to other Smart View
Copyright © 2013, Oracle and/or its affiliates. All rights reserved.44
p p p
• Enhanced security including single sign-on
OBI Data is accessible to other Smart View providers (e.g. Planning, HFM, DM)
Future P6 Analytics
Copyright © 2013, Oracle and/or its affiliates. All rights reserved.45
P6 Analytics 3.3Target: CY2014
Planned Features
g
P6 Analytics Cloud Service offering: Subscription-based
S t d ith i Supported with upcoming Primavera P6 EPPM Cloud Service offering
Same features as on-premiseR IT hi Removes IT ownership
Number of default OBI .rpd code and UDFs increased
Copyright © 2013, Oracle and/or its affiliates. All rights reserved.46
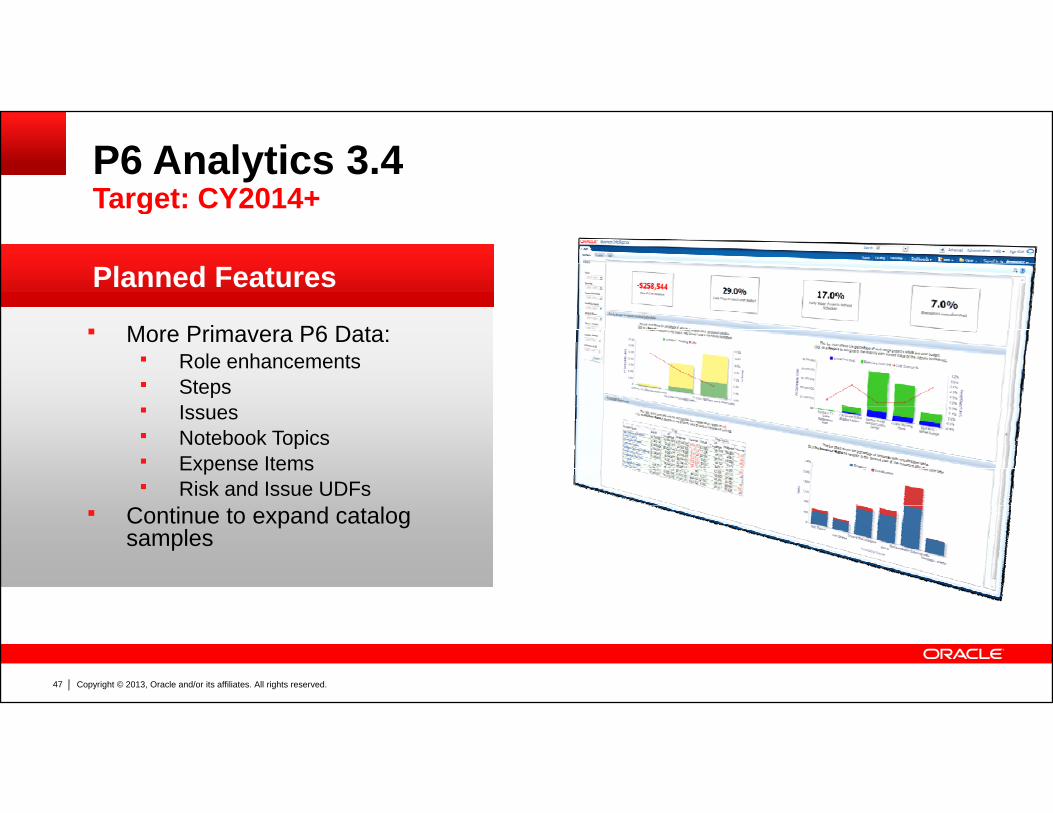
P6 Analytics 3.4Target: CY2014+
Planned Features
g
More Primavera P6 Data: Role enhancements Steps
I Issues Notebook Topics Expense Items Risk and Issue UDFs
Continue to expand catalog samples
Copyright © 2013, Oracle and/or its affiliates. All rights reserved.47
Primavera P6 Analytics InformationUseful links on the web
P6 Analytics overview:
Useful links on the web……
P6 Analytics overview: – http://www.oracle.com/us/products/applications/primavera/p6-
analytics/overview/index.html Additional resources:Additional resources:
– http://www.oracle.com/us/products/applications/primavera/p6-analytics/resources/index.html
Product documentation: Product documentation:– http://www.oracle.com/technetwork/documentation/default-1555811.html
P6 Analytics blog:
Copyright © 2013, Oracle and/or its affiliates. All rights reserved.48
– https://blogs.oracle.com/P6Analytics/
Copyright © 2013, Oracle and/or its affiliates. All rights reserved.49
APPENDIXAPPENDIX
Copyright © 2013, Oracle and/or its affiliates. All rights reserved.50
Out of the Box D hb d dDashboard and Subject Area Details
Copyright © 2013, Oracle and/or its affiliates. All rights reserved.51
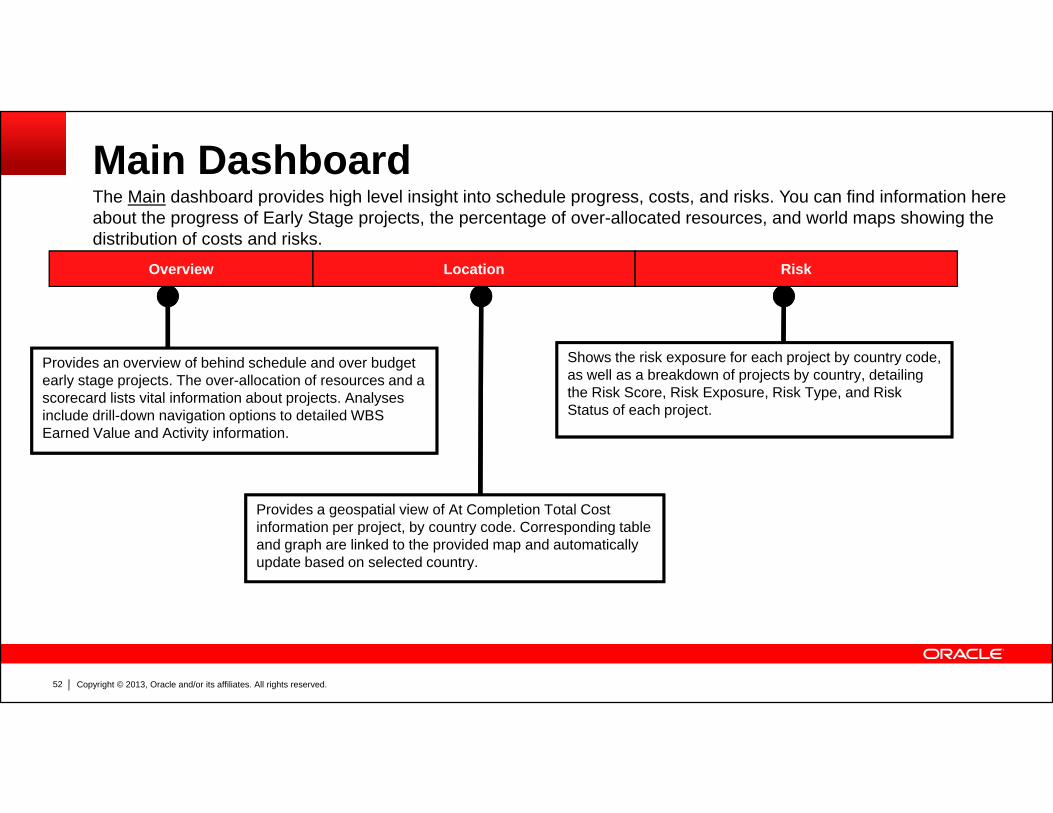
Main DashboardThe Main dashboard provides high level insight into schedule progress, costs, and risks. You can find information here about the progress of Early Stage projects, the percentage of over-allocated resources, and world maps showing the distribution of costs and risks.
Overview Location Risk
Provides an overview of behind schedule and over budget early stage projects. The over-allocation of resources and a scorecard lists vital information about projects. Analyses
Shows the risk exposure for each project by country code, as well as a breakdown of projects by country, detailing the Risk Score, Risk Exposure, Risk Type, and Risk St t f h j tinclude drill-down navigation options to detailed WBS
Earned Value and Activity information.Status of each project.
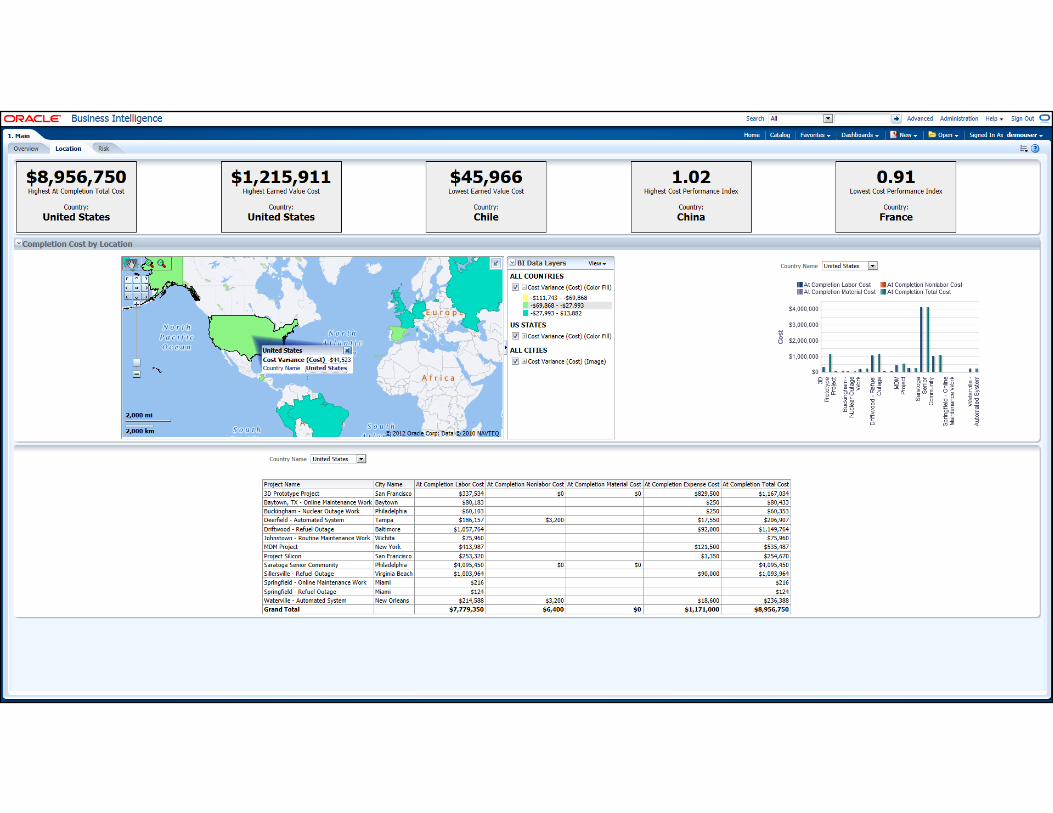
P id ti l i f At C l ti T t l C tProvides a geospatial view of At Completion Total Cost information per project, by country code. Corresponding table and graph are linked to the provided map and automatically update based on selected country.
Copyright © 2013, Oracle and/or its affiliates. All rights reserved.52
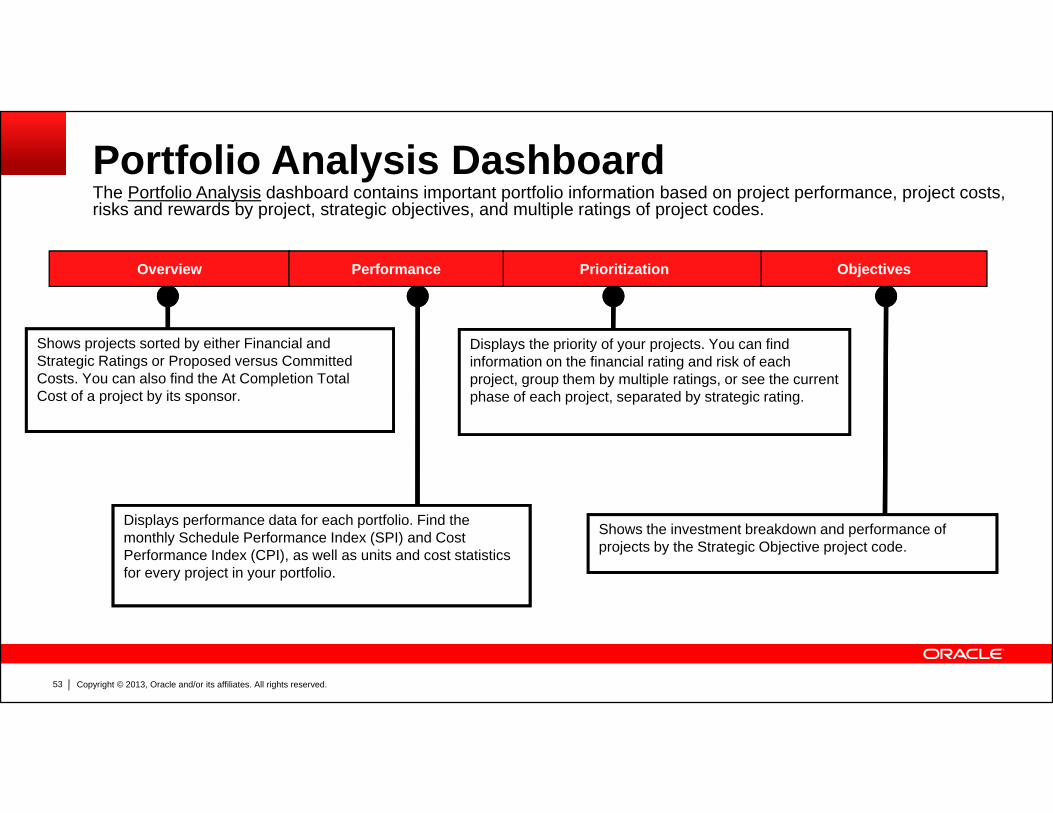
Portfolio Analysis DashboardThe Portfolio Analysis dashboard contains important portfolio information based on project performance, project costs, risks and rewards by project strategic objectives and multiple ratings of project codesrisks and rewards by project, strategic objectives, and multiple ratings of project codes.
Overview Performance Prioritization Objectives
Shows projects sorted by either Financial and Strategic Ratings or Proposed versus Committed Costs. You can also find the At Completion Total Cost of a project by its sponsor.
Displays the priority of your projects. You can find information on the financial rating and risk of each project, group them by multiple ratings, or see the current phase of each project, separated by strategic rating.
Shows the investment breakdown and performance of projects by the Strategic Objective project code.
Displays performance data for each portfolio. Find the monthly Schedule Performance Index (SPI) and Cost Performance Index (CPI), as well as units and cost statistics for every project in your portfolio.
Copyright © 2013, Oracle and/or its affiliates. All rights reserved.53
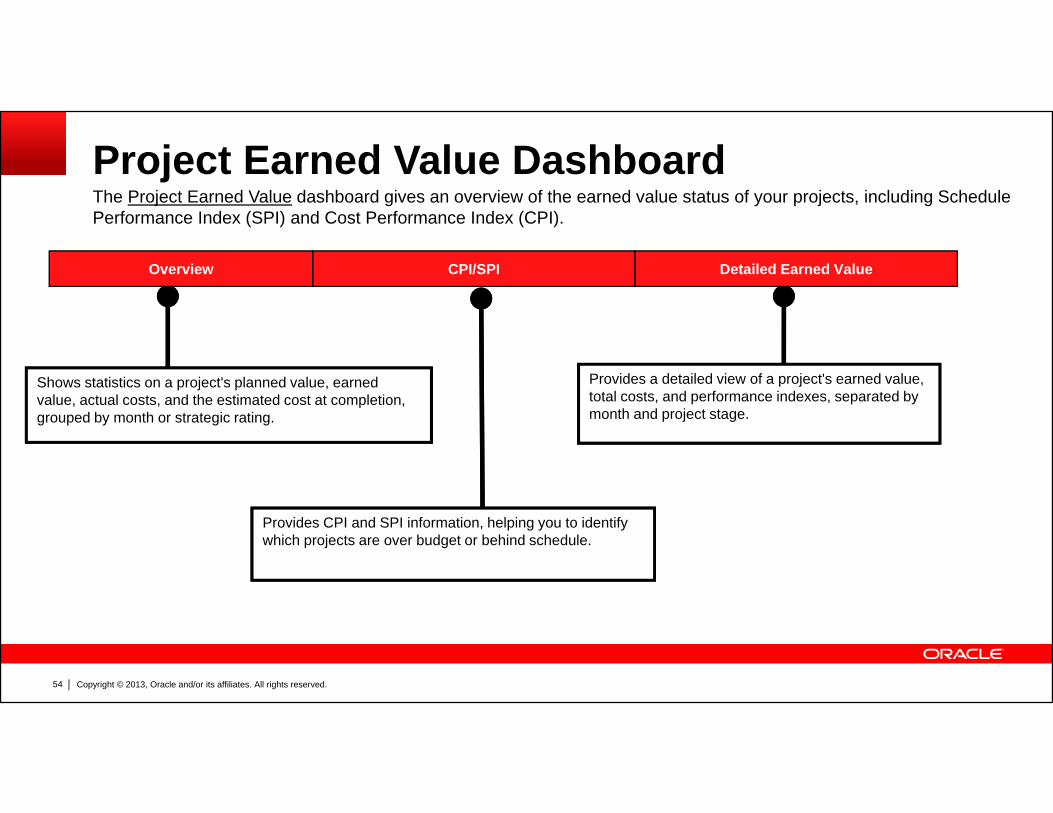
Project Earned Value DashboardThe Project Earned Value dashboard gives an overview of the earned value status of your projects, including Schedule Performance Index (SPI) and Cost Performance Index (CPI).
Overview CPI/SPI Detailed Earned Value
Shows statistics on a project's planned value, earned value, actual costs, and the estimated cost at completion,
Provides a detailed view of a project's earned value, total costs, and performance indexes, separated by , , p ,
grouped by month or strategic rating. month and project stage.
Provides CPI and SPI information, helping you to identify which projects are over budget or behind schedule.
Copyright © 2013, Oracle and/or its affiliates. All rights reserved.54
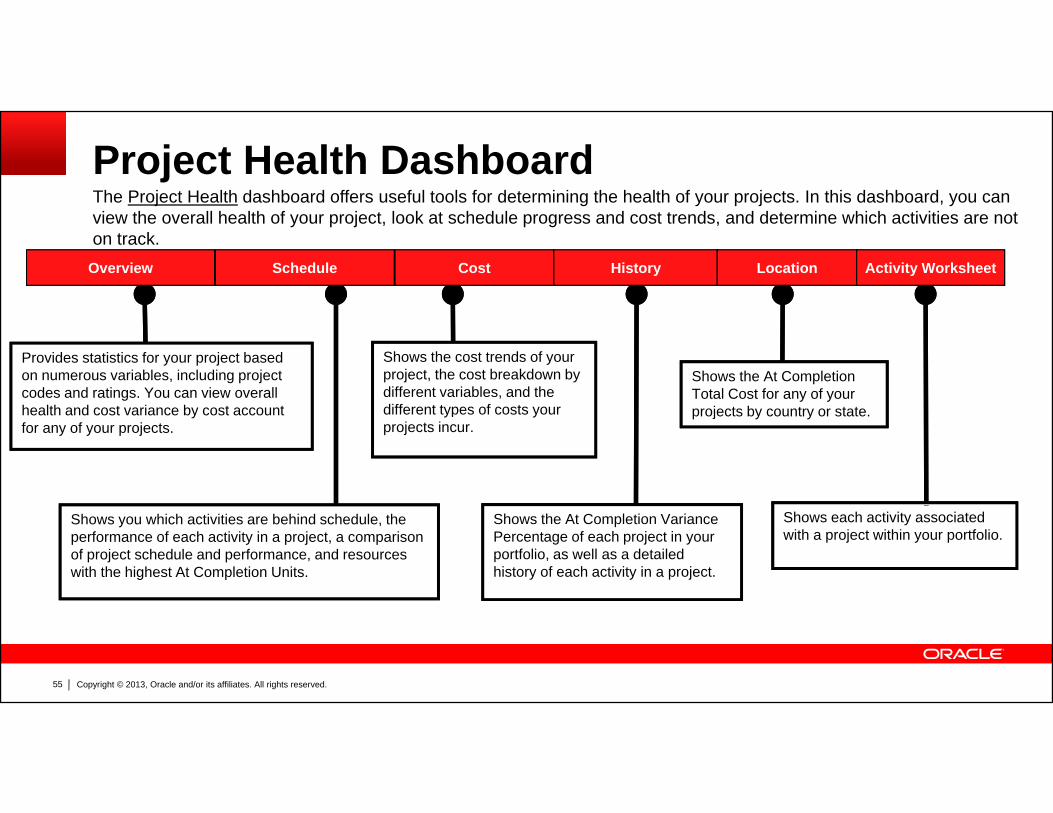
Project Health DashboardThe Project Health dashboard offers useful tools for determining the health of your projects. In this dashboard, you can view the overall health of your project, look at schedule progress and cost trends, and determine which activities are not on track.
Overview Schedule Cost History Location Activity Worksheet
Provides statistics for your project based on numerous variables, including project codes and ratings. You can view overall h lth d t i b t t
Shows the cost trends of your project, the cost breakdown by different variables, and the different t pes of costs o r
Shows the At Completion Total Cost for any of your
j t b t t thealth and cost variance by cost account for any of your projects.
different types of costs your projects incur.
projects by country or state.
Shows you which activities are behind schedule, the performance of each activity in a project, a comparison of project schedule and performance, and resources with the highest At Completion Units.
Shows the At Completion Variance Percentage of each project in your portfolio, as well as a detailed history of each activity in a project.
Shows each activity associated with a project within your portfolio.
Copyright © 2013, Oracle and/or its affiliates. All rights reserved.55
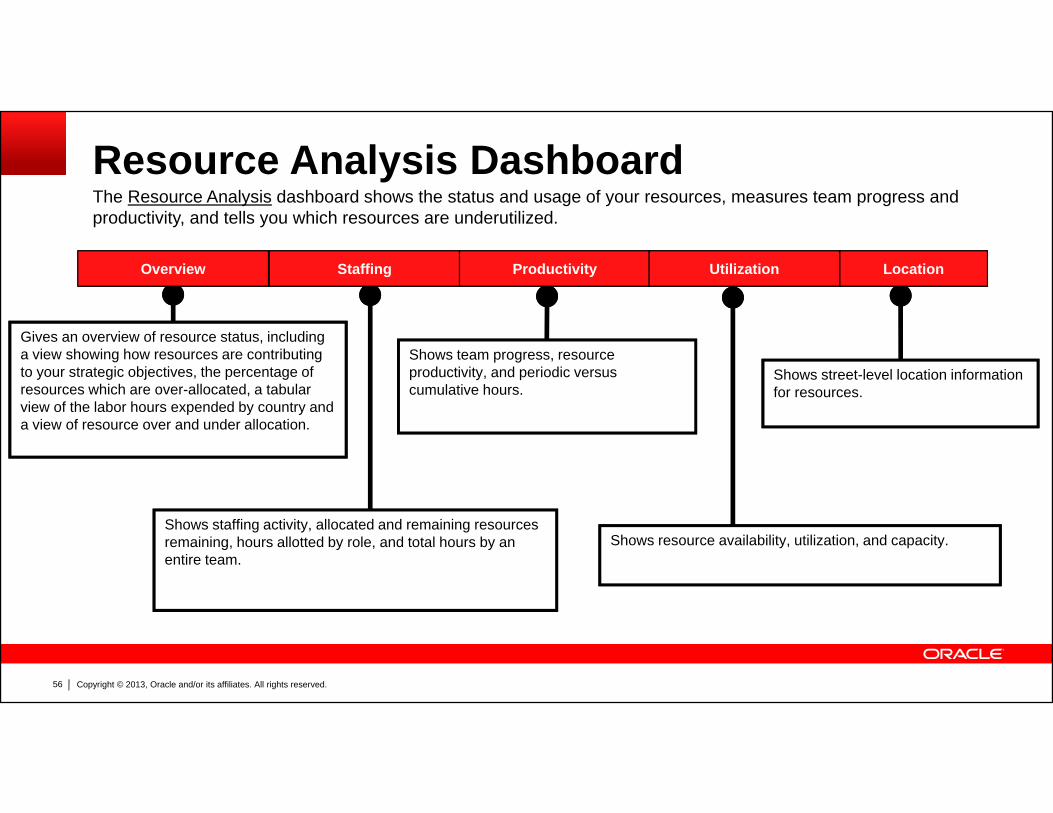
Resource Analysis DashboardThe Resource Analysis dashboard shows the status and usage of your resources, measures team progress and productivity, and tells you which resources are underutilized.
Overview Staffing Productivity Utilization Location
Gives an overview of resource status, including a view showing how resources are contributing to your strategic objectives, the percentage of resources which are over-allocated, a tabular view of the labor hours expended by country and
Shows team progress, resource productivity, and periodic versus cumulative hours.
Shows street-level location information for resources.
view of the labor hours expended by country and a view of resource over and under allocation.
Shows staffing activity, allocated and remaining resources remaining, hours allotted by role, and total hours by an entire team.
Shows resource availability, utilization, and capacity.
Copyright © 2013, Oracle and/or its affiliates. All rights reserved.56
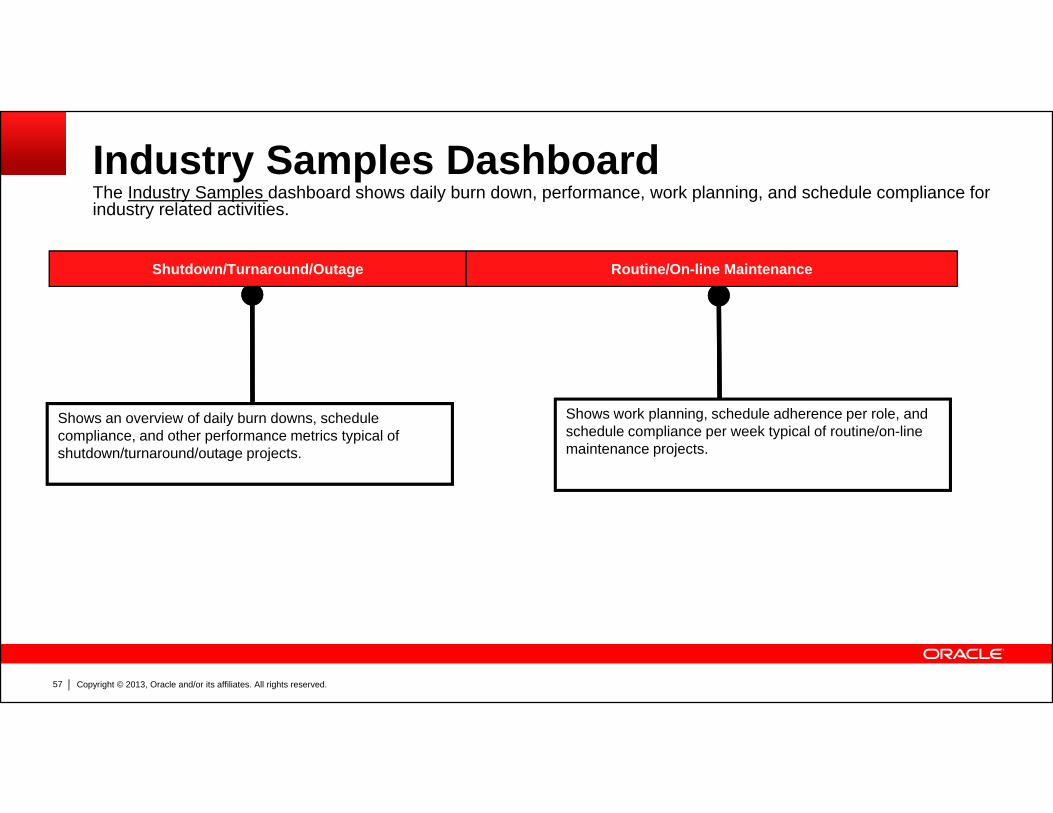
Industry Samples DashboardThe Industry Samples dashboard shows daily burn down, performance, work planning, and schedule compliance for industry related activitiesindustry related activities.
Shutdown/Turnaround/Outage Routine/On-line Maintenance
Shows an overview of daily burn downs, schedule compliance, and other performance metrics typical of shutdown/turnaround/outage projects.
Shows work planning, schedule adherence per role, and schedule compliance per week typical of routine/on-line maintenance projects.
Copyright © 2013, Oracle and/or its affiliates. All rights reserved.57
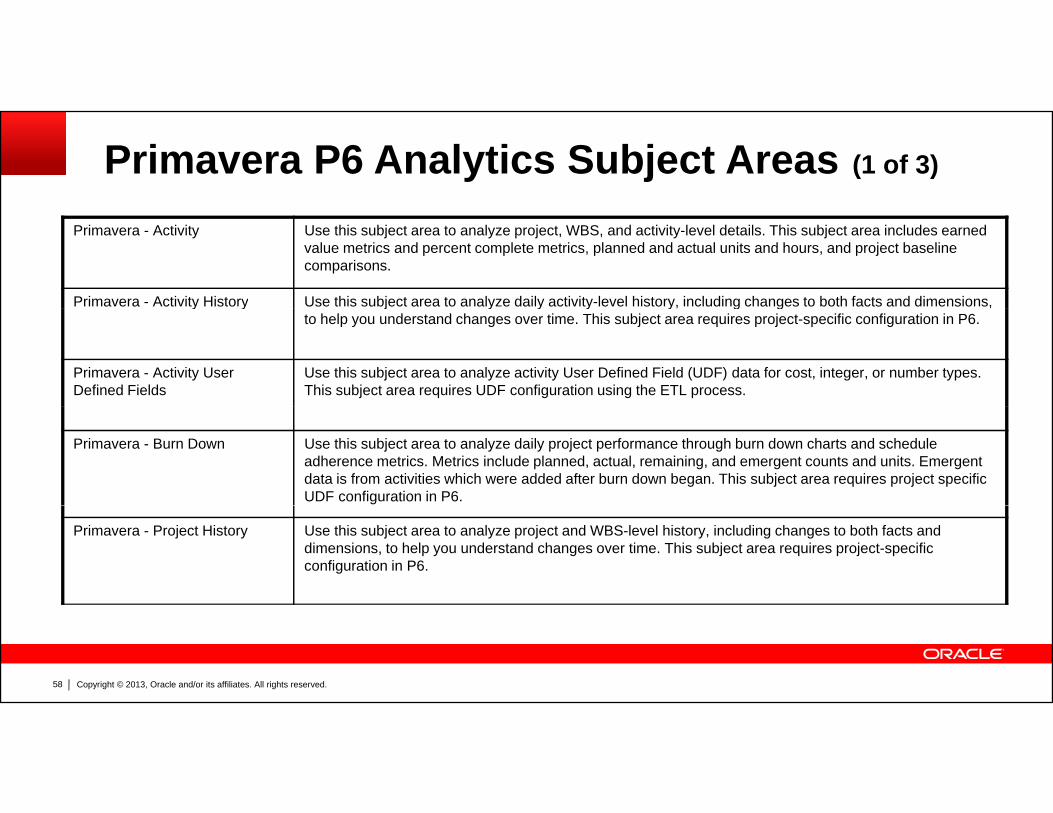
Primavera P6 Analytics Subject Areas (1 of 3)
Primavera - Activity Use this subject area to analyze project, WBS, and activity-level details. This subject area includes earned value metrics and percent complete metrics, planned and actual units and hours, and project baseline comparisons.
Primavera - Activity History Use this subject area to analyze daily activity-level history, including changes to both facts and dimensions, y y j y y y y, g g ,to help you understand changes over time. This subject area requires project-specific configuration in P6.
Primavera - Activity User Defined Fields
Use this subject area to analyze activity User Defined Field (UDF) data for cost, integer, or number types. This subject area requires UDF configuration using the ETL process.
Primavera - Burn Down Use this subject area to analyze daily project performance through burn down charts and schedule adherence metrics. Metrics include planned, actual, remaining, and emergent counts and units. Emergent data is from activities which were added after burn down began. This subject area requires project specific UDF configuration in P6.
Primavera - Project History Use this subject area to analyze project and WBS-level history, including changes to both facts and dimensions, to help you understand changes over time. This subject area requires project-specific configuration in P6.
Copyright © 2013, Oracle and/or its affiliates. All rights reserved.58
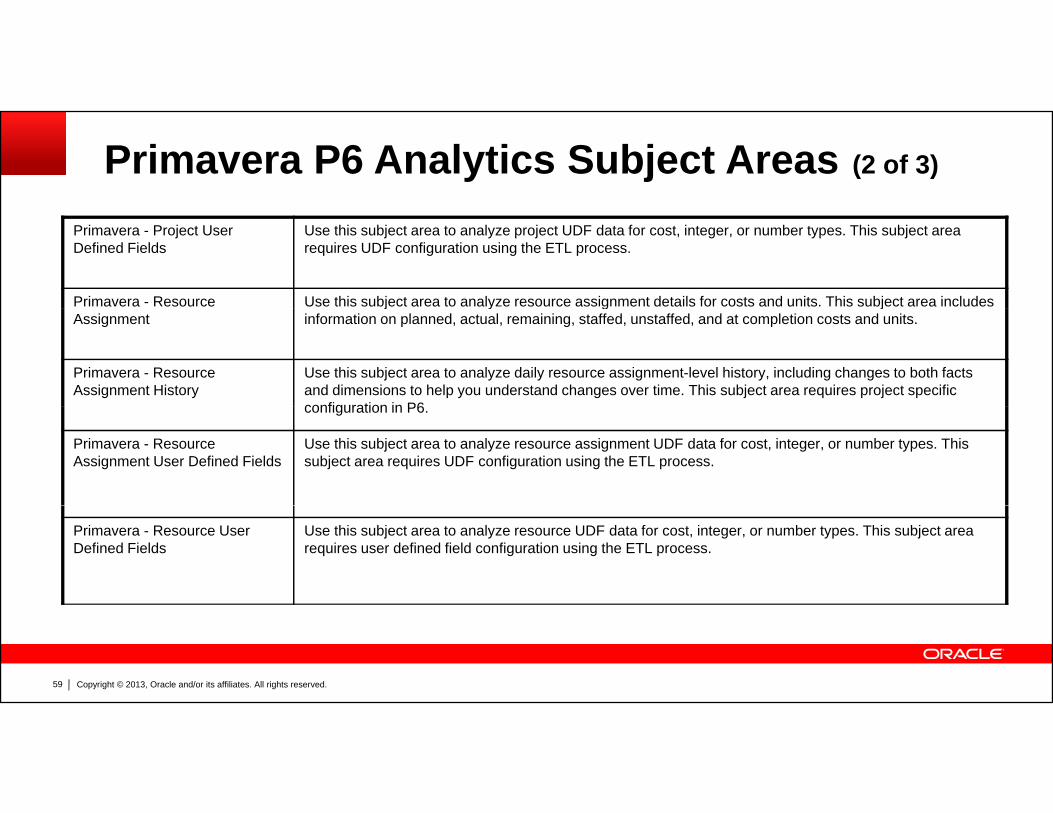
Primavera P6 Analytics Subject Areas (2 of 3)
Primavera - Project User Defined Fields
Use this subject area to analyze project UDF data for cost, integer, or number types. This subject area requires UDF configuration using the ETL process.
Primavera - Resource Use this subject area to analyze resource assignment details for costs and units. This subject area includes Assignment
j y g jinformation on planned, actual, remaining, staffed, unstaffed, and at completion costs and units.
Primavera - Resource Assignment History
Use this subject area to analyze daily resource assignment-level history, including changes to both facts and dimensions to help you understand changes over time. This subject area requires project specific configuration in P6configuration in P6.
Primavera - Resource Assignment User Defined Fields
Use this subject area to analyze resource assignment UDF data for cost, integer, or number types. This subject area requires UDF configuration using the ETL process.
Primavera - Resource User Defined Fields
Use this subject area to analyze resource UDF data for cost, integer, or number types. This subject area requires user defined field configuration using the ETL process.
Copyright © 2013, Oracle and/or its affiliates. All rights reserved.59
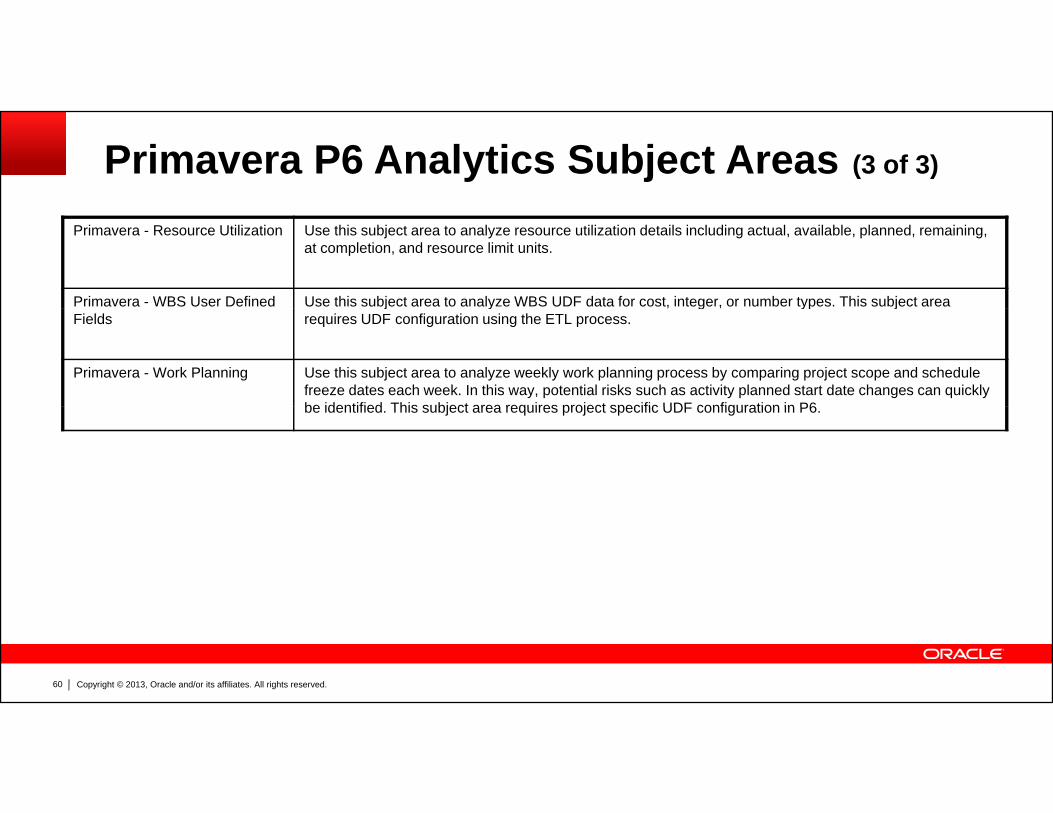
Primavera P6 Analytics Subject Areas (3 of 3)
Primavera - Resource Utilization Use this subject area to analyze resource utilization details including actual, available, planned, remaining, at completion, and resource limit units.
Primavera - WBS User Defined Use this subject area to analyze WBS UDF data for cost, integer, or number types. This subject area Fields
j y , g , yp jrequires UDF configuration using the ETL process.
Primavera - Work Planning Use this subject area to analyze weekly work planning process by comparing project scope and schedule freeze dates each week. In this way, potential risks such as activity planned start date changes can quickly be identified This subject area requires project specific UDF configuration in P6be identified. This subject area requires project specific UDF configuration in P6.
Copyright © 2013, Oracle and/or its affiliates. All rights reserved.60
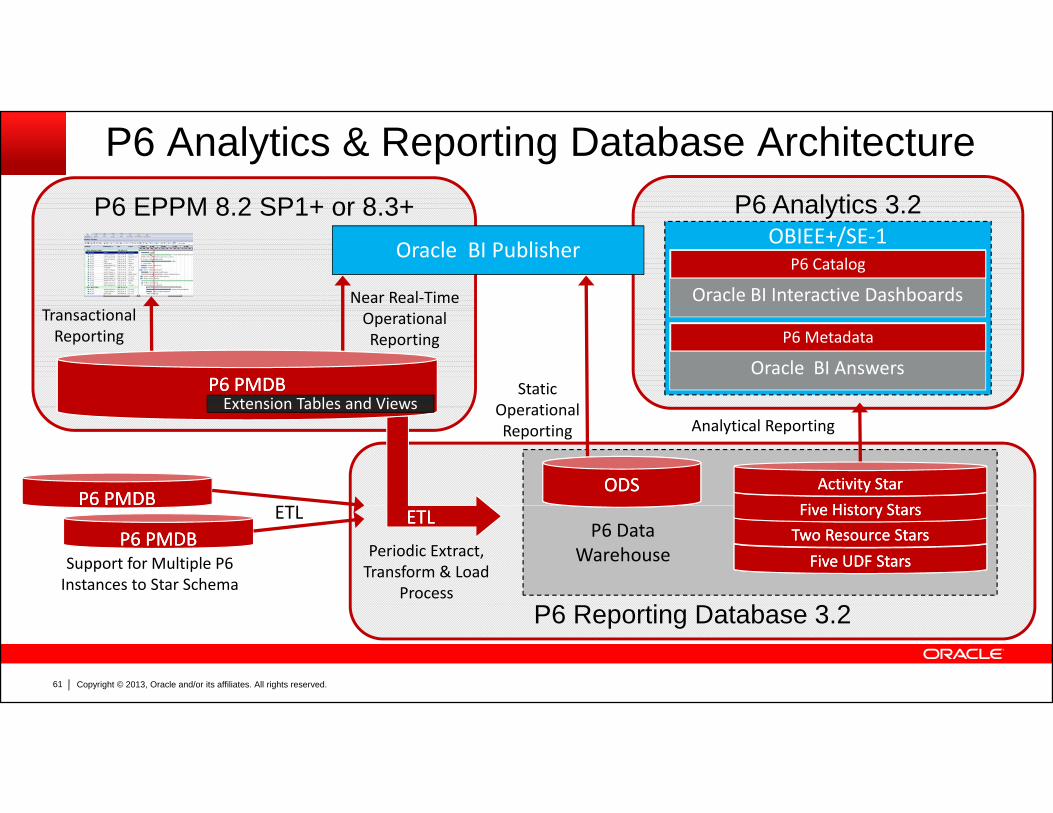
P6 Analytics 3 2P6 EPPM 8 2 SP1+ or 8 3+
P6 Analytics & Reporting Database ArchitectureP6 Analytics 3.2P6 EPPM 8.2 SP1+ or 8.3+
OBIEE+/SE‐1
Oracle BI Interactive DashboardsP6 Catalog
Oracle BI Publisher
Near Real‐Time
Oracle BI AnswersP6 Metadata
Operational Reporting
Transactional Reporting
StaticO ti l
P6 PMDBP6 PMDBExtension Tables and Views Operational
Reporting Analytical Reporting
ODSODS
Extension Tables and Views
Fi Hi t StFi Hi t StActivity StarActivity Star
P6 PMDBP6 PMDBETLETL
Periodic Extract, Transform & Load
Process
Five UDF StarsFive UDF StarsTwo Resource StarsTwo Resource StarsFive History StarsFive History Stars
P6 PMDBP6 PMDB P6 Data WarehouseSupport for Multiple P6
Instances to Star Schema
ETL
Copyright © 2013, Oracle and/or its affiliates. All rights reserved.61
P6 Reporting Database 3.2
Copyright © 2013, Oracle and/or its affiliates. All rights reserved.62

Copyright © 2013, Oracle and/or its affiliates. All rights reserved.63