Embed Size (px)
Citation preview
Please cite this paper as:
Gönenç, R. et al. (2014), “Fostering Inclusive Growth inTurkey by Promoting Structural Change in the BusinessSector”, OECD Economics Department Working Papers,No. 1161, OECD Publishing.http://dx.doi.org/10.1787/5jxx0554v07c-en
OECD Economics Department WorkingPapers No. 1161
Fostering Inclusive Growthin Turkey by PromotingStructural Change in theBusiness Sector
Rauf Gönenç, Oliver Röhn,Vincent Koen, Fethi Öğünç
JEL Classification: J2, J3, O1, O4, O5
Unclassified ECO/WKP(2014)57 Organisation de Coopération et de Développement Économiques Organisation for Economic Co-operation and Development 16-Sep-2014 ___________________________________________________________________________________________
English - Or. English ECONOMICS DEPARTMENT
FOSTERING INCLUSIVE GROWTH IN TURKEY BY PROMOTING STRUCTURAL CHANGE IN THE BUSINESS SECTOR ECONOMICS DEPARTMENT WORKING PAPERS No. 1161
By Rauf Gönenç, Oliver Röhn, Vincent Koen and Fethi Öğünç
OECD Working Papers should not be reported as representing the official views of the OECD or its member countries. The opinions expressed and arguments employed are those of the author(s). Authorised for publication by Alvaro Pereira, Director, Country Studies Branch, Economics Department.
All OECD Economics Department Working Papers are available through OECD's Internet website at www.oecd.org/eco/workingpapers
JT03362019
Complete document available on OLIS in its original format This document and any map included herein are without prejudice to the status of or sovereignty over any territory, to the delimitation of
international frontiers and boundaries and to the name of any territory, city or area.
EC
O/W
KP
(2014)57 U
nclassified
En
glish - O
r. En
glish
ECO/WKP(2014)57
2
OECD Working Papers should not be reported as representing the official views of the OECD or of its member countries. The opinions expressed and arguments employed are those of the author(s).
Working Papers describe preliminary results or research in progress by the author(s) and are published to stimulate discussion on a broad range of issues on which the OECD works.
Comments on Working Papers are welcomed, and may be sent to the Economics Department, OECD, 2 rue André-Pascal, 75775 Paris Cedex 16, France, or by e-mail to [email protected].
This document and any map included herein are without prejudice to the status of or sovereignty over any territory, to the delimitation of international frontiers and boundaries and to the name of any territory, city or area.
The statistical data for Israel are supplied by and under the responsibility of the relevant Israeli authorities. The use of such data by the OECD is without prejudice to the status of the Golan Heights, East Jerusalem and Israeli settlements in the West Bank under the terms of international law.
© OECD (2014)
You can copy, download or print OECD content for your own use, and you can include excerpts from OECD publications, databases and multimedia products in your own documents, presentations, blogs, websites and teaching materials, provided that suitable acknowledgment of OECD as source and copyright owner is given. All requests for commercial use and translation rights should be submitted to [email protected]
ECO/WKP(2014)57
3
Abstract/Résumé
Fostering inclusive growth in Turkey by promoting structural change in the business sector
Turkey’s business sector dynamism has underpinned broad-based and inclusive growth in the 2000s. However, the business sector is highly segmented, with a relatively small core of modern high-productivity corporations, and myriad small, less formal and low-productivity entities. This hampers efficient resource allocation and tends to entrench social inequalities. It also makes it difficult to build on-the-job human capital for the large number of low-skilled. This segmentation needs to be overcome to raise productivity in the informal, low-skill and low-productivity sector, and to facilitate resource transfers from low to higher productivity businesses. This ought to be achieved by aligning Turkey’s formal regulatory and tax framework with OECD best practice, rather than through “second-best” arrangements where non-compliance with rules co-exists with selective subsidies to parts of the formal sector. Labour market and business taxation reforms are particularly important to enable all categories of enterprises to operate flexibly on a rule-based, level playing field and to achieve productivity enhancing and socially inclusive restructuring.
This Working Paper relates to the 2014 OECD Economic Review of Turkey (www.oecd.org/eco/surveys/economic-survey-turkey.htm).
JEL classification codes: J2; J3; O1;O4; O5 Keywords: Turkey, growth, productivity, structural change, taxation, labour markets, informality.
Promouvoir une croissance inclusive en Turquie en favorisant des évolutions structurelles dans le secteur des entreprises
Pendant les années 2000, le dynamisme du secteur des entreprises a alimenté une croissance inclusive reposant sur une large assise. Cependant, il s’agit d’un secteur fortement segmenté, où coexistent un noyau relativement restreint d’entreprises modernes, très productives, et une myriade de petites entreprises moins formelles et à faible productivité. Cette dualité empêche une affectation efficiente des ressources et a tendance à figer les inégalités sociales. Elle rend également difficile la constitution de capital humain sur leur lieu de travail pour les nombreuses personnes faiblement qualifiées. Il faut dépasser cette segmentation afin de relever la productivité dans le secteur informel où le niveau de la productivité et des qualifications est bas, et faciliter les transferts de ressources des secteurs à faible productivité vers ceux où elle est plus élevée. Pour ce faire il conviendrait d’aligner le cadre réglementaire et fiscal formel sur les meilleures pratiques de l'OCDE plutôt que de tolérer le non-respect de la réglementation tout en octroyant des subventions sélectives à certains segments du secteur formel. Il est particulièrement important de réformer le marché du travail et le système d’imposition pour permettre à toutes les catégories d’entreprises de travailler de manière flexible, au sein d’un environnement fondé sur le respect de règles applicables à tous, et d’opérer une restructuration propre à favoriser l’amélioration de la productivité et la cohésion sociale.
Ce Document de travail se rapporte à l’Étude économique de l’OCDE de la Turquie 2014 (www.oecd.org/fr/eco/etudes/turquie.htm).
Classification JEL: J2; J3; O1;O4; O5 Mots clefs: Turquie, croissance, productivité, changement structurel, marché de travail, informalité
ECO/WKP(2014)57
4
TABLE OF CONTENTS
FOSTERING INCLUSIVE GROWTH IN TURKEY BY PROMOTING STRUCTURAL CHANGE IN THE BUSINESS SECTOR ............................................................................................................................ 5
Inclusive growth has been driven by thriving business enterprises throughout the country ....................... 5
Large inequalities persist, rooted in uneven labour market conditions ..................................................... 10
The business sector is highly segmented ............................................................................................... 10
Fragmentation causes diverging income and human capital development among workers .................. 20
Making it easier for higher-quality businesses to flourish ........................................................................ 22
Empirical evidence ................................................................................................................................ 23
Policy requirements for future structural upgrading .............................................................................. 27
BIBLIOGRAPHY ......................................................................................................................................... 38
Tables 1. A taxonomy of Turkish businesses ....................................................................................................... 14
2. Recent growth of credit to SMEs .......................................................................................................... 15
3. Transitions to higher labour market status have been relatively rare .................................................... 21
4. Within and between productivity gains in a fixed panel of firms ......................................................... 26
5. Formal sector firms are more dynamic .................................................................................................. 26
6. Tax and regulatory disincentives to enterprise growth.......................................................................... 29
Figures 1. Inclusive growth ...................................................................................................................................... 6
2. Broad based employment growth has driven convergence ..................................................................... 7
3. Small and medium sized enterprises have been the main engines of growth .......................................... 8
4. Job creation has been particularly dynamic for heretofore less active groups ........................................ 9
5. Employers, own-account workers and salaried employees: international comparison ......................... 10
6. Turkey has a segmented business sector, with apparent size thresholds ............................................... 11
7. Firms of different sizes differ sharply in formality and productivity .................................................... 12
8. Productivity gaps between small and large firms are wide ................................................................... 13
9. Entrepreneurial medium-sized firms face funding bottlenecks ............................................................. 16
10. Foreign direct investment is limited .................................................................................................... 19
11. Breadwinners' labour market experience varies across groups ........................................................... 20
12. Regional income differences continue to reflect large gaps in employment and productivity ........... 22
13. Resource allocation has improved but there is ample room for further progress ................................ 24
14. High unit labour costs encourage informality ..................................................................................... 30
15. Social safety nets can be broadened substantially ............................................................................... 33
Boxes Box 1. The activation of low-skilled women .............................................................................................. 9
Box 2. Financial bottlenecks of medium-sized businesses and “participation finance” ........................... 15
Box 3. FDI firms have a limited presence in Turkey’s business sector .................................................... 19
Box 4. Insights from recent research on structural change and productivity growth in the business sector22
Box 5. KOSGEB’s SME support programmes ......................................................................................... 27
Box 6. Local policies for structural change: Konya’s experience ............................................................. 27
Box 7 The National Employment Strategy ............................................................................................... 31
Box 8. Recommendations to foster strong and inclusive growth by promoting structural change in the business sector ........................................................................................................................................... 37
ECO/WKP(2014)57
5
FOSTERING INCLUSIVE GROWTH IN TURKEY BY PROMOTING STRUCTURAL CHANGE IN THE BUSINESS SECTOR
By
Rauf Gönenç, Oliver Röhn, Vincent Koen and Fethi Öğünç1
Inclusive growth has been driven by thriving business enterprises throughout the country
Broad-based business sector development coupled with social transfers have helped make growth more inclusive during the 2000s (Şeker and Jenkins, 2013; Taskın, 2014). Up to 2007, income distribution improved and poverty diminished, as did material deprivation in both urban and rural areas (Azevedo and Atamanov, 2014). Some of the progress achieved was reversed in the crisis year 2009 but improvements resumed in subsequent years (OECD, 2013; Turkstat, 2014) (Figure 1).2
The main driver of these gains was the rapid pace of job creation throughout the country, which was also backed by productivity gains. Steady employment growth in industry and services, including in rural areas previously devoid of industrial activity, has been crucial. As documented in the 2012 OECD Economic Survey of Turkey, this has been more pronounced in the so-called “Anatolian Tiger” regions than in the “Developed West”.3 As income inequality in Turkey traditionally stemmed mainly from the labour market, reflecting wide wage dispersion coupled with a low employment rate (Hoeller et al., 2013), broad-based employment creation made a decisive difference and promoted social inclusion (Figure 2).
1 The authors work in the Economics department. This paper was prepared for the OECD Economic Survey
of Turkey published in July 2014 under the authority of the Economic and Development Review Committee. It has benefitted from background research by Evren Erdoğan Coşar and inputs by Faruk Aydin and Temel Taşkin. The authors thank Alvaro Pereira, Robert Ford, Dan Andrews, Herwig Immerwoll, Chiara Criscuolo, Romina Boarini and Pierre Leblanc for their valuable comments. Special thanks are due to Béatrice Guérard for statistical assistance and to Nadine Dufour and Mercedes Burgos for technical preparation.
2. Turkey’s income distribution remains highly unequal compared to other OECD countries (OECD, 2013e). The elderly poverty rate increased from 14% to 18% between 2007 and 2010 and the youth poverty rate from 12% to 17%. However, “direct poverty” – defined as lack of access to basic nutrition, clothing and heating – declined from 29% to 21% between 2006 and 2010 (Gürsel, 2013). Azevedo and Atamanaov (2014) also found that between 2002 and 2011, extreme poverty in Turkey fell from 13 to 5%, while moderate poverty halved from 44 to 22% (defined respectively by using the World Bank's regional poverty lines of 2.5 and 5 USD/PPP). Most of this poverty reduction was driven by growth.
3. Anatolian Tiger regions, as identified in OECD Surveys, include five NUTS 2 regions: TR32- Aydin, Denizli, Mugla; TR52- Konya, Karaman; TR63- Hatay, Kahramanmaras, Osmaniye; TR72- Kayseri, Sivas, Yozgat; TRC1- Gaziantep, Adiyaman, Kilis. Developed West regions include nine NUTS 2 regions: TR10-Istanbul; TR21-Tekirdag, Edirne, Kirklareli; TR22-Balikesir, Canakkale; TR31-Izmir; TR33-Manisa, Afyonkarahisar, Kutahya, Usak; TR41-Bursa, Eskisehir, Bilecik; TR42-Kocaeli, Sakarya, Duzce, Bolu, Yalova; TR51-Ankara; TR61-Antalya, Isparta, Burdur.
ECO/WKP(2014)57
6
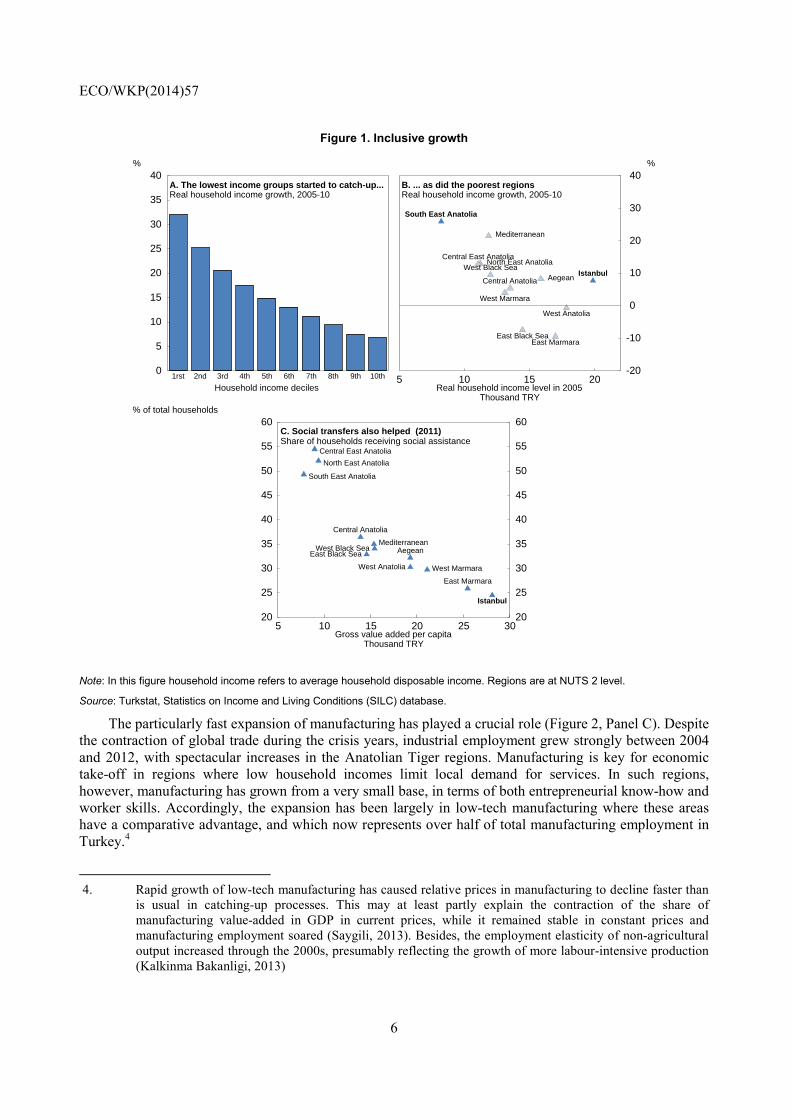
Figure 1. Inclusive growth
Note: In this figure household income refers to average household disposable income. Regions are at NUTS 2 level.
Source: Turkstat, Statistics on Income and Living Conditions (SILC) database.
The particularly fast expansion of manufacturing has played a crucial role (Figure 2, Panel C). Despite the contraction of global trade during the crisis years, industrial employment grew strongly between 2004 and 2012, with spectacular increases in the Anatolian Tiger regions. Manufacturing is key for economic take-off in regions where low household incomes limit local demand for services. In such regions, however, manufacturing has grown from a very small base, in terms of both entrepreneurial know-how and worker skills. Accordingly, the expansion has been largely in low-tech manufacturing where these areas have a comparative advantage, and which now represents over half of total manufacturing employment in Turkey.4
4. Rapid growth of low-tech manufacturing has caused relative prices in manufacturing to decline faster than
is usual in catching-up processes. This may at least partly explain the contraction of the share of manufacturing value-added in GDP in current prices, while it remained stable in constant prices and manufacturing employment soared (Saygili, 2013). Besides, the employment elasticity of non-agricultural output increased through the 2000s, presumably reflecting the growth of more labour-intensive production (Kalkinma Bakanligi, 2013)
0
5
10
15
20
25
30
35
40 %
A. The lowest income groups started to catch-up... Real household income growth, 2005-10
Household income deciles1rst 2nd 3rd 4th 5th 6th 7th 8th 9th 10th 5 10 15 20
-20
-10
0
10
20
30
40 %
B. ... as did the poorest regions Real household income growth, 2005-10
Real household income level in 2005 Thousand TRY
South East Anatolia
Mediterranean
North East AnatoliaCentral East Anatolia
West Black SeaAegean
IstanbulCentral Anatolia
West Marmara
West Anatolia
East Black SeaEast Marmara
5 10 15 20 25 3020
25
30
35
40
45
50
55
60 % of total households
20
25
30
35
40
45
50
55
60 C. Social transfers also helped (2011) Share of households receiving social assistance
Gross value added per capita Thousand TRY
Istanbul
West Marmara
Aegean
East Marmara
West Anatolia
Mediterranean
Central Anatolia
West Black SeaEast Black Sea
North East Anatolia
Central East Anatolia
South East Anatolia
ECO/WKP(2014)57
7
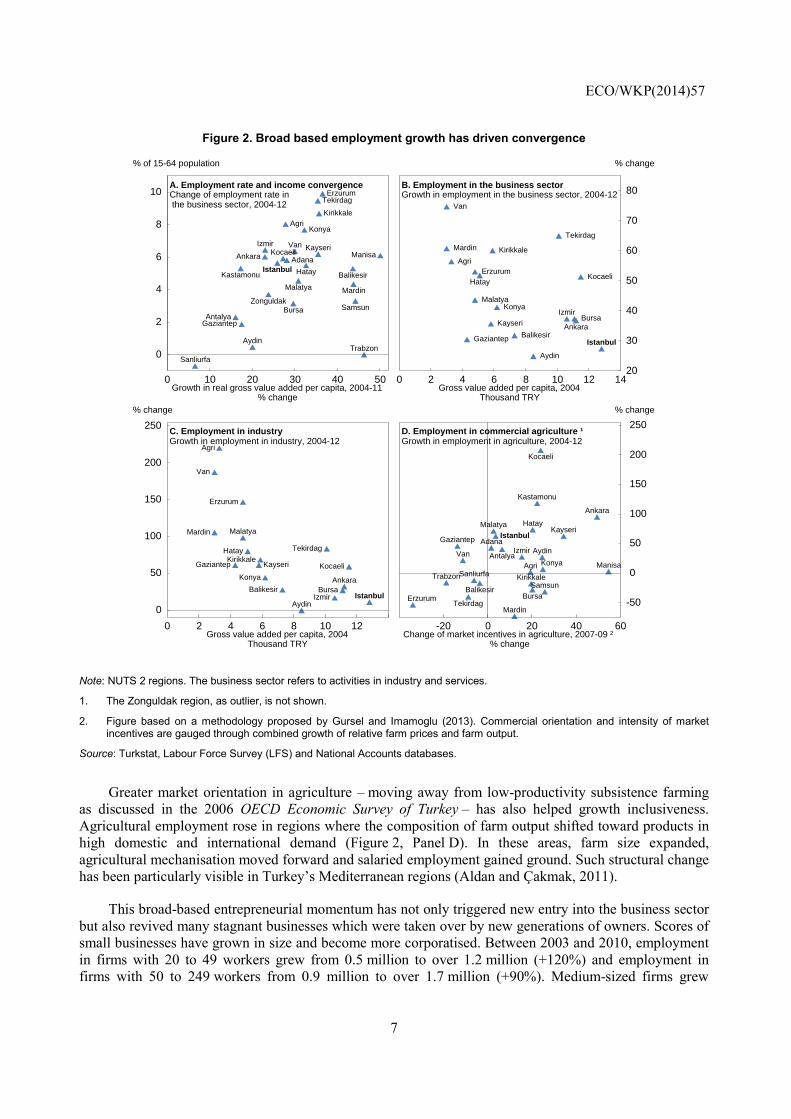
Figure 2. Broad based employment growth has driven convergence
Note: NUTS 2 regions. The business sector refers to activities in industry and services.
1. The Zonguldak region, as outlier, is not shown.
2. Figure based on a methodology proposed by Gursel and Imamoglu (2013). Commercial orientation and intensity of market incentives are gauged through combined growth of relative farm prices and farm output.
Source: Turkstat, Labour Force Survey (LFS) and National Accounts databases.
Greater market orientation in agriculture – moving away from low-productivity subsistence farming as discussed in the 2006 OECD Economic Survey of Turkey – has also helped growth inclusiveness. Agricultural employment rose in regions where the composition of farm output shifted toward products in high domestic and international demand (Figure 2, Panel D). In these areas, farm size expanded, agricultural mechanisation moved forward and salaried employment gained ground. Such structural change has been particularly visible in Turkey’s Mediterranean regions (Aldan and Çakmak, 2011).
This broad-based entrepreneurial momentum has not only triggered new entry into the business sector but also revived many stagnant businesses which were taken over by new generations of owners. Scores of small businesses have grown in size and become more corporatised. Between 2003 and 2010, employment in firms with 20 to 49 workers grew from 0.5 million to over 1.2 million (+120%) and employment in firms with 50 to 249 workers from 0.9 million to over 1.7 million (+90%). Medium-sized firms grew
0 10 20 30 40 50
0
2
4
6
8
10
% of 15-64 population
A. Employment rate and income convergence Change of employment rate in the business sector, 2004-12
Growth in real gross value added per capita, 2004-11 % change
ErzurumTekirdag
KirikkaleAgri
Konya
Izmir Van KayseriAnkara Kocaeli
Istanbul Hatay Balikesir
Malatya Mardin
Bursa
Gaziantep
Aydin
ManisaAdana
Kastamonu
ZonguldakSamsun
Antalya
Trabzon
Sanliurfa
0 2 4 6 8 10 12 1420
30
40
50
60
70
80
% change
B. Employment in the business sector Growth in employment in the business sector, 2004-12
Gross value added per capita, 2004 Thousand TRY
Van
Mardin Kirikkale
Konya
Kayseri
ErzurumHatay
Gaziantep
Malatya
Agri
Istanbul
Tekirdag
Kocaeli
Ankara
IzmirBursa
Balikesir
Aydin
0 2 4 6 8 10 12
0
50
100
150
200
250
% change
C. Employment in industry Growth in employment in industry, 2004-12
Gross value added per capita, 2004 Thousand TRY
Van
Mardin
Kirikkale
Konya
Kayseri
Erzurum
Hatay
Gaziantep
Malatya
Agri
Istanbul
Tekirdag
Kocaeli
Ankara
IzmirBursaBalikesir
Aydin
-20 0 20 40 60
-50
0
50
100
150
200
250
% change
D. Employment in commercial agriculture ¹ Growth in employment in agriculture, 2004-12
Change of market incentives in agriculture, 2007-09 ² % change
Istanbul
Tekirdag
Balikesir
Izmir Aydin
Manisa
Bursa
Kocaeli
Ankara
KonyaAntalya
Adana
Hatay
Kirikkale
Kayseri
Kastamonu
SamsunTrabzon
Erzurum
Agri
Malatya
Van
Gaziantep
Sanliurfa
Mardin
ECO/WKP(2014)57
8
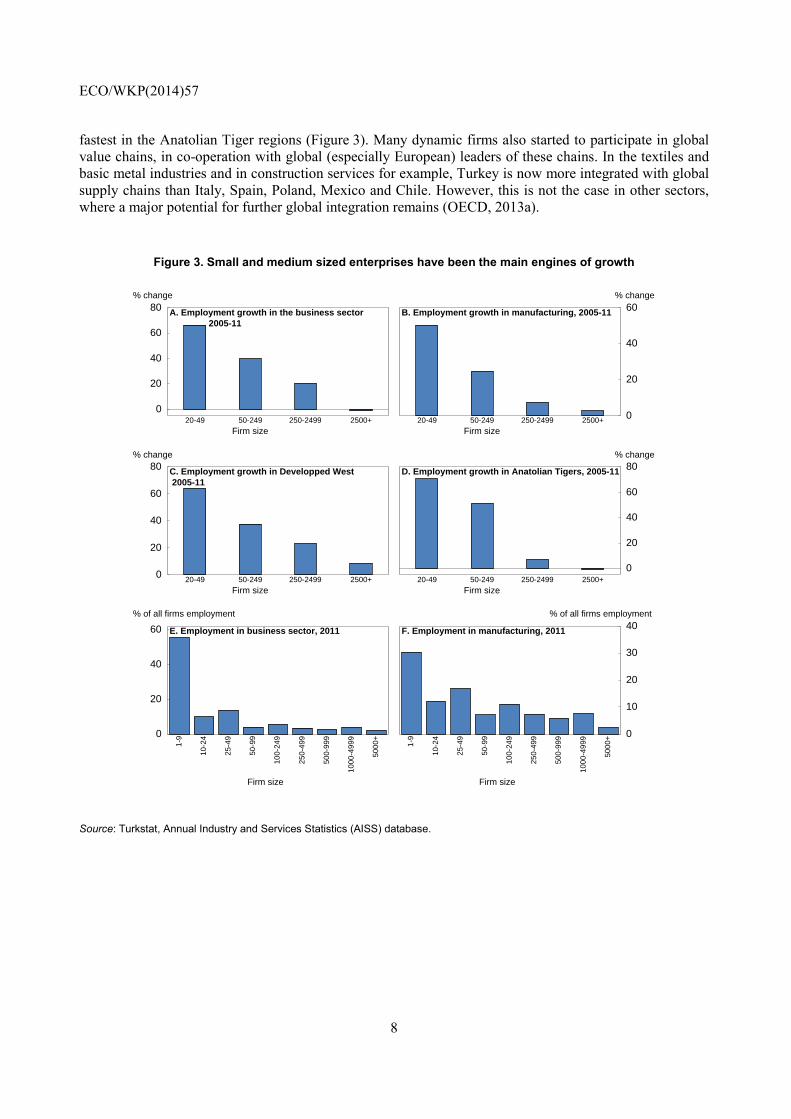
fastest in the Anatolian Tiger regions (Figure 3). Many dynamic firms also started to participate in global value chains, in co-operation with global (especially European) leaders of these chains. In the textiles and basic metal industries and in construction services for example, Turkey is now more integrated with global supply chains than Italy, Spain, Poland, Mexico and Chile. However, this is not the case in other sectors, where a major potential for further global integration remains (OECD, 2013a).
Figure 3. Small and medium sized enterprises have been the main engines of growth
Source: Turkstat, Annual Industry and Services Statistics (AISS) database.
0
20
40
60
80 % change
A. Employment growth in the business sector 2005-11
Firm size20-49 50-249 250-2499 2500+ 0
20
40
60 % change
B. Employment growth in manufacturing, 2005-11
Firm size20-49 50-249 250-2499 2500+
0
20
40
60
80 % change
C. Employment growth in Developped West 2005-11
Firm size20-49 50-249 250-2499 2500+
0
20
40
60
80 % change
D. Employment growth in Anatolian Tigers, 2005-11
Firm size20-49 50-249 250-2499 2500+
0
20
40
60
% of all firms employment
E. Employment in business sector, 2011
Firm size
1-9
10-
24
25-
49
50-9
9
100-
249
250-
499
500-
999
1000
-499
9
5000
+ 0
10
20
30
40 % of all firms employment
F. Employment in manufacturing, 2011
Firm size
1-9
10-
24
25-
49
50-9
9
100-
249
250-
499
500-
999
1000
-499
9
5000
+
ECO/WKP(2014)57
9
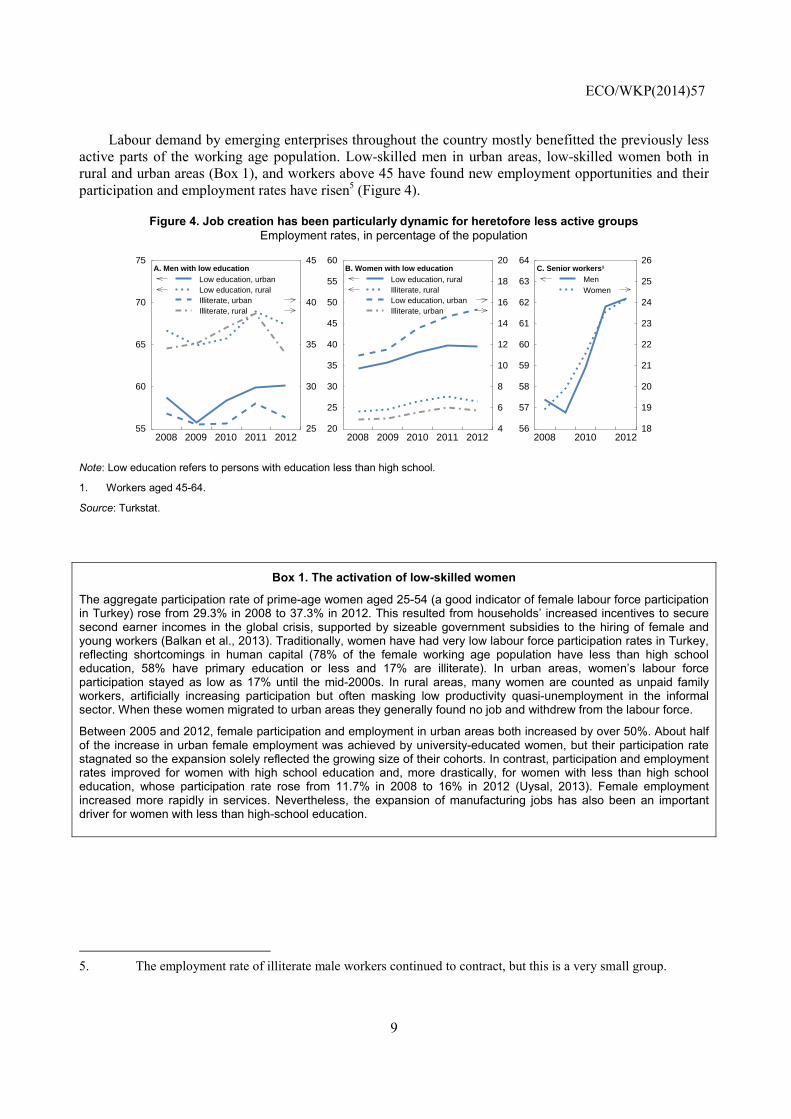
Labour demand by emerging enterprises throughout the country mostly benefitted the previously less active parts of the working age population. Low-skilled men in urban areas, low-skilled women both in rural and urban areas (Box 1), and workers above 45 have found new employment opportunities and their participation and employment rates have risen5 (Figure 4).
Figure 4. Job creation has been particularly dynamic for heretofore less active groups
Employment rates, in percentage of the population
Note: Low education refers to persons with education less than high school.
1. Workers aged 45-64.
Source: Turkstat.
Box 1. The activation of low-skilled women
The aggregate participation rate of prime-age women aged 25-54 (a good indicator of female labour force participation in Turkey) rose from 29.3% in 2008 to 37.3% in 2012. This resulted from households’ increased incentives to secure second earner incomes in the global crisis, supported by sizeable government subsidies to the hiring of female and young workers (Balkan et al., 2013). Traditionally, women have had very low labour force participation rates in Turkey, reflecting shortcomings in human capital (78% of the female working age population have less than high school education, 58% have primary education or less and 17% are illiterate). In urban areas, women’s labour force participation stayed as low as 17% until the mid-2000s. In rural areas, many women are counted as unpaid family workers, artificially increasing participation but often masking low productivity quasi-unemployment in the informal sector. When these women migrated to urban areas they generally found no job and withdrew from the labour force.
Between 2005 and 2012, female participation and employment in urban areas both increased by over 50%. About half of the increase in urban female employment was achieved by university-educated women, but their participation rate stagnated so the expansion solely reflected the growing size of their cohorts. In contrast, participation and employment rates improved for women with high school education and, more drastically, for women with less than high school education, whose participation rate rose from 11.7% in 2008 to 16% in 2012 (Uysal, 2013). Female employment increased more rapidly in services. Nevertheless, the expansion of manufacturing jobs has also been an important driver for women with less than high-school education.
5. The employment rate of illiterate male workers continued to contract, but this is a very small group.
2008 2009 2010 2011 201255
60
65
70
75
25
30
35
40
45 A. Men with low education
Low education, urbanLow education, ruralIlliterate, urbanIlliterate, rural
2008 2009 2010 2011 201220
25
30
35
40
45
50
55
60
4
6
8
10
12
14
16
18
20 B. Women with low education
Low education, ruralIlliterate, ruralLow education, urbanIlliterate, urban
2008 2010 201256
57
58
59
60
61
62
63
64
18
19
20
21
22
23
24
25
26 C. Senior workers¹
MenWomen
ECO/WKP(2014)57
10
Low-income groups’ higher employment rates enabled many households to gain access to bank credit. After the global crisis credit grew most rapidly for low-income groups and in low-income regions. The macroeconomic strains created by the resulting contraction in household saving rates are discussed in Röhn et al. (2014).
Social transfers also played a new role (Yentürk, 2013; Alper, 2014). They encompass a wide range of cash and in-kind benefits from a variety of institutions (including the central government, municipalities, official foundations and private charities). Public social service and aid expenditures increased from 0.9% of GDP in 2006 to 1.3% in 2012. They include transfers to poor households, non-contributory pensions and health support to the non-insured. A new Ministry of Family and Social Policies was created in 2011 to more centrally manage these programmes.
Data on all social transfers at general government level, including local and municipal aid, is currently not available in aggregate form, but these policies seem to have helped reduce the incidence of absolute poverty. For households with unemployed breadwinners, the group most at risk, “material deprivation” (defined as lack of access to basic goods) declined from 30% to 20% in Western regions between 2006 and 2010, and from 40% to 25% in the Eastern regions (Finn et al., 2013). These transfers will however need to be better targeted in the future, to improve recipients’ work incentives and capacities as recently emphasised by policymakers (Yazici, 2014; Tuna, 2014).
Large inequalities persist, rooted in uneven labour market conditions
The business sector is highly segmented
Despite strong growth in the 2000s, Turkey’s business sector has remained highly fragmented and its productivity performance uneven. This has kept worker incomes, job quality and human capital on diverging paths. Sustaining inclusive growth will require overcoming this segmentation, accelerating the creation of high-productivity workplaces and promoting better jobs.
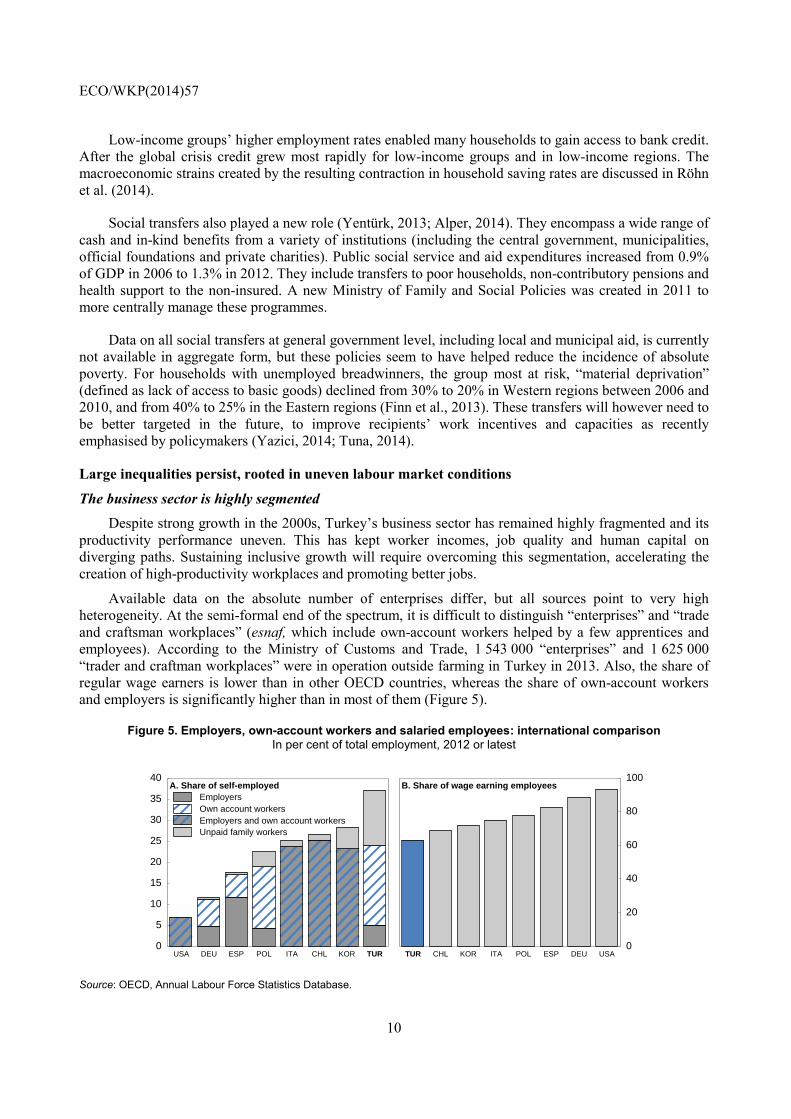
Available data on the absolute number of enterprises differ, but all sources point to very high heterogeneity. At the semi-formal end of the spectrum, it is difficult to distinguish “enterprises” and “trade and craftsman workplaces” (esnaf, which include own-account workers helped by a few apprentices and employees). According to the Ministry of Customs and Trade, 1 543 000 “enterprises” and 1 625 000 “trader and craftman workplaces” were in operation outside farming in Turkey in 2013. Also, the share of regular wage earners is lower than in other OECD countries, whereas the share of own-account workers and employers is significantly higher than in most of them (Figure 5).
Figure 5. Employers, own-account workers and salaried employees: international comparison In per cent of total employment, 2012 or latest
Source: OECD, Annual Labour Force Statistics Database.
0
5
10
15
20
25
30
35
40 A. Share of self-employed
USA DEU ESP POL ITA CHL KOR TUR
EmployersOwn account workersEmployers and own account workersUnpaid family workers
0
20
40
60
80
100 B. Share of wage earning employees
TUR CHL KOR ITA POL ESP DEU USA
ECO/WKP(2014)57
11
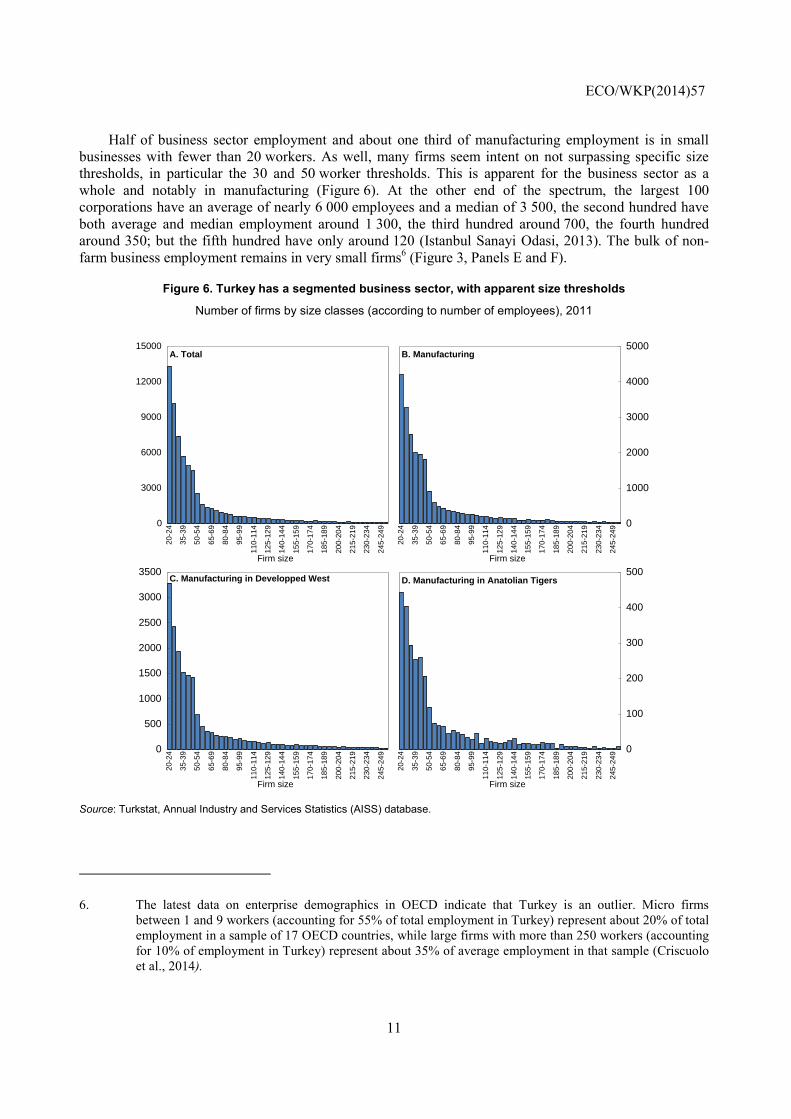
Half of business sector employment and about one third of manufacturing employment is in small businesses with fewer than 20 workers. As well, many firms seem intent on not surpassing specific size thresholds, in particular the 30 and 50 worker thresholds. This is apparent for the business sector as a whole and notably in manufacturing (Figure 6). At the other end of the spectrum, the largest 100 corporations have an average of nearly 6 000 employees and a median of 3 500, the second hundred have both average and median employment around 1 300, the third hundred around 700, the fourth hundred around 350; but the fifth hundred have only around 120 (Istanbul Sanayi Odasi, 2013). The bulk of non-farm business employment remains in very small firms6 (Figure 3, Panels E and F).
Figure 6. Turkey has a segmented business sector, with apparent size thresholds
Number of firms by size classes (according to number of employees), 2011
Source: Turkstat, Annual Industry and Services Statistics (AISS) database.
6. The latest data on enterprise demographics in OECD indicate that Turkey is an outlier. Micro firms between 1 and 9 workers (accounting for 55% of total employment in Turkey) represent about 20% of total employment in a sample of 17 OECD countries, while large firms with more than 250 workers (accounting for 10% of employment in Turkey) represent about 35% of average employment in that sample (Criscuolo et al., 2014).
0
3000
6000
9000
12000
15000 A. Total
Firm size
20-2
4
35-3
9
50-5
4
65-6
9
80-8
4
95-9
9
110-
114
125-
129
140-
144
155-
159
170-
174
185-
189
200-
204
215-
219
230-
234
245-
249 0
1000
2000
3000
4000
5000 B. Manufacturing
Firm size
20-2
4
35-3
9
50-5
4
65-6
9
80-8
4
95-9
9
110-
114
125-
129
140-
144
155-
159
170-
174
185-
189
200-
204
215-
219
230-
234
245-
249
0
500
1000
1500
2000
2500
3000
3500 C. Manufacturing in Developped West
Firm size
20-2
4
35-3
9
50-5
4
65-6
9
80-8
4
95-9
9
110-
114
125-
129
140-
144
155-
159
170-
174
185-
189
200-
204
215-
219
230-
234
245-
249 0
100
200
300
400
500 D. Manufacturing in Anatolian Tigers
Firm size
20-2
4
35-3
9
50-5
4
65-6
9
80-8
4
95-9
9
110-
114
125-
129
140-
144
155-
159
170-
174
185-
189
200-
204
215-
219
230-
234
245-
249
ECO/WKP(2014)57
12
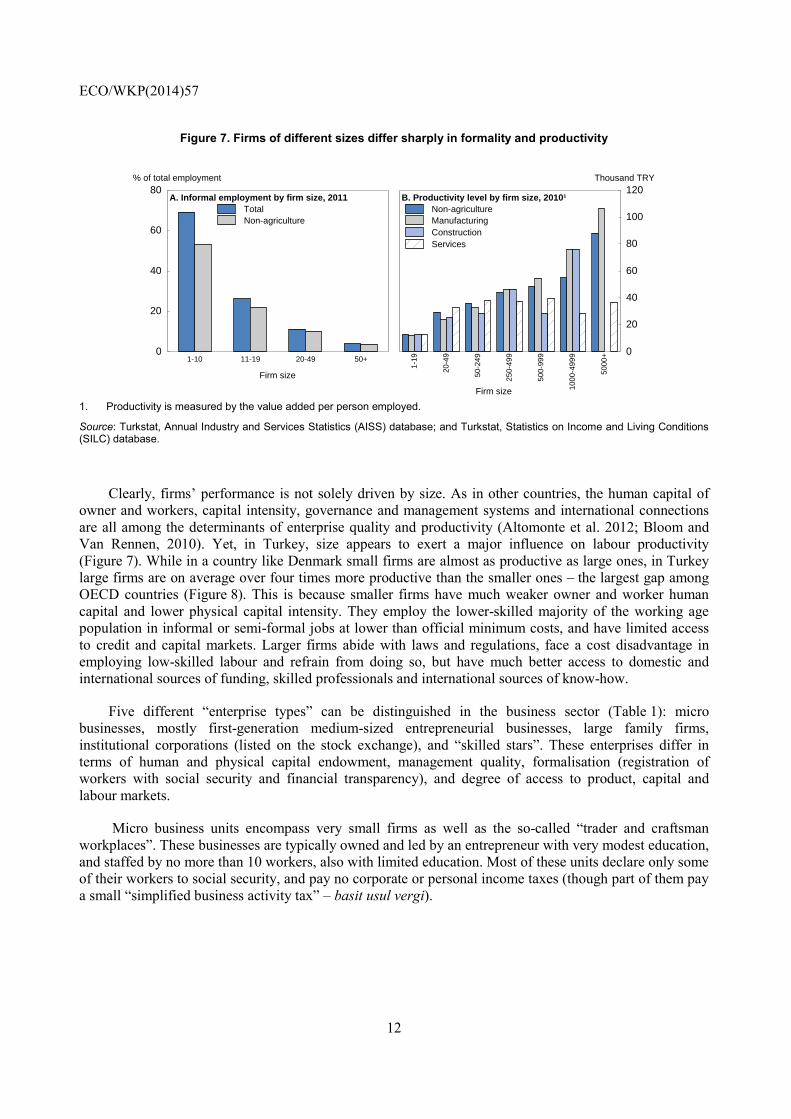
Figure 7. Firms of different sizes differ sharply in formality and productivity
1. Productivity is measured by the value added per person employed.
Source: Turkstat, Annual Industry and Services Statistics (AISS) database; and Turkstat, Statistics on Income and Living Conditions (SILC) database.
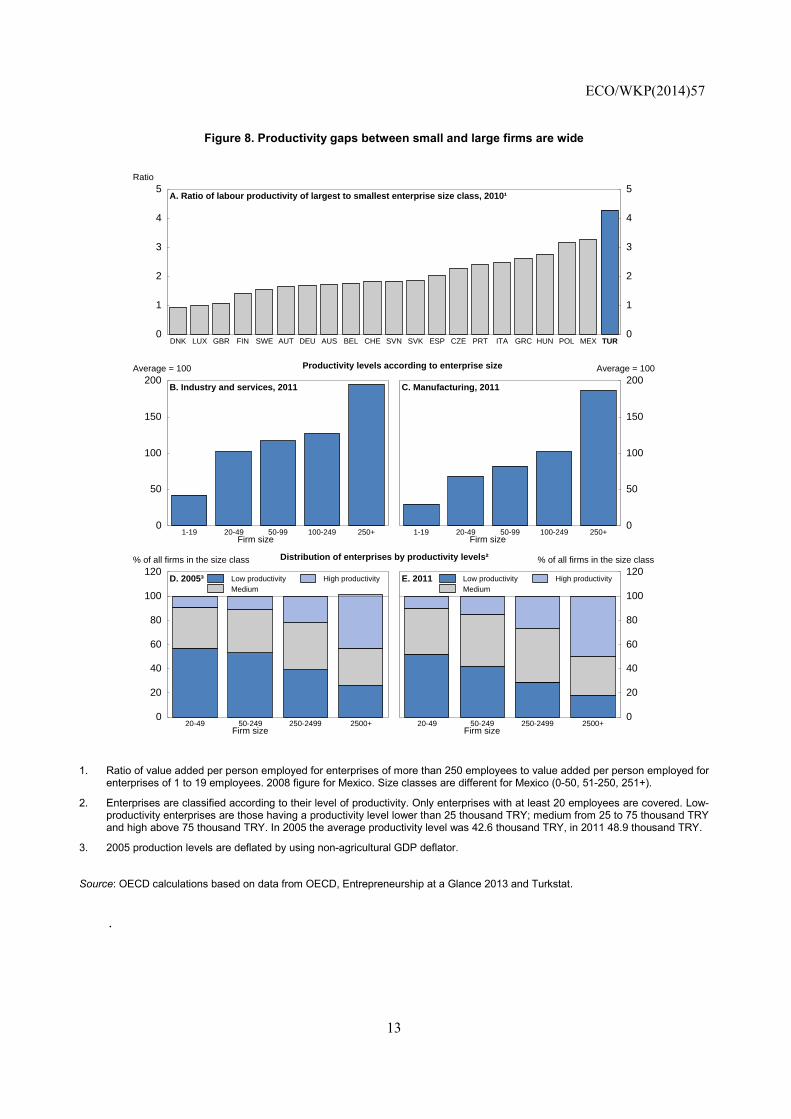
Clearly, firms’ performance is not solely driven by size. As in other countries, the human capital of owner and workers, capital intensity, governance and management systems and international connections are all among the determinants of enterprise quality and productivity (Altomonte et al. 2012; Bloom and Van Rennen, 2010). Yet, in Turkey, size appears to exert a major influence on labour productivity (Figure 7). While in a country like Denmark small firms are almost as productive as large ones, in Turkey large firms are on average over four times more productive than the smaller ones – the largest gap among OECD countries (Figure 8). This is because smaller firms have much weaker owner and worker human capital and lower physical capital intensity. They employ the lower-skilled majority of the working age population in informal or semi-formal jobs at lower than official minimum costs, and have limited access to credit and capital markets. Larger firms abide with laws and regulations, face a cost disadvantage in employing low-skilled labour and refrain from doing so, but have much better access to domestic and international sources of funding, skilled professionals and international sources of know-how.
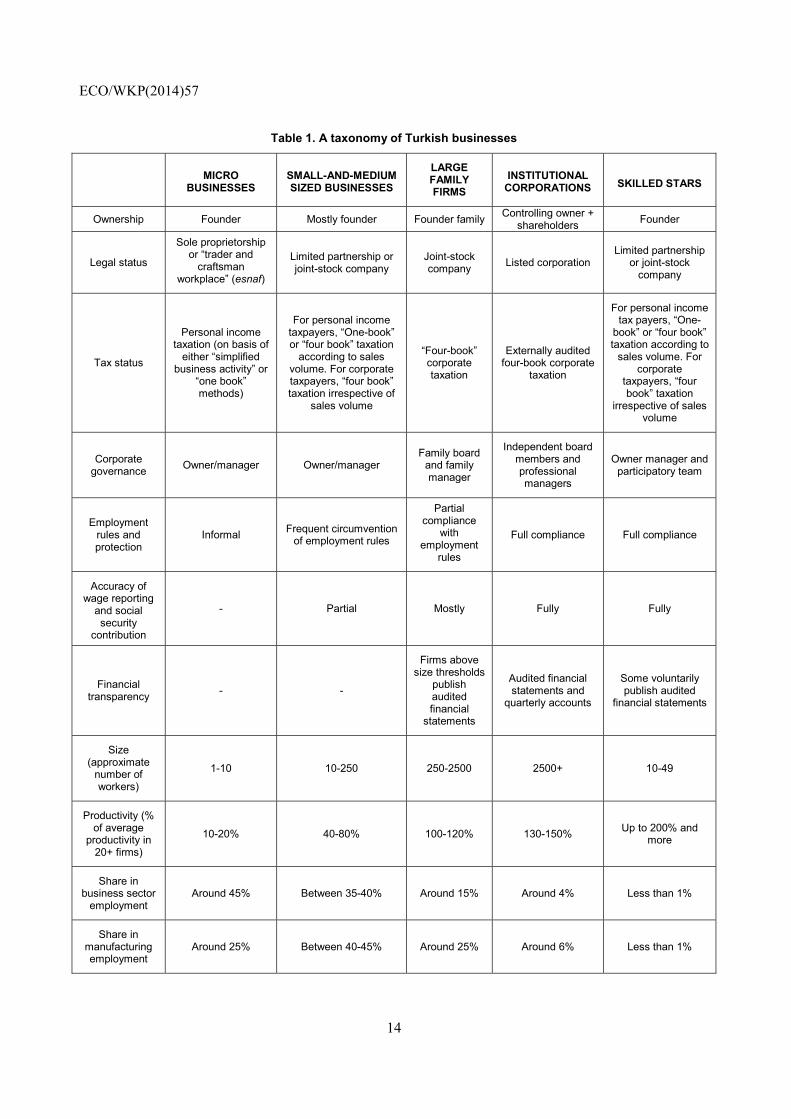
Five different “enterprise types” can be distinguished in the business sector (Table 1): micro businesses, mostly first-generation medium-sized entrepreneurial businesses, large family firms, institutional corporations (listed on the stock exchange), and “skilled stars”. These enterprises differ in terms of human and physical capital endowment, management quality, formalisation (registration of workers with social security and financial transparency), and degree of access to product, capital and labour markets.
Micro business units encompass very small firms as well as the so-called “trader and craftsman workplaces”. These businesses are typically owned and led by an entrepreneur with very modest education, and staffed by no more than 10 workers, also with limited education. Most of these units declare only some of their workers to social security, and pay no corporate or personal income taxes (though part of them pay a small “simplified business activity tax” – basit usul vergi).
0
20
40
60
80 % of total employment
A. Informal employment by firm size, 2011
Firm size
1-10 11-19 20-49 50+
TotalNon-agriculture
0
20
40
60
80
100
120 Thousand TRY
B. Productivity level by firm size, 2010¹
Firm size
1-19
20-4
9
50-2
49
250-
499
500-
999
1000
-499
9
5000
+
Non-agricultureManufacturingConstructionServices
ECO/WKP(2014)57
13
Figure 8. Productivity gaps between small and large firms are wide
1. Ratio of value added per person employed for enterprises of more than 250 employees to value added per person employed for enterprises of 1 to 19 employees. 2008 figure for Mexico. Size classes are different for Mexico (0-50, 51-250, 251+).
2. Enterprises are classified according to their level of productivity. Only enterprises with at least 20 employees are covered. Low-productivity enterprises are those having a productivity level lower than 25 thousand TRY; medium from 25 to 75 thousand TRY and high above 75 thousand TRY. In 2005 the average productivity level was 42.6 thousand TRY, in 2011 48.9 thousand TRY.
3. 2005 production levels are deflated by using non-agricultural GDP deflator.
Source: OECD calculations based on data from OECD, Entrepreneurship at a Glance 2013 and Turkstat.
.
0
1
2
3
4
5 Ratio
0
1
2
3
4
5 A. Ratio of labour productivity of largest to smallest enterprise size class, 2010¹
DNK LUX GBR FIN SWE AUT DEU AUS BEL CHE SVN SVK ESP CZE PRT ITA GRC HUN POL MEX TUR
0
50
100
150
200 Average = 100
Productivity levels according to enterprise size
B. Industry and services, 2011
Firm size1-19 20-49 50-99 100-249 250+
0
50
100
150
200 Average = 100
C. Manufacturing, 2011
Firm size1-19 20-49 50-99 100-249 250+
0
20
40
60
80
100
120 % of all firms in the size class
Distribution of enterprises by productivity levels²
D. 2005³
Firm size20-49 50-249 250-2499 2500+
Low productivityMedium
High productivity
0
20
40
60
80
100
120 % of all firms in the size class
E. 2011
Firm size20-49 50-249 250-2499 2500+
Low productivityMedium
High productivity
ECO/WKP(2014)57
14
Table 1. A taxonomy of Turkish businesses
MICRO
BUSINESSES SMALL-AND-MEDIUM SIZED BUSINESSES
LARGE FAMILY FIRMS
INSTITUTIONAL CORPORATIONS SKILLED STARS
Ownership Founder Mostly founder Founder family Controlling owner +
shareholders Founder
Legal status
Sole proprietorship or “trader and
craftsman workplace” (esnaf)
Limited partnership or joint-stock company
Joint-stock company
Listed corporation Limited partnership
or joint-stock company
Tax status
Personal income taxation (on basis of
either “simplified business activity” or
“one book” methods)
For personal income taxpayers, “One-book” or “four book” taxation
according to sales volume. For corporate taxpayers, “four book” taxation irrespective of
sales volume
“Four-book” corporate taxation
Externally audited four-book corporate
taxation
For personal income tax payers, “One-
book” or “four book” taxation according to
sales volume. For corporate
taxpayers, “four book” taxation
irrespective of sales volume
Corporate governance
Owner/manager Owner/manager Family board
and family manager
Independent board members and professional managers
Owner manager and participatory team
Employment rules and protection
Informal Frequent circumvention
of employment rules
Partial compliance
with employment
rules
Full compliance Full compliance
Accuracy of wage reporting
and social security
contribution
- Partial Mostly Fully Fully
Financial transparency
- -
Firms above size thresholds
publish audited financial
statements
Audited financial statements and
quarterly accounts
Some voluntarily publish audited
financial statements
Size (approximate
number of workers)
1-10 10-250 250-2500 2500+ 10-49
Productivity (% of average
productivity in 20+ firms)
10-20% 40-80% 100-120% 130-150% Up to 200% and
more
Share in business sector
employment Around 45% Between 35-40% Around 15% Around 4% Less than 1%
Share in manufacturing employment
Around 25% Between 40-45% Around 25% Around 6% Less than 1%
ECO/WKP(2014)57
15
First-generation entrepreneurial businesses, owned and led by better educated and commercially active entrepreneurs, are staffed with medium-level technical personnel and employ up to several hundred workers. Their production capacities are flexible, their delivery times short, and they strive to improve the quality of their products. Their distinct strength is their market responsiveness and flexibility, but they face Turkey’s very rigid regulatory framework. Many do not report all their employees to social security, seem to hire part of them under legally prohibited temporary forms, appear to pay less than the official minimum wage (notably in regions where living costs are low) and underreport wage payments to minimise tax and social contribution costs. As a result, many of these firms cannot produce transparent and reliable financial reports, which complicates their access to credit and equity capital. Given their role in growth and job creation, a wide range of government support programmes have been phased in for these enterprises in the 2000s. The diversification of traditional commercial banks into this area and the development of interest-free banking have also supported their expansion (Box 2).
Box 2. Financial bottlenecks of medium-sized businesses and “participation finance”
High-growth medium-sized enterprises need to build up physical and human capital, and tend to face funding bottlenecks. Operating semi-formally weakens their financial transparency and they have limited collateral for banks. This makes their access to credit markets, and a fortiori to external equity, difficult. This financial bottleneck has been recognised as a major obstacle to the growth of dynamic SMEs in Turkey (World Bank, 2011; MUSIAD, 2013).
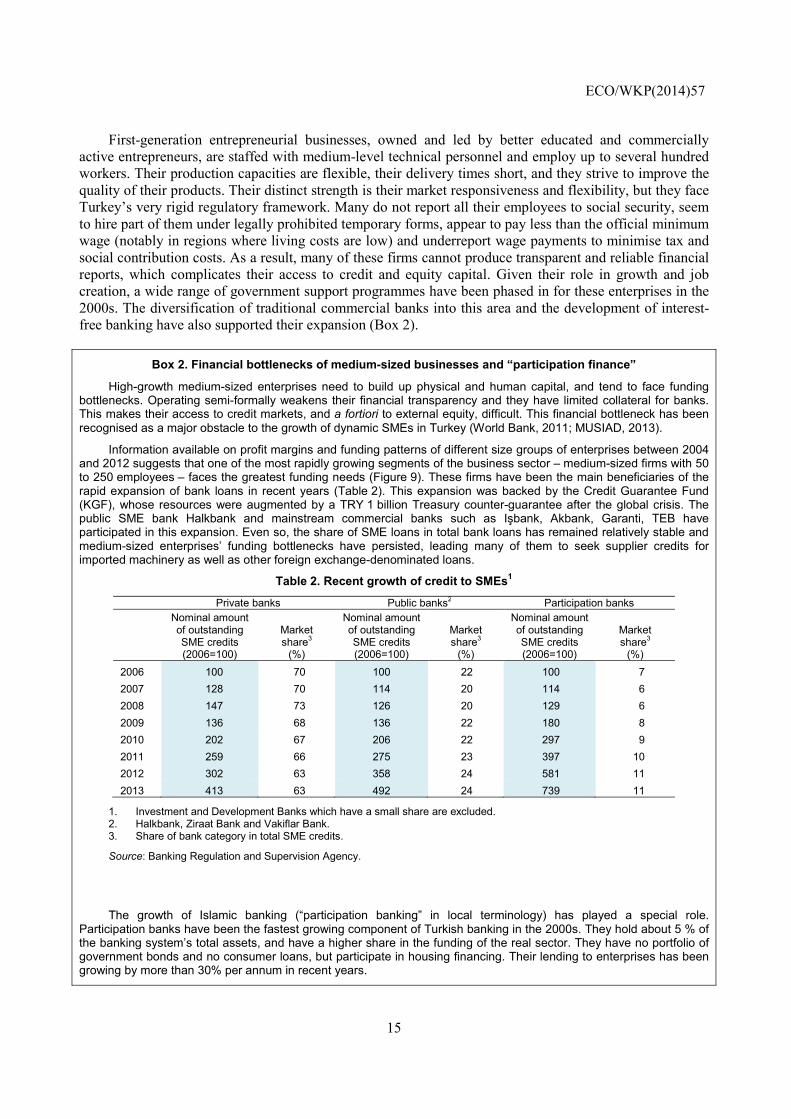
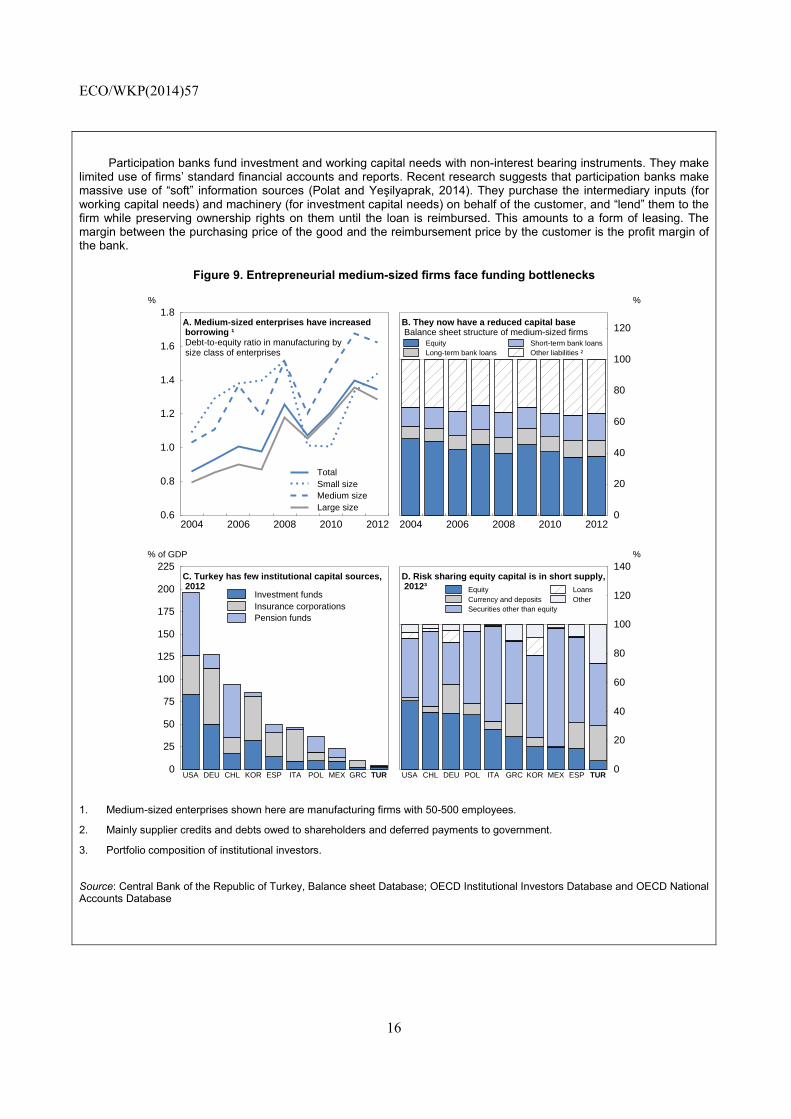
Information available on profit margins and funding patterns of different size groups of enterprises between 2004 and 2012 suggests that one of the most rapidly growing segments of the business sector – medium-sized firms with 50 to 250 employees – faces the greatest funding needs (Figure 9). These firms have been the main beneficiaries of the rapid expansion of bank loans in recent years (Table 2). This expansion was backed by the Credit Guarantee Fund (KGF), whose resources were augmented by a TRY 1 billion Treasury counter-guarantee after the global crisis. The public SME bank Halkbank and mainstream commercial banks such as Işbank, Akbank, Garanti, TEB have participated in this expansion. Even so, the share of SME loans in total bank loans has remained relatively stable and medium-sized enterprises’ funding bottlenecks have persisted, leading many of them to seek supplier credits for imported machinery as well as other foreign exchange-denominated loans.
Table 2. Recent growth of credit to SMEs1
Private banks Public banks2 Participation banks
Nominal amount of outstanding SME credits (2006=100)
Market share3
(%)
Nominal amount of outstanding SME credits (2006=100)
Market share3
(%)
Nominal amount of outstanding SME credits (2006=100)
Market share3
(%)
2006 100 70 100 22 100 7
2007 128 70 114 20 114 6
2008 147 73 126 20 129 6
2009 136 68 136 22 180 8
2010 202 67 206 22 297 9
2011 259 66 275 23 397 10
2012 302 63 358 24 581 11
2013 413 63 492 24 739 11
1. Investment and Development Banks which have a small share are excluded. 2. Halkbank, Ziraat Bank and Vakiflar Bank. 3. Share of bank category in total SME credits.
Source: Banking Regulation and Supervision Agency.
The growth of Islamic banking (“participation banking” in local terminology) has played a special role. Participation banks have been the fastest growing component of Turkish banking in the 2000s. They hold about 5 % of the banking system’s total assets, and have a higher share in the funding of the real sector. They have no portfolio of government bonds and no consumer loans, but participate in housing financing. Their lending to enterprises has been growing by more than 30% per annum in recent years.
ECO/WKP(2014)57
16
Participation banks fund investment and working capital needs with non-interest bearing instruments. They make limited use of firms’ standard financial accounts and reports. Recent research suggests that participation banks make massive use of “soft” information sources (Polat and Yeşilyaprak, 2014). They purchase the intermediary inputs (for working capital needs) and machinery (for investment capital needs) on behalf of the customer, and “lend” them to the firm while preserving ownership rights on them until the loan is reimbursed. This amounts to a form of leasing. The margin between the purchasing price of the good and the reimbursement price by the customer is the profit margin of the bank.
Figure 9. Entrepreneurial medium-sized firms face funding bottlenecks
1. Medium-sized enterprises shown here are manufacturing firms with 50-500 employees.
2. Mainly supplier credits and debts owed to shareholders and deferred payments to government.
3. Portfolio composition of institutional investors.
Source: Central Bank of the Republic of Turkey, Balance sheet Database; OECD Institutional Investors Database and OECD National Accounts Database
2004 2006 2008 2010 20120.6
0.8
1.0
1.2
1.4
1.6
1.8 %
A. Medium-sized enterprises have increased borrowing ¹ Debt-to-equity ratio in manufacturing by size class of enterprises
TotalSmall sizeMedium sizeLarge size
2004 2006 2008 2010 20120
20
40
60
80
100
120
%
B. They now have a reduced capital base Balance sheet structure of medium-sized firms
EquityLong-term bank loans
Short-term bank loansOther liabilities ²
0
25
50
75
100
125
150
175
200
225 % of GDP
C. Turkey has few institutional capital sources, 2012
USA DEU CHL KOR ESP ITA POL MEX GRC TUR
Investment fundsInsurance corporationsPension funds
0
20
40
60
80
100
120
140 %
D. Risk sharing equity capital is in short supply, 2012³
USA CHL DEU POL ITA GRC KOR MEX ESP TUR
EquityCurrency and depositsSecurities other than equity
LoansOther
ECO/WKP(2014)57
17
Large second- or third-generation family enterprises constitute the traditional backbone of the Turkish business sector. They tend to be found in the 250 to 2 500 worker bracket. Over time, they have built up technical expertise in specific manufacturing and service areas, often via co-operation and joint ventures with long-time international partners (Box 3). They generally display good performance in terms of productivity levels and award high wages to their managers and employees. They tend to be “closed” corporations whose shares are owned by family members. Whereas in an average OECD country family firms’ management quality is generally mediocre (Bloom and Van Rennen, 2010), surviving family firms in Turkey have above average productivity. Some of them have started to list their shares on the stock exchange, to facilitate the valuation of the company, handle generational transmissions and improve management. The core development challenge for these enterprises is to further corporatise and institutionalise their governance systems and to professionalise their management. This should improve their access to domestic and international markets for capital, professional labour and foreign business partnerships, and boost their productivity. However, it also entails “formalisation costs”.7 Additional reforms in the regulatory and tax framework would reduce their cost of transition from semi to full formality.
Firms listed on the stock market form the top tier of the business sector in terms of institutionalisation, productivity level and worker incomes. They include: the listed and professionally managed big family conglomerates and holdings; some former state-owned companies which were privatised through public offerings; and international firms operating in Turkey – listed in their country of origin (Box 3). These large entities are very visible domestically and internationally, but represent no more than 4% of Turkey’s business sector employment when proxied by the 383 firms listed on Borsa Istanbul (including 38 banks and financial institutions), and only 0.3% when proxied by ISO-1000 large companies having issued over 25% of their equity in the stock market. They meet high corporate governance and financial standards, and are subject to the demanding rules set by the Capital Markets Board and the Stock Exchange. About ten of them have issued securities in the international market, and are rated by international rating agencies. However, these firms may not be internationally competitive in labour-intensive industries, as they fully comply with Turkey’s comparatively costly labour laws and regulations.8
Lastly, “skilled stars” are start-ups in high-tech manufacturing and services, which represent a tiny but essential high-productivity layer of the business sector. They tend to be small and draw on Turkish and foreign highly skilled professionals. They are more formal than other small firms. Part of them have larger firms as shareholders, many use public R&D incentives, and seek to liaise with international technological partners. For these reasons they need to meet higher transparency standards.9 Compared to international
7. Many family enterprises, even large ones, may resort to various degrees of underreporting of their wages and profits and therefore provide only minimal financial information. Except for the small minority listed on the stock exchange, they do not publish standard financial reports. Only enterprises with more than 500 shareholders, and those crossing two of three thresholds (250 employees from January 2014 – 2 500 employees before-, sales of TL 150 million, or a balance sheet of TL 75 million) are required to publish externally audited financial accounts.
8. A sub-group of non-listed enterprises subject to sectoral regulations (in energy, insurance, air transportation, media and gold trade sectors) need to submit audited financial statements according to international standards. For this reason they are de facto part of the institutional sector, but their size could not be measured for the purpose of this study.
9. Part of the about 1 800 Turkish companies voluntarily producing audited financial accounts (without being required by regulations) are among these firms – a total of 3 500 Turkish firms produce externally audited financial statements.
ECO/WKP(2014)57
18
peers, these firms may be handicapped by less technologically advanced local value chains. However, they try to cope by fostering links with global business and technological hubs (OECD, 2013c; Dunya, 2014). Limited quantitative information is available on the total size of this sector. Young enterprises operating in technoparks, which are one subset in this category, account for 0.1% of total business sector employment.
The five types of enterprises differ greatly in terms of scale, skills, financial resources, production capacities and productivity, but all interact in Turkey’s value chains. Downstream firms depend on their upstream suppliers. In a study of large firms’ input procurement practices, Saygili et al. (2012) showed that weaknesses of upstream suppliers had serious downstream impacts and constrained their productivity and employment performance. Low-skill, small-scale, non-institutionalised input suppliers limit the technological choices of user firms, leading them to import a large share of inputs. In contrast, in a small number of sectors where suppliers corporatised and professionalised their activities in line with downstream customers, the total performance of the value chain improved with higher aggregate output, employment and productivity, and the imported share of inputs diminished.
One distortion highlighted in this study is large firms’ tendency to outsource the labour-intensive parts of production processes to smaller suppliers, even when this may entail productivity losses. Recourse to less formal firms serves to minimise labour costs because, in all likelihood, they circumvent minimum wage and employment regulations.
ECO/WKP(2014)57
19
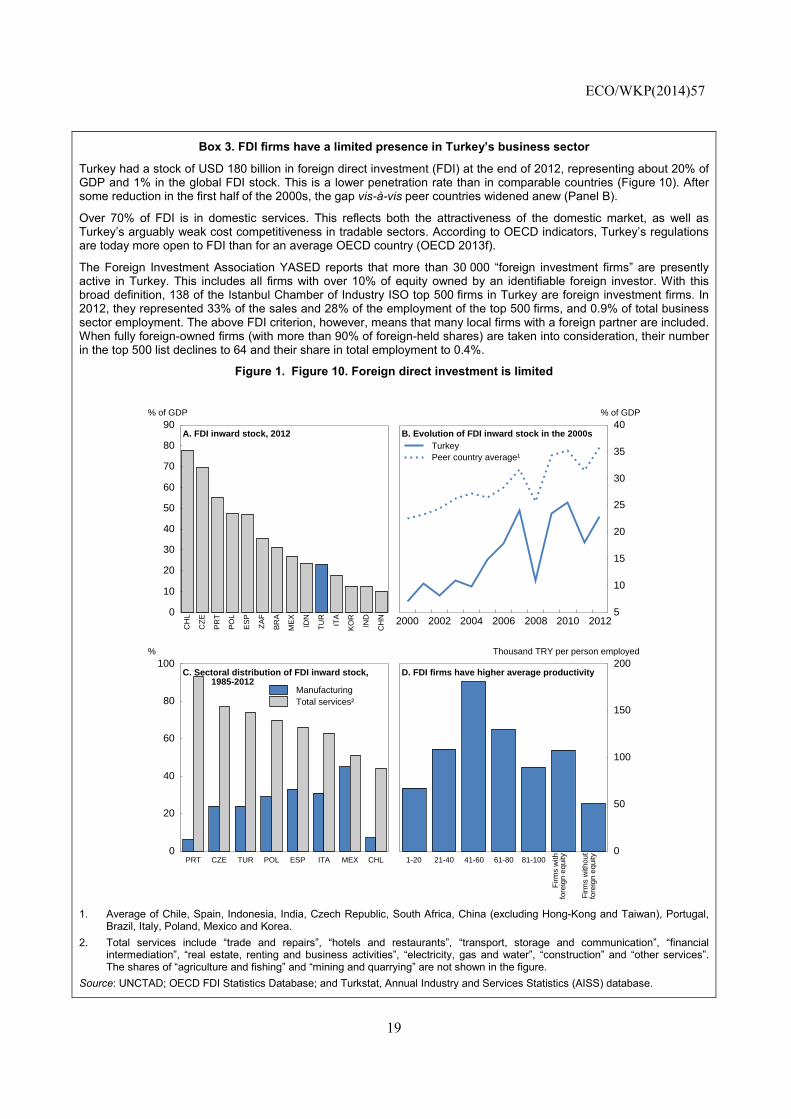
Box 3. FDI firms have a limited presence in Turkey’s business sector
Turkey had a stock of USD 180 billion in foreign direct investment (FDI) at the end of 2012, representing about 20% of GDP and 1% in the global FDI stock. This is a lower penetration rate than in comparable countries (Figure 10). After some reduction in the first half of the 2000s, the gap vis-à-vis peer countries widened anew (Panel B).
Over 70% of FDI is in domestic services. This reflects both the attractiveness of the domestic market, as well as Turkey’s arguably weak cost competitiveness in tradable sectors. According to OECD indicators, Turkey’s regulations are today more open to FDI than for an average OECD country (OECD 2013f).
The Foreign Investment Association YASED reports that more than 30 000 “foreign investment firms” are presently active in Turkey. This includes all firms with over 10% of equity owned by an identifiable foreign investor. With this broad definition, 138 of the Istanbul Chamber of Industry ISO top 500 firms in Turkey are foreign investment firms. In 2012, they represented 33% of the sales and 28% of the employment of the top 500 firms, and 0.9% of total business sector employment. The above FDI criterion, however, means that many local firms with a foreign partner are included. When fully foreign-owned firms (with more than 90% of foreign-held shares) are taken into consideration, their number in the top 500 list declines to 64 and their share in total employment to 0.4%.
Figure 1. Figure 10. Foreign direct investment is limited
1. Average of Chile, Spain, Indonesia, India, Czech Republic, South Africa, China (excluding Hong-Kong and Taiwan), Portugal,
Brazil, Italy, Poland, Mexico and Korea.
2. Total services include “trade and repairs”, “hotels and restaurants”, “transport, storage and communication”, “financial intermediation”, “real estate, renting and business activities”, “electricity, gas and water”, “construction” and “other services”. The shares of “agriculture and fishing” and “mining and quarrying” are not shown in the figure.
Source: UNCTAD; OECD FDI Statistics Database; and Turkstat, Annual Industry and Services Statistics (AISS) database.
0
10
20
30
40
50
60
70
80
90 % of GDP
A. FDI inward stock, 2012
CH
L
CZ
E
PR
T
PO
L
ES
P
ZA
F
BR
A
ME
X
IDN
TU
R
ITA
KO
R
IND
CH
N 2000 2002 2004 2006 2008 2010 20125
10
15
20
25
30
35
40 % of GDP
B. Evolution of FDI inward stock in the 2000s
TurkeyPeer country average¹
0
20
40
60
80
100 %
C. Sectoral distribution of FDI inward stock, 1985-2012
PRT CZE TUR POL ESP ITA MEX CHL
ManufacturingTotal services²
0
50
100
150
200 Thousand TRY per person employed
D. FDI firms have higher average productivity
1-20 21-40 41-60 61-80 81-100
Firm
s w
ithfo
reig
n eq
uity
Firm
s w
ithou
tfo
reig
n eq
uity
ECO/WKP(2014)57
20
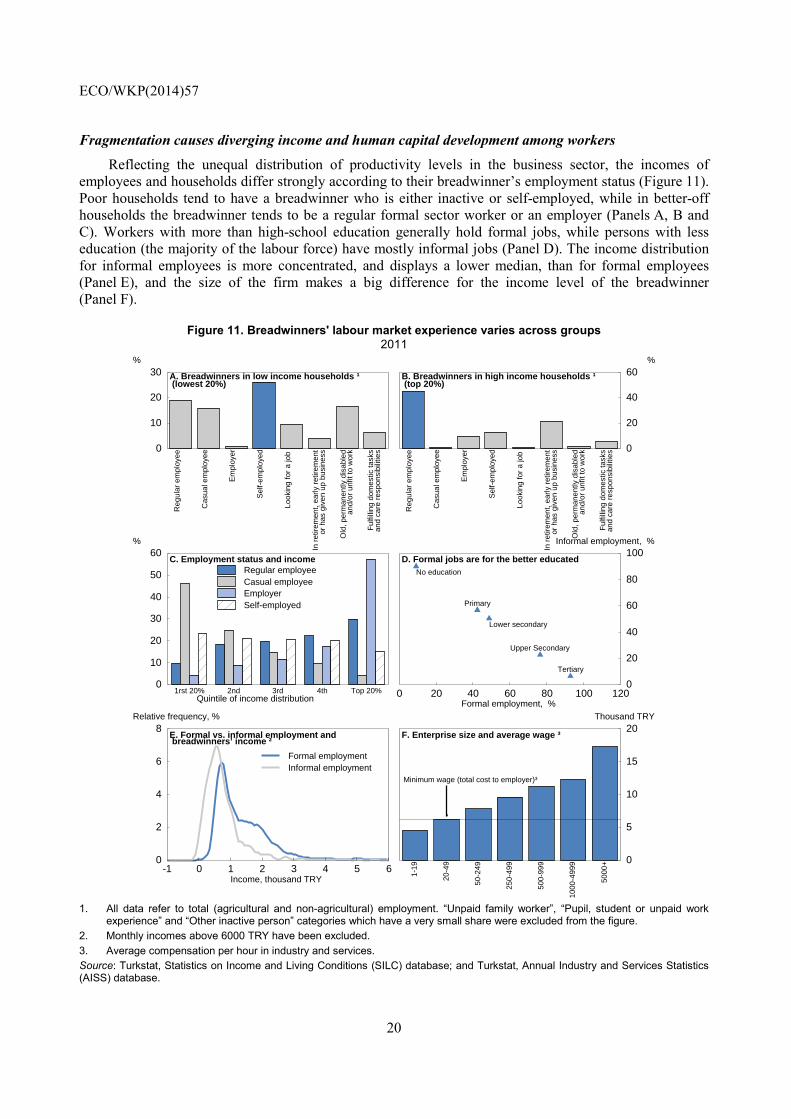
Fragmentation causes diverging income and human capital development among workers
Reflecting the unequal distribution of productivity levels in the business sector, the incomes of employees and households differ strongly according to their breadwinner’s employment status (Figure 11). Poor households tend to have a breadwinner who is either inactive or self-employed, while in better-off households the breadwinner tends to be a regular formal sector worker or an employer (Panels A, B and C). Workers with more than high-school education generally hold formal jobs, while persons with less education (the majority of the labour force) have mostly informal jobs (Panel D). The income distribution for informal employees is more concentrated, and displays a lower median, than for formal employees (Panel E), and the size of the firm makes a big difference for the income level of the breadwinner (Panel F).
Figure 11. Breadwinners' labour market experience varies across groups 2011
1. All data refer to total (agricultural and non-agricultural) employment. “Unpaid family worker”, “Pupil, student or unpaid work
experience” and “Other inactive person” categories which have a very small share were excluded from the figure.
2. Monthly incomes above 6000 TRY have been excluded.
3. Average compensation per hour in industry and services.
Source: Turkstat, Statistics on Income and Living Conditions (SILC) database; and Turkstat, Annual Industry and Services Statistics (AISS) database.
0
10
20
30 %
A. Breadwinners in low income households ¹ (lowest 20%)
Reg
ular
em
ploy
ee
Cas
ual e
mpl
oyee
Em
ploy
er
Sel
f-em
ploy
ed
Look
ing
for
a jo
b
In r
etire
men
t, ea
rly r
etire
men
tor
has
giv
en u
p bu
sine
ss
Old
, per
man
ently
dis
able
dan
d/or
unf
it to
wor
k
Ful
fillin
g do
mes
tic ta
sks
and
care
res
pons
ibili
ties 0
20
40
60 %
B. Breadwinners in high income households ¹ (top 20%)
Reg
ular
em
ploy
ee
Cas
ual e
mpl
oyee
Em
ploy
er
Sel
f-em
ploy
ed
Look
ing
for
a jo
b
In r
etire
men
t, ea
rly r
etire
men
tor
has
giv
en u
p bu
sine
ss
Old
, per
man
ently
dis
able
dan
d/or
unf
it to
wor
k
Ful
fillin
g do
mes
tic ta
sks
and
care
res
pons
ibili
ties
0
10
20
30
40
50
60 %
C. Employment status and income
Quintile of income distribution1rst 20% 2nd 3rd 4th Top 20%
Regular employeeCasual employeeEmployerSelf-employed
0 20 40 60 80 100 1200
20
40
60
80
100Informal employment, %
D. Formal jobs are for the better educated
Formal employment, %
No education
Primary
Lower secondary
Upper Secondary
Tertiary
-1 0 1 2 3 4 5 60
2
4
6
8 Relative frequency, %
E. Formal vs. informal employment and breadwinners’ income ²
Income, thousand TRY
Formal employmentInformal employment
0
5
10
15
20 Thousand TRY
F. Enterprise size and average wage ³
1-19
20-4
9
50-2
49
250-
499
500-
999
1000
-499
9
5000
+
Minimum wage (total cost to employer)³
ECO/WKP(2014)57
21
The segmentation between types of firms and jobs undermines both aggregate productivity and social inclusiveness. Traditionally, mobility between different types of jobs has been limited: depending on their educational background, individuals joined a given labour market segment (say, informal self-employment or formal salaried work) or stayed inactive (the majority of low educated women) and then tended to stay in this position through their lifetime – even after changing location, sector and employer. Also, households tended to remain in the income bracket of their main breadwinner. This inertia diminished on the back of broad-based growth in the 2000s, with more low-skilled male workers shifting from informal to formal jobs in more corporatized medium-sized enterprises. More low-skilled women and senior workers also transited from inactivity into informal jobs. However, labour market segmentation remains strong, mirroring persistent business sector segmentation.
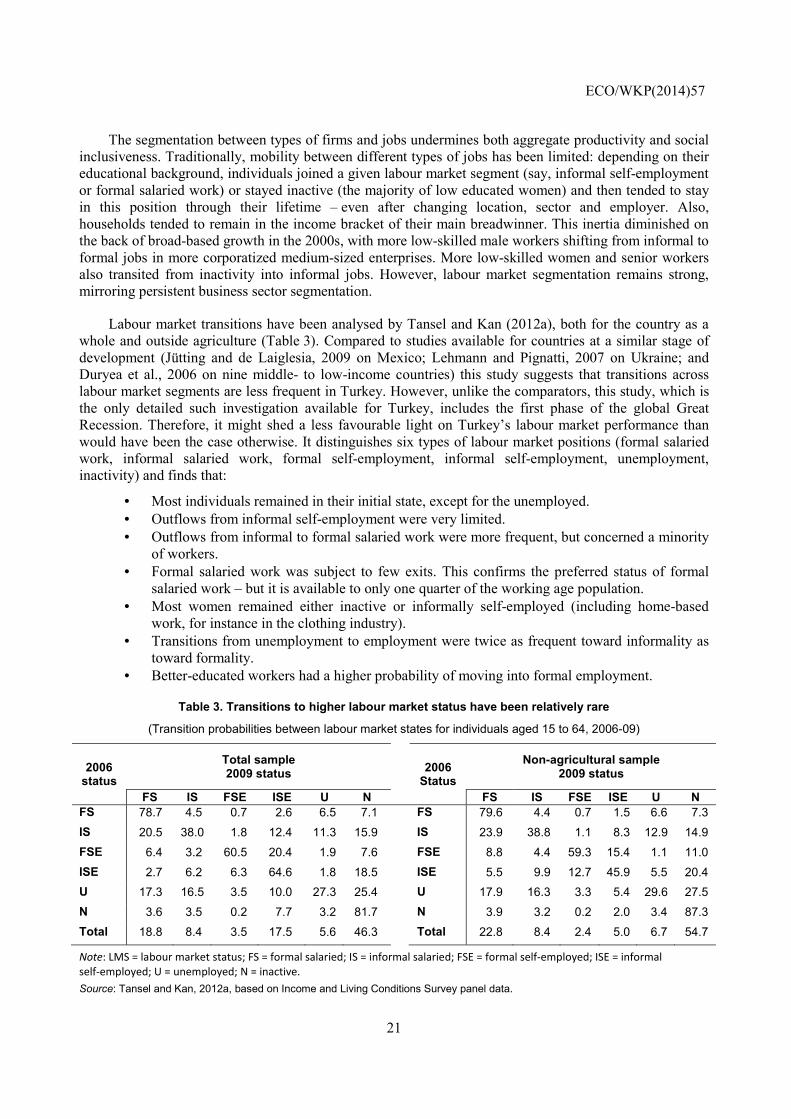
Labour market transitions have been analysed by Tansel and Kan (2012a), both for the country as a whole and outside agriculture (Table 3). Compared to studies available for countries at a similar stage of development (Jütting and de Laiglesia, 2009 on Mexico; Lehmann and Pignatti, 2007 on Ukraine; and Duryea et al., 2006 on nine middle- to low-income countries) this study suggests that transitions across labour market segments are less frequent in Turkey. However, unlike the comparators, this study, which is the only detailed such investigation available for Turkey, includes the first phase of the global Great Recession. Therefore, it might shed a less favourable light on Turkey’s labour market performance than would have been the case otherwise. It distinguishes six types of labour market positions (formal salaried work, informal salaried work, formal self-employment, informal self-employment, unemployment, inactivity) and finds that:
• Most individuals remained in their initial state, except for the unemployed. • Outflows from informal self-employment were very limited. • Outflows from informal to formal salaried work were more frequent, but concerned a minority
of workers. • Formal salaried work was subject to few exits. This confirms the preferred status of formal
salaried work – but it is available to only one quarter of the working age population. • Most women remained either inactive or informally self-employed (including home-based
work, for instance in the clothing industry). • Transitions from unemployment to employment were twice as frequent toward informality as
toward formality. • Better-educated workers had a higher probability of moving into formal employment.
Table 3. Transitions to higher labour market status have been relatively rare
(Transition probabilities between labour market states for individuals aged 15 to 64, 2006-09)
2006 status
Total sample 2009 status
2006 Status
Non-agricultural sample 2009 status
FS IS FSE ISE U N FS IS FSE ISE U N
FS 78.7 4.5 0.7 2.6 6.5 7.1 FS 79.6 4.4 0.7 1.5 6.6 7.3
IS 20.5 38.0 1.8 12.4 11.3 15.9 IS 23.9 38.8 1.1 8.3 12.9 14.9
FSE 6.4 3.2 60.5 20.4 1.9 7.6 FSE 8.8 4.4 59.3 15.4 1.1 11.0
ISE 2.7 6.2 6.3 64.6 1.8 18.5 ISE 5.5 9.9 12.7 45.9 5.5 20.4
U 17.3 16.5 3.5 10.0 27.3 25.4 U 17.9 16.3 3.3 5.4 29.6 27.5
N 3.6 3.5 0.2 7.7 3.2 81.7 N 3.9 3.2 0.2 2.0 3.4 87.3
Total 18.8 8.4 3.5 17.5 5.6 46.3 Total 22.8 8.4 2.4 5.0 6.7 54.7
Note: LMS = labour market status; FS = formal salaried; IS = informal salaried; FSE = formal self-employed; ISE = informal
self-employed; U = unemployed; N = inactive.
Source: Tansel and Kan, 2012a, based on Income and Living Conditions Survey panel data.
ECO/WKP(2014)57
22
Another study of social vulnerabilities in Turkey also documented labour market segmentation (Finn et al., 2013). Looking at labour market status persistence, it identified 12 specific groups which over time fail to obtain regular formal sector jobs, including i) 25-to-39-year-old informal male workers; ii) self-employed workers aged 45 and over; iii) women in long-term informal employment; and iv) women in unpaid agricultural work.
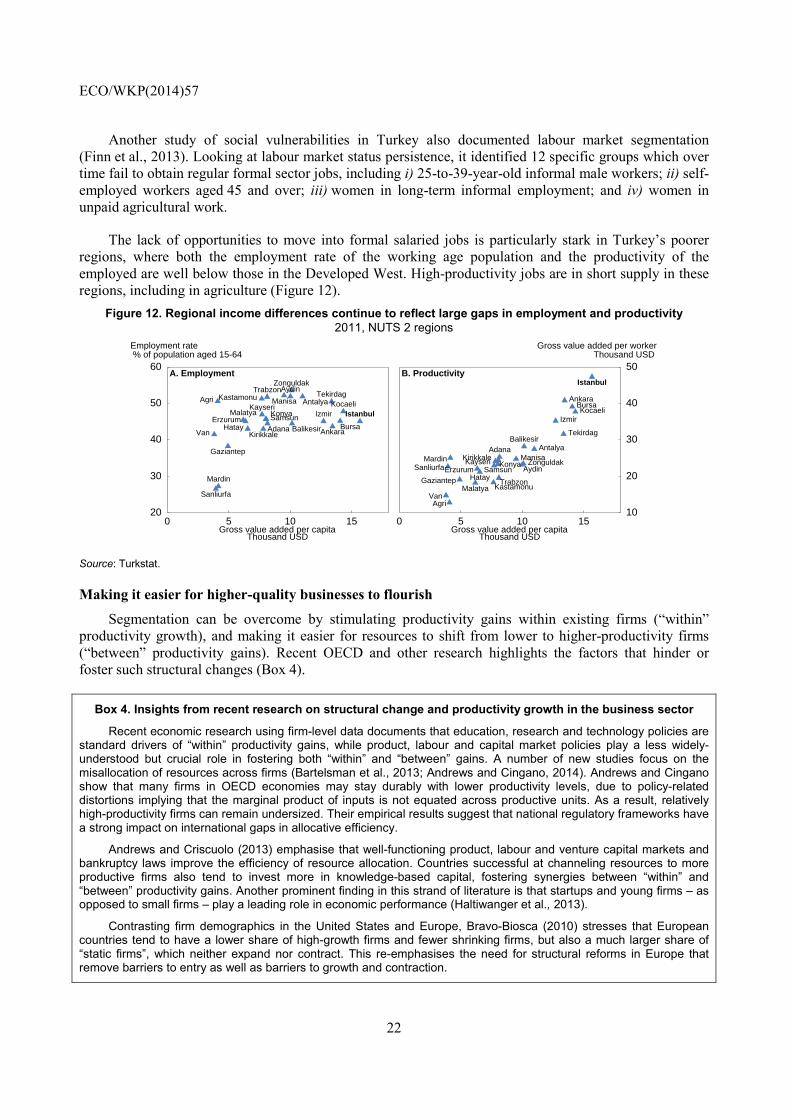
The lack of opportunities to move into formal salaried jobs is particularly stark in Turkey’s poorer regions, where both the employment rate of the working age population and the productivity of the employed are well below those in the Developed West. High-productivity jobs are in short supply in these regions, including in agriculture (Figure 12).
Figure 12. Regional income differences continue to reflect large gaps in employment and productivity
2011, NUTS 2 regions
Source: Turkstat.
Making it easier for higher-quality businesses to flourish
Segmentation can be overcome by stimulating productivity gains within existing firms (“within” productivity growth), and making it easier for resources to shift from lower to higher-productivity firms (“between” productivity gains). Recent OECD and other research highlights the factors that hinder or foster such structural changes (Box 4).
Box 4. Insights from recent research on structural change and productivity growth in the business sector
Recent economic research using firm-level data documents that education, research and technology policies are standard drivers of “within” productivity gains, while product, labour and capital market policies play a less widely-understood but crucial role in fostering both “within” and “between” gains. A number of new studies focus on the misallocation of resources across firms (Bartelsman et al., 2013; Andrews and Cingano, 2014). Andrews and Cingano show that many firms in OECD economies may stay durably with lower productivity levels, due to policy-related distortions implying that the marginal product of inputs is not equated across productive units. As a result, relatively high-productivity firms can remain undersized. Their empirical results suggest that national regulatory frameworks have a strong impact on international gaps in allocative efficiency.
Andrews and Criscuolo (2013) emphasise that well-functioning product, labour and venture capital markets and bankruptcy laws improve the efficiency of resource allocation. Countries successful at channeling resources to more productive firms also tend to invest more in knowledge-based capital, fostering synergies between “within” and “between” productivity gains. Another prominent finding in this strand of literature is that startups and young firms – as opposed to small firms – play a leading role in economic performance (Haltiwanger et al., 2013).
Contrasting firm demographics in the United States and Europe, Bravo-Biosca (2010) stresses that European countries tend to have a lower share of high-growth firms and fewer shrinking firms, but also a much larger share of “static firms”, which neither expand nor contract. This re-emphasises the need for structural reforms in Europe that remove barriers to entry as well as barriers to growth and contraction.
0 5 10 1520
30
40
50
60
Employment rate % of population aged 15-64
A. Employment
Gross value added per capitaThousand USD
Istanbul
Tekirdag
Balikesir
Izmir
Aydin
Manisa
Bursa
Kocaeli
Ankara
Konya
Antalya
AdanaHatayKirikkale
Kayseri
Zonguldak
Kastamonu
Samsun
Trabzon
Erzurum
Agri
Malatya
Van
Gaziantep
Sanliurfa
Mardin
0 5 10 1510
20
30
40
50
Gross value added per workerThousand USD
B. Productivity
Gross value added per capitaThousand USD
Istanbul
TekirdagBalikesir
Izmir
Aydin
Manisa
BursaKocaeli
Ankara
Konya
AntalyaAdana
Hatay
KirikkaleKayseri Zonguldak
Kastamonu
Samsun
Trabzon
Erzurum
Agri
MalatyaVan
Gaziantep
SanliurfaMardin
ECO/WKP(2014)57
23
Bloom and Van Rennen (2010), on the basis of a detailed World Management Survey, show that most of the cross-country difference in the weight of underperforming firms is due to the size of the long statistical tail of badly managed firms. They underscore six empirical regularities: i) product market competition boosts average management quality by eliminating badly managed firms and pushing incumbents to improve their practices; ii) exporters are better managed than non-exporters and less so than multinationals; iii) family-owned firms with a family member as CEO are generally poorly managed; iv) listed firms are better managed; v) multinationals are well managed; vi) firms with better-educated workers are better managed; vii) lighter labour market regulation is associated with better management practices.
Altomonte et al. (2012) focus on differences in the distribution of firm performance across countries which bear on national economic performance, and underline that: i) the higher the dispersion of firm performance, the more room to reallocate resources; ii) the presence of larger firms normally improves performance; iii) exporters display above-average performance; iv) policies aimed at supporting weaker firms, such as those targeted towards SMEs, may hinder growth and increase the number of less well-performing firms.
These studies focus on the impact of policies on the allocation of resources within sectors. They may actually understate the overall impact of policy-induced distortions on resource allocation to the extent that they do not account for the impacts of regulation on resource flows between sectors, which are likely to reinforce the within-sector effects identified. For example, McMillan and Rodrik (2011), in a cross-country study of productivity-enhancing structural changes find that countries with more flexible labor markets experience greater growth-enhancing structural change. This is consistent with the results of Bassanini et al. (2009), who examine the impact of employment protection legislation on productivity in OECD countries, on the basis of data on labour market regulation and industry-level productivity over 20 years. They document that stricter employment protection influences worker or firm behaviour, and thereby productivity, more in industries where the policy is likely to be binding than in other industries. Regarding Italy, they note that the reforms carried out there since the early 1990s created and eased the use of a multiplicity of atypical contracts, without addressing the difficulty of reallocating workers with open-ended contracts, and suggest that this has contributed to Italy’s lackluster productivity performance.
Some recent research investigates the links between regulatory frameworks, resource reallocations and productivity growth in developing countries. Hsieh and Olken (2014) find that large firms in these countries tend to be constrained in their growth as they are subject to above-market wages, onerous regulations and higher taxes. Almeida and Carneiro (2008) and Hasan and Jandoc (2010) reach broadly similar conclusions for Brazil and India respectively.
Empirical evidence
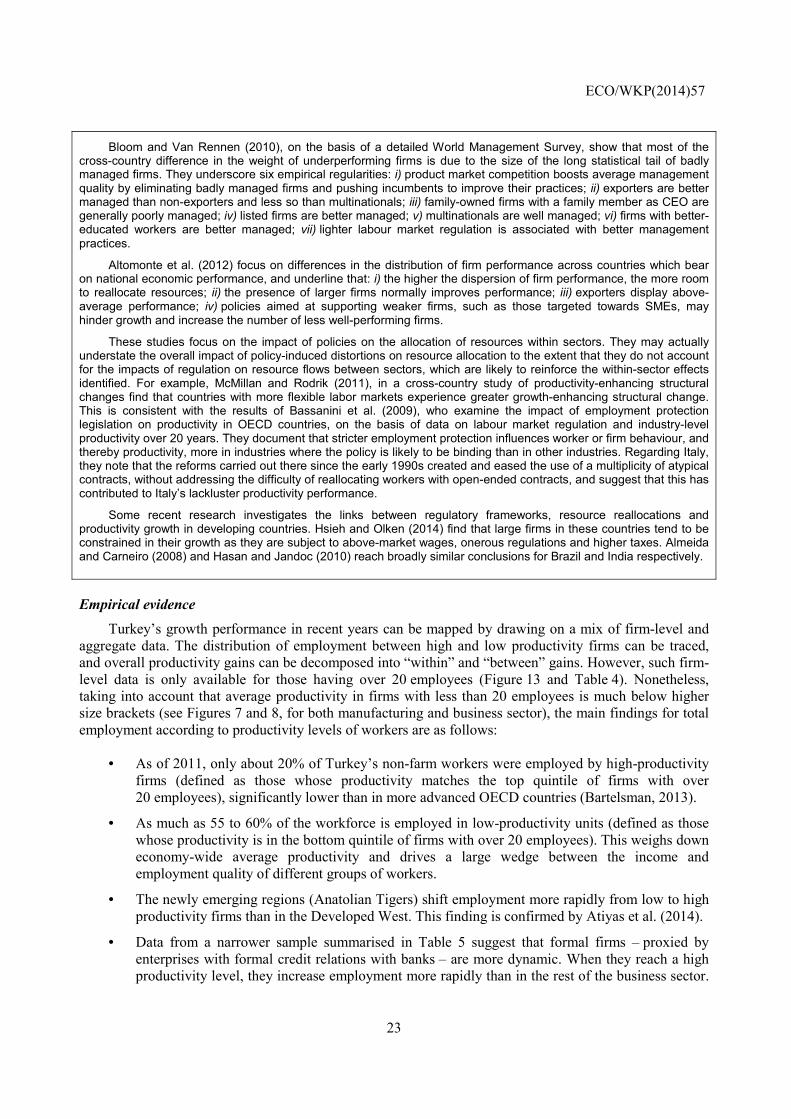
Turkey’s growth performance in recent years can be mapped by drawing on a mix of firm-level and aggregate data. The distribution of employment between high and low productivity firms can be traced, and overall productivity gains can be decomposed into “within” and “between” gains. However, such firm-level data is only available for those having over 20 employees (Figure 13 and Table 4). Nonetheless, taking into account that average productivity in firms with less than 20 employees is much below higher size brackets (see Figures 7 and 8, for both manufacturing and business sector), the main findings for total employment according to productivity levels of workers are as follows:
• As of 2011, only about 20% of Turkey’s non-farm workers were employed by high-productivity firms (defined as those whose productivity matches the top quintile of firms with over 20 employees), significantly lower than in more advanced OECD countries (Bartelsman, 2013).
• As much as 55 to 60% of the workforce is employed in low-productivity units (defined as those whose productivity is in the bottom quintile of firms with over 20 employees). This weighs down economy-wide average productivity and drives a large wedge between the income and employment quality of different groups of workers.
• The newly emerging regions (Anatolian Tigers) shift employment more rapidly from low to high productivity firms than in the Developed West. This finding is confirmed by Atiyas et al. (2014).
• Data from a narrower sample summarised in Table 5 suggest that formal firms – proxied by enterprises with formal credit relations with banks – are more dynamic. When they reach a high productivity level, they increase employment more rapidly than in the rest of the business sector.
ECO/WKP(2014)57
24
Symmetrically, low-productivity formal firms contract more rapidly than in the rest of the business sector.10
Figure 13. Resource allocation has improved but there is ample room for further progress
Distribution of employment in firms with over 20 employees by productivity quintiles, in per cent
Note: This figure covers the entire population of firms with over 20 employees which were in operation in 2005, identified as a fixed panel of 23.500 firms in Turkstat's AIS database. Firms are classified according to their individual labour productivity level in 2005, calculated as value-added at factor cost per worker in constant prices. The evolution of employment in each firm between 2005 and 2011 allows to evaluate the aggregate direction and pace of redistribution of jobs between high and low productivity firms. Each firm is associated with one of five “productivity quintiles” on the basis of its performance in 2005, the top quintile representing the most productive firms. The figure shows employment shares of the related productivity quintile in total employment in 2005 and 2011, and the change in employment shares between 2005 and 2011. Panel F is based on information from the Balance Sheet Data Base of the Central Bank of Turkey. The panel covers about 2 600 firms which have formal credit relations with banks and for which high quality data series are available for the entire period. Value-added information is not available in this source and labour productivity is approximated by net sales per employee in constant prices. 1. Services include construction, wholesale and retail trade, hotels and restaurants, transport, storage and communication, real
estate, renting and business activities, education, health and social work and other community services.
10. This is obtained despite rigid employment rules in the formal sector through recourse to semi-formal
practices (OECD, 2012).
-10
0
10
20
30
40 A. Business sector
Productivity quintiles1rst 2nd 3rd 4th 5th
2005 2011
-10
0
10
20
30
40 B. Manufacturing
Productivity quintiles1rst 2nd 3rd 4th 5th
Change 2005-11
-10
0
10
20
30
40 C. Services¹
Productivity quintiles1rst 2nd 3rd 4th 5th
-10
0
10
20
30
40 D. Developed West (manufacturing)
Productivity quintiles1rst 2nd 3rd 4th 5th
-10
0
10
20
30
40 E. Anatolian Tigers (manufacturing)
Productivity quintiles1rst 2nd 3rd 4th 5th
-10
0
10
20
30
40 F. Formal sector²
Productivity quintiles1rst 2nd 3rd 4th 5th

ECO/WKP(2014)57
25
2. The formal sector is defined as firms reporting financial accounts to the Central Bank's balance sheet data base. In this source, productivity is calculated as sales per employee in constant prices.
Source: Turkstat.
ECO/WKP(2014)57
26
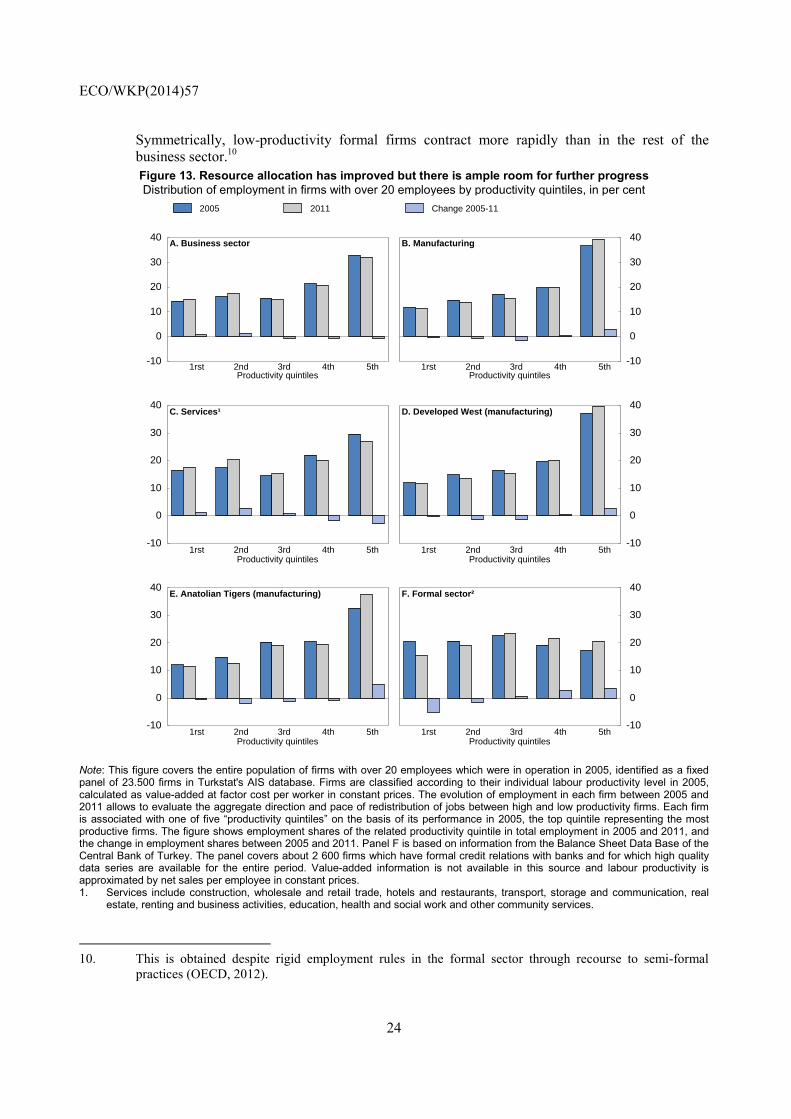
• Overall, formal firms grew faster than other firms in the 2000s. Between 2005 and 2011, 30% of formal micro businesses with less than 10 workers, 25% of firms with 10-49 workers, and nearly 20% of firms with 50-249 employees shifted to higher size groups (Table 5). The growth of formal enterprises in the Anatolian Tiger regions was even stronger: 70% of firms with less than 10 workers, 50% of those with 10-49 employees and 25% of those with 50-249 employees shifted to higher size brackets.
• These drivers of productivity growth are more vigorous in trade exposed manufacturing than in competition sheltered services. The manufacturing sector has a higher share of employment in high productivity firms, improves productivity faster within enterprises, and shift resources more rapidly from low to high-productivity firms.
Table 4. Within and between productivity gains in a fixed panel of firms
(Firms with over 20 employees)
2005-11 Annual productivity
growth “Within” productivity
gains “Between” productivity
gains
Business sector -0.20 0.55 -0.75 Manufacturing 2.05 2.82 -0.77 Business in Developed West -0.10 0.40 -0.50 Business in Anatolian Tigers 1.75 3.13 -1.39 Manufacturing in Developed West 1.76 2.37 -0.62 Manufacturing in Anatolian Tigers 7.71 9.29 -1.58
Manufacturing in Anatolian Tigers (excluding firms with over 2500 employees) 5.36 6.27 -0.91
Note: The decomposition methodology is based on McMillan and Rodrik (2011). A constant (balanced) panel of 23 500 firms has been investigated. This decomposition includes firms with more than 20 employees and focuses on changes within this constant panel of firms (in Turkey and within each region). However, it cannot capture the impact of the shift of resources from micro firms with less than 20 employees to those with more than 20 employees, and the impact of the new entries and exits.
Source: Turkstat/AISS Database, OECD Secretariat calculations.
Table 5. Formal sector firms are more dynamic
(Transition probabilities between size groups)
A. Formal business sector, Turkey
B. Formal business sector, Anatolian Tiger regions
Firm status in 2005
Firm status in 2011 Firm status in 2005
Firm status in 2011
Mi S Me L VL Mi S Me L VL Mi 0.65 0.30 0.04 0 0 Mi 0.33 0.67 0 0 0 S 0.12 0.61 0.25 0.03 0 S 0.04 0.49 0.47 0 0 Me 0.04 0.15 0.63 0.18 0 Me 0.02 0.08 0.64 0.26 0 L 0 0.02 0.12 0.84 0.03 L 0 0 0.04 0.89 0.04 VL 0 0 0 0.22 0.78 VL 0 0 0 0.50 0.50
Mi = Micro, 0-9 workers; S = Small, 10 – 49 workers; Me = Medium-sized, 50 - 249 workers; L= large, 250-2499 workers; VL = Very large, over 2 500 workers.
Note: Transition probabilities across columns do not always add up to 1 because of rounding effects.
Source: Central Bank Balance Sheet Database.
In sum, broad-based growth over the past decade has unleashed structural change in the Turkish business sector, even though aggregate productivity gains have been limited so far. The respective contributions of “within” and “between” gains highlight the areas where future structural upgrading should deliver benefits: i) the further corporatisation of first-generation entrepreneurial firms in Anatolian Tiger regions could deliver additional productivity gains; ii) the contribution of the formal sector could be enhanced by freeing up the institutionalisation of family firms and the presence of fully foreign-owned
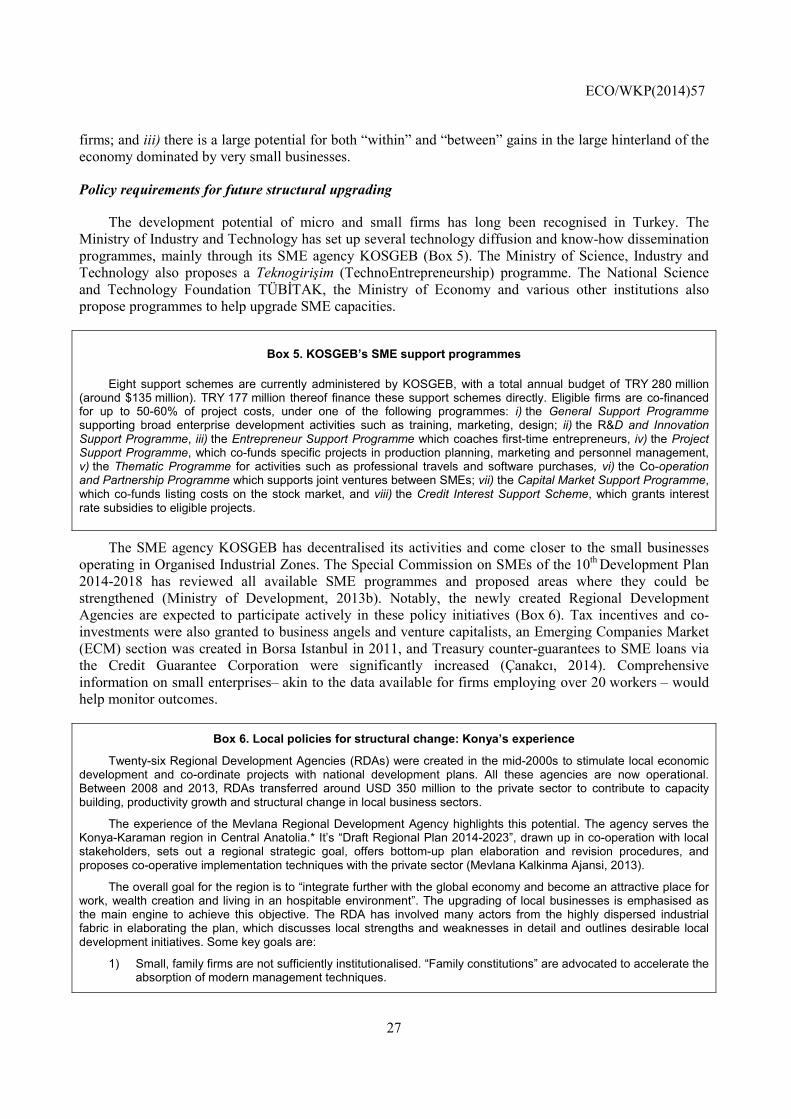
ECO/WKP(2014)57
27
firms; and iii) there is a large potential for both “within” and “between” gains in the large hinterland of the economy dominated by very small businesses.
Policy requirements for future structural upgrading
The development potential of micro and small firms has long been recognised in Turkey. The Ministry of Industry and Technology has set up several technology diffusion and know-how dissemination programmes, mainly through its SME agency KOSGEB (Box 5). The Ministry of Science, Industry and Technology also proposes a Teknogirişim (TechnoEntrepreneurship) programme. The National Science and Technology Foundation TÜBİTAK, the Ministry of Economy and various other institutions also propose programmes to help upgrade SME capacities.
Box 5. KOSGEB’s SME support programmes
Eight support schemes are currently administered by KOSGEB, with a total annual budget of TRY 280 million (around $135 million). TRY 177 million thereof finance these support schemes directly. Eligible firms are co-financed for up to 50-60% of project costs, under one of the following programmes: i) the General Support Programme supporting broad enterprise development activities such as training, marketing, design; ii) the R&D and Innovation Support Programme, iii) the Entrepreneur Support Programme which coaches first-time entrepreneurs, iv) the Project Support Programme, which co-funds specific projects in production planning, marketing and personnel management, v) the Thematic Programme for activities such as professional travels and software purchases, vi) the Co-operation and Partnership Programme which supports joint ventures between SMEs; vii) the Capital Market Support Programme, which co-funds listing costs on the stock market, and viii) the Credit Interest Support Scheme, which grants interest rate subsidies to eligible projects.
The SME agency KOSGEB has decentralised its activities and come closer to the small businesses operating in Organised Industrial Zones. The Special Commission on SMEs of the 10th Development Plan 2014-2018 has reviewed all available SME programmes and proposed areas where they could be strengthened (Ministry of Development, 2013b). Notably, the newly created Regional Development Agencies are expected to participate actively in these policy initiatives (Box 6). Tax incentives and co-investments were also granted to business angels and venture capitalists, an Emerging Companies Market (ECM) section was created in Borsa Istanbul in 2011, and Treasury counter-guarantees to SME loans via the Credit Guarantee Corporation were significantly increased (Çanakcı, 2014). Comprehensive information on small enterprises– akin to the data available for firms employing over 20 workers – would help monitor outcomes.
Box 6. Local policies for structural change: Konya’s experience
Twenty-six Regional Development Agencies (RDAs) were created in the mid-2000s to stimulate local economic development and co-ordinate projects with national development plans. All these agencies are now operational. Between 2008 and 2013, RDAs transferred around USD 350 million to the private sector to contribute to capacity building, productivity growth and structural change in local business sectors.
The experience of the Mevlana Regional Development Agency highlights this potential. The agency serves the Konya-Karaman region in Central Anatolia.* It’s “Draft Regional Plan 2014-2023”, drawn up in co-operation with local stakeholders, sets out a regional strategic goal, offers bottom-up plan elaboration and revision procedures, and proposes co-operative implementation techniques with the private sector (Mevlana Kalkinma Ajansi, 2013).
The overall goal for the region is to “integrate further with the global economy and become an attractive place for work, wealth creation and living in an hospitable environment”. The upgrading of local businesses is emphasised as the main engine to achieve this objective. The RDA has involved many actors from the highly dispersed industrial fabric in elaborating the plan, which discusses local strengths and weaknesses in detail and outlines desirable local development initiatives. Some key goals are:
1) Small, family firms are not sufficiently institutionalised. “Family constitutions” are advocated to accelerate the absorption of modern management techniques.

ECO/WKP(2014)57
28
2) New financing sources available in Turkey are not sufficiently mobilised in Konya. This includes modern trade finance, venture capital and international joint ventures. More transparent financial reporting is needed.
3) The present sectoral diversity is welcome and, for this reason, horizontal development initiatives should have priority. Still, more vertical co-operation, shared know-how acquisition, common training, and joint procurement activities between firms operating in similar sectors is desirable. The potential is particularly large in the agro-food, machinery and car component sectors.
4) Organised industrial zones and small industrial sites are already well-developed. They should be further built on to upgrade the local business environment, including in specific domains and clusters.
5) The universities and vocational schools are key resources for long-term growth. The share of secondary students in vocational education is already above the national average and the five universities are expanding. Yet, links with local businesses are not deep enough and should be developed.
6) Exporters manage to cope with the region’s landlocked geography. More competitive transportation and logistics services will be crucial for future growth.
* The Konya region covers 50 000 km2 – more than several OECD economies – but accounts for only 3% of Turkey’s total population and GDP. It was originally a vast agricultural zone (“Turkey’s wheat warehouse”) but has become a successful Anatolian Tiger region over the past two decades, with growth led by export-oriented manufacturing. It now has a highly diversified industrial structure and many dynamic SMEs.
Modern impact assessment techniques are beginning to be implemented in Turkey (Hirschleifer et al., 2014) and they could be extended to SME support schemes, which attract expanding public resources and have a potential to contribute to structural change. Together with KOSGEB programmes, investment incentives and other SME support schemes should be evaluated with a view to identify the most effective schemes. The “R&D, Innovation and Entrepreneurship Co-ordination Committee”, chaired by TÜBİTAK, has already initiated such an evaluation. Turkey has also introduced “Regulatory Impact Assessment” procedures in line with EU legislation and these can help evaluate SME programmes.
The institutionalisation and growth of firms in the higher strata of the business sector also deserve close policy attention. Further corporatisation of first-generation entrepreneurial businesses, further institutionalisation of large family firms, and further expansion of stock market-listed enterprises, including fully foreign-owned firms, hold huge potential. Turkey has still too limited a share of such enterprises in total business sector employment. Facilitating their development would help drive up productivity gains, job creation and social inclusion.
For more corporatised and institutionalised enterprises to flourish, policy action is needed in three areas: i) aligning the regulatory framework for doing business with OECD product and labour market benchmarks ; ii) replacing non-compliance with rules by small firms with modern labour market rules applicable to all, in order to overcome the current tension between flexibility and productivity; and iii) enforcing business taxation in fully transparent and uniform ways for all firms, irrespective of size and other attributes, so that higher productivity firms can grow without being held back by tax considerations.
Making the formal regulatory framework more friendly for modern business organisations
The business sector has grown successfully on a broad sectoral and geographical basis but without a fully supportive regulatory framework for doing business. Prevailing regulations in product and labour markets, inherited from earlier periods, do not appear conducive to the free development of modern businesses in an entirely open and flexible environment in line with OECD good practices (Figures 12 and 14). They feature complex licencing rules for market entry, a limited role for competition policy, restricted competition in network industries and public procurement, and rigid employment rules geared to life-time employment. Despite improvements in the 2000s, OECD regulatory indicators, as well as World Bank doing business and governance benchmarks, World Economic Forum International Competitiveness
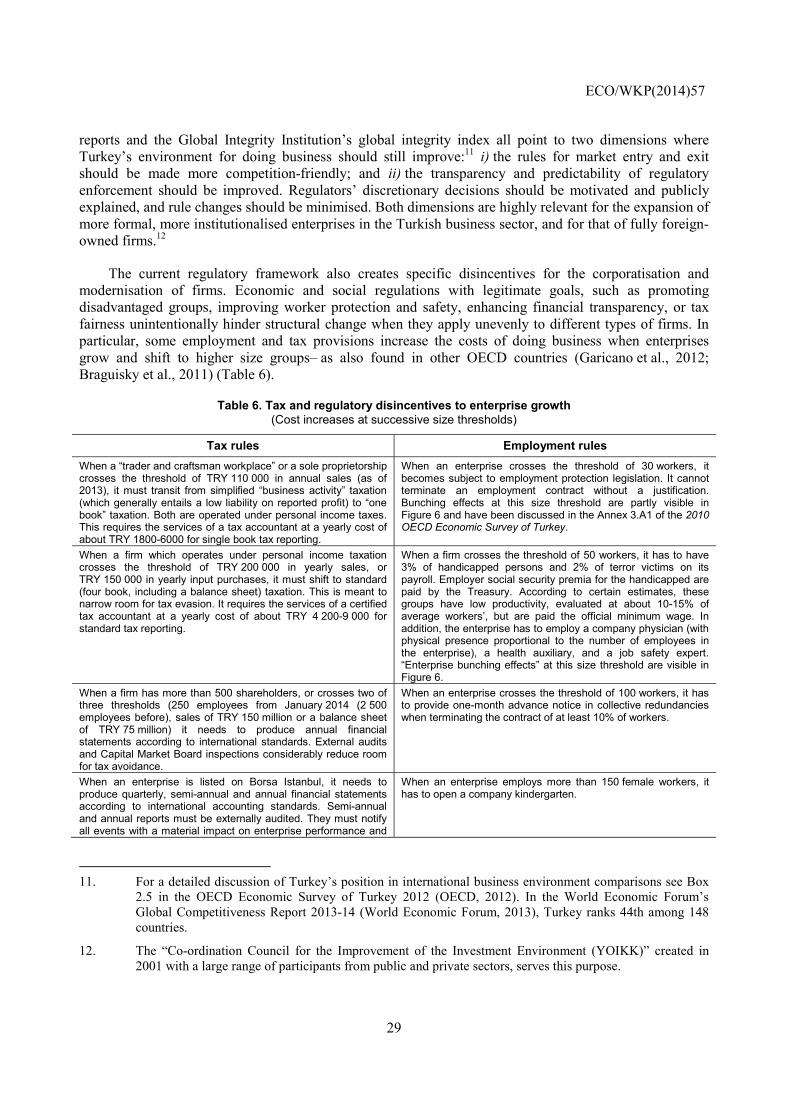
ECO/WKP(2014)57
29
reports and the Global Integrity Institution’s global integrity index all point to two dimensions where Turkey’s environment for doing business should still improve:11 i) the rules for market entry and exit should be made more competition-friendly; and ii) the transparency and predictability of regulatory enforcement should be improved. Regulators’ discretionary decisions should be motivated and publicly explained, and rule changes should be minimised. Both dimensions are highly relevant for the expansion of more formal, more institutionalised enterprises in the Turkish business sector, and for that of fully foreign-owned firms.12
The current regulatory framework also creates specific disincentives for the corporatisation and modernisation of firms. Economic and social regulations with legitimate goals, such as promoting disadvantaged groups, improving worker protection and safety, enhancing financial transparency, or tax fairness unintentionally hinder structural change when they apply unevenly to different types of firms. In particular, some employment and tax provisions increase the costs of doing business when enterprises grow and shift to higher size groups– as also found in other OECD countries (Garicano et al., 2012; Braguisky et al., 2011) (Table 6).
Table 6. Tax and regulatory disincentives to enterprise growth
(Cost increases at successive size thresholds)
Tax rules Employment rules
When a “trader and craftsman workplace” or a sole proprietorship crosses the threshold of TRY 110 000 in annual sales (as of 2013), it must transit from simplified “business activity” taxation (which generally entails a low liability on reported profit) to “one book” taxation. Both are operated under personal income taxes. This requires the services of a tax accountant at a yearly cost of about TRY 1800-6000 for single book tax reporting.
When an enterprise crosses the threshold of 30 workers, it becomes subject to employment protection legislation. It cannot terminate an employment contract without a justification. Bunching effects at this size threshold are partly visible in Figure 6 and have been discussed in the Annex 3.A1 of the 2010 OECD Economic Survey of Turkey.
When a firm which operates under personal income taxation crosses the threshold of TRY 200 000 in yearly sales, or TRY 150 000 in yearly input purchases, it must shift to standard (four book, including a balance sheet) taxation. This is meant to narrow room for tax evasion. It requires the services of a certified tax accountant at a yearly cost of about TRY 4 200-9 000 for standard tax reporting.
When a firm crosses the threshold of 50 workers, it has to have 3% of handicapped persons and 2% of terror victims on its payroll. Employer social security premia for the handicapped are paid by the Treasury. According to certain estimates, these groups have low productivity, evaluated at about 10-15% of average workers’, but are paid the official minimum wage. In addition, the enterprise has to employ a company physician (with physical presence proportional to the number of employees in the enterprise), a health auxiliary, and a job safety expert. “Enterprise bunching effects” at this size threshold are visible in Figure 6.
When a firm has more than 500 shareholders, or crosses two of three thresholds (250 employees from January 2014 (2 500 employees before), sales of TRY 150 million or a balance sheet of TRY 75 million) it needs to produce annual financial statements according to international standards. External audits and Capital Market Board inspections considerably reduce room for tax avoidance.
When an enterprise crosses the threshold of 100 workers, it has to provide one-month advance notice in collective redundancies when terminating the contract of at least 10% of workers.
When an enterprise is listed on Borsa Istanbul, it needs to produce quarterly, semi-annual and annual financial statements according to international accounting standards. Semi-annual and annual reports must be externally audited. They must notify all events with a material impact on enterprise performance and
When an enterprise employs more than 150 female workers, it has to open a company kindergarten.
11. For a detailed discussion of Turkey’s position in international business environment comparisons see Box
2.5 in the OECD Economic Survey of Turkey 2012 (OECD, 2012). In the World Economic Forum’s Global Competitiveness Report 2013-14 (World Economic Forum, 2013), Turkey ranks 44th among 148 countries.
12. The “Co-ordination Council for the Improvement of the Investment Environment (YOIKK)” created in 2001 with a large range of participants from public and private sectors, serves this purpose.

ECO/WKP(2014)57
30
publish a quarterly strategic report.
The policy goals motivating these provisions should be pursued without discouraging enterprise growth. The size distribution of enterprises shown on Figure 6, and some evidence discussed in Annex 3.A1 of the 2010 OECD Economic Survey of Turkey, suggest that part of the enterprises refrain from going over the 30 and 50 worker thresholds. Policymakers could pursue two avenues to improve size neutrality: i) make further use of organised industrial zones to provide targeted social services to the employees of small and large enterprises alike (such as health, safety, child care and so forth), and ii) make use of the tax and subsidy system to facilitate the employment of targeted social groups, rather than by imposing hiring obligations on certain types (sizes) of firms.
Adopting labour market rules applicable to all firms
Turkey has a highly rigid and costly labour regulatory framework, which was described in detail in the previous OECD Economic Surveys (OECD, 2010, 2012). The 2013 update of OECD’s employment protection legislation (EPL) indicators confirmed that, in crucial areas such as temporary employment, employment through work agencies, and severance costs, Turkey has still some of the OECD’s most rigid rules (OECD, 2013). The ratio of the minimum to the median wage also remains the highest OECD-wide (Figure 14).
Figure 14. High unit labour costs encourage informality
Note: NUTS 2 regions.
-20 -15 -10 -5 0 50.5
1.0
1.5
2.0
2.5
3.0
3.5
4.0
Protection of workers against individual and collective dismissals, 2008 Scale 0 to 6 - from least to most restrictive
A. Employment regulations and unit labour costs
Relative unit labour costs in manufacturing 2007-10 % change
AUS
AUT
BEL
CAN
CHL
CZE
DNK
EST
FIN
FRA
DEU
GRC
HUNISL
IRLISR
ITA
JPN
KOR
LUXMEX
NLD
NZL
NOR
POL
PRT
SVK
SVN
ESP
SWE
CHE
TUR
GBR
USA
0
10
20
30
40
50
60
70
80 %
B. Minimum wages as a percentage of median wages, 2012
ES
TC
ZE
US
AJP
NLU
XK
OR
GR
CE
SP
CA
NP
OL
NLD
SV
KG
BR
IRL
BE
LA
US
HU
NIS
RP
RT
SV
NN
ZL
FR
AC
HL
TU
R
0 2 4 6 8 10 12 1410
20
30
40
50
60 %
10
20
30
40
50
60 %
C. Informality in different regions Share of informal employment outside agriculture, 2012
Gross value added per capita, 2004 Thousand TRY
Van Sanliurfa
Mardin
Agri
Gaziantep Adana
HatayMalatya AydinKonya
Kayseri
Kastamonu
Balikesir Izmir
Tekirdag
Kirikkale Antalya
SamsunZonguldak
ManisaErzurumTrabzonKocaeli Istanbul
Bursa
Ankara
ECO/WKP(2014)57
31
Source: OECD Economic Outlook 93 Database; OECD Employment Database and Turkstat.
These aspects of the regulatory framework have major implications for the operation of the business sector: i) they push up unit labour costs and undermine the international competitiveness of formal firms, which are the most export-oriented part of the economy and have the highest potential of participating in global value chains; ii) they stimulate informality (the share of informal jobs declined from 50% in the economy as a whole and 35% outside agriculture in the early 2000s, but is still around 36% in the entire economy and 22% outside agriculture in 2013); and iii) as informality is easier to achieve in small firms, they tend to trap business activities in lower-productivity units.
The existence of informality creates a trade-off between cost competitiveness and flexibility on the one hand (mainly available to informal and semi-formal businesses) and scale economies and other productivity drivers on the other hand (more accessible to formal firms). To overcome the tension, informality should be minimised by modern labour market rules applicable to all firms. High productivity and law-abiding firms can then grow naturally, and employ a higher share of the labour force, without losing their flexibility.
A comprehensive labour market reform agenda (National Employment Strategy) was published in May 2014. It aims at protecting workers rather than jobs and at supporting the shift of employment to higher-productivity firms. A first draft was made public in 2012 (Ministry of Labour, 2012) and it was included as a strategic priority in the 10th Development Plan 2014-2018 (Ministry of Development, 2013a). This strategy is in line with OECD good practices, as it includes a strong emphasis on human capital and skills, special attention to vulnerable groups, an emphasis on dialogue with social partners and a reform of labour legislation. It proposes to make all modern employment forms legal: permanent labour contracts with severance saving accounts (more secure for workers, and potentially more affordable for enterprises), temporary employment, employment through work agencies, employment at call and home-based work (Box 7).
Box 7 The National Employment Strategy
The National Employment Strategy was published in the Official Gazette in May 2014 (Ministry of Labour, 2014). It includes four priorities: i) reinforcing the links between education and employment; ii) enhancing protection and flexibility in the labour market; iii) improving the employability of disadvantaged groups, and iv) making social protection more employment friendly. It sets quantitative goals for 2023: increasing the employment rate from 47% in 2012 to 55%, the female participation rate from 28% to above 40%, and reducing informal employment outside agriculture to 15%. The principle of “flexicurity” is emphasised as the “foundation” of the strategy. Specific measures to adapt worker skills and available employment contracts to market needs in seven sectors (agriculture, tourism, textiles and clothing, health, finance, construction and information technology) are listed. The enforcement of the strategy calls for legislative changes in labour law, some of which are strongly opposed by social partners. It also requires structural changes in the business sector, to reduce demand for informal employment and increase demand for skilled labour.
Earlier efforts in this direction have faced strong resistance from both unions and employers. The unions argue that actual worker rights and protections – including union representation – being very limited de facto in Turkey, greater employment flexibility and more widespread recourse to non-standard employment forms would generate a regression in industrial relations and in social protection. In turn, semi-formal and informal employers refrain from committing to any employment protection provisions and social protection costs (even reduced) from which they have been de facto exempt to date. Formal employers estimate that transition to a fully-funded severance saving regime is not affordable if contribution rates are not reduced, and if entitlements entrench the excess costs of the present regime. In September 2013 the government announced that it would postpone the discussion on severance payment reform.
ECO/WKP(2014)57
32
In this difficult but decisive area, Turkey should draw lessons from the experience of other Southern European OECD economies. These countries have long faced a similar situation. Rigid and costly labour market rules entailed widespread recourse to informality and semi-formality. These countries found it increasingly difficult to carry on with such a degree of duality in their business sector and labour markets, including under the strengthened legal disciplines of the European Union. At the same time, political economy obstacles prevented reform. Second-best approaches were tried out, such as authorising atypical labour contracts for parts of the economy and of workers, but with unsatisfactory results, as discussed in previous OECD Economic Surveys of Turkey (Box 4.6 of the 2008 Survey and Boxes 3.1 and 3.2 of the 2010 Survey). After the eruption of the global financial crisis, further deterioration in external balances and conditionality in international rescue programmes served to unblock the long-delayed reform process. Southern European economies then started to reform their labour markets, which should gradually take them closer to OECD good practices (Martin and Scarpetta, 2011; OECD 2013d). The challenge for Turkey is to find a smoother and less costly path to reform.
A possible avenue would be to garner stronger social support for complementary social safety nets. As of now, collective social protections, such as income maintenance via unemployment insurance and active labour market policies have still very limited scope in Turkey (Figure 15). More re-training was made available for the unemployed in the past four years – with up to six months full-time training offered by the Turkish Employment Agency (Iskur)13 – but the schemes in place do not offer a credible alternative to enterprise-level job protection, neither for the minority of formal sector insiders nor for the majority of workers aspiring to the same protection. Despite a multiplication of the measures to channel the beneficiaries of social aid to the labour market in recent years, more dependable combinations of income protection and up-skilling opportunities would be needed.
A recent scheme jointly introduced by Iskur and the Union of Chambers (TOBB) is a promising innovation. It will subsidise, on the basis of individual applications by enterprises, the costs of three-month re-training for the unemployed, supplemented by subsidies for one third of their total employment costs for the subsequent four years. The objective is to make training more labour market relevant (Duman, 2014) and re-hiring more attractive for employers. Results from this type of experiences should be evaluated, and efforts concentrated on the most promising schemes.
New programmes should also help reduce the inactivity traps that emerge from imperfect co-ordination between social transfers and active labour market schemes (OECD, 2012; Ministry of Development, 2013a, World Bank 2013a). A new Action Plan is implemented to improve co-operation between Labour and Social Policy Ministries on the basis of shared information on the employment capacity of social aid recipients, in order to mobilise this capacity. 14
13. The number of beneficiaries expanded from 32 000 individuals trained in 2008 to 250 000 in 2011.
According to one ex-post evaluation (Hirshleifer et al., 2014), training made less difference than expected for the re-employment opportunities of beneficiaries. It increased re-employment probabilities in the year following “graduation” but the differential dissipated in the next three years. Certain programmes, notably those offered by private training organisations in areas such as computer-aided accounting, improved the post-training earnings of beneficiaries. However, these programmes concerned the already well-educated.
14. A comprehensive protocol of co-operation was signed between the Ministry of Labour and Social Security and the Ministry of Family and Social Policies in 2012, in order to make social aid more conditional on labour market availability. A further action plan on “Strengthening the link between social aid and employment” is included among the high priority programmes of the National Development Plan 2014-2018.
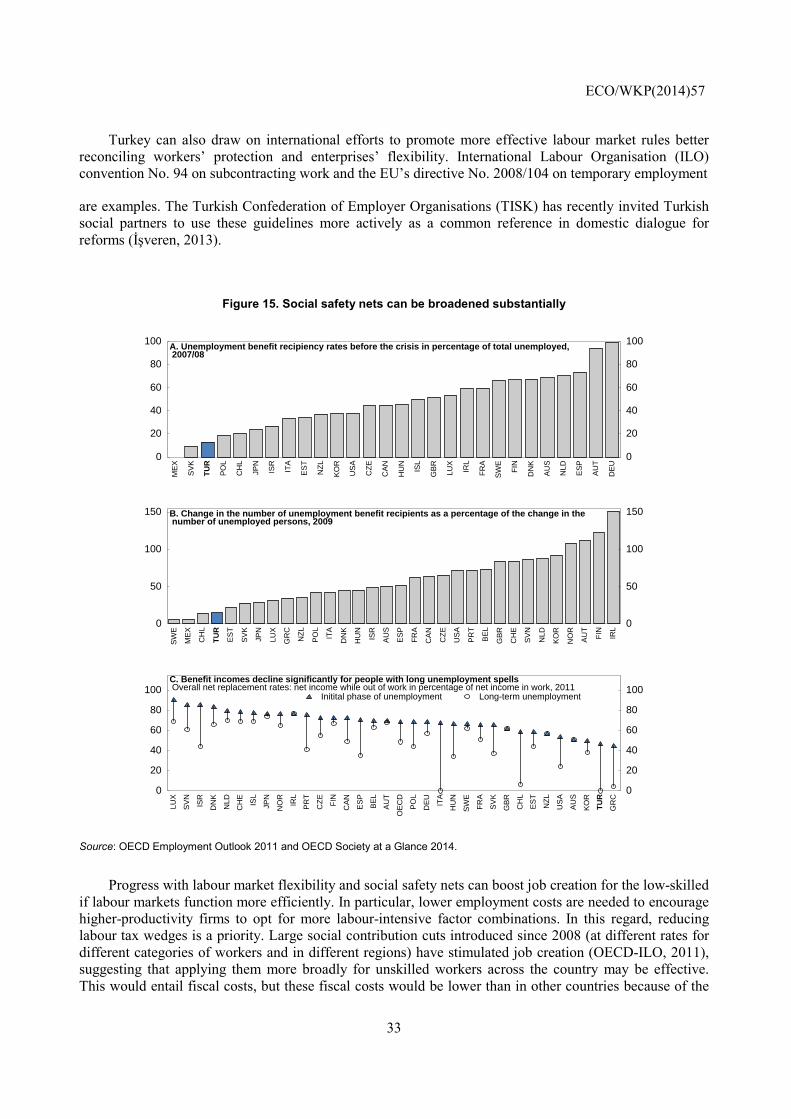
ECO/WKP(2014)57
33
Turkey can also draw on international efforts to promote more effective labour market rules better reconciling workers’ protection and enterprises’ flexibility. International Labour Organisation (ILO) convention No. 94 on subcontracting work and the EU’s directive No. 2008/104 on temporary employment
are examples. The Turkish Confederation of Employer Organisations (TISK) has recently invited Turkish social partners to use these guidelines more actively as a common reference in domestic dialogue for reforms (İşveren, 2013).
Figure 15. Social safety nets can be broadened substantially
Source: OECD Employment Outlook 2011 and OECD Society at a Glance 2014.
Progress with labour market flexibility and social safety nets can boost job creation for the low-skilled if labour markets function more efficiently. In particular, lower employment costs are needed to encourage higher-productivity firms to opt for more labour-intensive factor combinations. In this regard, reducing labour tax wedges is a priority. Large social contribution cuts introduced since 2008 (at different rates for different categories of workers and in different regions) have stimulated job creation (OECD-ILO, 2011), suggesting that applying them more broadly for unskilled workers across the country may be effective. This would entail fiscal costs, but these fiscal costs would be lower than in other countries because of the
0
20
40
60
80
100
0
20
40
60
80
100 A. Unemployment benefit recipiency rates before the crisis in percentage of total unemployed, 2007/08
ME
X
SV
K
TU
R
PO
L
CH
L
JPN
ISR
ITA
ES
T
NZ
L
KO
R
US
A
CZ
E
CA
N
HU
N
ISL
GB
R
LUX
IRL
FR
A
SW
E
FIN
DN
K
AU
S
NLD
ES
P
AU
T
DE
U
0
50
100
150
0
50
100
150 B. Change in the number of unemployment benefit recipients as a percentage of the change in the number of unemployed persons, 2009
SW
E
ME
X
CH
L
TU
R
ES
T
SV
K
JPN
LUX
GR
C
NZ
L
PO
L
ITA
DN
K
HU
N
ISR
AU
S
ES
P
FR
A
CA
N
CZ
E
US
A
PR
T
BE
L
GB
R
CH
E
SV
N
NLD
KO
R
NO
R
AU
T
FIN IRL
0
20
40
60
80
100
0
20
40
60
80
100 C. Benefit incomes decline significantly for people with long unemployment spells Overall net replacement rates: net income while out of work in percentage of net income in work, 2011
LUX
SV
N
ISR
DN
K
NLD
CH
E
ISL
JPN
NO
R
IRL
PR
T
CZ
E
FIN
CA
N
ES
P
BE
L
AU
T
OE
CD
PO
L
DE
U
ITA
HU
N
SW
E
FR
A
SV
K
GB
R
CH
L
ES
T
NZ
L
US
A
AU
S
KO
R
TU
R
GR
C
Initital phase of unemployment Long-term unemployment
ECO/WKP(2014)57
34
scale of informal employment and of a high degree of wage under-reporting, as discussed in the 2006 OECD Economic Survey of Turkey.
Given the large gaps in informality across regions ‒ which are related to differences in skills, productivity and living costs ‒ minimum wages may also be usefully adapted to local circumstances. Lower minimum wages would permit formal employers to hire low-skilled workers without being excessively penalised vis-à-vis informal and international competitors. Turkey had experimented with regional minimum wages in the past, but this had not been found to be satisfactory, notably on social grounds (Şeker and Küçükbayrak, 2012). Still, more socially acceptable ways of adapting the national minimum wage to local circumstances (for instance via locally negotiated adjustments) could be discussed and explored between government, employer and employee representatives at local level. If necessary, this could be combined with additional earned income tax credit type of support (on top of the existing partial personal tax allowances for low-wage workers) to improve workers’ net earnings. Fiscal resource shifts from lower-priority public expenditures and extra fiscal revenues from stronger growth in the formal sector could create fiscal room for such initiatives.
Promoting a level playing field for enterprise taxation
Turkey has made progress in adapting its corporate tax system to international norms. Nonetheless, further reforming business taxation is a priority to spur the development of larger, more corporatised businesses. Both size-dependent formal differences in taxation and actual differences in financial transparency differentiate effective tax burdens for large and small firms. Simplified taxation rules has benefits in Turkey’s circumstances (such as cutting compliance costs and facilitating formalisation), but the magnitude of tax differences seem to have reached distortive proportions. They discourage modern businesses as well as large and indivisible investment projects.
The corporate income tax (CIT) rate was reduced, in steps, from 46% in mid-1990s to 20% by 2006. Only incorporated firms pay corporate taxes. The total number of CIT payers was around 665 000 in 2013. Other businesses are subject to lighter forms of taxation, under personal tax regimes. Most trader and craftsman workplaces pay personal taxes on basis of simplified reporting procedures.15 Many businesses underreport sales to remain eligible for such lighter forms of taxation (Gündüz, 2008).
The administration of business taxation continues to entail enforcement unpredictabilities, despite reform efforts in a new Corporate Income Tax Law adopted in 2006:
• The Tax Code contains only general principles, which are supplemented by communiqués and circulars. Implementation is frequently subject to interpretation, by the taxpayer as well as by tax authorities. This is the case for example for the costs eligible for “expensing”, as well as for
15. According to the Ministry of Commerce 1.5 million traders and craftmen were active in 2013, and
according to the Ministry of Finance 710 000 of them paid personal income tax under “simplified business taxation” (basit usul vergi). Small businesses subject to personal income tax with annual sales below TRY 200 000 are also taxed under the so-called “one-book” system, which generally implies a low effective tax liability.
ECO/WKP(2014)57
35
“transfer pricing” and “thin capitalisation” rules included in the 2006 Law on the basis of OECD best practices. Firms confirm that tax liabilities are often uncertain, implying tax adjustment and penalty risks following inspections.16
• Many enterprises reduce their tax liabilities by hiding part of their tax base. The bulk of CIT is paid by a small number of firms, mostly those listed on the stock exchange. These are subject to strict reporting requirements, to inspections by the Capital Market Board and to external audits. Several other top corporate taxpayers are FDI firms. Available information hints at a very uneven distribution of the CIT among enterprises.17
• The regional and sectoral investment incentives have grown and introduced important differences between the tax liabilities of firms across sectors and regions.18 The resulting web of tax subsidies is intended to offset the excess costs of formal firms, and some of these enterprises are exempted for as much as 50% of their CIT liabilities. The schemes are rule-based but when incentives are subject to assessment and negotiation, such as with “large project incentives”, risks of distortion in domestic competition are unavoidable. Systematic monitoring is in order for all existing incentive schemes, to help assess the degree to which they actually offset the additional employment and tax costs of operating formally, their fiscal costs, and their impact on competition. Such evaluations are technically feasible, thanks to the new State Aid Monitoring Law adopted on the basis of EU guidelines – which, however, has yet to be put in application.
• Tax amnesties increase unpredictability. A large number of them have been decided over recent decades (Şenyurt, 2008). This becomes a form of tax discrimination between firms complying with their tax obligations, and less formal and lower-productivity operators. Small business trade associations are currently demanding a new tax amnesty in 2014, on the grounds that the outstanding tax arrears stand at TL 56 billion (nearly 4% of GDP), and the tax penalties due amount to TL 40 billion (nearly 3% of GDP). If granted, a new amnesty would amount to yet another tax subsidy to less formal businesses.
Unpredictability in business taxation is a source of risk for investors. When the World Economic Forum asked managers of large corporations about their grievances when investing in Turkey, tax issues came very high on the list (WEF, 2011, 2013). In a survey of international governance, Turkey was perceived as lacking good rules and practices in the “enforcement of tax laws uniformly and without discrimination”, ranking behind Italy and Poland, with some perceived weakening over time (Global Integrity, 2010).
The fundamental challenge illustrated by the shortcomings of business taxation is that non-compliance creates an unfair business environment for law-abiding firms. In particular, professionally
16. Private sector testimonies during the OECD Secretariat visit to Turkey on 2-6 December 2013. The World
Bank notes that tax authorities have been developing effective information technology-based tax administration systems, making them faster and more efficient but also that these developments have not yet completely achieved their purpose as with each new implementation, new requirements have also been introduced, which has in turn generated new bureaucratic procedures (World Bank, 2012).
17. In 2012, nearly half of total CIT proceeds of TL 29 billion was paid by the 100 largest CIT contributors. Among these, 7 banks alone paid TL 7 billion, 24% of total CIT proceeds. For the first 100 contributors, the ratio between CIT paid and value-added was about 10%. For the rest of CIT contributors, it fell to an estimated 1.6% (OECD Secretariat calculations). It is assumed in these calculations that half of the firms employing between 1 and 20 workers are liable to the “simplified business activity tax” and not to the CIT.
18. This investment incentive system, which has taken shape between 2004 and 2012, was described in the 2012 OECD Economic Survey of Turkey (OECD, 2012).
ECO/WKP(2014)57
36
managed organisations operating under rigorous internal control systems are not well-equipped to further their interests in such administrative settings. Risks of corruption and rent-seeking also unavoidably arise in an environment where regulatory compliance is not systematic. Irrespective of policymakers’ intentions, departures from level-playing field, rule-based governance tend to undermine trust. The problem is particularly acute for institutionalised businesses such as FDI firms, and may hinder their entry or expansion. This contributes to keeping the share of institutionalised firms small, depriving Turkey of an important source of productivity and employment growth.
Distortion risks arising from business taxation are recognised by the authorities. Consultations for a thorough reform of the system have taken place for a number of years. A “Tax Council” worked on reform proposals through the 2000s, but no consensus was reached. Nonetheless, new ideas and concepts based on international best practices gained visibility among all parties. They all revolve around the principle of broadening the tax base and reducing the tax rates.
A recent assessment of Turkey’s business tax reform agenda in international comparison underlined the critical importance of the tax system for economic performance (Abramovsky et al., 2013). It is essential to preserve the strong entrepreneurial dynamism of the business sector, in particular of the first-generation businesses of less advanced regions which have been serving broad-based and socially inclusive growth well. This entrepreneurial momentum has arguably been backed by the low effective income tax rates. Such incentives should be preserved for all firms.
There is certainly merit, in Turkey’s circumstances, in facilitating the taxation of very small businesses in order to ease their compliance and encourage their joining the formal sector. Even so, such provisions and their enforcement should minimise transition costs between enterprise sizes, and should not become a trap. This requires re-examining the many concessions for small businesses and further unifying the system. Efforts in this area can draw on the Ministry of Finance’s rapidly developing and efficient information technology infrastructure.
There are also many recent and ongoing efforts to utilise the tax system proactively to stimulate restructuring and productivity gains in the business sector. In addition to the sectoral and regional incentives mentioned above, a range of tax incentives for various research, technology and innovation activities have been put in place. To help maximise benefits from these schemes, while reducing the risks of distortion in competition and resource allocation, the experience of the private sector may be better utilised. To this effect, consultations such as those initiated in the Tax Council could be resumed.
The 10th Development Plan 2014-2018 emphasises industrialisation and productivity growth as two main drivers of Turkey’s future growth. Further increases in the country’s human capital will condition these changes, as emphasised in recent OECD Surveys. The 10th Plan underlines that improving women’s still low labour force participation, which requires further improvements in education, will also be a key driver of growth and social inclusion. Estimates produced in the context of the 10th Plan suggest that reforms along these lines could increase Turkey’s trend real GDP growth rate by more than one percentage point (Usta, 2014). However, for this to happen, additional structural transformation in the business sector will be necessary. Resources should flow from the present myriad low-productivity activities to more efficient industrial and business organisations. The latter would create more productive, higher-income and more human capital-enhancing jobs, including for the presently disadvantaged social groups. Thus, the microeconomic reforms discussed in this paper are crucial for Turkey to achieve its growth and social inclusion objectives.
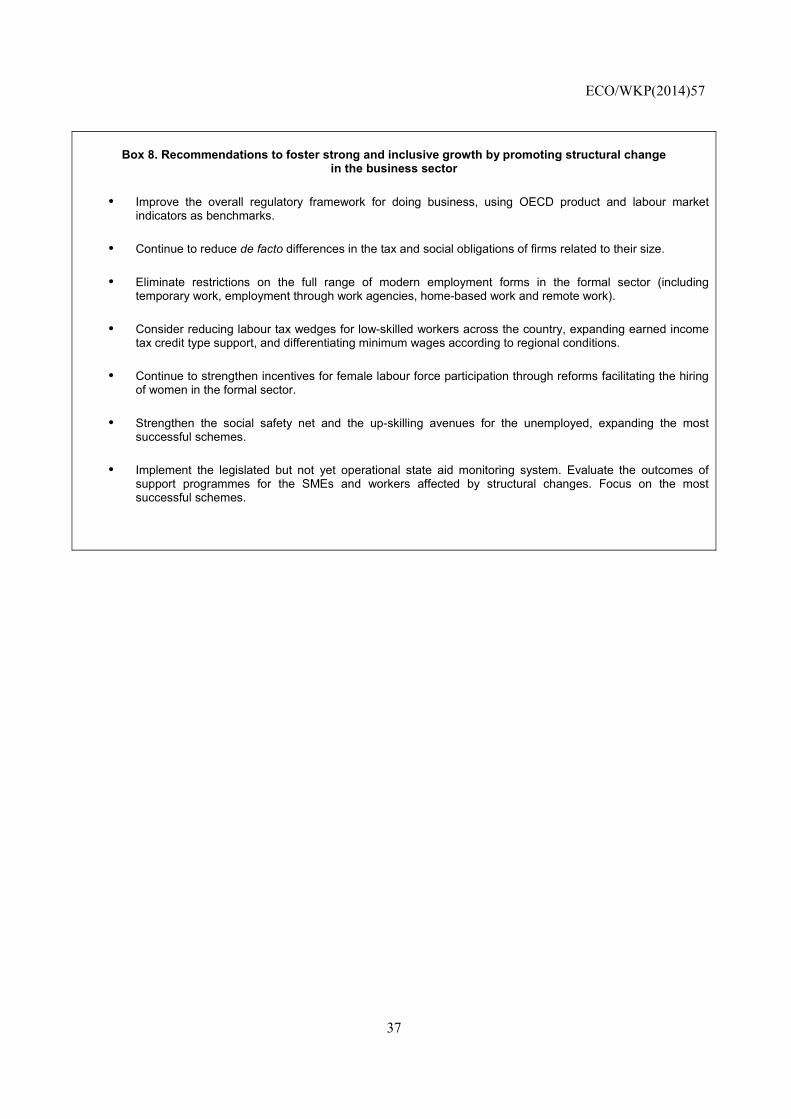
ECO/WKP(2014)57
37
Box 8. Recommendations to foster strong and inclusive growth by promoting structural change in the business sector
• Improve the overall regulatory framework for doing business, using OECD product and labour market indicators as benchmarks.
• Continue to reduce de facto differences in the tax and social obligations of firms related to their size.
• Eliminate restrictions on the full range of modern employment forms in the formal sector (including temporary work, employment through work agencies, home-based work and remote work).
• Consider reducing labour tax wedges for low-skilled workers across the country, expanding earned income tax credit type support, and differentiating minimum wages according to regional conditions.
• Continue to strengthen incentives for female labour force participation through reforms facilitating the hiring of women in the formal sector.
• Strengthen the social safety net and the up-skilling avenues for the unemployed, expanding the most successful schemes.
• Implement the legislated but not yet operational state aid monitoring system. Evaluate the outcomes of support programmes for the SMEs and workers affected by structural changes. Focus on the most successful schemes.
ECO/WKP(2014)57
38
BIBLIOGRAPHY
Abramovsky, L., P. Johnson and D. Phillips (2013), “Tax Design in Turkey and Other Middle Income Countries: Lessons from the Mirrlees Review”, Koç University and TUSIAD Economic Research Forum Research Report Series.
Acar, O. and E. Caglar (2012), “Yeni Tesvik Paketi Uzerine Bir Degerlendirme” (An Evaluation of the New Incentive System), TEPAV Politika Notu, No. 01221, Nisan.
Acemoglu, D., U. Akcigit, N. Bloom and W. Kerr (2013), “Innovation, Reallocation and Growth”, NBER Working Papers, No. 18993.
Aldan, M.C. and E. Cakmak (2011), “Turkiyede Tarim Istihdami ve Bolgesel Farkliliklar” (Regional Differences in Agricultural Employment), Kalkinmada Bolgesel Dinamikler Sempozyumu Tutanaklari (Proceedings of Regional Development Symposium), SEDETEF, Istanbul.
Almedia, R. and P. Carneiro (2008), “Enforcement of Labour Regulation and Firm Size”, World Bank Special Protection and Labour Working Papers, No. 43675.
Alper, Y. (2014), “Turk Sosyal Guvenlik Sisteminin Yeni Dinamik Alani: Sosyal Yardimlar ve Hizmetler” (New Frontier in Social Protection: Transfers and Services), Isveren, January-February.
Altomonte, C., T. Aquilante and G. Ottaviano (2012), The Triggers of Competitiveness: The EFIGE Cross-Country Report, Bruegel Blueprint Series, Brussels.
Andrews, D. and C. Criscuolo (2013), “Knowledge Based Capital, Innovation and Resource Allocation”, OECD Economics Department Working Papers, No. 1046.
Andrews, D. and F. Cingano (2014), “Public Policy and Resource Allocation: Evidence from Firms in OECD Countries”, Economic Policy, forthcoming.
Armagan, R. (2007), Turkiyede Gelir ve Kurumlar Vergisi Oranlarinda Indirimin Vergi Gelirleri Uzerine Etkileri (The Impact of Income and Corporate Tax Reductions on Tax Revenues in Turkey), Süleyman Demirel Üniversitesi İktisadi ve İdari Bilimler Fakültesi Yayini.
Atiyas, I, O. Bakis, M. Dutz, F. Rowe and S. O’Connell (2014), “Enterprise Growth in Turkey in the 2000s: A Story of Structural Change and Regional Convergence?”, World Bank Staff Working Paper, forthcoming.
Azevedo, J.P. and A. Atamanov (2014), “Pathways to the Middle Class in Turkey: How Have Reducing Poverty and Boosting Shared Prosperity Helped?”, World Bank Policy Research Working Papers, No. 6834.
Balakrishnan, R., C. Steinberg and M. Syed (2013), “The Elusive Quest for Inclusive Growth: Growth, Poverty and Inequality in Asia”, IMF Working Papers, No. 13/13/152.
Baldwin, R. (2012), “WTO 2.0: Global Governance of Supply-Chain Trade”, CEPR Policy Insight, No. 64.
ECO/WKP(2014)57
39
Balkan, B., S. Başkaya and S. Tümen (2013), “2008 Istihdam Teşvik Programinin Etkileri” (The Impacts of the 2008 Employment Subsidy Programme), Central Bank of the Republic of Turkey Research Notes, 13/29.
Bartelsman E., J. Haltiwanger and S. Scarpetta (2013), “Cross-Country Differences in Productivity: The Role of Allocation and Selection” , American Economic Review, No. 103.
Bartelsman, E. (2013), “ICT, Reallocation and Productivity”, European Economy - Economic Papers, No. 486.
Bassanini, A., L. Nunziata and D. Venn (2009), “Job Protection Legislation and Productivity Growth in OECD Countries”, Economic Policy, Vol. 24, Issue 58.
Betcherman, G. (2014), “Labour Market Regulations: What Do We Know about Their Impacts in Developing Countries?”, World Bank Policy Research Working Papers, No. 6819.
Bloom, N. and J. Van Rennen (2010), “Why Do Management Practices Differ across Firms and Countries?”, Journal of Economic Perspectives, Winter.
Bozkaya, A. and W. Kerr (2009), “Labour Regulations and European Private Equity”, NBER Working Papers, No. 15627.
Braguisky, S., L. Branstetter and A. Regateiro (2011), “The Incredible Shrinking Portuguese Firm”, NBER Working Papers, No. 17265.
Bravo Biosca, A. (2010), Growth Dynamics: Exploring Business Growth and Contraction in Europe and the US, NESTA Research report, London.
Çanakçı, I. (2014), “Suggested Actions and Policy Recommendations” (Presentation to the G20 Small and Medium Enterprises Workshop), mimeo, 11-12 March, Riyadh.
Criscuolo, C. P. Gal and C. Menon (2014), “The Dynamics of Employment Growth: New Evidence from 18 Countries”, OECD Science, Technology and Industry Policy Papers, No. 14.
Duman, A. (2014), Labour Market Institutions, Policies, and Performance: Flexibility and Security in Turkey, Economic Research Forum Research Report Series No. 14-01.
Dunya (2014), Teknoloji sirketleri gozunu ABD’ye dikti (Technology firms target the US), 10 March.
Duryea, S., G. Marquez, C. Pages and S. Scarpetta (2006), “For Better or for Worse? Job and Earnings Mobility in Nine Middle- and Low-Income Countries”, in Brookings Trade Forum: Global Labour Markets 2006, Brookings Institution Press, Washington DC.
Ercan, H. (2011), “Turkiyede Mesleki Gorunum” (Professional Profile of the Labour Force), mimeo, ILO Ankara Ofisi.
European Training Foundation (2011), Flexicurity Analysis of the Labour Market in Turkey, Torino.
Finn, D., R. Grun, K. Herrera-Sosa, H. Immerwoll, C. Ridao-Cano, G. Uysal and L. Yener (2013), Activating Vulnerable People into Good Jobs in Turkey, Report No. 83889 – TR, World Bank, Ankara.
ECO/WKP(2014)57
40
Foster, L., J. Haltiwanger and C. Krizan (2001), “Aggregate Productivity Growth: Lessons from Microeconomic Evidence”, NBER Working Papers, No. 6803.
Garicano L., C. LeLarge and J. Van Reenen (2012), “Firm Size Distortions and the Productivity Distribution: Evidence from France”, Center for Economic Performance Papers, No. 1128.
Global Integrity (2010), Global Integrity Report: Innovations for Transparency and Accountability, www.globalintegrity.org.
Gündüz, Z. (2008), “Turkiyede Vergi Nasil Kaçiriliyor?” (How Does Tax Evasion Occur in Turkey?), mimeo, PriceWaterhouseCoopers, Istanbul.
Gürsel, S. and Z. Imamoglu (2013), “Why is Agricultural Employment Increasing in Turkey?”, BETAM Working Paper Series, No. 4, Bahçeşehir University.
Gürsel, S. (2013), “The Decline of Poverty”, Today’s Zaman, 2 August.
Haltiwanger, J., R. Jarmin and J. Miranda (2013), “Who Creates Jobs? Small vs. Large vs. Young”, Review of Economics and Statistics, Vol. 95, Issue 2.
Hasan, R. and K. Jandoc (2010), “The Distribution of Firm Size in India: What Can Survey Data Tell Us?”, Asian Development Bank Working Papers, No. 213.
Hirshleifer, S., D. McKenzie, R. Almeida and C. Ridao-Cano (2014), “The Impact of Vocational Training for the Unemployed – Experimental Evidence from Turkey”, IZA Discussion Papers, No. 8059.
Hoeller, P., I. Joumard, M. Pisu and D. Bloch (2012), “Less Income Inequality and More Growth – Are They Compatible? Part 1. Mapping Income Inequality Across the OECD”, OECD Economics Department Working Papers, No. 924, OECD Publishing.
Hsieh, C.-T. and B. Olken (2014), “The Missing ‘Missing Middle’”, NBER Working Papers, No. 19966.
Istanbul Sanayi Odasi (2013), Istanbul Chamber of Industry’s Top-1000 firms data base (special data extraction for OECD).
İşveren (2013), Alt Isveren Uygulamalari: Ozel Dosya (Special Issue on Subcontracting), Eylul-Ekim.
Jütting, J. and J. de Laiglesia, eds (2009), Is Informal Normal? Towards More and Better Jobs in Developing Countries, Development Centre Studies, OECD Publishing.
Kalkinma Bakanligi (2013), “Isgucu Piyasasindaki Gelismelerin Makro Analizi” (Macroeconomic Analysis of Labour Market Developments), Ekonomik Modeller ve Stratejik Arastirmalar Genel Mudurlugu”, mimeo, Aralik.
Kanik, B., E. Sunel and T. Taskin (2013), “Unemployment and Vacancies in Turkey: The Beveridge Curve and Matching Function”, Central Bank of the Republic of Turkey Working Paper No. 13/35.
Lehmann, H. and N. Pignatti, “Informal Employment Relationships and Labour Market Segmentation in Transition Economies: Evidence from Ukraine”, IZA Discussion Papers, No. 3269.
Martin, J. and S. Scarpetta (2011), “Setting it Right: Employment Protection, Labour Reallocation and Productivity”, De Economist, Vol. 160, No. 2.
ECO/WKP(2014)57
41
McMillan, M. and D. Rodrik (2011), “Globalization, Structural Change, and Productivity Growth”, NBER Working Papers, No. 17143.
Mevlana Kalkinma Ajansi (2013), “Konya-Karaman Bolgesi 2014-2023 Bolge Taslak Plani” (Draft Regional Economic Plan for 2014-2023), Konya.
Ministry of Development (2013a), 10. Kalkinma Plani (10th Development Plan) 2014-2018, Ankara.
Ministry of Development (2013b),10. Kalkinma Plani Ozel Ihtisas Komisyonu Raporu: KOBI’lerin ve Esnaf ve Sanatkarlarin Guclendirilmesi (Report of Special Commission on SMEs), Ankara.
Ministry of Development (2013c), 10. Kalkinma Plani Ozel Ihtisas Komisyonu Raporu: Imalat Sanayiinde Donusum (Report of Special Commission on Industrial Change), Ankara.
Ministry of Industry and Technology (2010), Turkiye Sanayi Stratejisi Belgesi, 2011-2014 (Turkey Industrial Strategy Document, 2011-2014), Sanayi ve Teknoloji Bakanligi, Ankara.
Ministry of Industry and Technology (2011) KOBI Stratejisi ve Eylem Plani, 2011-2013 (SME Strategy and Action Plan), Sanayi ve Teknoloji Bakanligi, Ankara.
Ministry of Labour (2012), Ulusal Istihdam Stratejisi Taslagi (2012-2023) (Draft National Employment Strategy, 2012-2023), Ankara.
Ministry of Labour (2014), Ulusal Istihdam Stratejisi (2012-2023) (National Employment Strategy, 2012-2023), Ankara.
MUSIAD (2013), Turkiye Ekonomisi Raporu: Buyumenin Finansmani (Annual Economic Report: Funding Growth), Istanbul.
OECD (2006a), OECD Economic Survey of Turkey, OECD Publishing, Paris.
OECD (2006b), Tax Policy Reforms in Turkey, Centre for Tax Policy and Administration, Paris.
OECD (2008), OECD Economic Survey of Turkey, OECD Publishing, Paris.
OECD (2010a), OECD Economic Survey of Turkey, OECD Publishing, Paris.
OECD (2010b), High-Growth Enterprises: What Governments Can Do to Make a Difference, OECD Studies on SMEs and Entrepreneurship, OECD Publishing.
OECD (2012), OECD Economic Survey of Turkey, OECD Publishing, Paris.
OECD (2013a), Interconnected Economies – Benefitting from Global Value Chains, OECD Publishing, Paris.
OECD (2013b), Employment Outlook, OECD Publishing, Paris.
OECD (2013c), Science, Technology and Industry Scoreboard, OECD Publishing, Paris.
OECD (2013d), Economic Outlook, Fall [Box 1.3. Progress on structural reform in the vulnerable euro area countries], OECD Publishing, Paris.
ECO/WKP(2014)57
42
OECD (2013e), Crisis Squeezes Income and Puts Pressure on Inequality and poverty – New Results From the OECD Income Distribution Database, http://www.oecd.org/social/soc/OECD2013-Inequality-and-Poverty-8p.pdf
OECD (2013f), “FDI Restrictiveness Index, 2013”, http://www.oecd.org/investment/fdiindex.htm.
OECD-ILO (2010), “Turkey – Supporting Employment Through Reduced Social Security Contributions”, Country Policy Brief, G-20 Meeting of Labour and Employment Ministers, 26-27 September, Paris.
Otonglo, C. and T. Trumbic, Giving a Facelift to the Turkish Tax System, Paying Taxes Case Study: Turkey, World Bank, Washington D.C.
Özmen, E., S. Şahinöz and C. Yalçın (2012), “Profitability, Saving and Investment of Non-Financial Firms in Turkey”, CBRT Working Papers, No. 12/14.
Polat, A. and M. Yeşilyaprak (2014), The Importance of Subjective Criteria in Credit Ratings Under Informality: An Analysis of Participation Banking in Turkey”, Işletme ve Finans, February.
Rodrik, D. (2013a), “Unconditional Convergence in Manufacturing”, Quarterly Journal of Economics, Vol. 128, No. 1.
Röhn, O., R. Gönenç, V. Koen and E. Erdoğan Coşar (2014), “Reducing Macroeconomic Imbalances in Turkey”, OECD Economics Department Working Papers, No. 1160.
Sak, G. (2014), “Bakkalimiz dimdik ayakta duruyor” (Small groceries survive), Radikal, 21 January.
Saygili, S. (2013), “Orta Gelir Tuzagindan Kurtulmada Verimliligin Rolu” (The Role of Productivity in Overcoming the Middle-Income Trap), IV. National Productivity Congress, mimeo, Ankara.
Saygılı, Ş., C. Cihan, C. Yalçın and T. Hamsici (2012), “Turk Imalat Sanayiinde Ithal Girdi Kullanimi” (Imported Input Utilisation in Turkish Manufacturing Industry), İktisat İşletme Finans, No. 27(321), Ankara.
Şeker S. and Küçükbayrak M. (2012), Turkiyede Bölgesel Asgari Ucretin Uygulanabilirliği” (Feasibility of Regional Mínimum Wages in Turkey), Ministry of Development Labour Market Working Paper No. 1, Ankara.
Șeker, S. and S. Jenkins (2013), “Poverty Trends in Turkey”, IZA Discussion Papers, No. 7823.
Stillman, J. (2013), “From the Bay Area to the Bosphorus: Getting to Know the Istanbul Startup Scene”, www.forbes.com/sites/
Stovicek, K. and A. Turrini (2012), “Benchmarking Unemployment Benefit Systems”, European Economy Economic Papers, May, Brussels.
Tansel, A. and E. Kan (2012a), “Labour Mobility across the Formal/Informal Divide in Turkey: Evidence from Individual Level Data”, IZA Discussion Papers, No. 6271.
Tansel, A. and E. Kan (2012b), “The Formal/Informal Employment Earnings Gap: Evidence From Turkey”, Economic Research Center Working papers in Economics, 12/04, Middle East Technical University, Ankara.
ECO/WKP(2014)57
43
Taşkin, T. (2014), “GDP Growth in Turkey: Inclusive or Not?”, Central Bank Review, forthcoming.
Turkstat (2014), “Gelir ve Yasam Kosullari Arastirmasi Veri Tabani, 2006-2012”, (Survey of Income and Living Conditions Data Base, 2006-2012), Ankara.
Tuna, Y. (2014), “Yoksullukla Mucadelede Sosyal Yardimlar En Son Basvurulan Yontemdir” (Transfers Are Last-resort Tools Against Poverty), Isveren, January-February.
TUSIAD (2013), “Gelir Vergisi Kanunu Calistayi Degerlendirme Raporu” (Proceedings of the Tax Law Workshop), Gelir Vergi Calisma Grubu toplantilar Serisi, Agustos.
Üngör, M. and K. Kalafatçilar (2013), “On the Role of Productivity and Demographics for Growth: The Case of Turkey, 2004-2012”, CBRT Research Notes in Economics, No. 1328.
Usta, E. (2014), “Fiscal Policy in the Perspective of the 10th Development Plan”, Conference on World Bank Public Finance Review, 2 June, mimeo, Ankara. (http://www.kalkinma.gov.tr/Lists/KonusmaMetinleriveSunumlar/Attachments/39/Fiscal%20Policy%20in%20the%20Perpective%20of%20Tenth%20Development%20Plan_01062014.pdf)
Uysal, G. (2013), “Kentlerde Kadinlarin Isgucune Katilimi Artiyor” (Female Labour Force Participation Soars), BETAM Arastirma Notu No. 13/143, Bahcesehir Universitesi, Istanbul.
World Bank, Doing Business Data Base, http://data.worldbank.org/data-catalog/doing-business-database
World Bank (2011), Turkey: Improving Conditions for SME Growth, Finance and Innovation, Private and Financial Sector Report, Washington D.C.
World Bank (2012), Paying Taxes 2012 the Global Picture, PwC and World Bank/IFC, Washington DC.
World Bank (2013), Turkey Managing Labor Markets Through The Economic Cycle, Washington DC.
World Bank (2013a), Activating Vulnerable People into Good Jobs in Turkey, Human Development Sector Unit, Europe and Central Asia Region, Washington, DC.
World Bank, Worldwide Governance Indicators Data Base, http://data.worldbank.org/data-catalog/worldwide-governance-indicators
World Economic Forum (WEF) (2011), The Global Competitiveness Report 2011-2012, Geneva.
World Economic Forum (WEF) (2013), The Global Competitiveness Report 2013-2014, Geneva.
Yazici, N. (2014), “Sosyal Yardimlar ile Istihdam Baglantisi Kurulmali” (Linking Social Transfers and Employment) , Isveren, January-February.
Yeldan, E., K. Taşçi, E. Voyvoda and M. Özsan (2013), Orta Gelir Tuzagindan Cikiş: Hangi Türkiye? (Escaping the Middle Income Trap Across Regions), Vol. 2, Turkonfed (Turkish Enterprise and Business Confederation), Istanbul.
Yeldan, E., K. Tasci, E. Voyvoda and M. Ozsan (2012), Orta Gelir Tuzagindan Cikis: Hangi Turkiye? (Escaping Middle_Income Trap – A Regional Perspective), Vol. 1, Turkonfed, Istanbul.
ECO/WKP(2014)57
44
Yentürk, N. (2013), “Turkiye’de Yoksullara Yonelik Harcamalar” (Anti-Poverty Transfers in Turkey), ODTU Gelisme Dergisi, No. 2, August.
Zenginobuz, U. (2005), A Growth-Oriented Tax Policy for Turkey, The Turkish Enlargement Business Council of the European Round Table of Industrialists, Istanbul.
ECO/WKP(2014)57
45
WORKING PAPERS
The full series of Economics Department Working Papers can be consulted at www.oecd.org/eco/workingpapers
1160. Reducing macroeconomic imbalances in Turkey (September 2014) by By Oliver Röhn, Rauf Gönenç, Vincent Koen and Evren Erdoğan Coşar. 1159. Reinvigorating the EU Single Market (September 2014) by Jean-Marc Fournier. 1158. An exploration of the determinants of the subjective well-being of Americans during the great
recession (August 2014) by Aida Caldera Sánchez and Caroline Tassot. 1157. Boosting the development of efficient SMEs in the Netherlands (September) by Rafał Kierzenkowski and Jochebed Kastaneer 1156. Making the banking sector more resilient and reducing household debt in the Netherlands (September 2014) by Rafał Kierzenkowski, Olena Havrylchyk and Pierre Beynet 1155. US long term interest rates and capital flows to emerging economies (July 2014) by Eduardo Olaberria 1154. Productivity measurement with natural capital and bad outputs (July 2014) by Nicola Brandt, Paul Schreyer and Vera Zipperer 1153. Reducing income inequality and poverty and promoting social mobility in Korea (July 2014) by Randall S. Jones and Satoshi Urasawa 1152. Fostering a creative economy to drive Korean growth (July 2014) by Randall S. Jones and Myungkyoo Kim 1151. Economic uncertainties and their impact on activity in Greece compared with Ireland and
Portugal (July 2014) by Jan-David Schneider and Claude Giorno 1150. Workplace stress in the United States: issues and policies (July 2014) by Michael Darden 1149. Taxing the rent of non-renewable resource sectors: a theoretical note (July 2014) by Julien Daubanes and Saraly Andrade de Sá 1148. Health, work and working conditions: a review of the European economic literature (July 2014) by Thomas Barnay 1147. Making the best of new energy resources in the United States (July 2014) by Douglas Sutherland 1146. Improving well-being in the United States (July 2014) by Aida Caldera Sánchez, Patrick Lenain and Sarah Fléche
ECO/WKP(2014)57
46
1145. Deconstructing Canada’s housing markets: finance, affordability and urban sprawl (July 2014) by Calista Cheung Restructurer les marchés canadiens du logement : financements, accessibilité financière et
étalement urbain (Juillet 2014) par Calista Cheung 1144. Women’s role in the Swiss economy (July 2014) by Richard Dutu Le rôle des femmes dans l’économie suisse (Juillet 2014) par Richard Dutu 1143. Overcoming skills shortages in Canada (July 2014) by David Carey Combler les pénuries de compétences au Canada (Juillet 2014) par David Carey 1142. Trade patterns in the 2060 world economy (July 2014) by Jean Chateau, Lionel Fontagné, Jean Fouré, Åsa Johansson and Eduardo Olaberria 1141. The Demand for Skills 1995-2008: A global chain perspective (July 2014) by Bart Los, Marcel P. Timmer and Gaaitzen J. De Vries 1140. International migration: The relationship with economic and policy factors in the home and
destination country (July 2014) by Ben Westmore 1139. Gross earning inequalities in OECD countries and major non-member economies: determinants
and future scenarios (July 2014) by Henrik Braconier and Jenifer Valenzuela Ruiz 1137. Managerial capital and business R&D as enablers of productivity convergence (September 2014) by Dan Andrews and Ben Westmore 1136. Long-term patterns of trade and specialisation (July 2014) by Asa Johansson and Eduardo Olaberria 1135. Consequences of climate change damages for economic growth – a dynamic quantitative
assessment (July 2014) by Rob Dellink, Elisa Lanzi, Jean Chateau, Francesco Bosello, Ramiro Parrado and
Kelly de Bruin 1134. Comparing the robustness of PAYG pension schemes (July 2014) by Falilou Fall 1133. Overcoming vulnerabilities of pension systems (July 2014) by Falilou Fall and Debbie Bloch 1132. Overcoming vulnerabilities of health care systems (July 2014) by Mauro Pisu (July 2014) by Jon Pareliussen