Embed Size (px)
Citation preview

Katie Paine’s Measurement Hour Paine PublishingOctober 18, 2017
www.painepublishing.com | @queenofmetrics | [email protected]
The Summit on the Future of Communications Measurement

How Do We Know Anything About the Future? Gradualism – in any short period of time, it’s
not too different from now Black Swans – technological innovation will
transform our life experience – agriculture, communications, energy
Integration of intellectual disciplines – a joint way of understanding the processes that shape the world
Using that knowledge to generate different scenarios of change Unbounded scenarios Bounded, directional scenarios

And Another: Dealing with Uncertainty but Deciding Anyway!
How do you save for college? Nature and size of the problem – In-state or out-of-
state tuition? Four years or more? How many children? What’s your goal? Full support? Half the cost of
tuition? Are you just starting now? What are the implications? Can you afford to send the
second kid? Can you afford to do other things in your life - go on vacation, buy a car, retire?
We solve these kinds of problems all the time without being able to predict the precise future of our investments – because we know how to think about them

Why is Understanding Risk so Important? – One Way to Think Assume 1/100 chance of unacceptable outcome every
year Q: Over 30 years, what is the chance of that outcome
actually occurring? A: Chance it never occurs = (1-(1/100))30 = 0.73 Chance it occurs at least once = 27%
Over 50 years? = 40% Warren Towers is 50 years old this year…

How Do You Adapt?
Reacting to Impacts Already Occurring e.g. Sandy and Katrina recoveries Hardening coastal defenses Improving wildfire detection and response
Anticipating Changes Shifting baselines – the future will not be like the past Risk tolerance Risk management

Standards for measurement update: What are key value themes the research?
Theme 1: Planning is the mechanism of alignment -Communications owns stakeholder intelligence,
Theme 2: Comms functions as everything from facilitator thru to advisor, to new uber level of org policy and strategy, but 80 to 90% are operating at a technician level
Theme 3: Internal consultants, Aligning the ideal organization for coms with the overall business strategy and merchandising the success of the role.
Theme 4 is research. First has to be a culture that accepts research. Data driven world. So must put data into context
Theme 5: Senior managers care about threats and opportunities, and comms should be looking at it. Traditional comms metric are useful to comms staff not senior manager. CEO and Board doesn’t care about traditional comms metrics Comms needs to understand what we’re achieving as a business.
Research is a way to open the door to talk to brand managers
Opportunities and threats opens the door to the CEO and Board.

Southwest Airlines Case Study: The Role of Data, Dashboards, Technology, Data Visualization and Predictive Analytics in the Future of Communications Measurement
Kim BollerOctober 2017

Proprietary & ConfidentialPage 8
CASE STUDY 3Competitor Crisis: All Data on Deck
Communications data is married with data from the entire business to provide a holistic view of the crisis and is ultimately used to make a larger business decision

Proprietary & ConfidentialPage 9
CASE STUDY 3Competitor Crisis: Long-term Reputational Analysis and Benchmarking
Beyond the crisis timeframe, the data is also analyzed from both competitive and reputational standpoints to better understand long-term impacts

Proprietary & ConfidentialPage 10
Key Takeaways
Human analysis is a critical component to data mining.
Big or small, communications data is always a helpful tool to understand the real-time perception of a crisis.
Is your data telling the story? If not, look for a new way to share that message. Make the data work for you!
Just because you didn’t start the crisis doesn’t mean you won’t become involved. Use the data to prepare accordingly.

2017 Measurement SummitCisco Case Study: The Role of Data, Dashboards, Technology, Data Visualization and Predictive Analytics in the Future of Communications Measurement
Elizabeth Rector October 2017

Customer Survey Verbatim Analysis – Security #1
“Security has been an issue for us, and has held us back in terms of some areas of digitization, such as cloud.” Transportation CIO
Although Security has consistently been prominent among CIO ‘technology priorities, this year it assumed the #1 priority. While it was most often mentioned among multiple priority areas, Security was the only or the most emphasized priority in about one-fourth of responses. CIOs typically spoke of security in overarching rather than initiative-specific terms.
Multiple Cisco CIO customer surveys aggregated NLP analysis
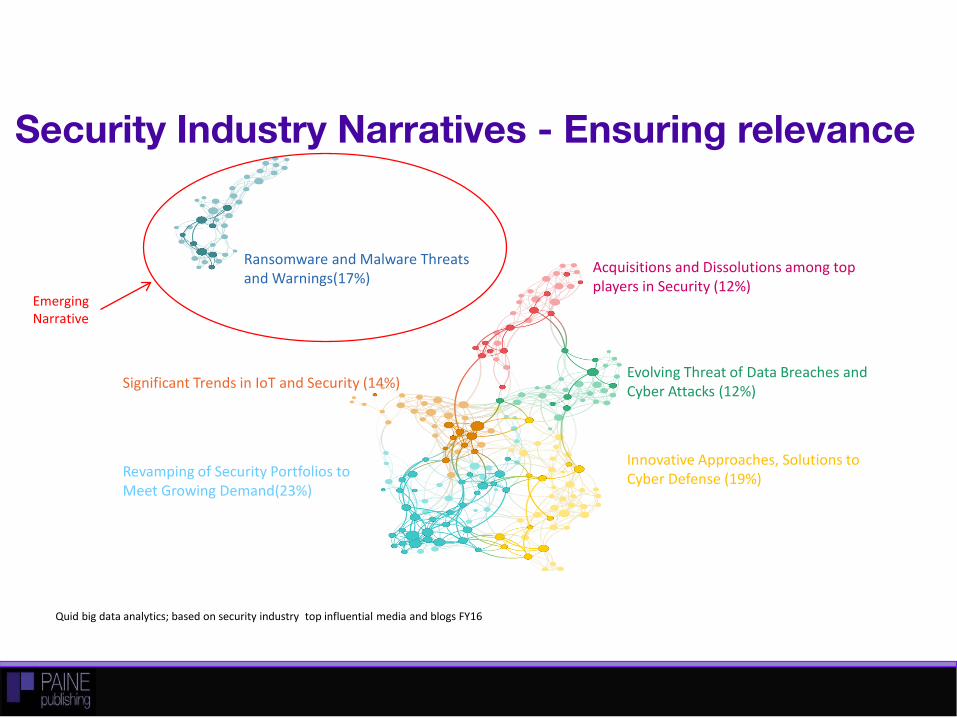
Security Industry Narratives - Ensuring relevance
Innovative Approaches, Solutions to Cyber Defense (19%)
Ransomware and Malware Threats and Warnings(17%)
Significant Trends in IoT and Security (14%)Evolving Threat of Data Breaches and Cyber Attacks (12%)
Acquisitions and Dissolutions among top players in Security (12%)
Revamping of Security Portfolios to Meet Growing Demand(23%)
Quid big data analytics; based on security industry top influential media and blogs FY16
Emerging Narrative

SOV Rank Peer FY2017
FY2016 % Change
#1 44.8% 31.5% +13.3
Impact on Top Influencer Security Share of Voice
Q4FY17 Q3FY17 % Change
Cisco SOV 47.8% 41.3% +6.5
Cisco Rank #1 #1 No change
Peer7%
Cisco48%
Peer8%
Peer7%
Peer3%
Peer2%
Peer8%
Peer6%
Peer 11%
Year over Year
Quarter over Quarter
Key Takeaways
Communications professionals need to have a thorough understanding of the business
Communications metrics need to align with the business and integrate with other key business metrics
Metrics need a closed-loop process to ensure that an action is taken on the data
Communications professionals should use data and metrics to drive strategy

Exeter Health Resources
Exeter Hospital Core RVNA
• 35 Community Service area• 2,400 staff • $300+ million revenue budget • 5,000 inpatient admissions • 27,000 emergency room visits • 63,000 patients cared for by Core Physicians• Charity and Community Benefit Funding $24m• Magnet Hospital and “Most Wired”

Continuing Through A Period Of Transition
17

How Do We Use Data to Support Business Decisions? Community Need Population Health Incidence Broad Market Data Opinion Data Quality Data Satisfaction Data Employee
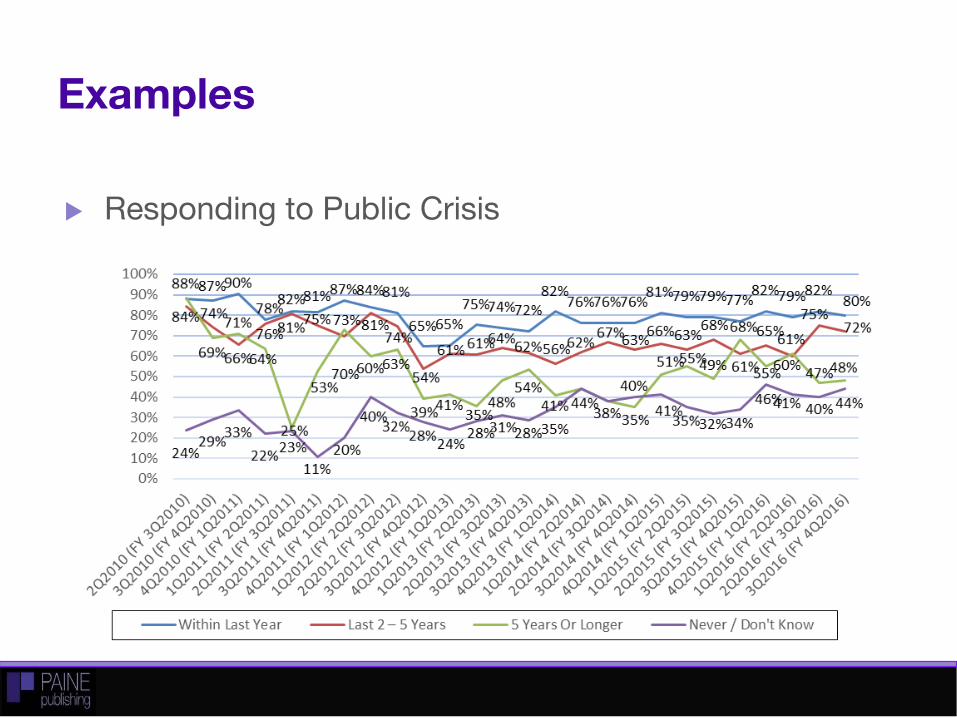
Examples
Responding to Public Crisis
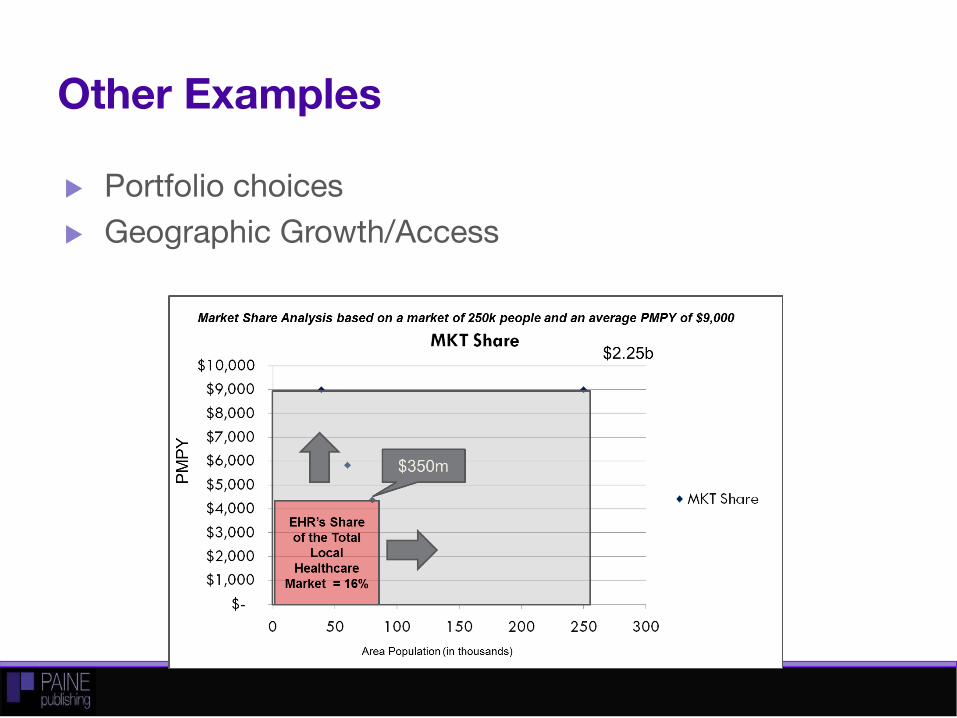
Other Examples
Portfolio choices Geographic Growth/Access

Other Examples
• Service Redesign – Readmission• Marketing Success• Community Need – Suicide prevention
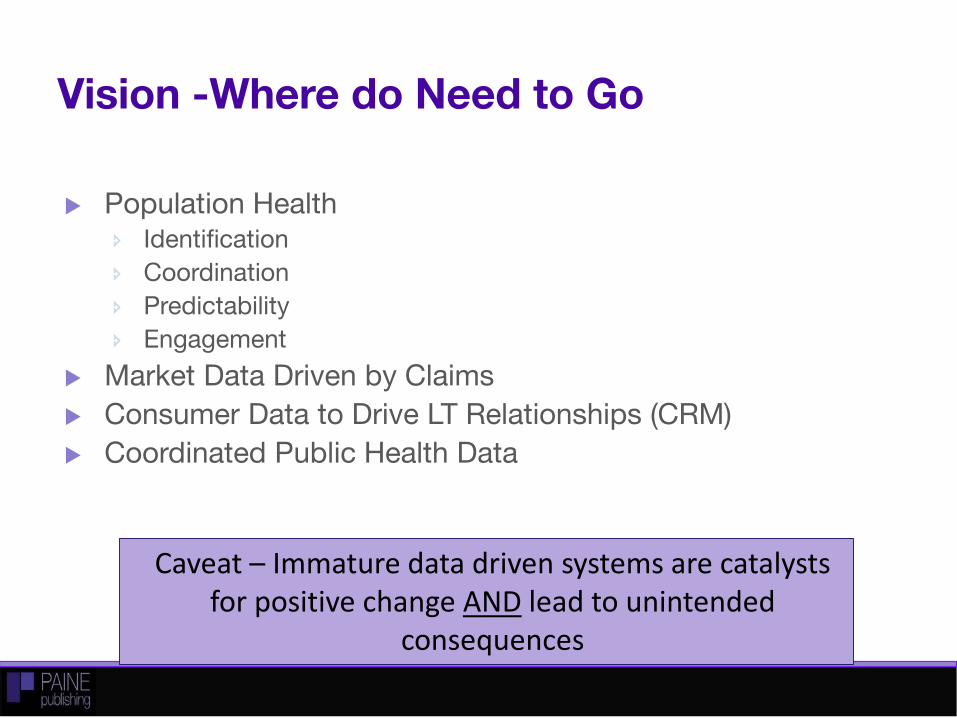
Vision -Where do Need to Go
Population Health Identification Coordination Predictability Engagement
Market Data Driven by Claims Consumer Data to Drive LT Relationships (CRM) Coordinated Public Health Data
Caveat – Immature data driven systems are catalysts for positive change AND lead to unintended
consequences

The Rising Healthcare Consumer
23
Defer?
Shop?Stay Loyal?
$5,181
$2,927
$10,545
$6,010
Bronze Silver
Individual Family
Average Deductible by Metal Level2015 Enrollment Period

Shift Towards Risk Will Bring With it a New Perspective on Our Place in the World
24

© 2017 Proof Inc., All Rights Reserved
Big Changes AfootOctober 12, 2017
© 2017 Proof Inc., All Rights Reserved

C-suite sense of risk re marketing / comms is spiking CMOs continue to lose their jobs at a record pace CMO tenure in F1000 is 18-22 months, 1/3 of the next worst
member of the C-suite Average agency tenure is 26 months; agency profitability is the
lowest in the history of the business 3649 board seats in F1000 are filled by sales leaders. 89 are
CMOs. 3 are CCOs. Concerns about waste, fraud, economy are converging Deepening desire to resolve opportunity cost question
The Big Trends

Maturity curve is broad and disparate 2/3 of all martech / comms tech is shelfware Technology solutions outstripping human capability and
organizational capacity Rapid data federation v. traditional data lakes Few logic frameworks = context-free analytics Speed to insight, speed to value “Brand damage” to marketing-led analytics, but COE isn’t
working either
The Big Challenges

Marketing and Communications Failure to demonstrate how brand reputation monetizes Failure to prioritize intelligence and insight over activities Failure to effectively instrument audience Awareness, Confidence and Trust
psychographics Failure to accurately understand how different parts of PESO are consumed
by customers en route to a decision, and how PESO is optimized for different customer decision psychographics
The Business Failure to insist that marketing & comms teams fund instrumentation and
analytics before funding any activities or campaigns
The Big Misses

Incremental Value Creation Democratization Pattern recognition v. “predictive” Analytics that are “good enough” for purpose Targeted AI Automation v. Human ”Soft” factors
The Emerging Priorities

Businesses and boards are exercising more control Risk management Governance Internal and SOX compliance Procurement oversight Performance management
Gradual movement away from centralized data and analytics
Pay for Performance
The Big Shifts
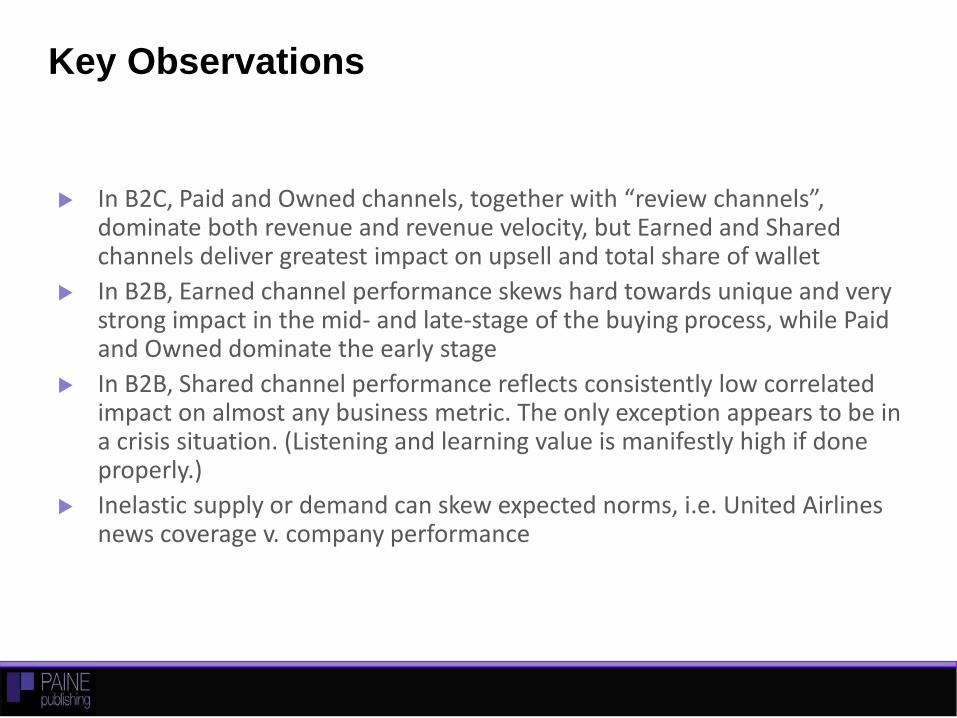
In B2C, Paid and Owned channels, together with “review channels”, dominate both revenue and revenue velocity, but Earned and Shared channels deliver greatest impact on upsell and total share of wallet
In B2B, Earned channel performance skews hard towards unique and very strong impact in the mid- and late-stage of the buying process, while Paid and Owned dominate the early stage
In B2B, Shared channel performance reflects consistently low correlated impact on almost any business metric. The only exception appears to be in a crisis situation. (Listening and learning value is manifestly high if done properly.)
Inelastic supply or demand can skew expected norms, i.e. United Airlines news coverage v. company performance
Key Observations

P2P is always true, but B2C and B2B skew very differently due to the differences in real and perceived customer decision risk.
Decision risk is the most determinant factor in the decision to buy Low levels of decision risk free people to care more about other factors, i.e.
alignment on social values Length of the time lag / feedback loop makes an investment in B2B marketing
~30X riskier than the same investment in B2B sales. B2B content marketing is very costly and dilutive v. its business impact Marketing risk in short-cycle businesses is tied to the high spend and
qualitative errors, but overall much less risky than B2B. Many of the marketing departments in the sample appear to be spending at
levels above the point of diminishing returns.
Key Observations

Thank You!
Click here to explore the newest articles from The Measurement Advisor Reminder: As a paid subscriber you have 24/7 access to all
of TMA’s articles…just visit TMA’s homepage!
Follow me on Twitter: @queenofmetrics Follow Paine Publishing on Facebook and LinkedIn
33
33
Special thanks to Montclair State University's Graduate Program for sponsoring this month's Measurement Hour!