Embed Size (px)
Citation preview

1
TSX:NMIOTCQX:NMKTF
Q22016FinancialResults
July29,2016
2
ForwardLookingStatementsCertaininforma?onsetforthinthispresenta?oncontains“forward-lookingstatements”,and“forward-lookinginforma?onunderapplicablesecuri?eslaws. Except for statements of historical fact, certain informa?on contained herein cons?tutes forward-looking statements, which include theCompany’s expecta?ons about its business and opera?ons, and are based on the Company’s current internal expecta?ons, es?mates, projec?ons,assump?ons and beliefs, which may prove to be incorrect. Some of the forward-looking statements may be iden?fied by words such as “will”,“expects”, “an?cipates”, “believes”, “projects”, “plans”, and similar expressions. These statements are not guarantees of future performance oroutcomesandunduerelianceshouldnotbeplacedonthem.Forward-lookingstatementsarebasedontheopinionsandes?matesofmanagementasof thedatesuchstatementsaremadeandtheyaresubject toknownandunknownrisks,uncertain?esandother factors thatmaycausetheactualresults, levelofac?vity,performanceorachievementsof theCompany tobemateriallydifferent fromthoseexpressedor impliedby such forward-looking statements or forward-looking informa?on. Althoughmanagement of the Company has aTempted to iden?fy important factors that couldcauseactualresultstodiffermateriallyfromthosecontainedinforward-lookingstatementsorforward-lookinginforma?on,theremaybeotherfactorsthatcauseresultsnottobeasan?cipated,es?matedorintended.Therecanbenoassurancethatsuchstatementswillprovetobeaccurate,asactualresultsandfutureeventscoulddiffermaterially fromthosean?cipated insuchstatements.Accordingly, readersshouldnotplaceunduerelianceonforward-lookingstatementsandforward-lookinginforma?on.TheCompanydoesnotundertaketoupdateanyforward-lookingstatementsorforward-lookinginforma?onthatareincludedinthispresenta?onorincorporatedbyreferenceherein,exceptinaccordancewithapplicablesecuri?eslaws.All amounts are presented inUnited States dollars ("$") unless otherwise stated. References in this document to “C$” are to Canadian dollars andreferencesto"A$"aretoAustraliandollars.Certainnon-IFRSmeasuresare included in thispresenta?on, includingopera?ngcashcostperounce,all-in sustainingcosts (“AISC”)perounce,andopera?ng cash cost per tonnemilled inAustraliandollars. In the goldmining industry, these are commonperformancemeasuresbutmaynotbecomparabletosimilarmeasurespresentedbyotherissuers.NewmarketGoldbelievesthatthesemeasures,inaddi?ontothatinforma?onpreparedinaccordancewith IFRS,provides investorswithuseful informa?on toevaluate theCompany’sperformanceandability togeneratecashflow from itsopera?ons. Accordingly,it isintendedtoprovideaddi?onalinforma?onandshouldnotbeconsideredinisola?onorasasubs?tuteformeasuresofperformancepreparedinaccordancewithIFRS.Forfurtherinforma?on,refertothe“Non-IFRSMeasures”sec?onofthelatestquarterlyMD&A.QualifiedPersonMark Edwards,MAusIMM (CP),MAIG,GeneralManager, Explora?on, NewmarketGold, is a "qualified person" as such term is defined inNa?onalInstrument43-101andhasreviewedandapprovedthetechnicalinforma?onanddataincludedinthispresenta?on
3
Q22016CEOHighlights
1)Opera?ngCashCostsandAll-insustainingcosts(“AISC”)referNon-IFRSMeasuresonslide23
(AllfiguresareinUnitedStates(“US”)dollars,unlessotherwisestated)
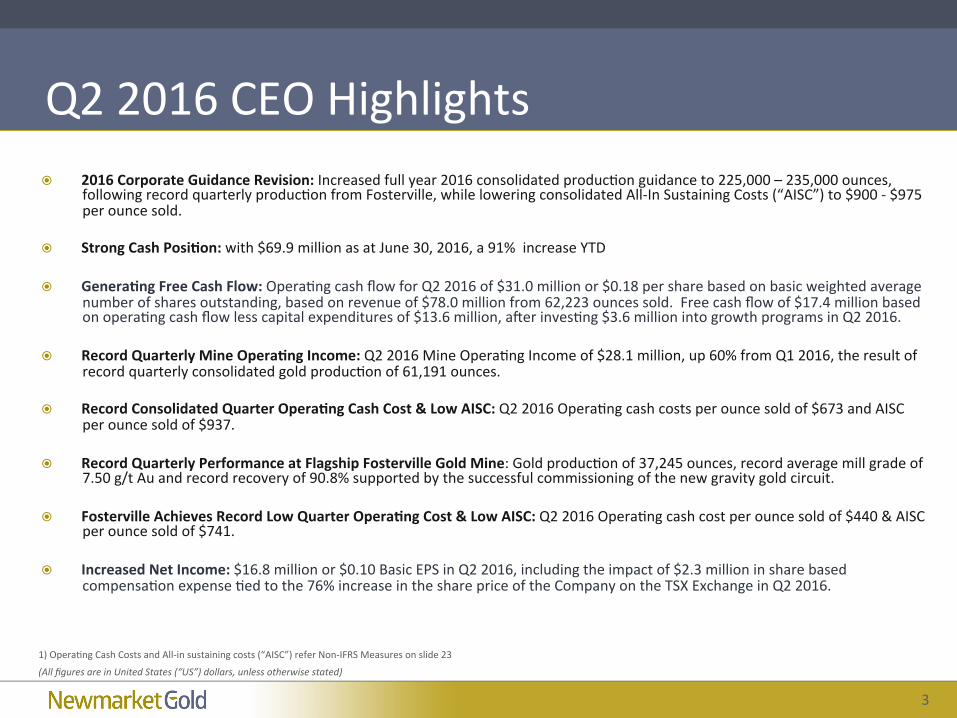
� 2016CorporateGuidanceRevision:Increasedfullyear2016consolidatedproduc?onguidanceto225,000–235,000ounces,followingrecordquarterlyproduc?onfromFosterville,whileloweringconsolidatedAll-InSustainingCosts(“AISC”)to$900-$975perouncesold.
� StrongCashPosiBon:with$69.9millionasatJune30,2016,a91%increaseYTD� GeneraBngFreeCashFlow:Opera?ngcashflowforQ22016of$31.0millionor$0.18persharebasedonbasicweightedaverage
numberofsharesoutstanding,basedonrevenueof$78.0millionfrom62,223ouncessold.Freecashflowof$17.4millionbasedonopera?ngcashflowlesscapitalexpendituresof$13.6million,anerinves?ng$3.6millionintogrowthprogramsinQ22016.
� RecordQuarterlyMineOperaBngIncome:Q22016MineOpera?ngIncomeof$28.1million,up60%fromQ12016,theresultofrecordquarterlyconsolidatedgoldproduc?onof61,191ounces.
� RecordConsolidatedQuarterOperaBngCashCost&LowAISC:Q22016Opera?ngcashcostsperouncesoldof$673andAISCperouncesoldof$937.
� RecordQuarterlyPerformanceatFlagshipFostervilleGoldMine:Goldproduc?onof37,245ounces,recordaveragemillgradeof7.50g/tAuandrecordrecoveryof90.8%supportedbythesuccessfulcommissioningofthenewgravitygoldcircuit.
� FostervilleAchievesRecordLowQuarterOperaBngCost&LowAISC:Q22016Opera?ngcashcostperouncesoldof$440&AISCperouncesoldof$741.
� IncreasedNetIncome:$16.8millionor$0.10BasicEPSinQ22016,includingtheimpactof$2.3millioninsharebasedcompensa?onexpense?edtothe76%increaseinthesharepriceoftheCompanyontheTSXExchangeinQ22016.
4
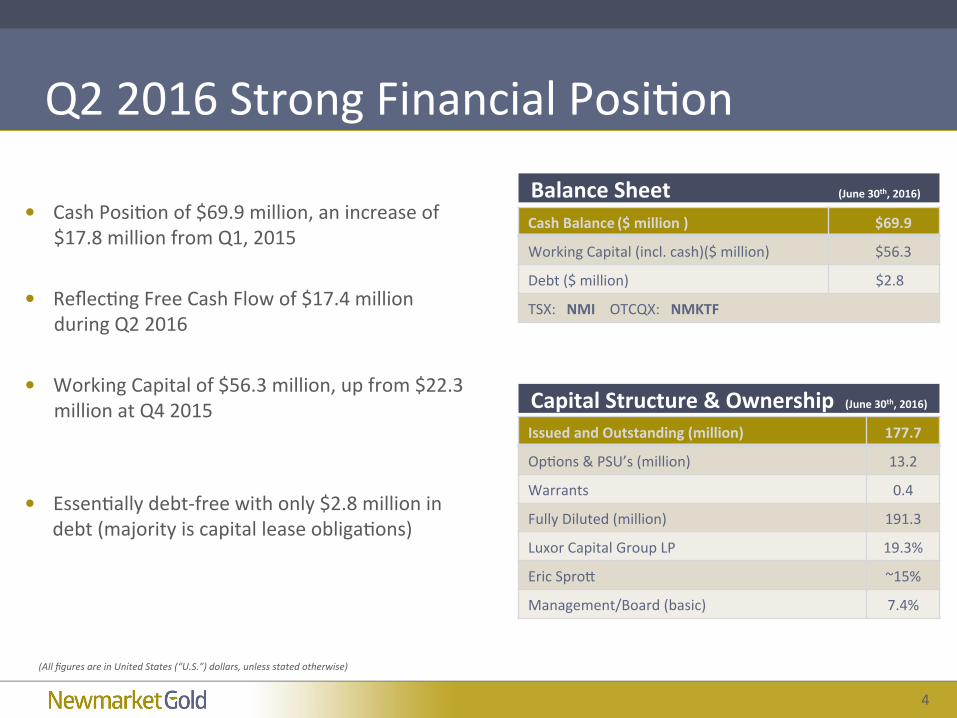
Q22016StrongFinancialPosi?on� CashPosi?onof$69.9million,anincreaseof
$17.8millionfromQ1,2015
� Reflec?ngFreeCashFlowof$17.4millionduringQ22016
� WorkingCapitalof$56.3million,upfrom$22.3
millionatQ42015
� Essen?allydebt-freewithonly$2.8millionindebt(majorityiscapitalleaseobliga?ons)
(AllfiguresareinUnitedStates(“U.S.”)dollars,unlessstatedotherwise)
CashBalance($million) $69.9
WorkingCapital(incl.cash)($million) $56.3
Debt($million) $2.8
TSX:NMIOTCQX:NMKTF
BalanceSheet(June30th,2016)
IssuedandOutstanding(million) 177.7
Op?ons&PSU’s(million) 13.2
Warrants 0.4
FullyDiluted(million) 191.3
LuxorCapitalGroupLP 19.3%
EricSproT ~15%
Management/Board(basic) 7.4%
CapitalStructure&Ownership(June30th,2016)
5
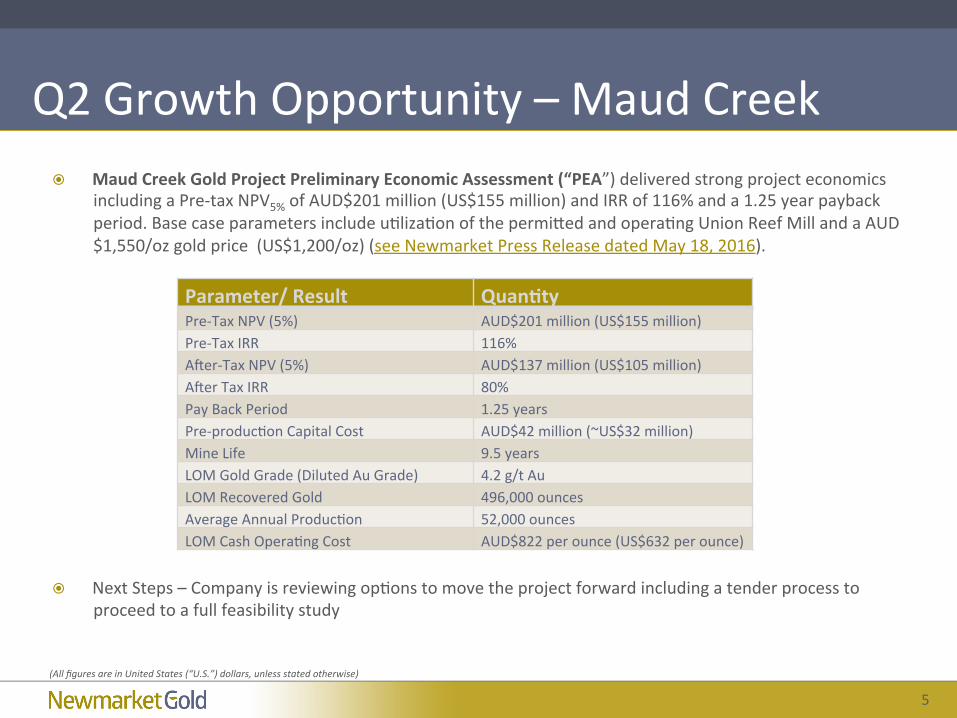
Q2GrowthOpportunity–MaudCreek� MaudCreekGoldProjectPreliminaryEconomicAssessment(“PEA”)deliveredstrongprojecteconomics
includingaPre-taxNPV5%ofAUD$201million(US$155million)andIRRof116%anda1.25yearpaybackperiod.Basecaseparametersincludeu?liza?onofthepermiTedandopera?ngUnionReefMillandaAUD$1,550/ozgoldprice(US$1,200/oz)(seeNewmarketPressReleasedatedMay18,2016).
� NextSteps–Companyisreviewingop?onstomovetheprojectforwardincludingatenderprocesstoproceedtoafullfeasibilitystudy
(AllfiguresareinUnitedStates(“U.S.”)dollars,unlessstatedotherwise)
Parameter/Result QuanBtyPre-TaxNPV(5%) AUD$201million(US$155million)Pre-TaxIRR 116%Aner-TaxNPV(5%) AUD$137million(US$105million)AnerTaxIRR 80%PayBackPeriod 1.25yearsPre-produc?onCapitalCost AUD$42million(~US$32million)MineLife 9.5yearsLOMGoldGrade(DilutedAuGrade) 4.2g/tAuLOMRecoveredGold 496,000ouncesAverageAnnualProduc?on 52,000ouncesLOMCashOpera?ngCost AUD$822perounce(US$632perounce)
6
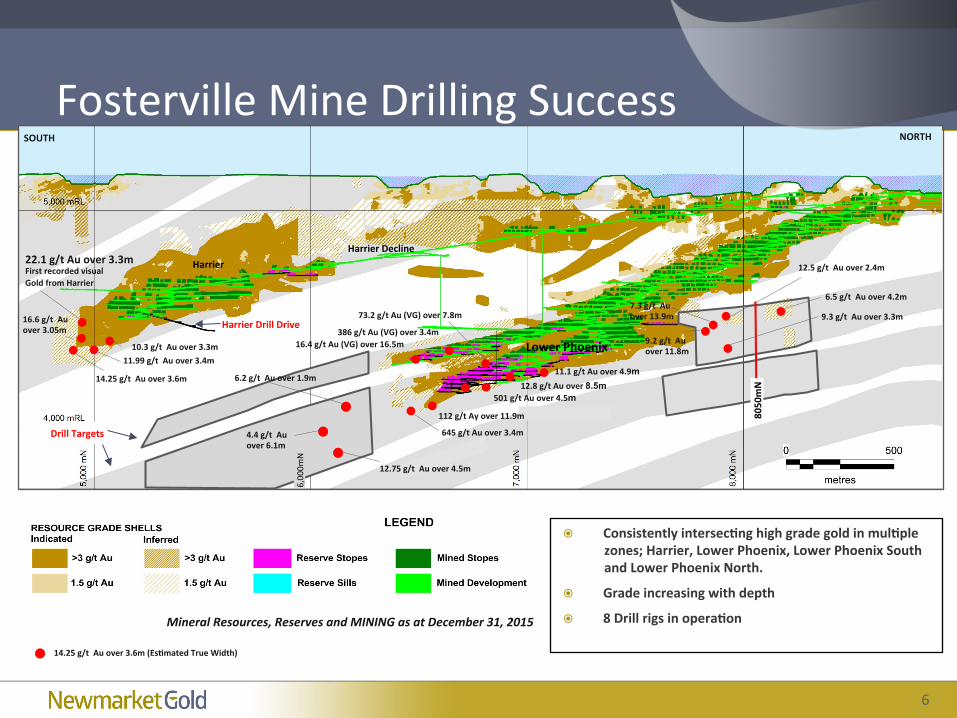
FostervilleMineDrillingSuccess
HarrierDrillDrive
12.5g/tAuover2.4m
12.75g/tAuover4.5m
LowerPhoenix
DrillTargets
NORTHSOUTH
MineralResources,ReservesandMININGasatDecember31,2015
HarrierDeclineHarrier
� ConsistentlyintersecBnghighgradegoldinmulBplezones;Harrier,LowerPhoenix,LowerPhoenixSouthandLowerPhoenixNorth.
� Gradeincreasingwithdepth
� 8DrillrigsinoperaBon
4.4g/tAuover6.1m
6.5g/tAuover4.2m
9.3g/tAuover3.3m
6,000m
N
9.2g/tAuover11.8m
7.3g/tAuover13.9m
8050mN6.2g/tAuover1.9m
22.1g/tAuover3.3mFirstrecordedvisualGoldfromHarrier
10.3g/tAuover3.3m
16.6g/tAuover3.05m
11.99g/tAuover3.4m
14.25g/tAuover3.6m11.1g/tAuover4.9m
12.8g/tAuover8.5m
112g/tAyover11.9m
645g/tAuover3.4m
501g/tAuover4.5m
386g/tAu(VG)over3.4m16.4g/tAu(VG)over16.5m
73.2g/tAu(VG)over7.8m
14.25g/tAuover3.6m(EsBmatedTrueWidth)
7
FostervilleMineLifeExpansion
LowerPhoenix
Phoenix
NORTHSOUTH
MineralResources,ReservesandMININGasatDecember31,2015
HarrierDeclineHarrier
6,000m
N
BLOCKA
BLOCKC
BLOCKD
HarrierDrillDrive
1kmstep-outdrillingH2/2016drillresults
5,450m
N
BLOCKB
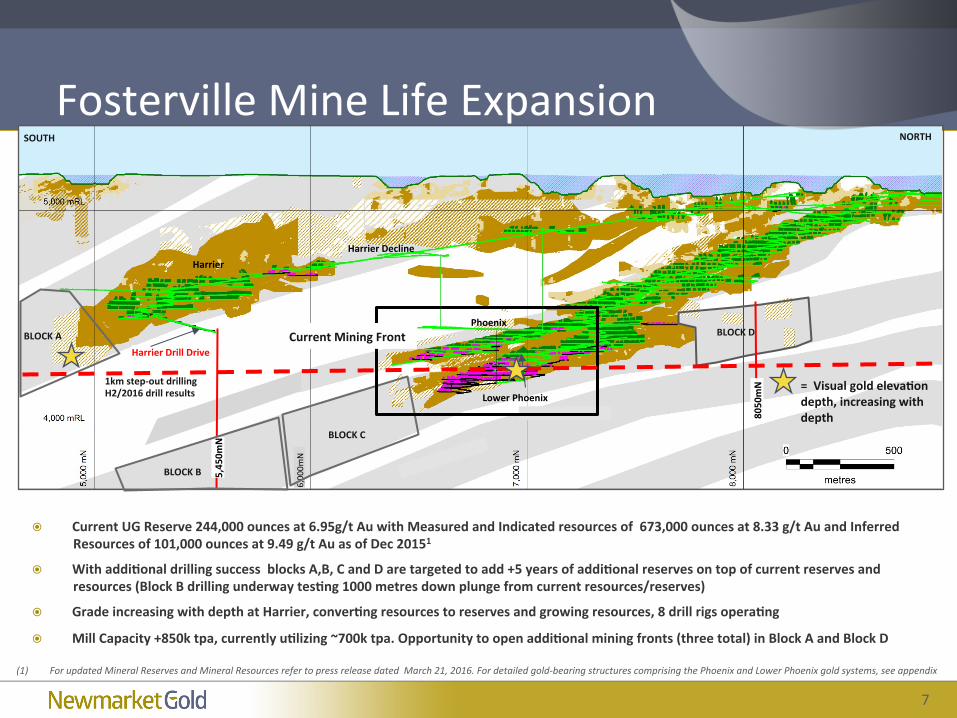
� CurrentUGReserve244,000ouncesat6.95g/tAuwithMeasuredandIndicatedresourcesof673,000ouncesat8.33g/tAuandInferredResourcesof101,000ouncesat9.49g/tAuasofDec20151
� WithaddiBonaldrillingsuccessblocksA,B,CandDaretargetedtoadd+5yearsofaddiBonalreservesontopofcurrentreservesandresources(BlockBdrillingunderwaytesBng1000metresdownplungefromcurrentresources/reserves)
� GradeincreasingwithdepthatHarrier,converBngresourcestoreservesandgrowingresources,8drillrigsoperaBng
� MillCapacity+850ktpa,currentlyuBlizing~700ktpa.OpportunitytoopenaddiBonalminingfronts(threetotal)inBlockAandBlockD
=VisualgoldelevaBondepth,increasingwithdepth
CurrentMiningFront
8050mN
(1) ForupdatedMineralReservesandMineralResourcesrefertopressreleasedatedMarch21,2016.Fordetailedgold-bearingstructurescomprisingthePhoenixandLowerPhoenixgoldsystems,seeappendix
88
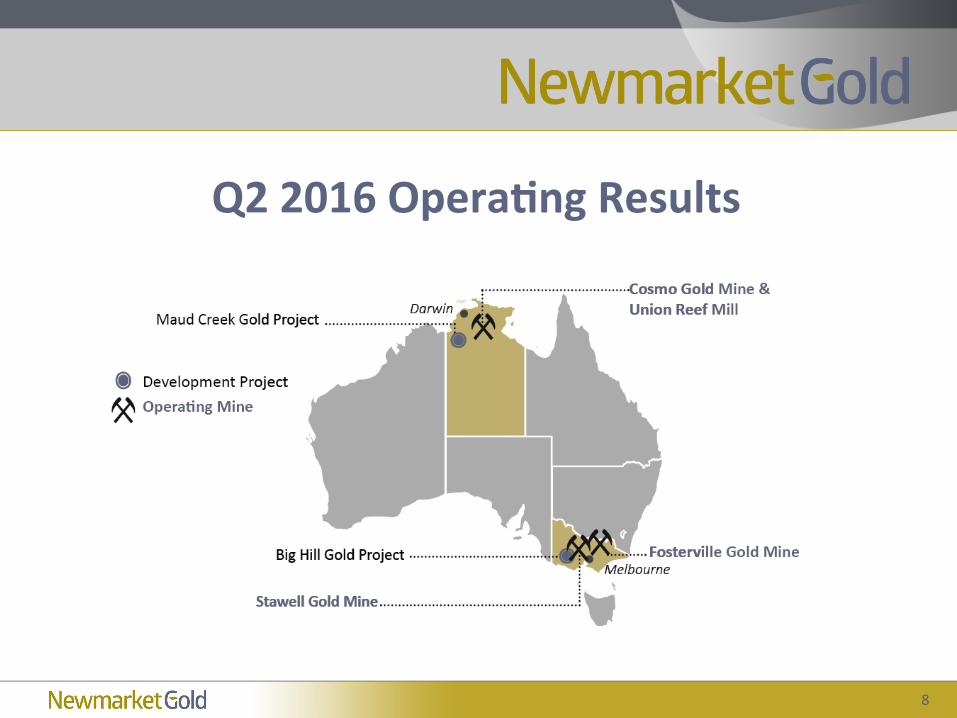
Q22016OperaBngResults
9
FostervilleGoldMine
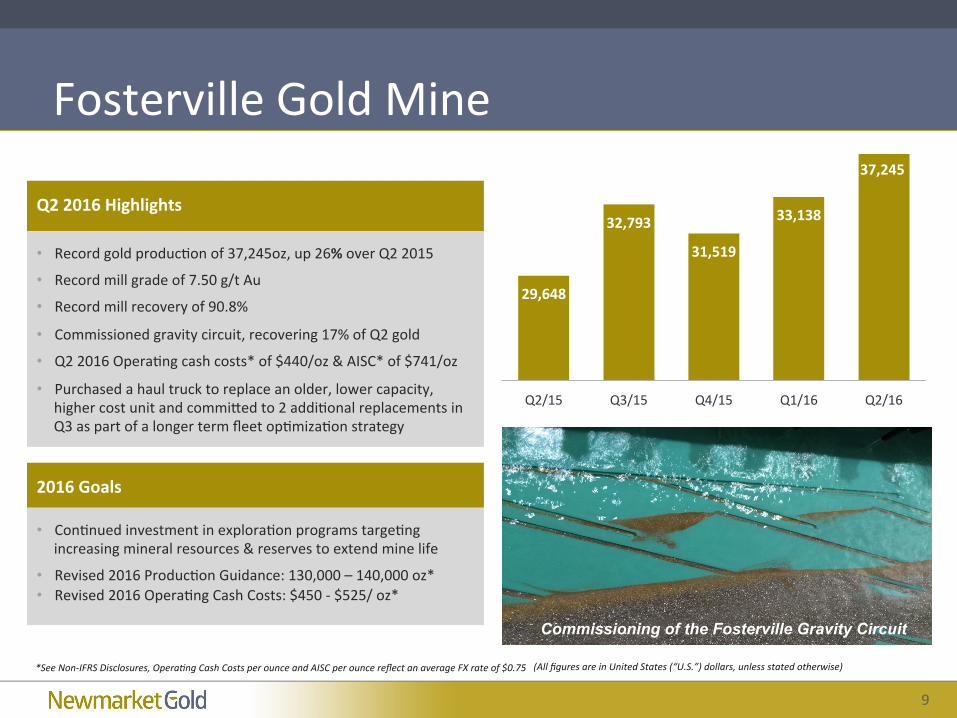
Q22016Highlights
• Recordgoldproduc?onof37,245oz,up26%overQ22015• Recordmillgradeof7.50g/tAu
• Recordmillrecoveryof90.8%
• Commissionedgravitycircuit,recovering17%ofQ2gold
• Q22016Opera?ngcashcosts*of$440/oz&AISC*of$741/oz• Purchasedahaultrucktoreplaceanolder,lowercapacity,
highercostunitandcommiTedto2addi?onalreplacementsinQ3aspartofalongertermfleetop?miza?onstrategy
29,648
32,793
31,519
33,138
Q2/15 Q3/15 Q4/15 Q1/16 Q2/16
*SeeNon-IFRSDisclosures,OperaQngCashCostsperounceandAISCperouncereflectanaverageFXrateof$0.75
Commissioning of the Fosterville Gravity Circuit
(AllfiguresareinUnitedStates(“U.S.”)dollars,unlessstatedotherwise)
37,245
2016Goals
• Con?nuedinvestmentinexplora?onprogramstarge?ngincreasingmineralresources&reservestoextendminelife
• Revised2016Produc?onGuidance:130,000–140,000oz*• Revised2016Opera?ngCashCosts:$450-$525/oz*
10
CosmoGoldMine
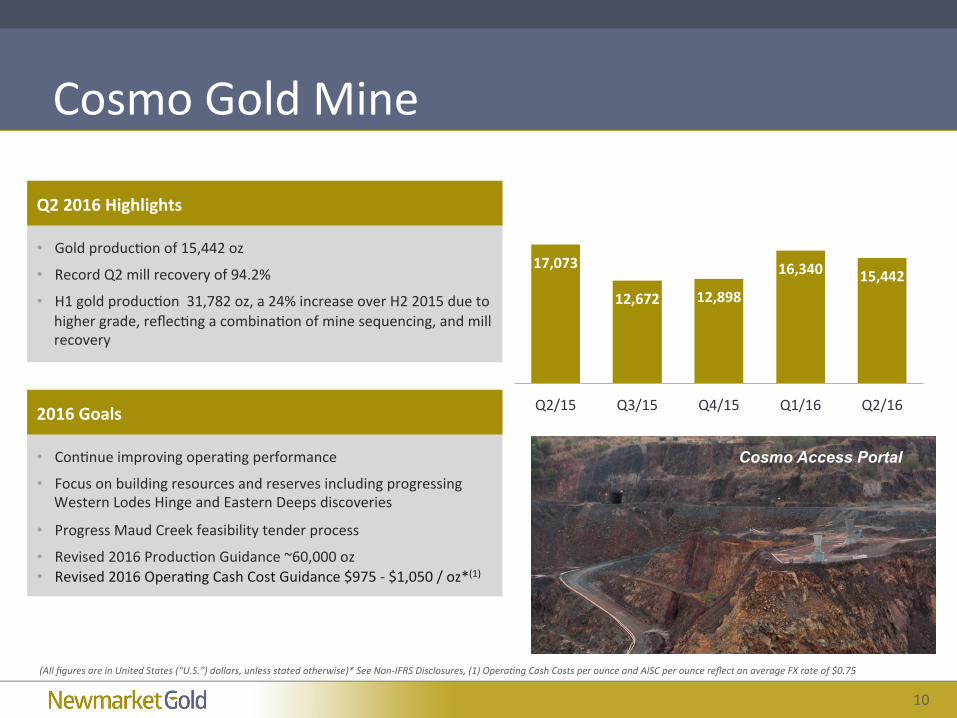
17,073
12,672 12,898
16,340 15,442
Q2/15 Q3/15 Q4/15 Q1/16 Q2/162016Goals
• Con?nueimprovingopera?ngperformance
• FocusonbuildingresourcesandreservesincludingprogressingWesternLodesHingeandEasternDeepsdiscoveries
• ProgressMaudCreekfeasibilitytenderprocess
• Revised2016Produc?onGuidance~60,000oz• Revised2016Opera?ngCashCostGuidance$975-$1,050/oz*(1)
Q22016Highlights
• Goldproduc?onof15,442oz• RecordQ2millrecoveryof94.2%
• H1goldproduc?on31,782oz,a24%increaseoverH22015duetohighergrade,reflec?ngacombina?onofminesequencing,andmillrecovery
Cosmo Access Portal
(AllfiguresareinUnitedStates(“U.S.”)dollars,unlessstatedotherwise)*SeeNon-IFRSDisclosures,(1)OperaQngCashCostsperounceandAISCperouncereflectanaverageFXrateof$0.75
11
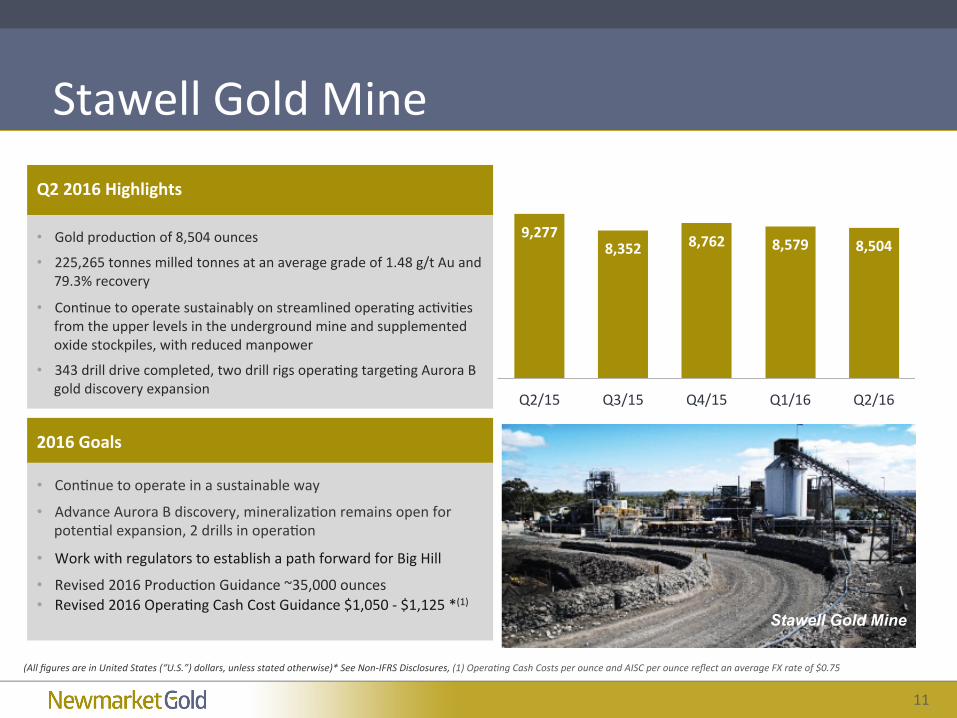
9,2778,352 8,762 8,579 8,504
Q2/15 Q3/15 Q4/15 Q1/16 Q2/16
StawellGoldMine
2016Goals
• Con?nuetooperateinasustainableway• AdvanceAuroraBdiscovery,mineraliza?onremainsopenfor
poten?alexpansion,2drillsinopera?on
• WorkwithregulatorstoestablishapathforwardforBigHill
• Revised2016Produc?onGuidance~35,000ounces• Revised2016Opera?ngCashCostGuidance$1,050-$1,125*(1)
Q22016Highlights
• Goldproduc?onof8,504ounces
• 225,265tonnesmilledtonnesatanaveragegradeof1.48g/tAuand79.3%recovery
• Con?nuetooperatesustainablyonstreamlinedopera?ngac?vi?esfromtheupperlevelsintheundergroundmineandsupplementedoxidestockpiles,withreducedmanpower
• 343drilldrivecompleted,twodrillrigsopera?ngtarge?ngAuroraBgolddiscoveryexpansion
Stawell Gold Mine
(AllfiguresareinUnitedStates(“U.S.”)dollars,unlessstatedotherwise)*SeeNon-IFRSDisclosures,(1)OperaQngCashCostsperounceandAISCperouncereflectanaverageFXrateof$0.75
1212
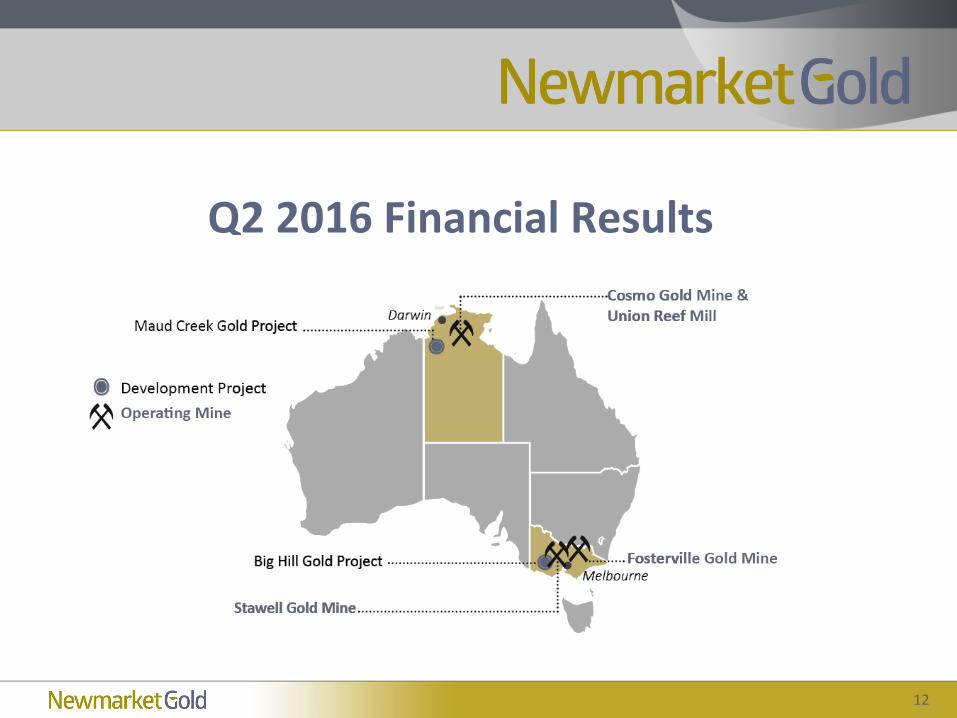
Q22016FinancialResults
13
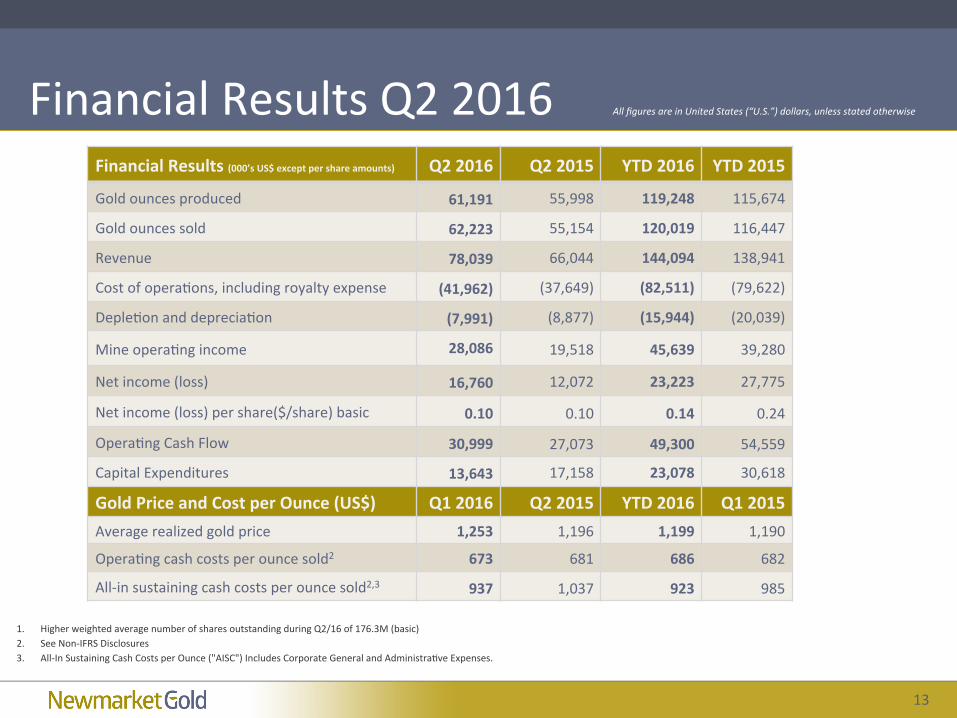
FinancialResults(000’sUS$exceptpershareamounts) Q22016 Q22015 YTD2016 YTD2015
Goldouncesproduced 61,191 55,998 119,248 115,674
Goldouncessold 62,223 55,154 120,019 116,447
Revenue 78,039 66,044 144,094 138,941
Costofopera?ons,includingroyaltyexpense (41,962) (37,649) (82,511) (79,622)
Deple?onanddeprecia?on (7,991) (8,877) (15,944) (20,039)
Mineopera?ngincome 28,086 19,518 45,639 39,280
Netincome(loss) 16,760 12,072 23,223 27,775
Netincome(loss)pershare($/share)basic 0.10 0.10 0.14 0.24
Opera?ngCashFlow 30,999 27,073 49,300 54,559
CapitalExpenditures 13,643 17,158 23,078 30,618
GoldPriceandCostperOunce(US$) Q12016 Q22015 YTD2016 Q12015Averagerealizedgoldprice 1,253 1,196 1,199 1,190
Opera?ngcashcostsperouncesold2 673 681 686 682
All-insustainingcashcostsperouncesold2,3 937 1,037 923 985
FinancialResultsQ22016AllfiguresareinUnitedStates(“U.S.”)dollars,unlessstatedotherwise
1. HigherweightedaveragenumberofsharesoutstandingduringQ2/16of176.3M(basic)2. SeeNon-IFRSDisclosures3. All-InSustainingCashCostsperOunce("AISC")IncludesCorporateGeneralandAdministra?veExpenses.
14
Q&A
VisualGoldFostervilleGoldMine

15
DouglasForsterPresident&CEO,Director
T:604-559-8040E:[email protected]
TSX:NMIwww.newmarketgoldinc.com
ContactUs
RyanKingVicePresident,InvestorRelaBons
T:778-998-3700E:[email protected]
1616
APPENDIX
17
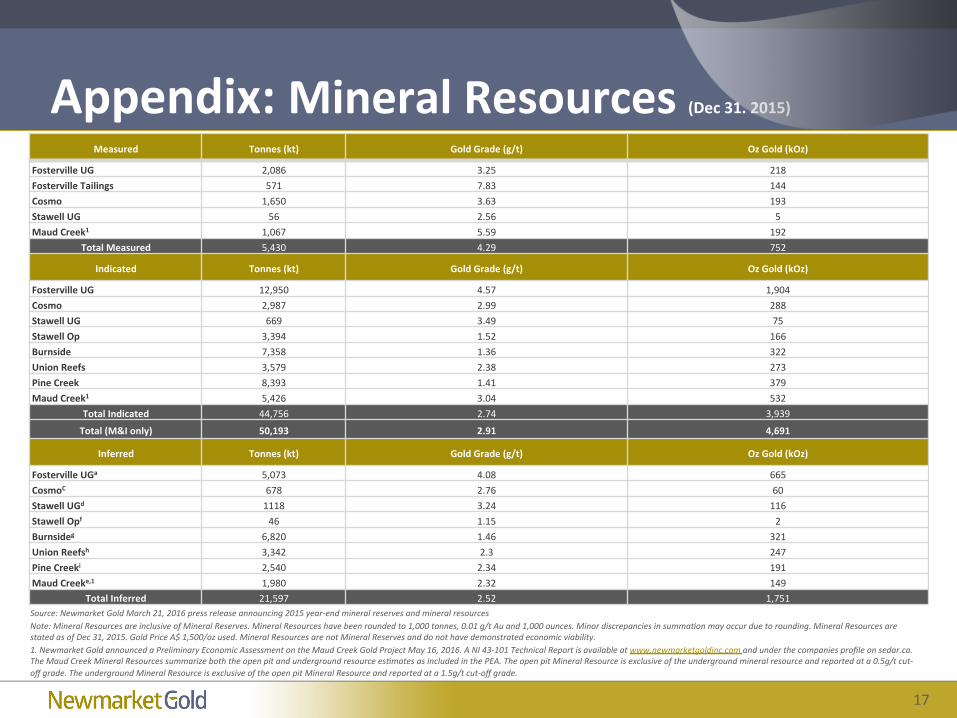
Appendix:MineralResources(Dec31.2015)
Source:NewmarketGoldMarch21,2016pressreleaseannouncing2015year-endmineralreservesandmineralresourcesNote:MineralResourcesareinclusiveofMineralReserves.MineralResourceshavebeenroundedto1,000tonnes,0.01g/tAuand1,000ounces.MinordiscrepanciesinsummaQonmayoccurduetorounding.MineralResourcesarestatedasofDec31,2015.GoldPriceA$1,500/ozused.MineralResourcesarenotMineralReservesanddonothavedemonstratedeconomicviability.1.NewmarketGoldannouncedaPreliminaryEconomicAssessmentontheMaudCreekGoldProjectMay16,2016.ANI43-101TechnicalReportisavailableatwww.newmarketgoldinc.comandunderthecompaniesprofileonsedar.ca.TheMaudCreekMineralResourcessummarizeboththeopenpitandundergroundresourceesQmatesasincludedinthePEA.TheopenpitMineralResourceisexclusiveoftheundergroundmineralresourceandreportedata0.5g/tcut-offgrade.TheundergroundMineralResourceisexclusiveoftheopenpitMineralResourceandreportedata1.5g/tcut-offgrade.
Measured Tonnes(kt) GoldGrade(g/t) OzGold(kOz)
FostervilleUG 2,086 3.25 218FostervilleTailings 571 7.83 144Cosmo 1,650 3.63 193StawellUG 56 2.56 5MaudCreek1 1,067 5.59 192
TotalMeasured 5,430 4.29 752
Indicated Tonnes(kt) GoldGrade(g/t) OzGold(kOz)
FostervilleUG 12,950 4.57 1,904Cosmo 2,987 2.99 288StawellUG 669 3.49 75StawellOp 3,394 1.52 166Burnside 7,358 1.36 322UnionReefs 3,579 2.38 273PineCreek 8,393 1.41 379MaudCreek1 5,426 3.04 532
TotalIndicated 44,756 2.74 3,939
Total(M&Ionly) 50,193 2.91 4,691
Inferred Tonnes(kt) GoldGrade(g/t) OzGold(kOz)
FostervilleUGa 5,073 4.08 665CosmoC 678 2.76 60StawellUGd 1118 3.24 116StawellOpf 46 1.15 2Burnsideg 6,820 1.46 321UnionReefsh 3,342 2.3 247PineCreeki 2,540 2.34 191MaudCreeke,1 1,980 2.32 149
TotalInferred 21,597 2.52 1,751
18
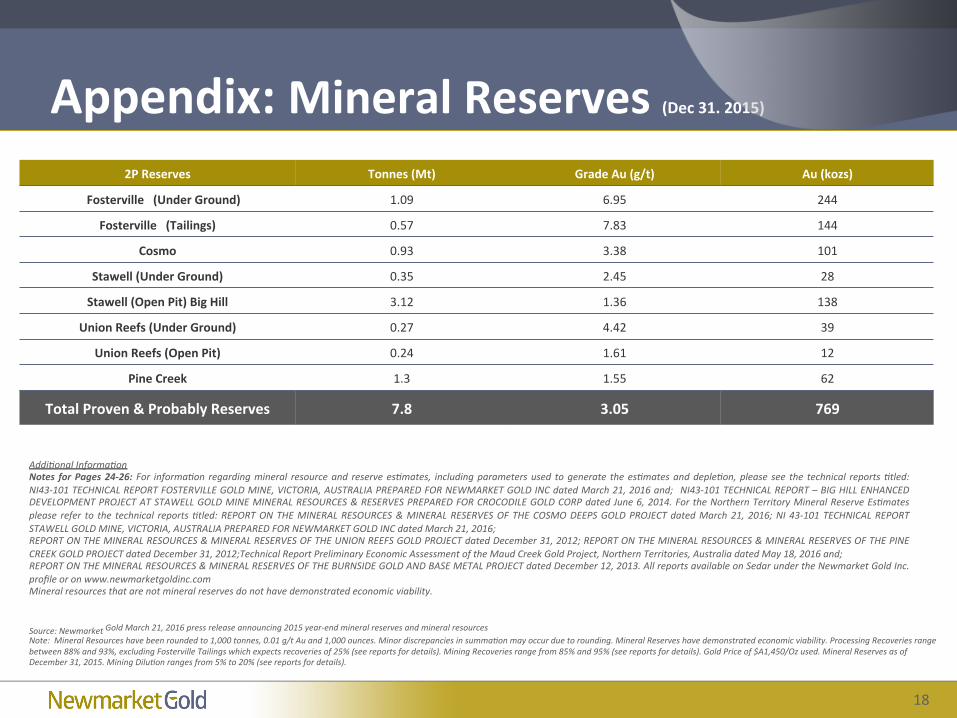
Appendix:MineralReserves(Dec31.2015)2PReserves Tonnes(Mt) GradeAu(g/t) Au(kozs)
Fosterville(UnderGround) 1.09 6.95 244
Fosterville(Tailings) 0.57 7.83 144
Cosmo 0.93 3.38 101
Stawell(UnderGround) 0.35 2.45 28
Stawell(OpenPit)BigHill 3.12 1.36 138
UnionReefs(UnderGround) 0.27 4.42 39
UnionReefs(OpenPit) 0.24 1.61 12
PineCreek 1.3 1.55 62
TotalProven&ProbablyReserves 7.8 3.05 769
Source:NewmarketGoldMarch21,2016pressreleaseannouncing2015year-endmineralreservesandmineralresourcesNote:MineralResourceshavebeenroundedto1,000tonnes,0.01g/tAuand1,000ounces.MinordiscrepanciesinsummaQonmayoccurduetorounding.MineralReserveshavedemonstratedeconomicviability.ProcessingRecoveriesrangebetween88%and93%,excludingFostervilleTailingswhichexpectsrecoveriesof25%(seereportsfordetails).MiningRecoveriesrangefrom85%and95%(seereportsfordetails).GoldPriceof$A1,450/Ozused.MineralReservesasofDecember31,2015.MiningDiluQonrangesfrom5%to20%(seereportsfordetails).
AddiQonalInformaQonNotes forPages24-26: For informaQon regardingmineral resourceand reserveesQmates, includingparametersused togenerate theesQmatesanddepleQon,please see the technical reportsQtled:NI43-101TECHNICALREPORTFOSTERVILLEGOLDMINE,VICTORIA,AUSTRALIAPREPAREDFORNEWMARKETGOLDINCdatedMarch21,2016and; NI43-101TECHNICALREPORT–BIGHILLENHANCEDDEVELOPMENTPROJECTATSTAWELLGOLDMINEMINERALRESOURCES&RESERVESPREPAREDFORCROCODILEGOLDCORPdatedJune6,2014.FortheNorthernTerritoryMineralReserveEsQmatesplease refer to the technical reportsQtled:REPORTONTHEMINERALRESOURCES&MINERALRESERVESOFTHECOSMODEEPSGOLDPROJECTdatedMarch21,2016;NI43-101TECHNICALREPORTSTAWELLGOLDMINE,VICTORIA,AUSTRALIAPREPAREDFORNEWMARKETGOLDINCdatedMarch21,2016;REPORTONTHEMINERALRESOURCES&MINERALRESERVESOFTHEUNIONREEFSGOLDPROJECTdatedDecember31,2012;REPORTONTHEMINERALRESOURCES&MINERALRESERVESOFTHEPINECREEKGOLDPROJECTdatedDecember31,2012;TechnicalReportPreliminaryEconomicAssessmentoftheMaudCreekGoldProject,NorthernTerritories,AustraliadatedMay18,2016and;REPORTONTHEMINERALRESOURCES&MINERALRESERVESOFTHEBURNSIDEGOLDANDBASEMETALPROJECTdatedDecember12,2013.AllreportsavailableonSedarundertheNewmarketGoldInc.profileoronwww.newmarketgoldinc.comMineralresourcesthatarenotmineralreservesdonothavedemonstratedeconomicviability.
19
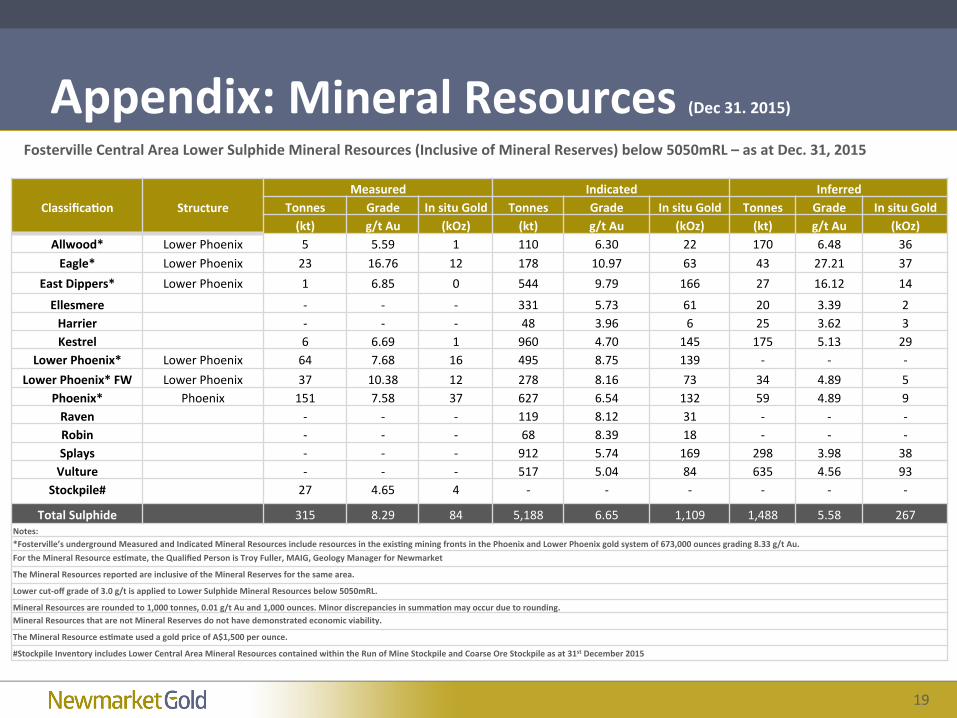
ClassificaBon StructureMeasured Indicated Inferred
Tonnes Grade InsituGold Tonnes Grade InsituGold Tonnes Grade InsituGold(kt) g/tAu (kOz) (kt) g/tAu (kOz) (kt) g/tAu (kOz)
Allwood* LowerPhoenix 5 5.59 1 110 6.30 22 170 6.48 36Eagle* LowerPhoenix 23 16.76 12 178 10.97 63 43 27.21 37
EastDippers* LowerPhoenix 1 6.85 0 544 9.79 166 27 16.12 14
Ellesmere - - - 331 5.73 61 20 3.39 2Harrier - - - 48 3.96 6 25 3.62 3Kestrel 6 6.69 1 960 4.70 145 175 5.13 29
LowerPhoenix* LowerPhoenix 64 7.68 16 495 8.75 139 - - -LowerPhoenix*FW LowerPhoenix 37 10.38 12 278 8.16 73 34 4.89 5
Phoenix* Phoenix 151 7.58 37 627 6.54 132 59 4.89 9Raven - - - 119 8.12 31 - - -Robin - - - 68 8.39 18 - - -Splays - - - 912 5.74 169 298 3.98 38Vulture - - - 517 5.04 84 635 4.56 93
Stockpile# 27 4.65 4 - - - - - -
TotalSulphide 315 8.29 84 5,188 6.65 1,109 1,488 5.58 267Notes:*Fosterville’sundergroundMeasuredandIndicatedMineralResourcesincluderesourcesintheexisBngminingfrontsinthePhoenixandLowerPhoenixgoldsystemof673,000ouncesgrading8.33g/tAu.FortheMineralResourceesBmate,theQualifiedPersonisTroyFuller,MAIG,GeologyManagerforNewmarket
TheMineralResourcesreportedareinclusiveoftheMineralReservesforthesamearea.
Lowercut-offgradeof3.0g/tisappliedtoLowerSulphideMineralResourcesbelow5050mRL.
MineralResourcesareroundedto1,000tonnes,0.01g/tAuand1,000ounces.MinordiscrepanciesinsummaBonmayoccurduetorounding.MineralResourcesthatarenotMineralReservesdonothavedemonstratedeconomicviability.
TheMineralResourceesBmateusedagoldpriceofA$1,500perounce.
#StockpileInventoryincludesLowerCentralAreaMineralResourcescontainedwithintheRunofMineStockpileandCoarseOreStockpileasat31stDecember2015
Appendix:MineralResources(Dec31.2015)FostervilleCentralAreaLowerSulphideMineralResources(InclusiveofMineralReserves)below5050mRL–asatDec.31,2015
20
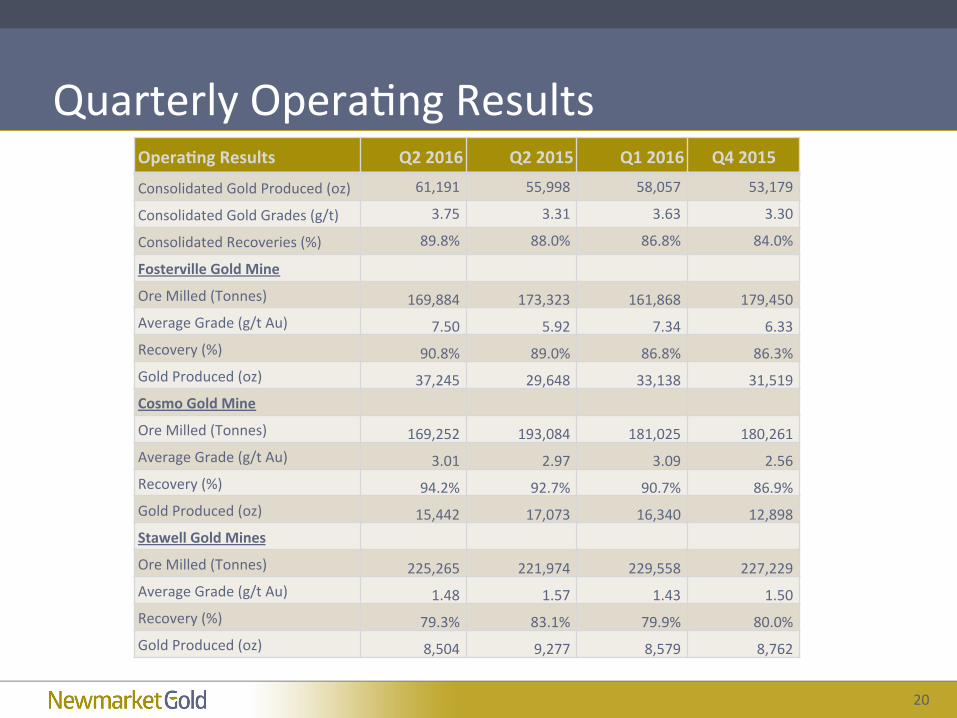
QuarterlyOpera?ngResultsOperaBngResults Q22016 Q22015 Q12016 Q42015
ConsolidatedGoldProduced(oz) 61,191 55,998 58,057 53,179
ConsolidatedGoldGrades(g/t) 3.75 3.31 3.63 3.30
ConsolidatedRecoveries(%) 89.8% 88.0% 86.8% 84.0%
FostervilleGoldMine
OreMilled(Tonnes) 169,884 173,323 161,868 179,450AverageGrade(g/tAu) 7.50 5.92 7.34 6.33Recovery(%) 90.8% 89.0% 86.8% 86.3%GoldProduced(oz) 37,245 29,648 33,138 31,519CosmoGoldMine
OreMilled(Tonnes) 169,252 193,084 181,025 180,261AverageGrade(g/tAu) 3.01 2.97 3.09 2.56Recovery(%) 94.2% 92.7% 90.7% 86.9%GoldProduced(oz) 15,442 17,073 16,340 12,898StawellGoldMines
OreMilled(Tonnes) 225,265 221,974 229,558 227,229AverageGrade(g/tAu) 1.48 1.57 1.43 1.50Recovery(%) 79.3% 83.1% 79.9% 80.0%GoldProduced(oz) 8,504 9,277 8,579 8,762
21
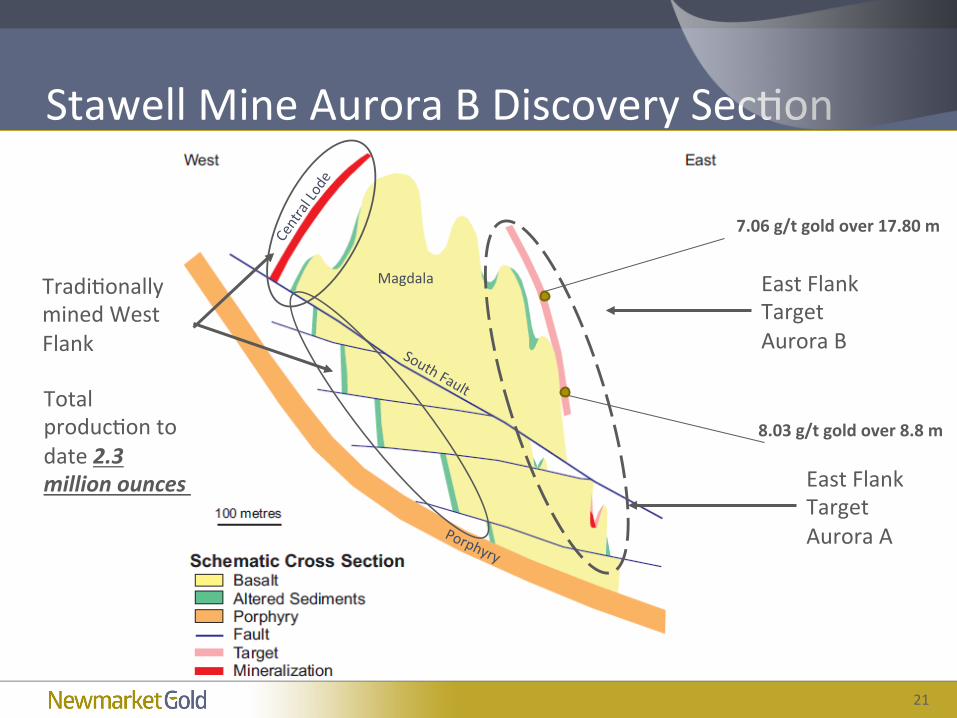
StawellMineAuroraBDiscoverySec?on
EastFlankTargetAuroraB
EastFlankTargetAuroraA
Tradi?onallyminedWestFlank
Totalproduc?ontodate2.3millionounces
8.03g/tgoldover8.8m
7.06g/tgoldover17.80m
Magdala
22
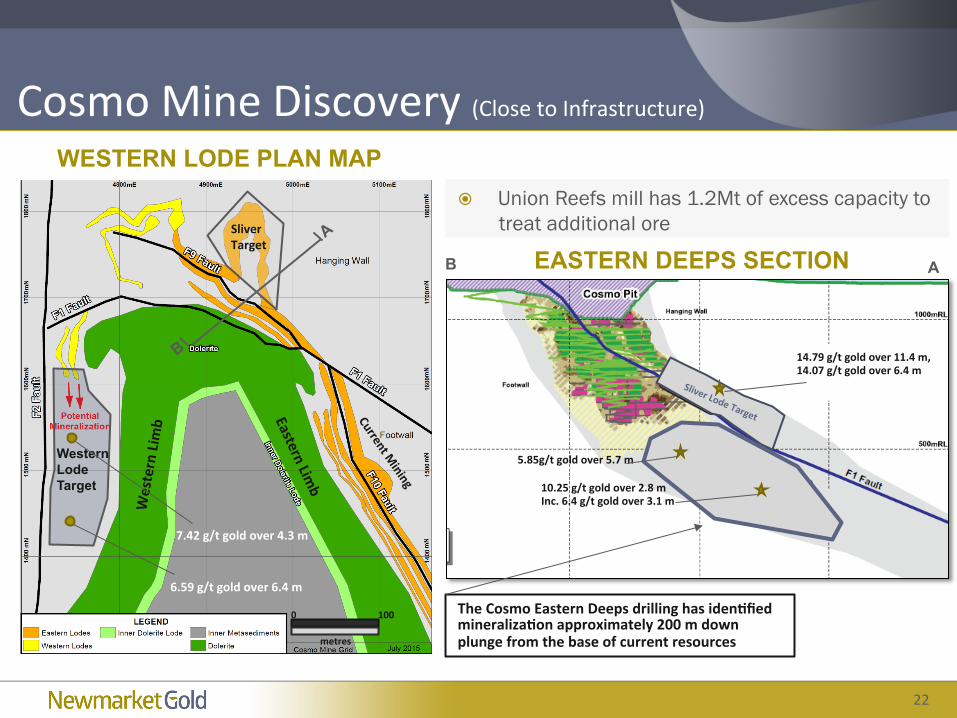
CosmoMineDiscovery(ClosetoInfrastructure)WesternLim
b
0100
metres
Western Lode Target
SliverTarget
7.42g/tgoldover4.3m
6.59g/tgoldover6.4m
CosmoLongSecBon
14.79g/tgoldover11.4m,14.07g/tgoldover6.4m
5.85g/tgoldover5.7m
10.25g/tgoldover2.8mInc.6.4g/tgoldover3.1m
TheCosmoEasternDeepsdrillinghasidenBfiedmineralizaBonapproximately200mdownplungefromthebaseofcurrentresources
WESTERN LODE PLAN MAP
EASTERN DEEPS SECTION
� Union Reefs mill has 1.2Mt of excess capacity to treat additional ore
A B
23
Non-IFRSandAddi?onalInforma?onNon-IFRS Measures Newmarket Gold believes that investors use certain indicators to assess gold mining companies. The indicators are intended to provide additional information and should not be considered in isolation or as a substitute for measures of performance in accordance with the International Financial Reporting Standards. “Operational Cash Costs per Ounce” is a non-IFRS performance measure which could provide an indication of the mining and processing efficiency at the operations. The Company calculates operating cash costs per ounce by deducting silver sales revenue as a by-product from operating expenses per the consolidated statement of operations, then dividing by the gold ounces sold during the applicable period. Operating expenses include mine site operating costs such as mining, processing and administration as well as royalties, however excludes depletion and depreciation, share-based payments and rehabilitation costs. There are variations in the method of computation of “operational cash costs per ounce” as determined by the Company compared with other mining companies. For more detail on the operational cash costs per ounce determination for Newmarket Gold, please visit www.sedar.com or www.newmarketgoldinc.com and review the latest Annual Financial Statements. “All-In Sustaining Costs per Ounce of Gold (“AISC”)” Effective December 31, 2013, the Company has adopted an all-in sustaining cost (“AISC”) performance measure that reflects all of the expenditures that are required to produce an ounce of gold from current operations. While there is no standardized meaning of the measure across the industry, the Company’s definition conforms to the AISC definition as set out by the World Gold Council in its guidance dated June 27, 2013. The World Gold Council is a non-regulatory, non-profit organization established in 1987 whose members include global senior mining companies. The Company believes that this measure will be useful to external users in assessing operating performance and the ability to generate free cash flow from current operations. The Company defines AISC as the sum of operating cash costs (per above), sustaining capital (capital required to maintain current operations at existing levels), capital lease repayments, corporate general and administrative expenses, in-mine exploration expenses and rehabilitation accretion and amortization related to current operations. AISC excludes capital expenditures for significant improvements at existing operations deemed to be expansionary in nature, exploration and evaluation related to growth projects, rehabilitation accretion and amortization not related to current operations, financing costs, debt repayments, share-based compensation not related to operations, and taxes. Additional Information For information regarding mineral resource and reserve estimates, including parameters used to generate the estimates and depletion, please see the technical reports prepared in accordance with National Instrument 43-101 supporting the 2015 Mineral Reserve and Mineral Resource estimates. The reports are titled as follows: Report on the Mineral Resources & Mineral Reserves of the Fosterville Gold Mine, Victoria, Australia, dated March 21, 2016 and effective December 31, 2015. Report on the Mineral Resources & Mineral Reserves of the Northern Territory Operations in the Northern Territory, Australia, dated March 21, 2016 and effective December 31, 2015. Report on the Mineral Resources & Mineral Reserves of the Stawell Gold Mine in the State of Victoria, Australia, dated March 21, 2016 and effective December 31, 2015. Technical Report Mineral Resources of the Maud Creek Gold Project, Northern Territory, Australia dated March 21, 2016 and effective December 31, 2015.


![Announces Q2 results [Result]](https://img.pdfslide.us/doc/110x75/577ca7391a28abea748c4b21/announces-q2-results-result.jpg)