Embed Size (px)
Citation preview
NIKE, IncValuation Report
As of December 31, 2015
Report Date: May 5,2016
Julie Colacurto
1
Table of Contents
Description of the Appraisal Assignment............................. 3
Standard and Premise of Value............................................ 3
Scope of the Report.............................................................. 3
Information Sources ............................................................ 4
Business Description............................................................ 4-5
Industry Overview ............................................................... 5
Financial Statement Reconstruction and Forecasts........... 5-6
Business Valuation Approaches and Methods ................... 7-9
Asset-Based Business Valuation Results ........................... 9-10
Market-Based Business Valuation Results......................... 10-12
Income-Based Business Valuation Results........................12 – 15
Conclusion of Business Value............................................. 15-16
Business Value and Selling Price Considerations ............. 16-18
Business Price Justification................................................ 18
Statement of Limiting Conditions ...................................... 18-19
Appraiser Credentials and Certification ............................ 19-20
List of Abbreviations .......................................................... 20-22
2
Description of the Appraisal Assignment
Certified Business Appraisals, LLC has been retained by Mr. John Doe to estimate the fair market value of NIKE Inc. on a marketable, controlling ownership basis as of January 1, 2016.
The purpose of this appraisal is solely to provide an independent valuation opinion in order to assist Mr. Doe in offering the subject business for sale. As such, this restricted appraisal report is intended for use by Mr. Doe only.
This valuation engagement was conducted in accordance with the Uniform Standards of Professional Appraisal Practice (USPAP), International Valuation Standards and AICPA SSVS No. 1. The estimate of business value that results from this valuation engagement is expressed as a conclusion of business value, elsewhere in this Detailed Report.
Standard and Premise of Value
This appraisal report relies upon the use of fair market value as the standard of value. For the purposes of this appraisal, fair market value is defined as the expected price at which the subject business would change hands between a willing buyer and a willing seller, neither being under a compulsion to conclude the transaction and both having full knowledge of all the relevant facts.
This is essentially identical to the market value basis as it is defined under the International Valuation Standards.
The appraisal was performed under the premise of value in continued use as a going concern business enterprise. In our opinion this premise of value represents the highest and best use of the subject business assets.
Scope of the Report
This report is performed on a restricted report scope basis, as it is defined in USPAP Standard 10. Specifically, the restricted report is not an appraisal report intended for parties other than the client, nor does it seek to meet all the requirements of the Revenue Ruling 59-60.
During the preparation of this report we have made certain assumptions as follows:
We have not conducted a site review of the subject business premises, nor have we audited or otherwise reviewed the business financial statements, which have been provided by the business management and its financial advisors. It was assumed that these financial statements are true and accurate.
Information Sources
3
The following sources of information were used in preparing the appraisal:
1. We conducted interviews with the Client Business, Inc. management team. 2. National, regional and local economic data were compiled and reviewed. The
sources used include [Note: enter your economic research data source references here. See valuadder.com Resources Web page for source suggestions].
3. Research of comparative business sale transaction data has been performed. This included data compilation from the [Note: enter your data source references here] private company and publicly traded company sale databases. The transactional data, however, is not included in this report.
4. We have consulted the for the cost of capital data. These data were used in estimating the appropriate discount and capitalization rates.
5. Business financial statements and tax records of the subject business over the most recent 4 years have been analyzed to estimate the business current performance and outlook for continued income generation.
6. Financial statements, including the company historic Income Statements and Balance Sheets, have been reconstructed to determine the business earning power and provide inputs for the selected business valuation methods.
Business Description
The subject business being valued is NIKE, Inc.; an American Multinational Corporation was incorporated in 1968 under the laws of the state of Oregon.
NIKE, Inc. is located at One Bowerman Drive, Beaverton, OR 97005
Our principal business activity is the design, development and worldwide marketing and selling of high quality footwear, apparel, equipment, and accessory products. NIKE is the largest seller of athletic footwear and athletic apparel in the world. We sell our products to retail accounts, through NIKE-owned retail stores and internet sales, which we refer to as our “Direct to Consumer” operations, and through a mix of independent distributors and licensees, in over 170 countries around the world. Virtually all of our products are manufactured by independent contractors. Virtually all footwear and apparel products are produced outside the United States, while equipment products are produced both in the United States and abroad.
NIKE Inc. has been founded in 1985 at its current location in Oregon. It provides a broad range of general business management and marketing advice services to local privately held businesses.
In fiscal 2011, sales in the United States including U.S. sales of our Other Businesses accounted for approximately 43% of total revenues, compared to 42% in fiscal 2010 and 2009. Our Other Businesses were primarily comprised of our affiliate brands; Cole Haan, Converse, Hurley and Umbro (which was acquired on March 3, 2008); and NIKE Golf. We estimate that we sell to more than 20,000 retail accounts in the United States. The NIKE Brand domestic retail account base includes a mix of footwear stores, sporting goods
4
stores, athletic specialty stores, department stores, skate, tennis and golf shops, and other retail accounts. During fiscal 2011, our three largest customers accounted for approximately 23% of sales in the United States.
We make substantial use of our “futures” ordering program, which allows retailers to order five to six months in advance of delivery with the commitment that their orders will be delivered within a set time period at a fixed price. In fiscal 2011, 87% of our U.S. wholesale footwear shipments (excluding our Other Businesses) were made under the futures program, compared to 89% in fiscal 2010 and 2009. In fiscal 2011, 60% of our U.S. wholesale apparel shipments (excluding our Other Businesses) were made under the futures program, compared to 62% in fiscal 2010 and 60% in fiscal 2009.
Industry Overview
The athletic footwear, apparel, and equipment industry is keenly competitive in the United States and on a worldwide basis. We compete internationally with a significant number of athletic and leisure shoe companies, athletic and leisure apparel companies, sports equipment companies, and large companies having diversified lines of athletic and leisure shoes, apparel, and equipment, including Adidas, Puma, and others. The intense competition and the rapid changes in technology and consumer preferences in the markets for athletic and leisure footwear and apparel, and athletic equipment, constitute significant risk factors in our operations.
NIKE is the largest seller of athletic footwear and athletic apparel in the world. Performance and reliability of shoes, apparel, and equipment, new product development, price, product identity through marketing and promotion, and customer support and service is important aspects of competition in the athletic footwear, apparel, and equipment industry. To help market our products, we contract with prominent and influential athletes, coaches, teams, colleges and sports leagues to endorse our brands and use our products, and we actively sponsor sporting events and clinics. We believe that we are competitive in all of these areas.
Financial Statement Reconstruction and Forecasts
Accurate estimation of business value depends upon the subject business financial performance. While historical financials are important, business value relies upon the ability of the business to continue producing desired economic benefits for its owners.
Many closely held companies are managed to minimize taxable income. To determine the business value accurately, the company's historic financial statements, such as its Income Statements and Balance Sheets, generally require certain adjustments.
The objective of these adjustments is to reconstruct the historic financial statements in order to reveal the true economic potential and earning power of the subject business.
All financial values incorporated in this Report are in USD.
5
Earnings Basis used for Business Valuation
Business valuation generally relies upon some measure of business cash flows as the earnings basis. The most commonly used earnings basis measures include:
Seller's discretionary cash flow (SDCF).
Net cash flow.
Seller's Discretionary Cash Flow
A widely accepted definition of SDCF is:
1. Pre-tax business net profit. 2. Plus total compensation of a single owner-operator. 3. Plus adjustment of all other working owners ‘compensation to market rate
(manager replacement). 4. Plus annual depreciation and amortization expense. 5. Plus interest expense. 6. Plus non-recurring expenses. 7. Plus expenses not related to the business operations.
This is also referred to as the Seller's Discretionary Earnings (SDE).
Net Cash Flow
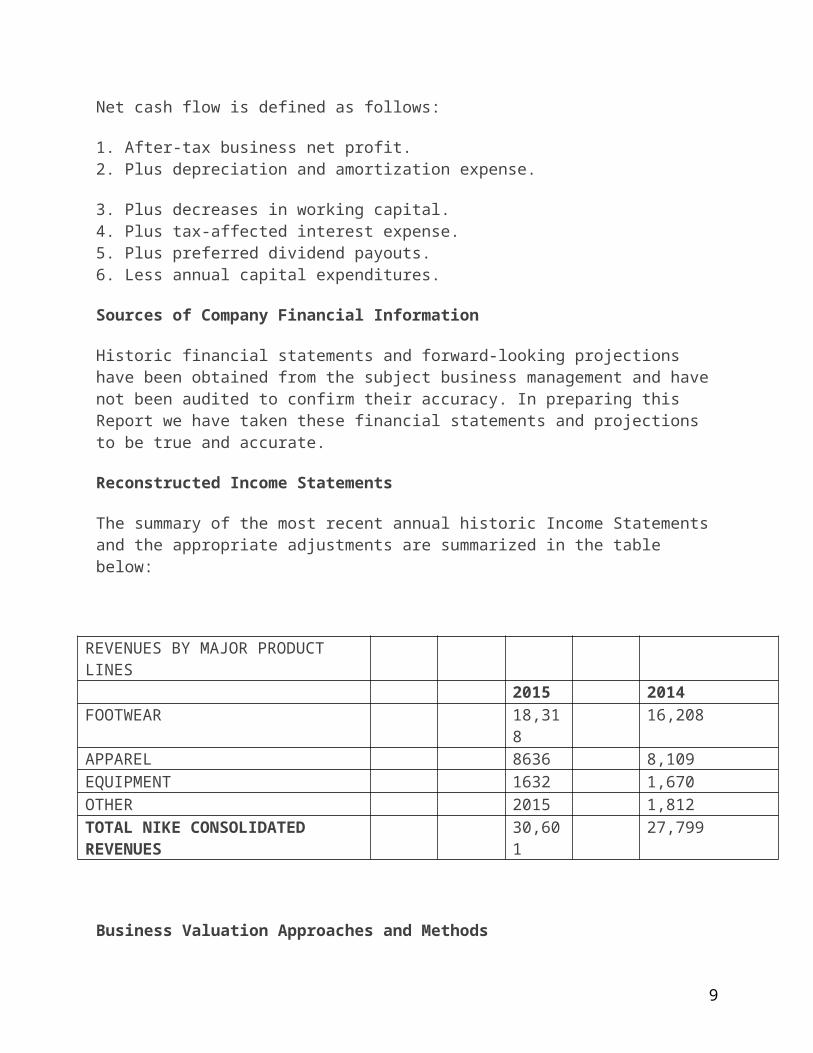
Net cash flow is defined as follows:
1. After-tax business net profit.2. Plus depreciation and amortization expense.
3. Plus decreases in working capital.4. Plus tax-affected interest expense.5. Plus preferred dividend payouts.6. Less annual capital expenditures.
Sources of Company Financial Information
Historic financial statements and forward-looking projections have been obtained from the subject business management and have not been audited to confirm their accuracy. In preparing this Report we have taken these financial statements and projections to be true and accurate.
Reconstructed Income Statements
6
The summary of the most recent annual historic Income Statements and the appropriate adjustments are summarized in the table below:
REVENUES BY MAJOR PRODUCT LINES2015 2014
FOOTWEAR 18,318 16,208APPAREL 8636 8,109EQUIPMENT 1632 1,670OTHER 2015 1,812TOTAL NIKE CONSOLIDATED REVENUES
30,601 27,799
Business Valuation Approaches and Methods
There are three fundamental ways to measure the value of a business or professional practice:
Asset approach.
Market approach.
Income approach.
Under each approach, a number of methods are available which can be used to determine the value of a business enterprise. Each business valuation method uses a specific procedure to calculate the business value.
No one business valuation approach or method is definitive. Hence, it is common practice to use a number of business valuation methods under each approach. The business value then is determined by reconciling the results obtained from the selected methods. Typically, a weight is assigned to the result of each business valuation method. Finally, the sum of the weighted results is used to determine the value of the subject business.
This process of concluding the business value is referred to as the business value synthesis.
Asset Approach
7
The asset approach to business valuation considers the underlying business assets in order to estimate the value of the overall business enterprise. This approach relies upon the economic principle of substitution and seeks to estimate the costs of re- creating a business of equal economic utility, i.e. a business that can produce the same returns for its owners as the subject business.
The business valuation methods under the Asset Approach include:
Asset accumulation method.
Capitalized excess earnings method. Market Approach
Under the Market Approach to business valuation, one consults the market place for indications of business value. Most commonly, sales of similar businesses are studied to collect comparative evidence that can be used to estimate the value of the subject business. This approach uses the economic principle of competition, which seeks to estimate the value of a business in comparison to similar businesses whose value has been recently established, by the market.
The business valuation methods under the Market Approach are:
Comparative private company transaction method.
Comparative publicly traded company transaction method. Income Approach
The Income Approach to business valuation uses the economic principle of expectation to determine the value of a business. To do so, one estimates the future returns the business owners can expect to receive from the subject business. These returns are then matched against the risk associated with receiving them fully and on time.
The returns are estimated as either a single value or a stream of income expected to be received by the business owners in the future. The risk is then quantified by means of the so-called capitalization or discount rates.
The methods, which rely upon a single measure of business earnings, are referred to as direct capitalization methods. Those methods that utilize a stream of income are known as the discounting methods. The discounting methods account for the time value of money directly and determine the value of the business enterprise as the present value of the projected income stream.
The methods under the Income Approach include:
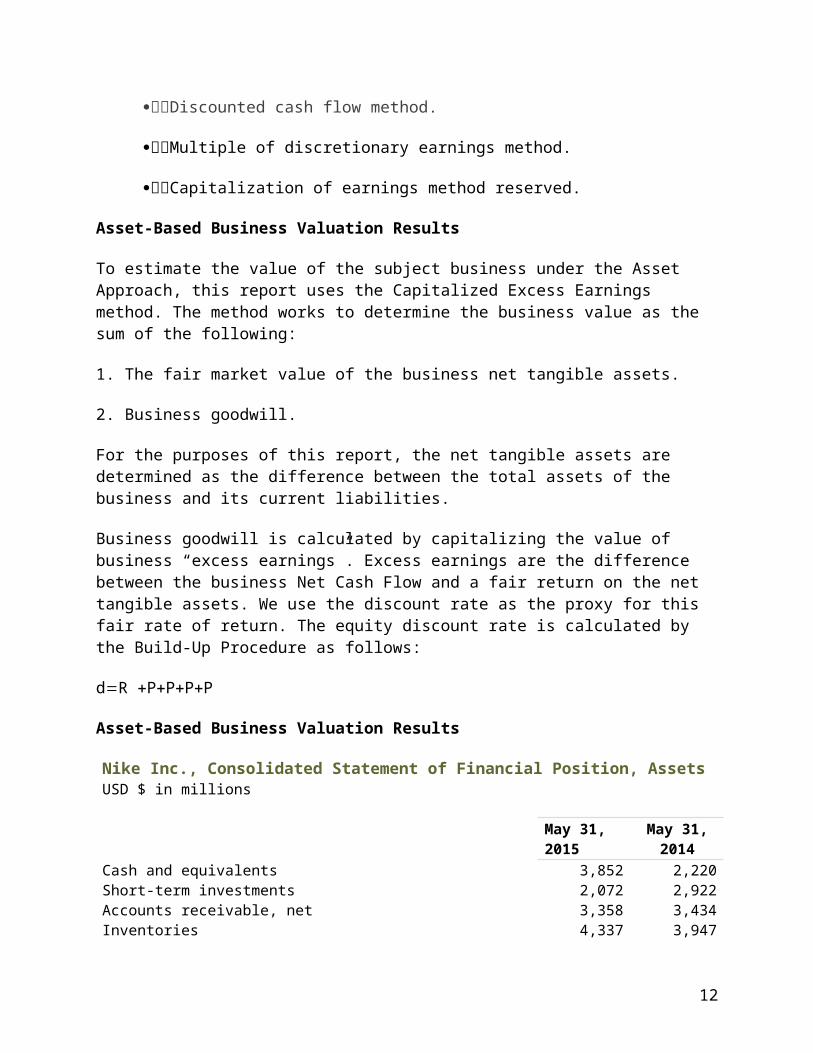
Discounted cash flow method.
Multiple of discretionary earnings method.
8
Capitalization of earnings method reserved.
Asset-Based Business Valuation Results
To estimate the value of the subject business under the Asset Approach, this report uses the Capitalized Excess Earnings method. The method works to determine the business value as the sum of the following:
1. The fair market value of the business net tangible assets.
2. Business goodwill.
For the purposes of this report, the net tangible assets are determined as the difference between the total assets of the business and its current liabilities.
Business goodwill is calculated by capitalizing the value of business “excess earnings”. Excess earnings are the difference between the business Net Cash Flow and a fair return on the net tangible assets. We use the discount rate as the proxy for this fair rate of return. The equity discount rate is calculated by the Build-Up Procedure as follows:
dR PPPP
Asset-Based Business Valuation Results
Nike Inc., Consolidated Statement of Financial Position, AssetsUSD $ in millions
May 31, 2015
May 31, 2014
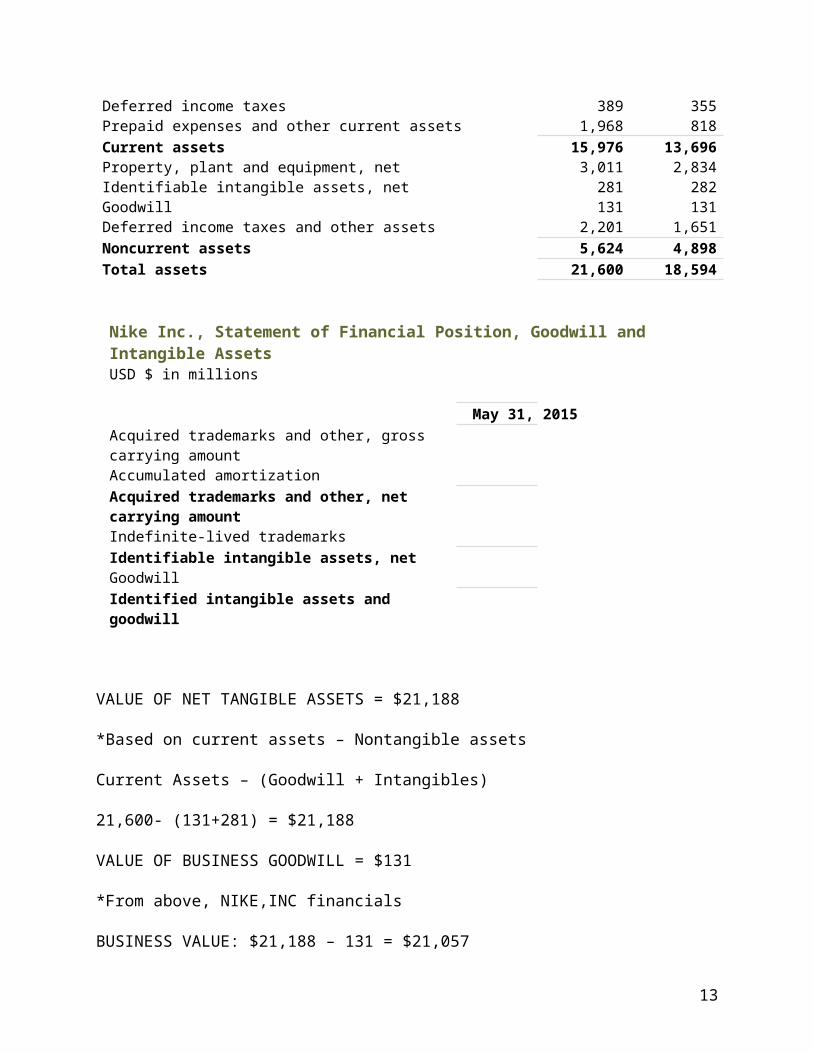
Cash and equivalents 3,852 2,220Short-term investments 2,072 2,922Accounts receivable, net 3,358 3,434Inventories 4,337 3,947Deferred income taxes 389 355Prepaid expenses and other current assets 1,968 818Current assets 15,976 13,696Property, plant and equipment, net 3,011 2,834Identifiable intangible assets, net 281 282Goodwill 131 131Deferred income taxes and other assets 2,201 1,651Noncurrent assets 5,624 4,898Total assets 21,600 18,594
Nike Inc., Statement of Financial Position, Goodwill and Intangible Assets
9
USD $ in millions
May 31, 2015Acquired trademarks and other, gross carrying amountAccumulated amortizationAcquired trademarks and other, net carrying amountIndefinite-lived trademarksIdentifiable intangible assets, netGoodwillIdentified intangible assets and goodwill
VALUE OF NET TANGIBLE ASSETS = $21,188
*Based on current assets – Nontangible assets
Current Assets – (Goodwill + Intangibles)
21,600- (131+281) = $21,188
VALUE OF BUSINESS GOODWILL = $131
*From above, NIKE,INC financials
BUSINESS VALUE: $21,188 – 131 = $21,057
Although, this business value amount of $21,057 in millions would be rejected for NIKE, INC, Asset-Method Approach since it is not accurate to use for such a huge corporation as NIKE,INC is since it’s not a consistent and reliable method to use.
REJECT ASSET-METHOD APPROACH
Market-Based Business Valuation Results
The following illustrates how to calculate the market based business valuation for NIKE, INC however, the market based approach will not be used and rejected since that type of information isn’t available to use.
The athletic footwear, apparel, and equipment industry is keenly competitive in the United States and on a worldwide basis so NIKE,INC does have a good amount of competition, NIKE competes internationally with a significant number of athletic and leisure shoe companies, athletic and leisure apparel companies, sports equipment companies, and large companies having diversified lines of athletic and leisure shoes, apparel, and equipment.
10
Some competition in the industry is Adidas, Reebook, Under Armour, and Puma to name a few. The intense competition and the rapid changes in technology and consumer preferences in the markets for athletic and leisure footwear and apparel, and athletic equipment, constitute significant risk factors in NIKE’s operations.
The market-based business valuation relies upon the comparison of the subject business to similar businesses that have actually sold. There are several sources of market data commonly used:
Publicly traded company sales.
Private company sales.
Previous sales of the subject business.
In this report, we would use the private company sales data. The companies selected for comparison are closely held firms which resemble the subject business in terms of their financial and operational characteristics.
We would utilize the Comparative Transaction Method to estimate the value of the subject business. Under this method, one determines the so-called valuation multiples which relate some measure of business financial performance to its potential selling price. Typical valuation multiples are:
Price divided by the business gross revenues or net sales.
Price divided by the seller’s discretionary cash flow.
Price divided by the business net cash flow.
Price divided by EBIT, EBT, or EBITDA.
Price divided by the fair market value of the business asset base.
Each valuation multiple is a ratio statistically derived from the selling prices and financials of the sold private companies in the same industry as the subject business.
We calculate each valuation multiple as a weighted average of the lowest (minimum), median, average and highest (maximum) values as follows: a weight of 50% is assigned to the median valuation multiple, 25% to the average, and 12.5% each to the minimum and maximum values.
REJECT MARKET APPROACH
Income-Based Business Valuation Results
11
Discounted Cash Flow method
This income-based business valuation method provides highly accurate estimate of business value based on the business earning potential. Under this method, we determine the business value by discounting the future business earnings using the so-called discount rate which captures the business risk.
The use of this method requires the following three inputs:
1. Business net cash flow forecast over a pre-determined future period
2. Discountrate3. Long-term residual business value
Our Income Statement forecast provides the net cash flow numbers five years into the future. Since the subject business is debt-free, we use the equity discount rate calculated earlier. Finally, the residual business value which represents that portion of business value past the net cash flow projection period is calculated as follows:
R = CF5 x (1+ g)
(d-g)
CF5 is the net cash flow estimated in year 5 of our forecast, g is the long-term growth rate in the net cash flow, and d is the discount rate. We calculate g as the average growth rate given our five-year cash flow projection. The residual business value at the end of year 5 is thus 14.07% so, year 5, would be in year 2021 – Now Nike has Revenues for 2015 at 30.7 billion so in 5 years would increase by about 14% so in 5 years, Revenues would be at about 34.3 billion, would increase by about 4 billion dollars.
Earnings Basis Calculation
To determine the business value using this method, we use the Seller’s Discretionary Cash Flow (SDCF) as the basic measure of the business earning power.
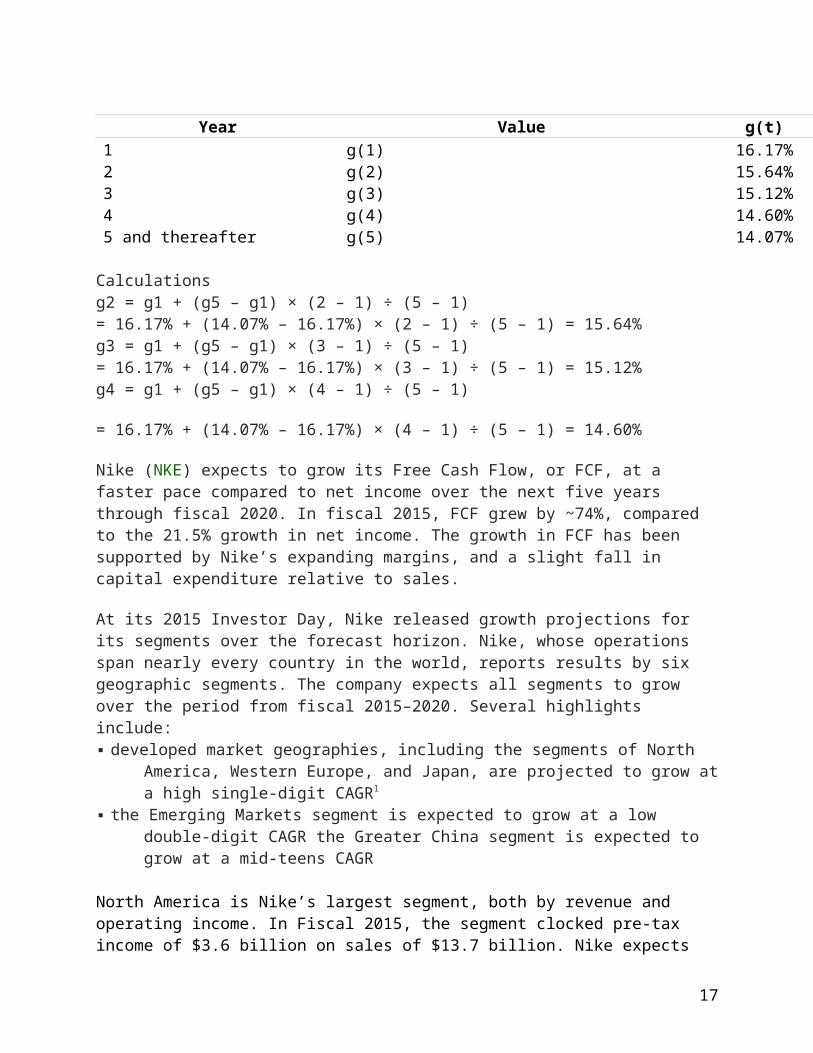
Nike Inc., H-model
Year Value g(t)1 g(1) 16.17%2 g(2) 15.64%3 g(3) 15.12%4 g(4) 14.60%5 and thereafter g(5) 14.07%
12
Calculationsg2 = g1 + (g5 – g1) × (2 – 1) ÷ (5 – 1)= 16.17% + (14.07% – 16.17%) × (2 – 1) ÷ (5 – 1) = 15.64%g3 = g1 + (g5 – g1) × (3 – 1) ÷ (5 – 1)= 16.17% + (14.07% – 16.17%) × (3 – 1) ÷ (5 – 1) = 15.12%g4 = g1 + (g5 – g1) × (4 – 1) ÷ (5 – 1)
= 16.17% + (14.07% – 16.17%) × (4 – 1) ÷ (5 – 1) = 14.60%
Nike (NKE) expects to grow its Free Cash Flow, or FCF, at a faster pace compared to net income over the next five years through fiscal 2020. In fiscal 2015, FCF grew by ~74%, compared to the 21.5% growth in net income. The growth in FCF has been supported by Nike’s expanding margins, and a slight fall in capital expenditure relative to sales.
At its 2015 Investor Day, Nike released growth projections for its segments over the forecast horizon. Nike, whose operations span nearly every country in the world, reports results by six geographic segments. The company expects all segments to grow over the period from fiscal 2015–2020. Several highlights include:▪ developed market geographies, including the segments of North America, Western
Europe, and Japan, are projected to grow at a high single-digit CAGR1
▪ the Emerging Markets segment is expected to grow at a low double-digit CAGR the Greater China segment is expected to grow at a mid-teens CAGR
North America is Nike’s largest segment, both by revenue and operating income. In Fiscal 2015, the segment clocked pre-tax income of $3.6 billion on sales of $13.7 billion. Nike expects $20 billion in sales from the segment by fiscal 2020. Sales of women’s products are expected to be a key driver for Nike’s sales. Nike currently derives most of its sales from men’s products. The company is also looking to expand its presence across channels. You’ll read more on these growth drivers in Parts 5, 6, and 7 of this series.The value of the Shares relates directly to the value of the precious metal held by the Trust and fluctuations in the price could materially adversely affect investment in the Shares. Several factors may affect the price of precious metals, including:
· A change in economic conditions, such as a recession, can adversely affect the price of the precious metal held by the Trust. Some metals are used in a wide range of industrial applications, and an economic downturn could have a negative impact on its demand and, consequently, its price and the price of the Shares;
· Investors’ expectations with respect to the rate of inflation;
· Currency exchange rates; interest rates;
· Investment and trading activities of hedge funds and commodity funds; and
· Global or regional political, economic or financial events and situations
13
Business valuation factor values selection
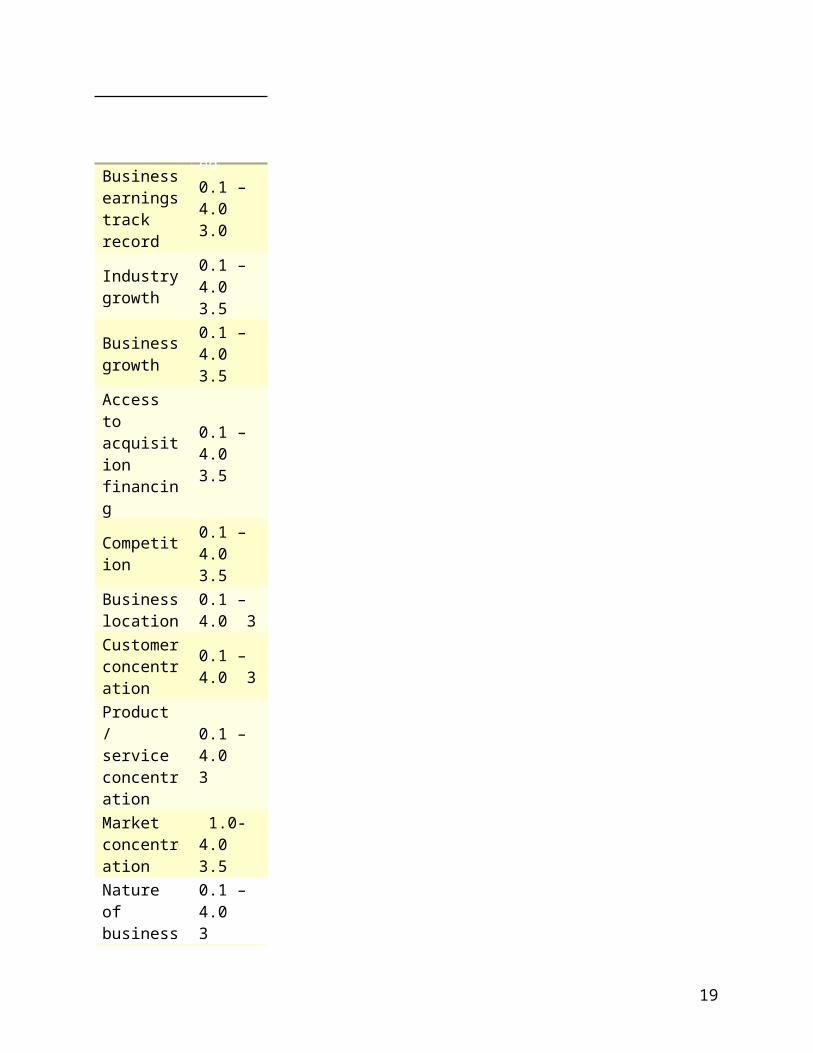
This SDCF measure is then capitalized by an appropriate multiplier. The multiplier is derived by analyzing the subject business performance across 14 financial and operational areas. Each area is associated with a valuation factor. We assign a numerical value to each factor as follows:
Valuation Factor
Range Assigned Value
Business earnings track record
0.1 – 4.0 3.0
Industry growth
0.1 – 4.0 3.5
Business growth
0.1 – 4.0 3.5
Access to acquisition financing
0.1 – 4.0 3.5
Competition
0.1 – 4.0 3.5
Business location
0.1 – 4.0 3
Customer concentration
0.1 – 4.0 3
Product / service concentration
0.1 – 4.0 3
Market concentration
1.0-4.0 3.5
Nature of business
0.1 – 4.0 3
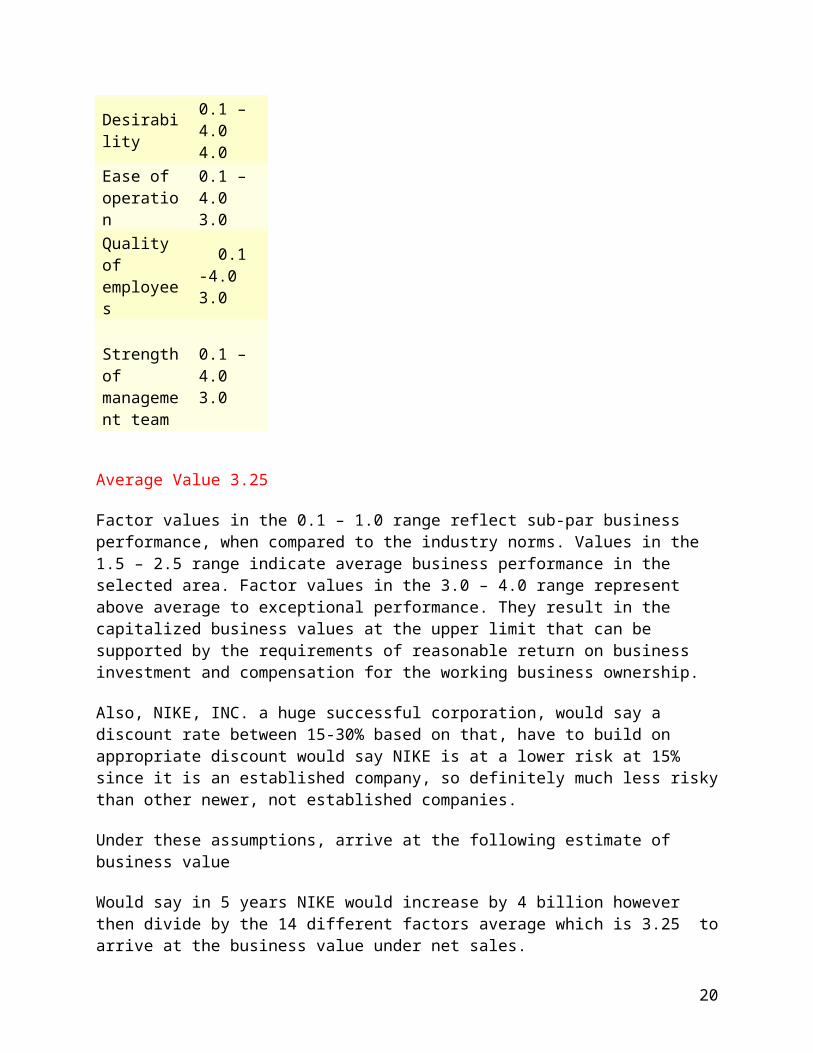
Desirability0.1 – 4.0 4.0
Ease of operation
0.1 – 4.0 3.0
14
Quality of employees
0.1 -4.0 3.0
Strength of management team
0.1 – 4.0 3.0
Average Value 3.25
Factor values in the 0.1 – 1.0 range reflect sub-par business performance, when compared to the industry norms. Values in the 1.5 – 2.5 range indicate average business performance in the selected area. Factor values in the 3.0 – 4.0 range represent above average to exceptional performance. They result in the capitalized business values at the upper limit that can be supported by the requirements of reasonable return on business investment and compensation for the working business ownership.
Also, NIKE, INC. a huge successful corporation, would say a discount rate between 15-30% based on that, have to build on appropriate discount would say NIKE is at a lower risk at 15% since it is an established company, so definitely much less risky than other newer, not established companies.
Under these assumptions, arrive at the following estimate of business value
Would say in 5 years NIKE would increase by 4 billion however then divide by the 14 different factors average which is 3.25 to arrive at the business value under net sales.
Business Value: $ 1,230,769,230.76 so about $1,230,769,231
Conclusion of Business Value
We relied upon methods such as the Asset, Market and Income Approaches to business valuation. Although, the asset as well as the market approach were both rejected since the asset isn’t relevant to a huge corporation as business and the market approach isn’t available to do since all the information needed isn’t available. Used the results obtained from just income approach business valuation methods to provide an estimate of the subject business value. In a manner of opinion just the business valuation method utilized in this report that is relevant is the income approach.
Business Valuation Method
Weight weighted value
15
Asset 0 0
Market 0 0
Income100% $1,230,769,231
Business Value and Selling Price Considerations
A number of consideration affect the price a business sells for. We consider the major factors in what follows.
Business sale financing
Small business purchases are generally financed by a blend of debt and equity capital. The most common forms of equity financing are the buyer down payment. The common sources such as the government-backed or commercial bank loan.
This is quite different from the merger and acquisition deals involving publicly traded companies. These companies have direct access to the public capital markets which makes raising the required acquisition capital much easier than for closely held firms.
Access to adequate debt and equity capital required to successfully close the deal is a major prerequisite to a successful small business sale.
Business sale terms
The terms of a small business purchase can make a substantial difference to the actual selling price. The amount of equity capital required from the buyer to close the deal has a material effect on the type of return the buyer can expect from the investment.
On the other hand, debt financing terms, whether offered by the seller or secured from a bank, affect the levels of cash flow required from the small business to make its acquisition financially worthwhile.
Availability of debt financing on reasonable terms can have a major impact on the price the business ultimately sells for.
As is customary, our business valuation conclusions are done at “face value”, which is not adjusted for the terms of a business sale.
16
Business buyer and seller motivations
The price a business sells for depends on the motivations of the seller and the buyer.
There are a number of reasons a business may be offered for sale, including:
Owner death or poor health
Retirement
Search for new business opportunities
Burnout
Partner disputes
Unsatisfactory business financial performance or lack of investment capital.
Ideally, the seller can command the highest selling price if the business sale is timed when the business financial performance is at its peak and market conditions for the business sale are best. In reality, circumstances may compel the seller to put the business on the market when the conditions are less than optimal, thus affecting the actual selling price.
A buyer may be motivated by a number of factors which may affect what he or she is prepared to pay for the business:
Replacing a job income
Looking for a business which complements the buyer’s existing businesses
The capital available for a business purchase
How well the buyer’s skill set matches the key business requirements
Buyer’s long-term goals and lifestyle considerations.
In particular, the buyer’s investment goals, compensation requirements and available acquisition capital may make a material difference to the offer price and terms.
Business Price Justification
In this section we review a potential business selling price and reasonableness of terms based on a hypothetical business sale scenario. Our objective is to calculate the cash flow required from the business to reasonably support its acquisition.
17
This review is based on the assumption of an arms-length transaction and does not account for synergistic benefits that may be realized by a specific business buyer.
We assume the typical asset sale acquisition scenario, common to most of small business purchases. Under this scenario, the buyer acquires the underlying business assets without the assumption of its liabilities.
In addition to the purchase price, the buyer will need to inject adequate working capital to support normal business operations.
To conclude the business purchase, the buyer will also incur certain transaction costs. These costs typically include professional and brokerage fees, licenses and permits, financing charges and closing costs.
Given an acquisition deal structure, the business cash flow must cover the following requirements:
Debt service, including adequate debt service coverage ratio.
Reasonable return on the business buyer’s down payment.
Sufficient compensation for the owner-operator.
Capital expenditures needed to operate the business.
Statement of Limiting Conditions
This business appraisal relies upon the following contingent and limiting conditions:
1. We assume no responsibility for the legal matters including, but not limited to, legal or title concerns. Title to all subject business assets is assumed good and marketable.
2. The business interest and subject business assets have been appraised free and clear of any liens or encumbrances unless stated otherwise. No hidden or apparent conditions regarding the subject business assets or their ownership are assumed to exit.
3. All information provided by the client and others is thought to be accurate. However, we offer no assurance as to its accuracy.
4. Unless stated other wise in this report, we have assumed compliance with the applicable federal, state and local laws and regulations.
5. Absent a statement to the contrary, we have assumed that no hazardous conditions or materials exist which could affect the subject business or its assets. However, we are not qualified to establish the absence of such conditions or materials, nor do we assume the responsibility for discovering the same.
6. Per agreement with the client, this is a restricted appraisal report as defined under the USPAP Standard 10. Not all pertinent information has been considered nor was
18
a comprehensive valuation undertaken. This may affect the value conclusions presented in this report.
7. There port may not fully disclose all the information sources, discussions and business valuation methodologies used to reach the conclusion of value. Supporting information concerning this report is on file with the business appraiser.
8. The valuation analysis and conclusion of value presented in the report are for the purpose of this engagement only and are not to be used for any other reason, any other context or by any other person except the client to whom the report is addressed.
9. The opinion of value expressed in this report does not obligate us to render a comprehensive business appraisal report, to give testimony, or attend court proceedings with regard to the subject business assets, properties or business interests, unless such arrangements have been made previously.
10. Possession of this report does not imply a permission to publish the same or any part thereof. No part of this report is to be communicated to the public by means of advertising, news releases, sales and promotions or any other media without a prior written consent and approval by us.
11. This report is valid only for the date specified herein.
Appraiser Credentials and Certification
Analyst, ASA, CBA, MBA
Master of Business Administration, Finance, Harward Business School. University of California, Berkeley, Bachelor of Science, Finance.
American Society of Appraisers, Accredited Senior Appraiser, Business Valuation.
Institute of Business Appraisers, Certified Business Appraiser.
Position and Experience
Senior Valuation Analyst, Partner, Certified Business Appraisals, LLC.
Professional Affiliations
American Society of Appraisers Institute of Business Appraisers
I certify that, to the best of my knowledge and belief, the statements of fact contained in this report are true and correct; the reported analyses, opinions, and conclusions are limited only by the reported assumptions and limiting conditions and are my personal, impartial, and unbiased professional analyses, opinions, and conclusions. I have no present or prospective interest in the property that is the subject of this report, and I have no personal interest with respect to the parties involved. I have performed no services, as an appraiser or in any other capacity, regarding the property that is the subject of this report
19
within the three-year period immediately preceding acceptance of this assignment. I have no bias with respect to the property that is the subject of this report or to the parties involved with this assignment. My engagement in this assignment was not contingent upon developing or reporting predetermined results. My compensation for completing this assignment is not contingent upon the development or reporting of a predetermined value or direction in value that favors the cause of the client, the amount of the value opinion, the attainment of a stipulated result, or the occurrence of
a subsequent event directly related to the intended use of this appraisal. My analyses, opinions, and conclusions were developed, and this report has been prepared, in conformity with the Uniform Standards of Professional Appraisal Practice. No one provided significant business and/or intangible asset appraisal assistance to the person signing this certification.
Signed, Analyst
List of Abbreviations
Asset Sale – a type of small business sale transaction in which all underlying business assets transfer from the seller to the buyer. The buyer assumes no business liabilities.
Average – the arithmetic mean value, calculated by adding all the values in a set and dividing the sum by their number. For the business selling price, the average is the sum of all the deal prices divided by the number of the recorded business sales.
Days on Market – the time in days from the date the business is listed for sale until the transaction closes.
Earnout – a portion of the business purchase price that is made contingent upon the business achieving some future measure of economic performance. For example, the earnout can be structured as a percentage of sales in excess of some base number, paid over some future period of time and limited to a maximum.
EBITDA – earnings before interest, tax, depreciation and amortization.
EBIT – earnings before interest and tax expense. EBT – earnings before tax expense.
FF&E – the portion of business operating asset base comprising its furniture, fixtures and equipment.
Max – the maximum value in a set of values. For the business selling price, this is typically the highest recorded selling price value.
Median – the mid-range value with half of the values in the set falling below it and another half being above it. For the business selling price, the median price means that 50% of the
20

business sales were done at prices below the median, and the remaining 50% of the sales had prices above the median.
Min – the minimum value in a set of values. For the business selling price, this is typically the lowest recorded selling price value.
N/A – not available.
Pricing Multiple – a statistically derived ratio of the business selling price to a measure of the business economic performance such as the business revenue, profit or cash flow.
Purchase Price – the total monetary consideration paid for the business equity. Includes intangibles such as non-compete agreements, excludes real estate, long-term liabilities assumed, and earnouts.
Purchase Price ÷ Net Sales – a pricing multiple which equals the purchase price divided by the business net sales.
Purchase Price ÷ EBT – a pricing multiple which equals the purchase price divided by the business earnings before tax.
Purchase Price ÷ Net Income – a pricing multiple which equals the purchase price divided by the business net income.
SDCF – seller’s discretionary cash flow is the business net pre-tax income before a single owner’s total compensation, plus amortization, depreciation, interest expense and adjusted for any extraordinary, non-recurring or non-business related income or expenses.
Selling Price – the monetary consideration paid for 100% of business ownership interest in an asset sale transaction. The Selling Price includes all business assets except cash, accounts receivable and inventory. Accounts payable are also excluded. The Selling Price does not include any long-term liabilities assumed by the buyer.
Selling Price ÷ Gross Revenue – a pricing multiple which equals the business selling price divided by the gross annual sales.
Selling Price ÷ SDCF – a pricing multiple which equals the business selling price divided by the SDCF.
SIC – Standard Industrial Classification, a US classification system grouping like businesses under the same numerical code.
Total Invested Capital – the purchase price plus all long-term business liabilities that are assumed by the buyer.
21

Total Invested Capital ÷ EBIT – a pricing multiple which equals the total invested capital divided by the business earnings before interest and taxes.
Total Invested Capital ÷ Gross Profit – a pricing multiple which equals the total invested capital divided by the firm’s gross profit.
Total Invested Capital ÷ Net Sales – a pricing multiple which equals the total invested capital divided by the business net sales.
22
R
23
24