Embed Size (px)
Citation preview

Micro-Enterprises and their Contribution to UK Job Growth
Michael Anyadike-Danes, Karen Bonner & Mark Hart
Enterprise Research Centre
Presentation to ERC Workshop on “Realising Growth Potential of New Enterprises, 1st June 2015, London

New Firms and Micro-Enterprises
• Simple question: what has been the contribution of new firms and micro-enterprises to job growth – especially since 2008
• Data – use ONS Business Structure Database (BSD) – based on annual extracts from the IDBR
• UK longitudinal business demography dataset constructed by ERC – focus on ‘employer enterprises’ in the analysis

Presentation Structure
• Micro-enterprises in context
– Job Creation and Destruction since the ‘Great Recession’
– Job Creation - HGFs and non-HGFs
– Size Distribution; Sector; Age
• Survival
• Growth
• Start-ups

Job Creation: HGFs and non-HGFs

Job Creation and Destruction since the Great Recession (ONS:BSD)

Private Sector Micro-Enterprises 2004 -2014 (Source: ONS BSD)
2014
• 1.5m micro-businesses in UK, 3.5m employees
• Total UK businesses = 1.7m, total employees=19.3m
2004
• 1.2m micro-businesses in UK, 3.1m employees
• Total UK businesses = 1.4m, total employees=18.4m

Firms & Employees by Size 2014
0
10
20
30
40
50
60
70
80
90
100
1-9 10-49 50-99 100-249 250+
% o
f To
tal
Firms
Employees

Average Size of Firms by Size-band
2004 2005 2008 2010 2014
1-9 2.5 2.5 2.4 2.5 2.4
10-49 19.7 19.7 19.5 19.4 19.2
50-99 69.5 69.4 69.1 69.1 68.6
100-249 152.8 152.9 152.5 151.9 153.2
250+ 1437.3 1488.0 1499.2 1510.7 1471.7

Micro-Enterprises by Sector 2014
0.0
5.0
10.0
15.0
20.0
25.0
30.0
35.0
40.0
45.0
50.0
% S
har
e o
f fi
rms
Micro
All Firms

Sectoral Distribution of Employees within Micro-Enterprises 2014
0.0
5.0
10.0
15.0
20.0
25.0
30.0
35.0
40.0
% o
f Em
plo
yee
s
Micro
All Firms

Composition of Sectors by Size & Employees 2014
0%
10%
20%
30%
40%
50%
60%
70%
80%
90%
100%
% o
f Em
plo
yee
s
Large (250 +)
Med (50-249)
Other Small (10-49)
Micro (1-9)
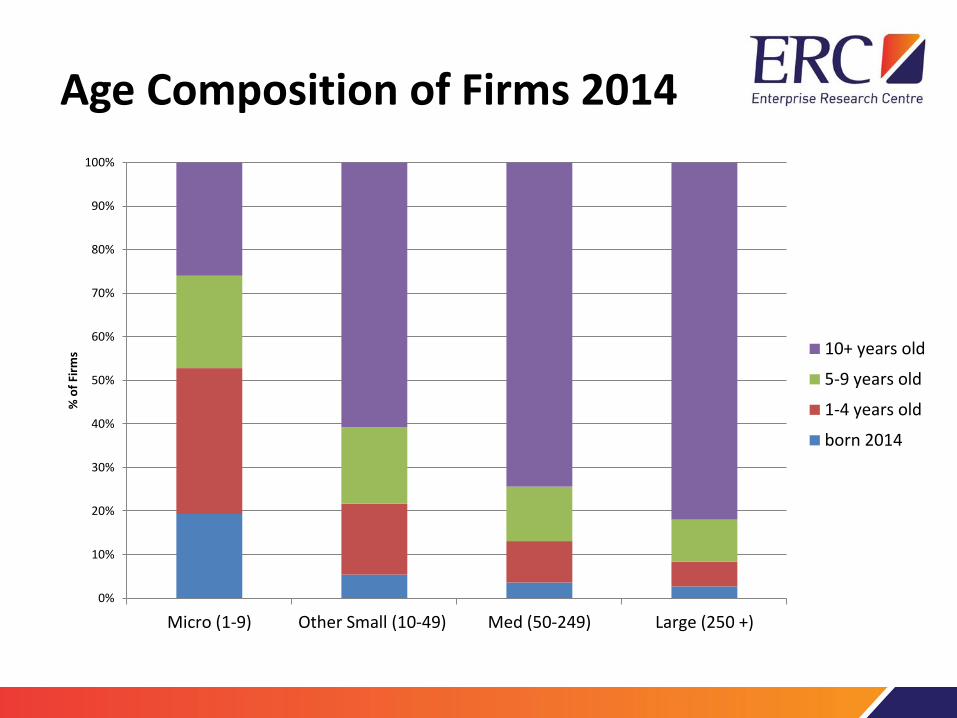
Age Composition of Firms 2014
0%
10%
20%
30%
40%
50%
60%
70%
80%
90%
100%
Micro (1-9) Other Small (10-49) Med (50-249) Large (250 +)
% o
f Fi
rms 10+ years old
5-9 years old
1-4 years old
born 2014

Composition of Employees by Firm Age 2014
0%
10%
20%
30%
40%
50%
60%
70%
80%
90%
100%
Micro (1-9) Other Small (10-49) Med (50-249) Large (250 +)
% o
f Em
plo
yee
s
10+ years old
5-9 years old
1-4 years old
born 2014

Survival Rates: Firms born 2009
20%
30%
40%
50%
60%
70%
80%
90%
100%
Born 2009 1 Year 2 Year 3 Year 4 Year 5 Year
% o
f fi
rms
bo
rn in
eac
h c
ate
gory
su
rviv
ing
Micro
Small
Med/Large
17k -> 7k
2877 ->1172
186k -> 70k

Survival Rates: Firms born 2004
20%
30%
40%
50%
60%
70%
80%
90%
100%
Born 2004 1 Year 2 Year 3 Year 4 Year 5 Year
% o
f fi
rms
bo
rn in
eac
h c
ate
gory
su
rviv
ing
Micro
Small
Med/Large
23k -> 10k
246k -> 92k
3769 -> 1500

Employment Growth for 5 Year Survivors, born 2009

Origin – Destination of Survivor Firms by Size (Born 2009)
sizeband14
sizeband09 1-9 10-49 50+ Total
1-9 70971 4221 289 75481
10-49 1163 1406 264 2833
50+ 68 85 228 381
Total 72202 5712 781 78695

Growth Rate Distribution (avg. annual growth) 2009-14: Born 2009
0
5
10
15
20
25
30
35
40
45
50
-20 orless
-20 to -10
-10 to -5 -5 to -1 0 1 to 5 5 to 10 10 to 20 20+
% o
f Fi
rms
in e
ach
siz
eb
and
Micro
Small
Med/Large

Contribution to Job Growth 2009-14: Born 2009
-100,000
-50,000
0
50,000
100,000
150,000
200,000
250,000
positive growth negative growth
Nu
mb
er
of
em
plo
yee
s
med/large
small
micro
net change in emp=176,077

Start-ups (2013) – Surviving to 2014
sizeband N
Employees 2013
Employees 2014
% growth
1-9 173,478 291,164 400,080 37.4
10-49 5,672 103,374 113,490 9.8
50+ 613 88,284 66,011 -25.2
Total 179,763 482,822 579,581 20.0

Start-ups 2013 - Contribution to Job Growth 2013-2014
-100,000
-50,000
0
50,000
100,000
150,000
200,000
positive growth negative growthNu
mb
er
of
em
plo
yee
s
med/large
small
micro
net change in emp =96,759
Headline Summary
• Micro-enterprises comprise just under 90% of all UK employer businesses and just under 20% of employees – constant over time
• Average size of micro-enterprises is ~ 3 employees
• Micro-enterprises found in all sectors - over 40% in business services accounting for one-third of employees
• Largest contribution to employment in a sector is Construction – micro-enterprises accounting for 30%

Headline Summary cont’d
• Micro-enterprises not necessarily all young firms – half are aged 5 years or more, one quarter aged 10+
• Around 37% of micro-enterprises survive 5 years after birth
• Micro-enterprise survivors have the highest growth rates of all size-bands – particularly in first 2 years
Headline Summary cont’d
• For cohort born in 2009 - 94% remain in same size-band 5 years after birth – and around 50% have the same (+/- 1%) employment
• The 40% that do grow (32,000 businesses) contribute almost three-quarters of all gross new jobs within 5 years – in the period since 2009 as the economy recovered

Thank You
• Contact details for further info
– Michael Anyadike-Danes [email protected]
– Karen Bonner [email protected]
– Mark Hart [email protected]
This work contains statistical data from ONS which is Crown Copyright. The use of the ONS statistical data in this work does not imply the endorsement of the ONS in relation to the interpretation or analysis of the statistical data. This work uses research datasets which may not exactly reproduce National Statistics aggregates