Embed Size (px)
DESCRIPTION
Malayan Banking Berhad (Maybank) - Invest Malaysia 2010 Presentation
Citation preview
Invest Malaysia 2010 Dato’ Sri Abdul Wahid OmarPresident & CEO
Shangri-La Hotel, Kuala Lumpur30-31 March 2010
Maybank
Ridha WirakusumahPresident DirectorPresident DirectorPT Bank Internasional Indonesia Tbk
Introduction
L di b ki f hi i M l i ith k t l d hi l t
Recap from Invest Malaysia 2009:
Leading banking franchise in Malaysia with market leadership across almost all key business sectors.
Stronger footing after recent RM6 billion rights iss e hich has enabledStronger footing after recent RM6 billion rights issue which has enabled Maybank to maintain its credit rating, weather the current economic downturn, and capture growth opportunities.
Presence in key markets in the South East Asia and South Asia and is now strengthening its regional presence by capturing value from recent investments i.e. Bank Internasional Indonesia, MCB Bank and An Binh Bank.
Well positioned to capture growth opportunities and we have embarked on our Strategic Transformation Plan with the vision of becoming one of the top 5 banks in South and South East Asia by 2015.
2

Leading Banking Franchise
Stronger Financial Footing
St th i R i l PStrengthening Regional Presence
Strategy 2010 and beyond
3

Malaysia’s Leading Banking Franchise
Total assets: RM331 billionLargest market capitalisation of RM52 billion.
Largest bank in Malaysia
Largest branch network in Malaysia
386 branches, 2,800 ATMs, 9 million customers.
No.1 Internet banking with a dominant market share of 55%
Over 1,700 branches and offices in 14 countries.
16 million customers in the South East Asia region
Presence in key growth markets in South &South East Asia with GDP of 5.3% for 2011South East Asia
Strong credit rating,on par with sovereign
S&P : A-Fitch : A-
Moody’s: A3RAM: AAAon par with sovereign Fitch : A
Complete financial services provider
Extensive range of products and services covering Consumer, Corporate & SME, Islamic banking, Investment banking and Insurance.
RAM: AAA
p
Strong momentum in revenue and profitability.1H10 revenue grew 35.5% YoY, PATAMI rose 43.5% YoYMargins stable at 2 8% improving asset quality with Net NPL at 1 43%
Two strong quarters of performance for 1H10
Margins stable at 2.8%, improving asset quality with Net NPL at 1.43%.
4
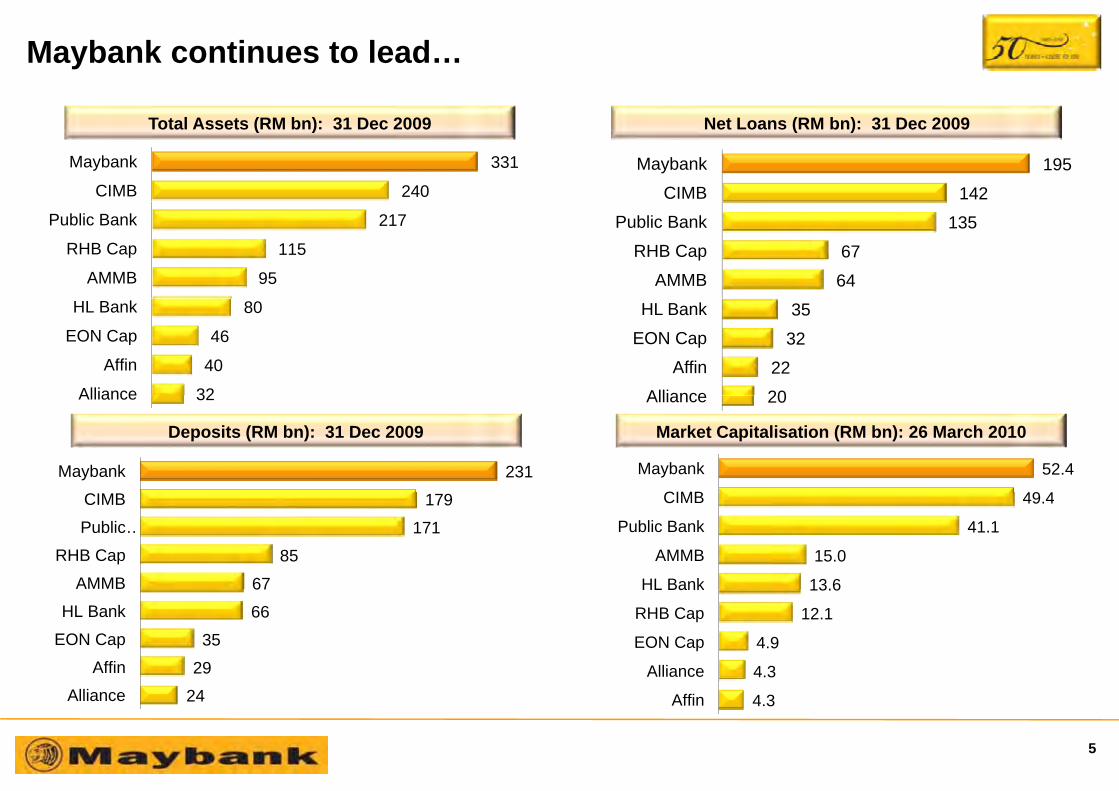
Maybank continues to lead…
240
331
CIMB
Maybank
Total Assets (RM bn): 31 Dec 2009 Net Loans (RM bn): 31 Dec 2009
142
195 CIMB
Maybank
95
115
217
AMMB
RHB Cap
Public Bank
64
67
135
AMMB
RHB Cap
Public Bank
32
40
46
80
Alliance
Affin
EON Cap
HL Bank
20
22
32
35
Alliance
Affin
EON Cap
HL Bank
32 Alliance
231Maybank
20 Alliance
Deposits (RM bn): 31 Dec 2009
49 4
52.4
CIMB
Maybank
Market Capitalisation (RM bn): 26 March 2010
67
85
171
179
AMMB
RHB Cap
Public …
CIMB
13.6
15.0
41.1
49.4
HL Bank
AMMB
Public Bank
CIMB
29
35
66
67
Affin
EON Cap
HL Bank
4.3
4.9
12.1
13.6
Alliance
EON Cap
RHB Cap
HL Bank
5
24Alliance 4.3Affin

Domestic Market: Leading market position in most sectors
Diversified across all financial products and services
Within the top 3 in almost all key business sectors
55%%)
Network Consumer Corporate Islamic Deposit Cards Insurance & Asset Mgmt
Investment Banking
30%
55%
Mar
ket S
hare
(%
New BusinessPremium
19%
30%
16%14%17% 17%17%
22% 24%21%
14%
27%21%23%
16%
29%
15%
8%
15%20%
10%14%
y n 8% 7%
anch
ATM
king
oans
oans
oans oan
oan
ance
cing
osits
osits
osits
osits
ASA
ase
ales
ance
M&A iting
ities
amily
eral
gmt
11 1 1 1
Indu
stry
Posi
tion
1 2 1 11 1
2 2 2 123 1 34 2 4
1 1
Bra A
Inte
rnet
Ban
k
Con
sum
er L
o
Hou
sing
Lo
Auto
Lo
Cor
pora
te L
SME
L
Trad
e Fi
na
Fina
nc
Dep
o
Fixe
d D
epo
Savi
ng D
epo
Dem
and
Dep
o CA
Cre
dit C
ard
B
Mer
chan
t Sa
Deb
t Iss
ua M
Und
erw
ri
Equi
Life
/Fa
ombi
ned
Gen
Asse
t Und
er M
D Co A* As at Dec 2009, except for Insurance & Asset Mgt (Sep 09)
6

Leading Banking Franchise
Stronger Financial Footing
St th i R i l PStrengthening Regional Presence
Strategy 2010 and beyond
7
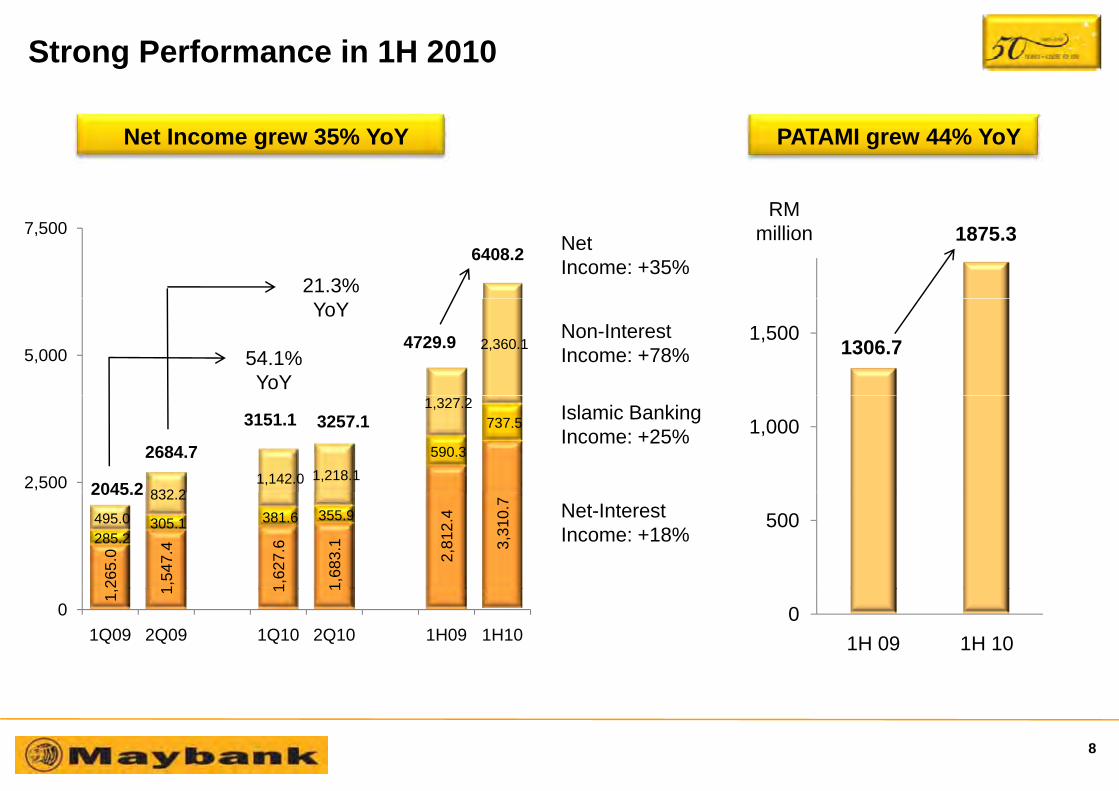
Strong Performance in 1H 2010
RM
Net Income grew 35% YoY PATAMI grew 44% YoY
1875.3RM
million7,500
21.3%6408.2 Net
Income: +35%
1,5001306.72,360.1
5,000
YoY
54.1%YoY
4729.9 Non-InterestIncome: +78%
1,000590.3
737.5
832 21,142.0 1,218.1
1,327.2
2,500 2045 2
2684.7
3151.1 3257.1 Islamic BankingIncome: +25%
500
265.
0
1,54
7.4
1,62
7.6
1,68
3.1
2,81
2.4
3,31
0.7
285.2 305.1 381.6 355.9 495.0
832.2 2045.2Net-InterestIncome: +18%
01H 09 1H 10
1, 1 1 1
01Q09 2Q09 1Q10 2Q10 1H09 1H10
8
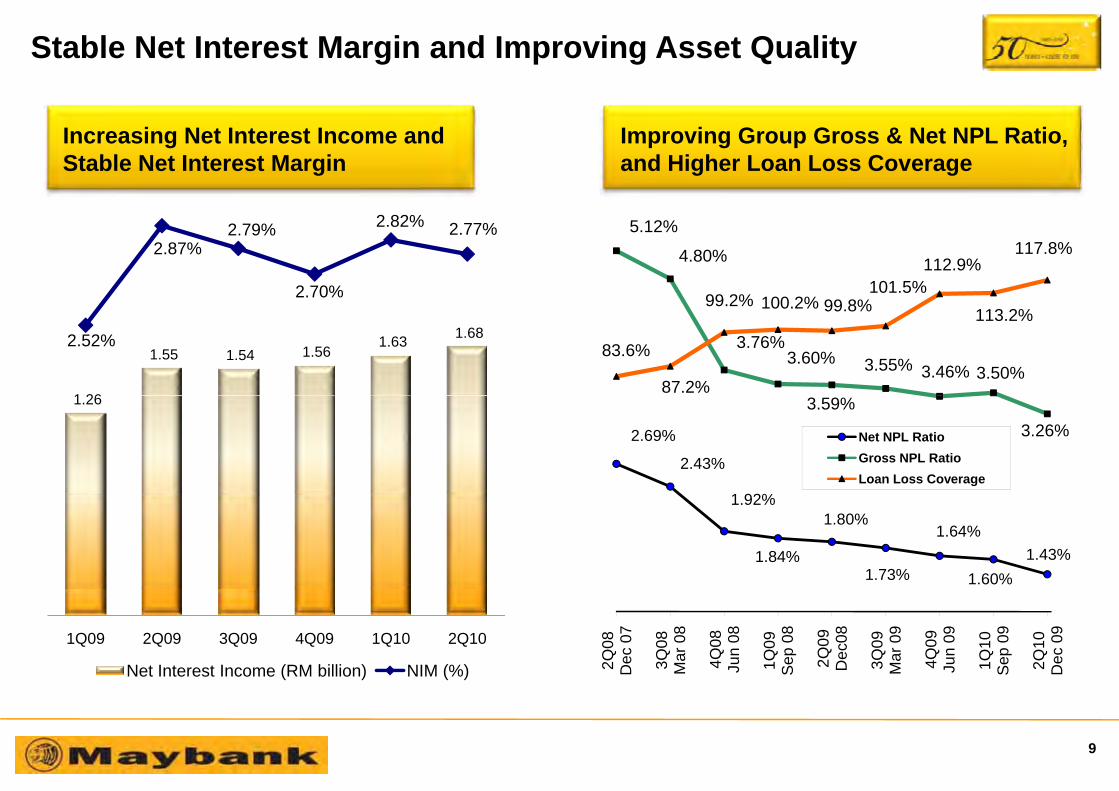
Stable Net Interest Margin and Improving Asset Quality
Improving Group Gross & Net NPL Ratio, and Higher Loan Loss Coverage
Increasing Net Interest Income and Stable Net Interest Margin
2.87%2.79%
2.70%
2.82% 2.77% 5.12%
4.80%
99 2% 100 2%101.5%
112.9%117.8%
1 26
1.55 1.54 1.56 1.63 1.68 2.52% 3.76%
3.60% 3.55% 3.46% 3.50%83.6%
87.2%
99.2% 100.2% 99.8% 113.2%
1.26
2.69%
2.43%
3.59%3.26%Net NPL Ratio
Gross NPL Ratio Loan Loss Coverage
1.92%
1.84%
1.80%
1.73%
1.64%
1.60%1.43%
1Q09 2Q09 3Q09 4Q09 1Q10 2Q10
Net Interest Income (RM billion) NIM (%) 2Q08
Dec
07
3Q08
Mar
08
4Q08
Jun
08
1Q09
Sep
08
2Q09
Dec
08
3Q09
Mar
09
4Q09
Jun
09
1Q10
Sep
09
2Q10
Dec
09
9

Robust loans growth in key business segments particularly in the consumer segment
Robust loans and business growth
800Maybank Industry *
Housing Loan Growth Cards Growth 1H FY10 YoY
Market share: 14%
Robust loans growth in key business segments, particularly in the consumer segment
400
600
RM
mill
ion Maybank Industry
Card base 4.4% - 0.2%
Billings 12.2% 6.9%
% %
Market share: 14%
0
200
2Q09 3Q09 4Q09 1Q10 2Q10
Receivables 8.3% 5.3%
Merchant Sales 23.9% 4.9%
* Industry figures for cards includes commercial banks and non FI players2Q09 3Q09 4Q09 1Q10 2Q10
800
commercial banks and non-FI players
Auto Loan Growth Corporate & Business Loans Growth
Market share: 17%
400
600
RM
mill
ion
STRC
Trade bills
Dec 09
Total Loans grew 5.6% annualised
0
200
2Q09 3Q09 4Q09 1Q10 2Q10
Term Loans
OD June 09
RM 2Q09 3Q09 4Q09 1Q10 2Q10 0 20 40 billion
10
Leading Banking Franchise
St th i R i l P
Stronger Financial Footing
Strengthening Regional Presence
Strategy 2010 and beyond
11

Our International PresenceOther Markets
China Papua New Guinea BruneiBahrain Pakistan
Other Markets
An Binh Bank(91 branches). To increase branches to
Treasury Centres
TreasuryCentresGrowth in selected assets
New York Vietnam (2 branches) Exploring to open 1 additional
increase branches to 150
Hong Kong
assets and Treasury activities
Londonbranch.
ASEAN Cambodia(7 branches) To(7 branches). To increase branches to 11 by FY2011
BII (250 branches). To add 200 branches by 2011 & Double ATMs to 1,500 by 2011.Possible conversion of Bank MaybankIndocorp into Syariah Bank
Singapore (22 branches) to focus on building strength in key products such as Auto & Housing LoanFor Corporate/SMEs, to selectively grow customer base
Philippines(45 branches).Further expansion of operations in Philippines
12
Indocorp into Syariah Bankgrow customer base
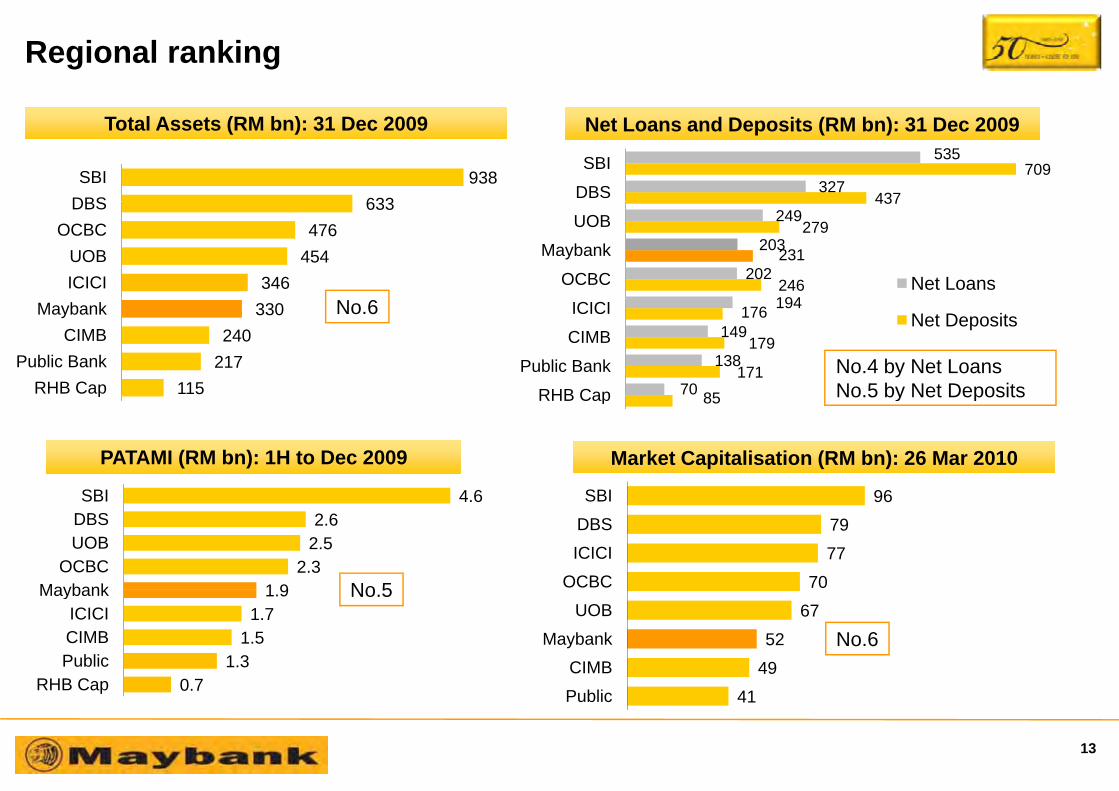
Regional ranking
Total Assets (RM bn): 31 Dec 2009 Net Loans and Deposits (RM bn): 31 Dec 2009
633938
DBSSBI
437
709327
535
DBS
SBI
346 454 476
633
ICICIUOB
OCBCDBS
246
231
279
437
194
202
203
249
OCBC
Maybank
UOB
Net Loans
115 217 240
330
RHB CapPublic Bank
CIMBMaybank
85171
179
176
70
138
149
194
RHB Cap
Public Bank
CIMB
ICICINet DepositsNo.6
No.4 by Net LoansNo.5 by Net Deposits
PATAMI (RM bn): 1H to Dec 2009
96SBI
Market Capitalisation (RM bn): 26 Mar 2010
p
4 6SBI
85RHB Cap No.5 by Net Deposits
707779
96
OCBCICICIDBSSBI
1 92.3
2.52.6
4.6
MaybankOCBC
UOBDBSSBI
No 5
4952
67
CIMBMaybank
UOB
0 71.3
1.51.7
1.9
RHB CapPublicCIMBICICI
Maybank No.5
No.6
41Public0.7RHB Cap
13
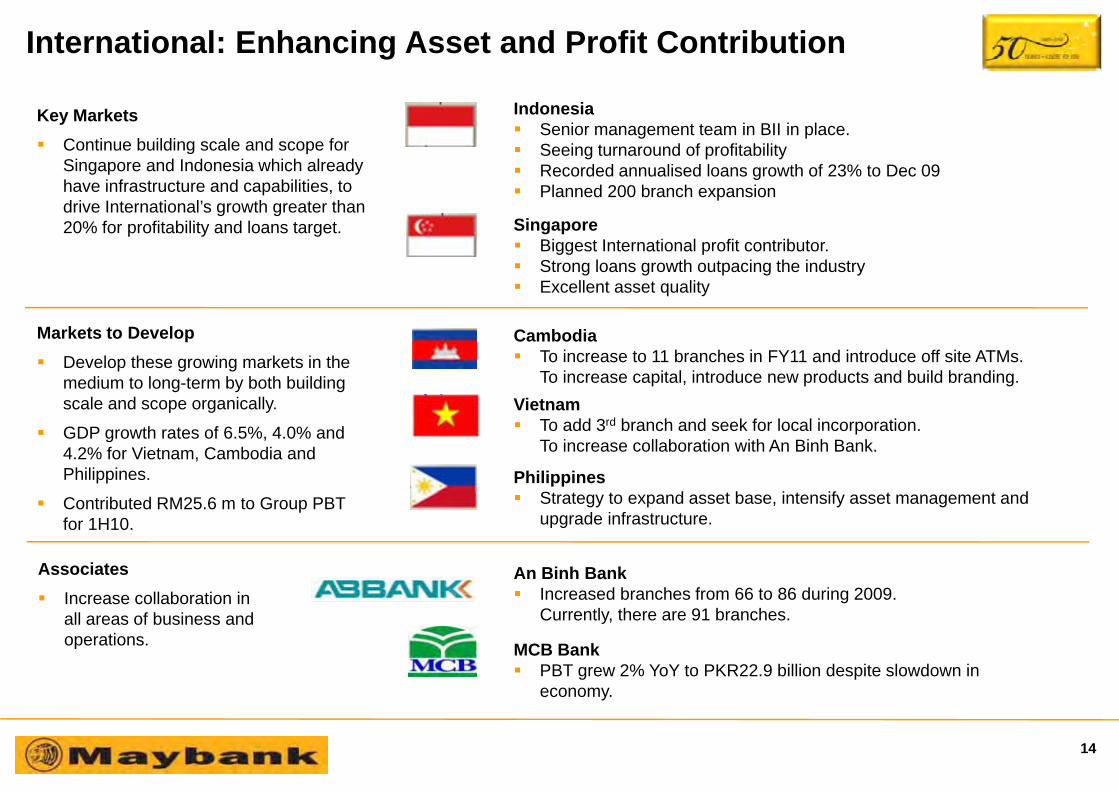
International: Enhancing Asset and Profit Contribution
I d iKey MarketsContinue building scale and scope for Singapore and Indonesia which already have infrastructure and capabilities, to d i I t ti l’ th t th
IndonesiaSenior management team in BII in place.Seeing turnaround of profitabilityRecorded annualised loans growth of 23% to Dec 09Planned 200 branch expansion
drive International’s growth greater than 20% for profitability and loans target. Singapore
Biggest International profit contributor.Strong loans growth outpacing the industryExcellent asset quality
Markets to DevelopDevelop these growing markets in the medium to long-term by both building
CambodiaTo increase to 11 branches in FY11 and introduce off site ATMs.To increase capital, introduce new products and build branding.
scale and scope organically.
GDP growth rates of 6.5%, 4.0% and 4.2% for Vietnam, Cambodia and Philippines.
VietnamTo add 3rd branch and seek for local incorporation.To increase collaboration with An Binh Bank.
PhilippinesSt t t d t b i t if t t d
Associates
Contributed RM25.6 m to Group PBT for 1H10.
Strategy to expand asset base, intensify asset management and upgrade infrastructure.
An Binh BankI d b h f 66 t 86 d i 2009Increase collaboration in
all areas of business and operations.
Increased branches from 66 to 86 during 2009. Currently, there are 91 branches.
MCB BankPBT grew 2% YoY to PKR22.9 billion despite slowdown in economy.
14

International: Assets and profits contribution
International targeted to contribute 40% of loans and profits by 2015
As at 31 December 2009 1H 10
14.611.1
759
Others: 5%Indonesia: 7%
atio
nal
3%
Singapore: 15%Indonesia: 5%Oth 7%
Loans(RM b)
PBT(RM m)
natio
nal
27%
41.6
103 175
Singapore: 21%
Inte
rna
33
InvestmentInsurance: 6%
Others: 7%
Inte
r 2
69.0 688 Business &Corporate: 34% Global
Markets: 24%
InvestmentBanking: 4%
c stic
%
464 Business &Corporate: 16%D
omes
tic67
%
Dom
es73
%
66.7665
Consumer: 33%Consumer: 23%
15
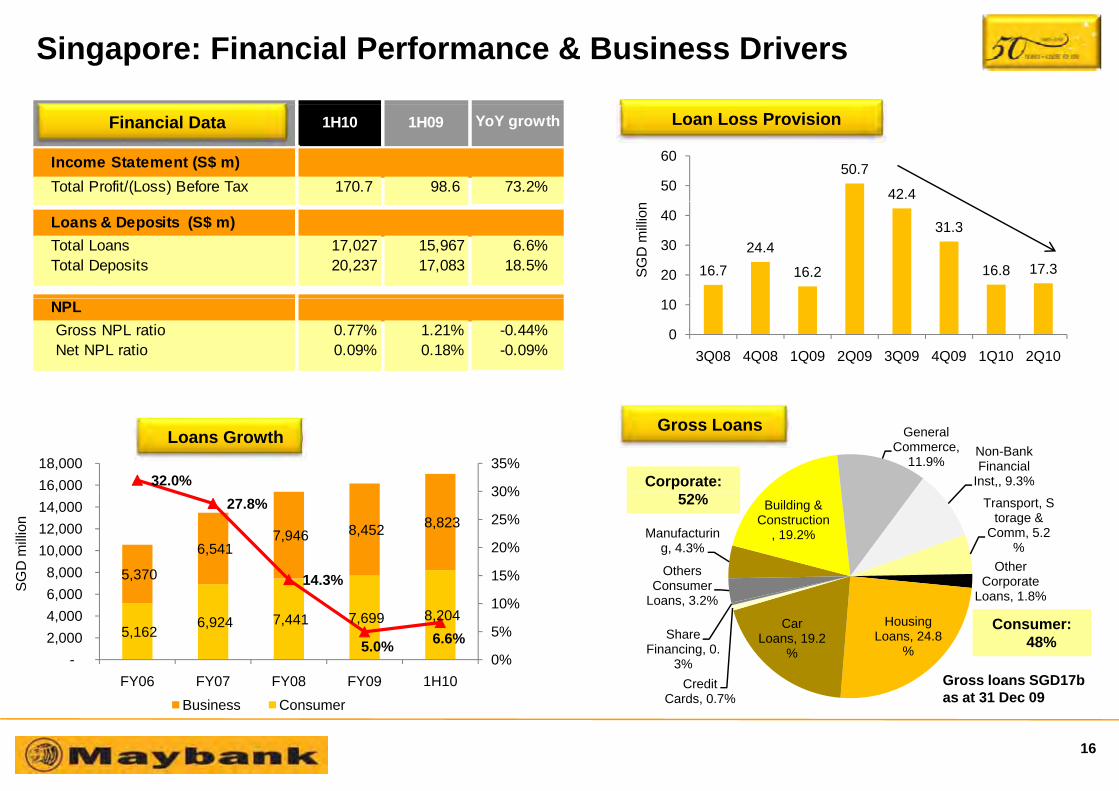
Singapore: Financial Performance & Business Drivers
50.7
42.450
60
1H10 1H09
Income Statement (S$ m)Total Profit/(Loss) Before Tax 170.7 98.6 73.2%
YoY growth Loan Loss ProvisionFinancial Data
16.724.4
16.2
31.3
16.8 17.320
30
40
SG
D m
illio
n
Loans & Deposits (S$ m)Total Loans 17,027 15,967 6.6%Total Deposits 20,237 17,083 18.5%
0
10
3Q08 4Q08 1Q09 2Q09 3Q09 4Q09 1Q10 2Q10
NPLGross NPL ratio 0.77% 1.21% -0.44%Net NPL ratio 0.09% 0.18% -0.09%
General Commerce,
11.9%Non-Bank Financial
Inst,, 9.3%Corporate:
Gross LoansLoans Growth
32.0%30%
35%16,000 18,000
Manufacturing, 4.3%
Building & Construction
, 19.2%
Transport, Storage &
Comm, 5.2%
Other Corporate
Others Consumer
52%
5,370
6,541 7,946 8,452 8,823
27.8%
14.3% 15%
20%
25%
30%
6 0008,000
10,000 12,000 14,000
SG
D m
illio
n
Loans, 1.8%
Housing Loans, 24.8
%
Car Loans, 19.2
%
Credit
Share Financing, 0.
3%
Consumer Loans, 3.2%
Consumer:48%
Gross loans SGD17b
5,162 6,924 7,441 7,699 8,204
5.0% 6.6%0%
5%
10%
-2,000 4,000 6,000
FY06 FY07 FY08 FY09 1H10
S
Credit Cards, 0.7% as at 31 Dec 09
06 0 08 09 0Business Consumer
16
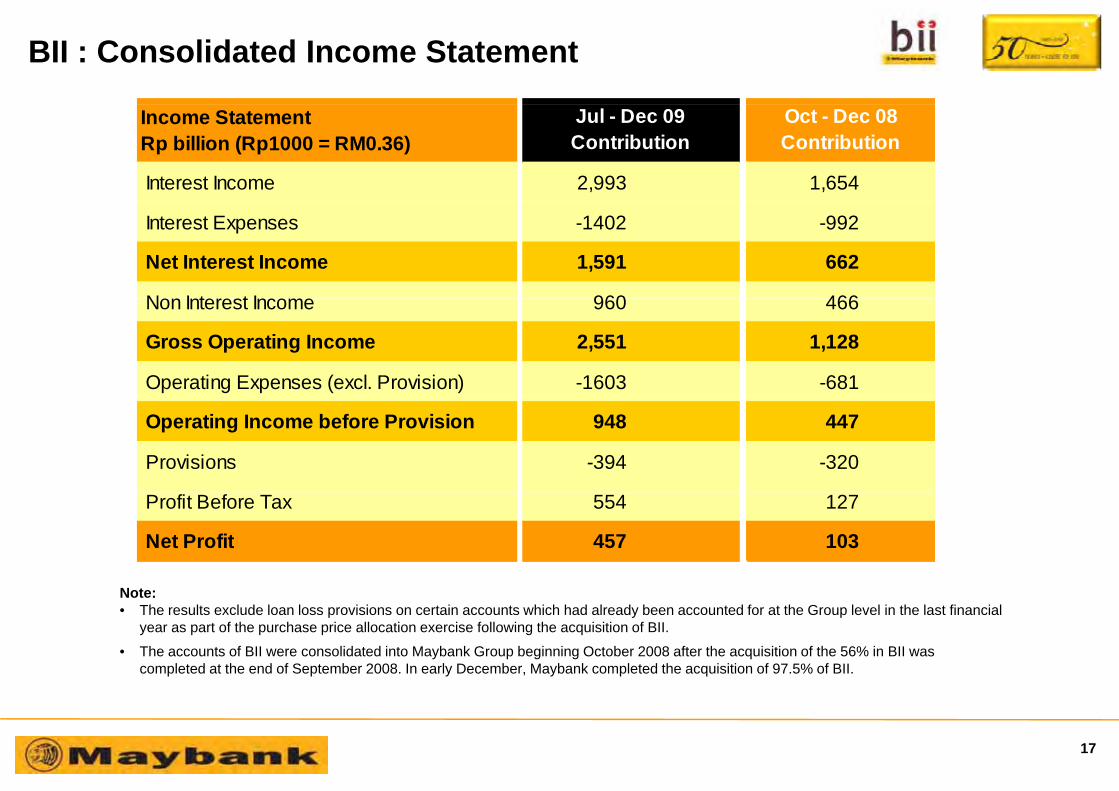
BII : Consolidated Income Statement
Income StatementRp billion (Rp1000 = RM0.36)
Interest Income 2,993 1,654
Jul - Dec 09Contribution
Oct - Dec 08Contribution
Interest Expenses -1402 -992
Net Interest Income 1,591 662
N I t t I 960 466 Non Interest Income 960 466
Gross Operating Income 2,551 1,128
Operating Expenses (excl. Provision) -1603 -681
Operating Income before Provision 948 447
Provisions -394 -320
Profit Before Tax 554 127
Net Profit 457 103
N tNote:• The results exclude loan loss provisions on certain accounts which had already been accounted for at the Group level in the last financial
year as part of the purchase price allocation exercise following the acquisition of BII.
• The accounts of BII were consolidated into Maybank Group beginning October 2008 after the acquisition of the 56% in BII was completed at the end of September 2008. In early December, Maybank completed the acquisition of 97.5% of BII.
17
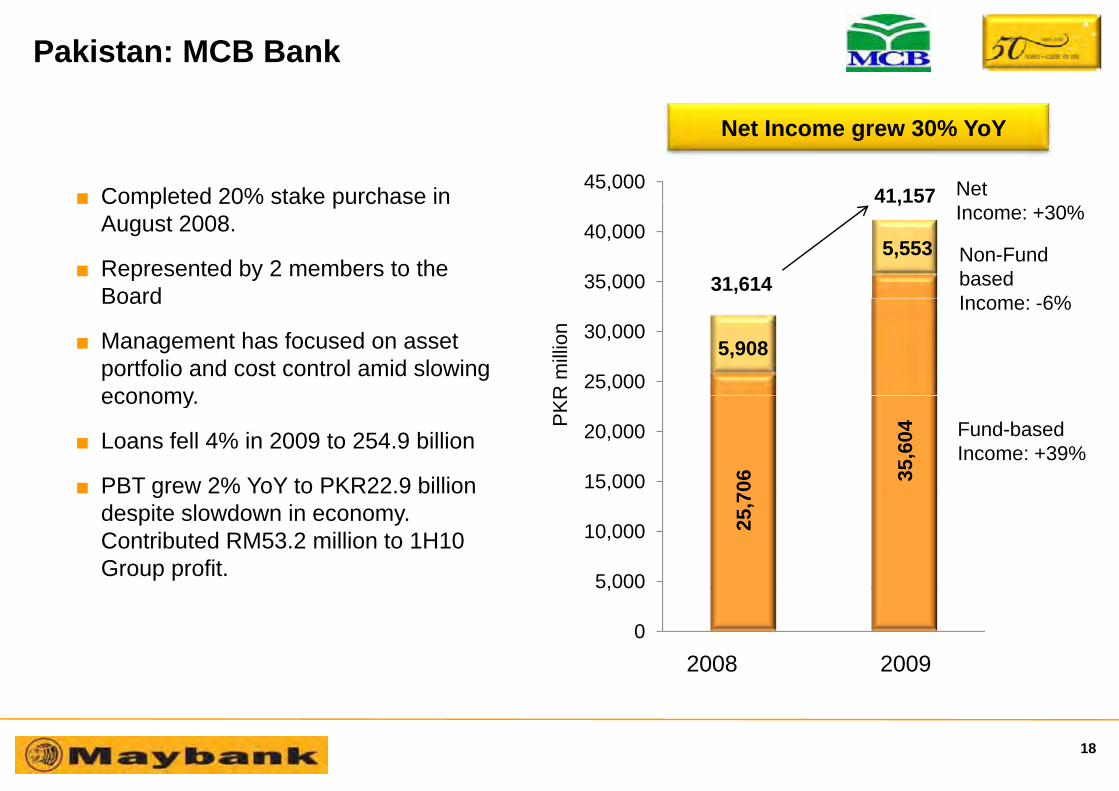
Pakistan: MCB Bank
■ Completed 20% stake purchase in45,000
41,157 Net
Net Income grew 30% YoY
■ Completed 20% stake purchase in August 2008.
■ Represented by 2 members to the Board
5,553 35,000
40,000
31,614
41,157
Non-FundbasedI 6%
Income: +30%
Board
■ Management has focused on asset portfolio and cost control amid slowing economy
5,908 25,000
30,000Income: -6%
R m
illio
n
economy.
■ Loans fell 4% in 2009 to 254.9 billion
■ PBT grew 2% YoY to PKR22.9 billion 06 35,6
04
15,000
20,000 Fund-basedIncome: +39%
PK
R
■ PBT grew 2% YoY to PKR22.9 billion despite slowdown in economy. Contributed RM53.2 million to 1H10 Group profit.
25,7
5,000
10,000
0
,
2008 20092008 2009
18

Vietnam: An Binh Bank
■ Completed initial 15% stake in Sept 2008 and additional 5% stake in Dec 2009.
■ Appointed 1 member to the Supervisory900 Net
Net Income grew 166% YoY
■ Appointed 1 member to the Supervisory Committee and 1 to Board of Directors.
■ Seconded a Chief Risk Officer 87.9 700
800778.2
Non-FundbasedI +304%
Income: +166%
■ Increased branches from 66 to 86 during 2009. Currently, there are 91 branches.
■ Business cooperation in the areas of 500
600Income: +304%
D m
illio
n
Consumer banking (credit cards, remittances), trade finance, sharing risk management framework 69
0.3
21 8300
400292.6
Fund-basedIncome: +155%
VN
D
■ Improving economic sentiment in the country even as VND faces devaluation pressure.
L 93% VND12 6 billi
270.
8
21.8
100
200
■ Loans grew 93% to VND12.6 billion.
■ PBT grew 535% in 2009 to VND415.5 m. Contributed RM4.5 million to 1H10 Group
fit
01H 09 1H 102008 2009
profit.
19

Bank Internasional Indonesia (BII)
20
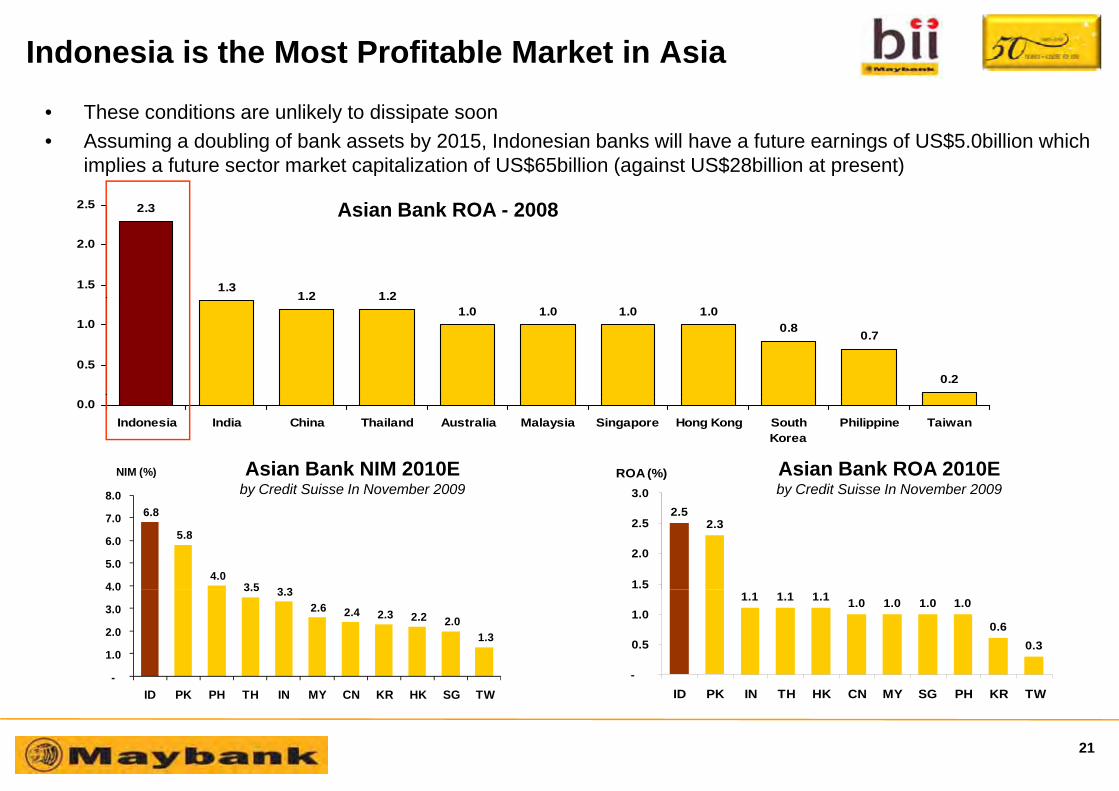
Indonesia is the Most Profitable Market in Asia
Th diti lik l t di i t
2 5
• These conditions are unlikely to dissipate soon• Assuming a doubling of bank assets by 2015, Indonesian banks will have a future earnings of US$5.0billion which
implies a future sector market capitalization of US$65billion (against US$28billion at present)
2.3
1.31.2 1.2
1.5
2.0
2.5 Asian Bank ROA - 2008
1.2 1.21.0 1.0 1.0 1.0
0.8 0.7
0.20.5
1.0
0.0Indonesia India China Thailand Australia Malaysia Singapore Hong Kong South
KoreaPhilippine Taiwan
3 0ROA (%)
8 0
NIM (%) Asian Bank NIM 2010Eby Credit Suisse In November 2009
Asian Bank ROA 2010Eby Credit Suisse In November 2009
2.52.3
1.5
2.0
2.5
3.06.8
5.8
4.0 3 5 3 34.0
5.0
6.0
7.0
8.0 by Credit Suisse In November 2009 by Credit Suisse In November 2009
1.1 1.1 1.0 1.0 1.0
0.60.3
1.1 1.0
-
0.5
1.0
3.5 3.3 2.6 2.4 2.3 2.2 2.0
1.3
-
1.0
2.0
3.0
4.0
21
ID PK IN TH HK CN MY SG PH KR TWID PK PH TH IN MY CN KR HK SG TW

Our Aspirations
5 x 5 x 5
T 5 B k bTop 5 Banks by Assets & Returns
Leading in 5 Areas
By 2015
In line with Maybank’s aspiration to be One of SEA & South Asia Top 5 Banks by 2015
22

Rationale to be in the areas we choose (1/2)
1. Leading banker for transportation industry• One of the banks that own motorcycle financing companies, both 2 wheelers and 4 wheelers• One of the banks that lend to shipping industry• Have a good base for airline business by partnering with Lion Air
2. USD Payment Bank• BII has a strong customer base with USD transactions• BII has a strong USD funding, with a composition FCY funding 26% compared to average industry of 17%• 65% of the FCY funding is in CASA (while industry average is 51%), indicating the heavy usage for
transactionsBII i th l ti l i USD t ti d ll k f• BII is the long time player in USD transactions and well known of :
• Offering competitive FX rate amongst other peer banks• Having flexibility to accept USD notes with substandard conditions while other banks would not
acceptaccept
3. SME/Commercial: No. 1 in Supply Chain Financing• Multiplier effect, i.e. end to end financial solution start collection to payment in each flow of business
creationcreation • Powerful cross sell engine, i.e. funding, lending and transaction • Unique positioning, with limited competition and relatively low risk• Economic of scale and time to market
23
Rationale to be in the areas we choose (2/2)
4. Corporate: No. 1 in Structured Trade Financing & Resource Based Industry• Lucrative business given limited players in the market, very structured (minimize credit risk), short tenor
and self liquidatingand self liquidating • Indonesia is a resource based (commodity) country, be it soft (sugar, rice, coffee, etc) and hard
(coal, tin, iron, oil n gas, etc) commodities. Normally in sourcing and transporting these commodities are not straight forward given limited working capital; and we are as bank sees this opportunity to finance this g g g p pp ybusiness and to move the products either locally or globally
5. No. 1 in Credit Card
• High margin business and provide entrance to other cross selling opportunities for deepening relationship• High margin business and provide entrance to other cross selling opportunities for deepening relationship • Card represent consumer lifestyle and behavior. Being number 1 in cards means most consumers /
population will use Bii credit card and Bii is on top of everyone's mind• By having credit card customer, it is a lifetime relationship as it is an open ended product y g , p p p
24

Leverage Synergy Opportunities With Maybank
Nascent syariah banking operations 5 branches, USD35 million loansDefine business model and alignment with Bank Maybank Indocorp
Syariah Banking
I t tReplicate Maybank-IB in Indonesia
Investment Banking
Create a program to allow Singapore accounts to be opened Maybank
NIA
GA
Maybank
p g g p pfrom Jakarta (Priority and Private banking)Singapore domiciled companies belonging to Indonesians
Corporate
Maybank Singapore
CIM
B-NMaybank Continue existing cross referrals of customers
Corporatebanking
Increasing trade business between Malaysia and IndonesiaN d t d f t d d t t f iliti
TradeNeed to ensure adequacy of trade and counterparty facilities
InsuranceSignificant potential to captureImprove bancassurance relationships
OthersAlign development of BII’s future IT architecture with MaybankInternet bankingSh i f t l t i l t d i l l d
p p
Sharing of talent as a regional expert and regional program leader
25
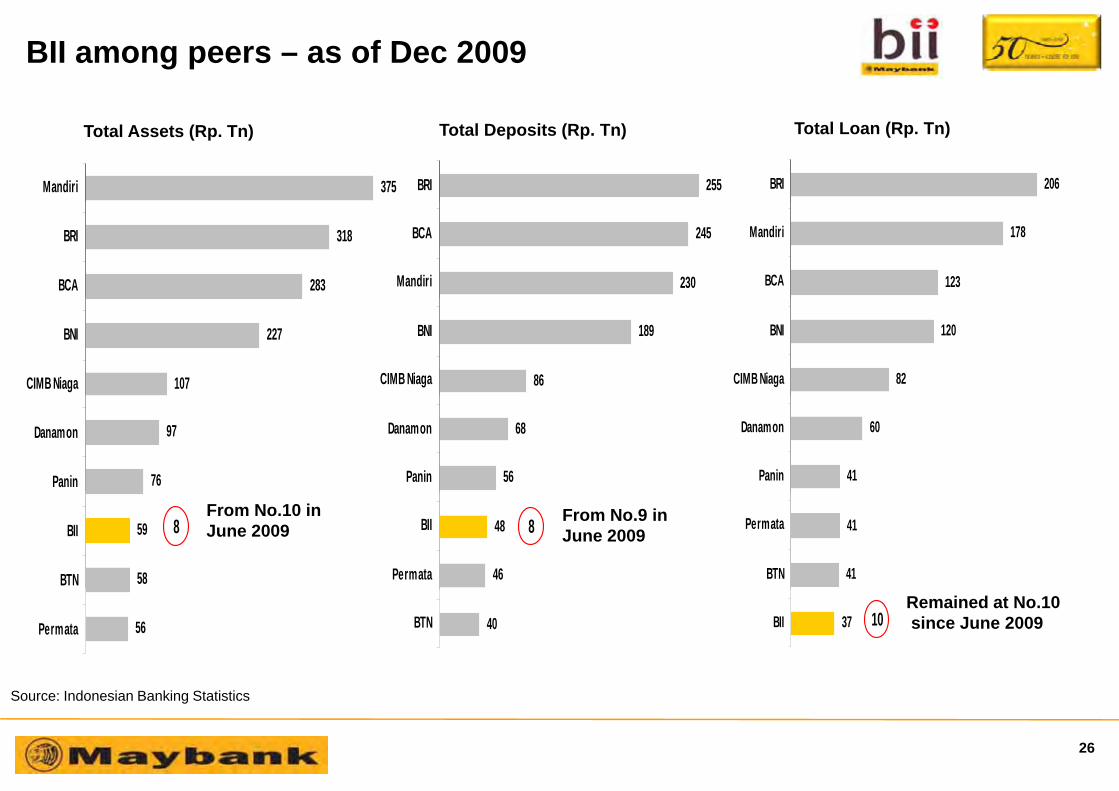
BII among peers – as of Dec 2009
375Mandiri 255BRI 206BRI
Total Assets (Rp. Tn) Total Deposits (Rp. Tn) Total Loan (Rp. Tn)
283
318
BCA
BRI
230
245
Mandiri
BCA
123
178
BCA
Mandiri
107
227
CIMB Niaga
BNI
86
189
CIMB Niaga
BNI
82
120
CIMB Niaga
BNI
76
97
Panin
Danamon
56
68
Panin
Danamon
41
60
Panin
Danamon
58
59
BTN
BII 8
46
48
Permata
BII 8
41
41
BTN
PermataFrom No.10 inJune 2009
From No.9 inJune 2009
56Permata 40BTN 37BII 10Remained at No.10since June 2009
Source: Indonesian Banking Statistics
26
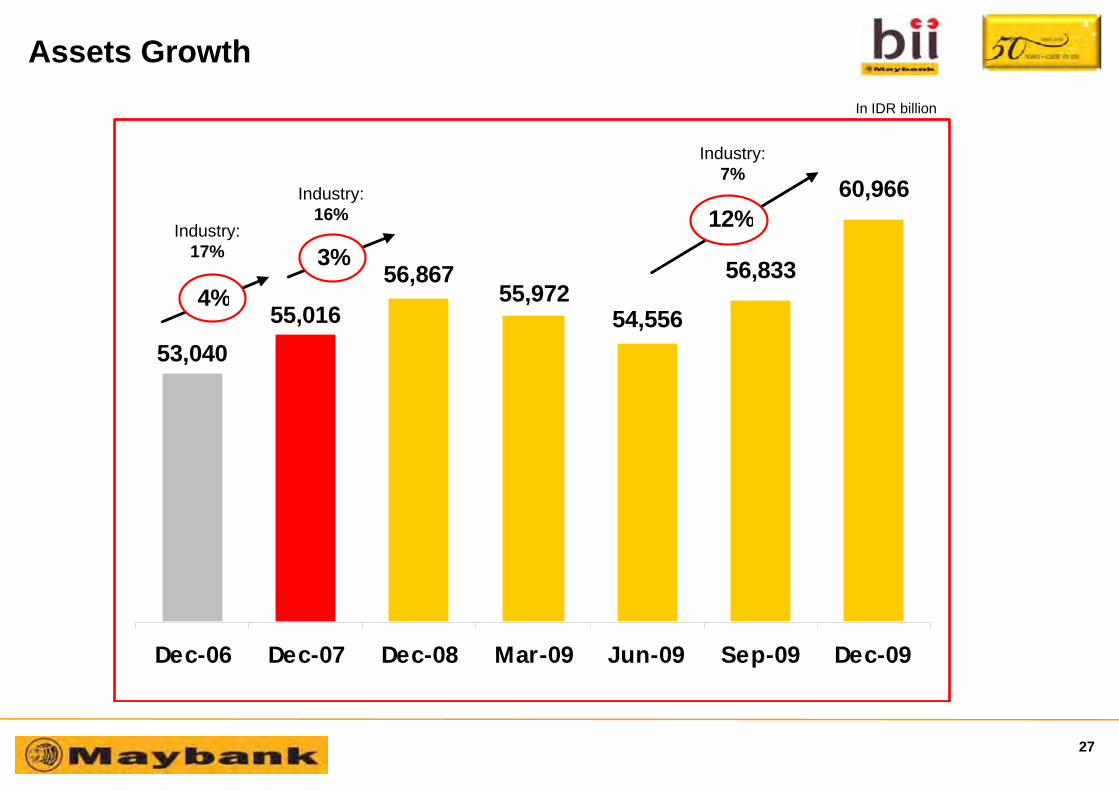
Assets Growth I IDR billi
60,966Industry:
Industry:7%
In IDR billion
56,83355,972
56,8674%
3%12%Industry:
17%
y16%
54,55655,972
55,01653,040
4%
Dec-06 Dec-07 Dec-08 Mar-09 Jun-09 Sep-09 Dec-09
27
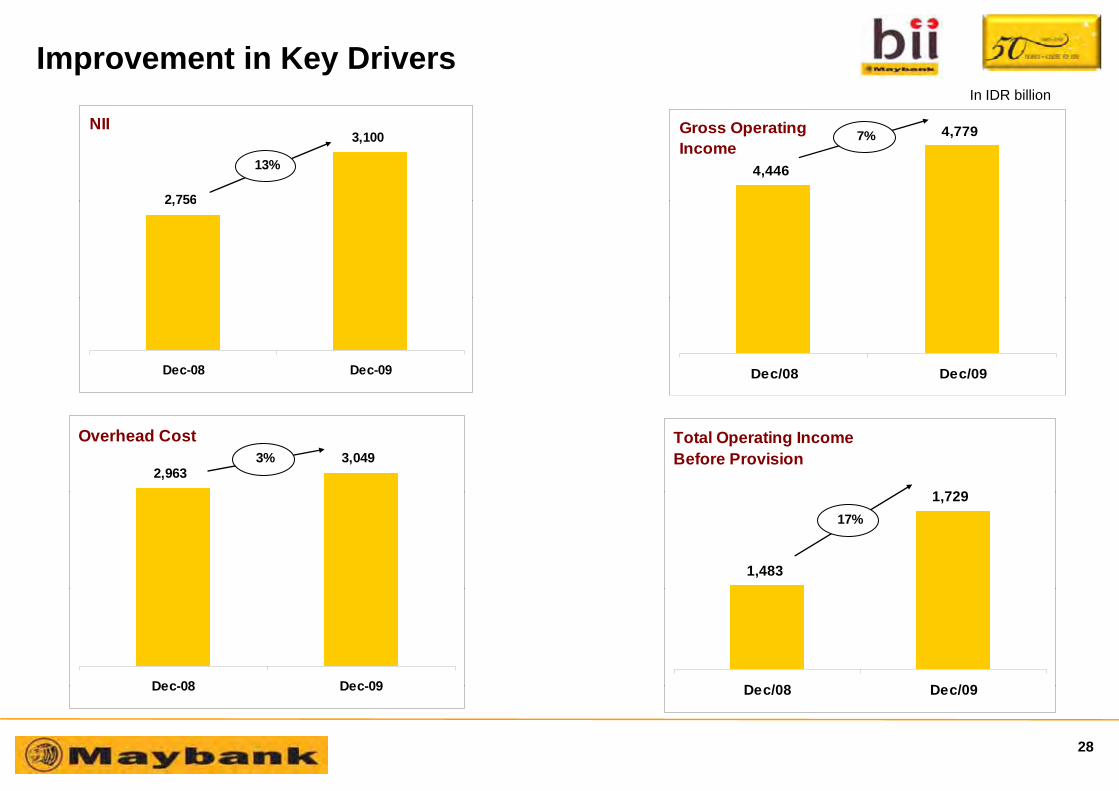
Improvement in Key DriversIn IDR billion
2 756
3,100
13%
NII
4,446
4,7797%Gross Operating Income
2,756
Dec-08 Dec-09 Dec/08 Dec/09
2,9633,049
Overhead Cost3%
1 729
Total Operating Income Before Provision
1,483
1,72917%
Dec-08 Dec-09 D /08 D /09Dec-08 Dec-09 Dec/08 Dec/09
28

WOM: Improvement in Risk Area
P i i ( thl ) f WOM tf li All the work is paying off at the bottom line
Monthly Profit (Net Profit, Rp. billion)
Provision expense (monthly) for WOM portfolio in BII(Rp. Billion)
8 23 8 16 8.54
10.17
8 37
9.9876
8.23 8.16
5.79
8.3765
5856
51
1.21 1.04
3.04
1.16
4045
3531 29
Jan-09
Feb-09
Mar-09
Apr-09
May-09
Jun-09
Jul-09
Aug-09
Sep-09
Oct-09
Nov-09
Dec-09
15
29
23
-5.02Jan-09
Feb-09
Mar-09
Apr-09
May-09
Jun-09
Jul-09
Aug-09
Sep-09
Oct-09
Nov-09
Dec-09
29
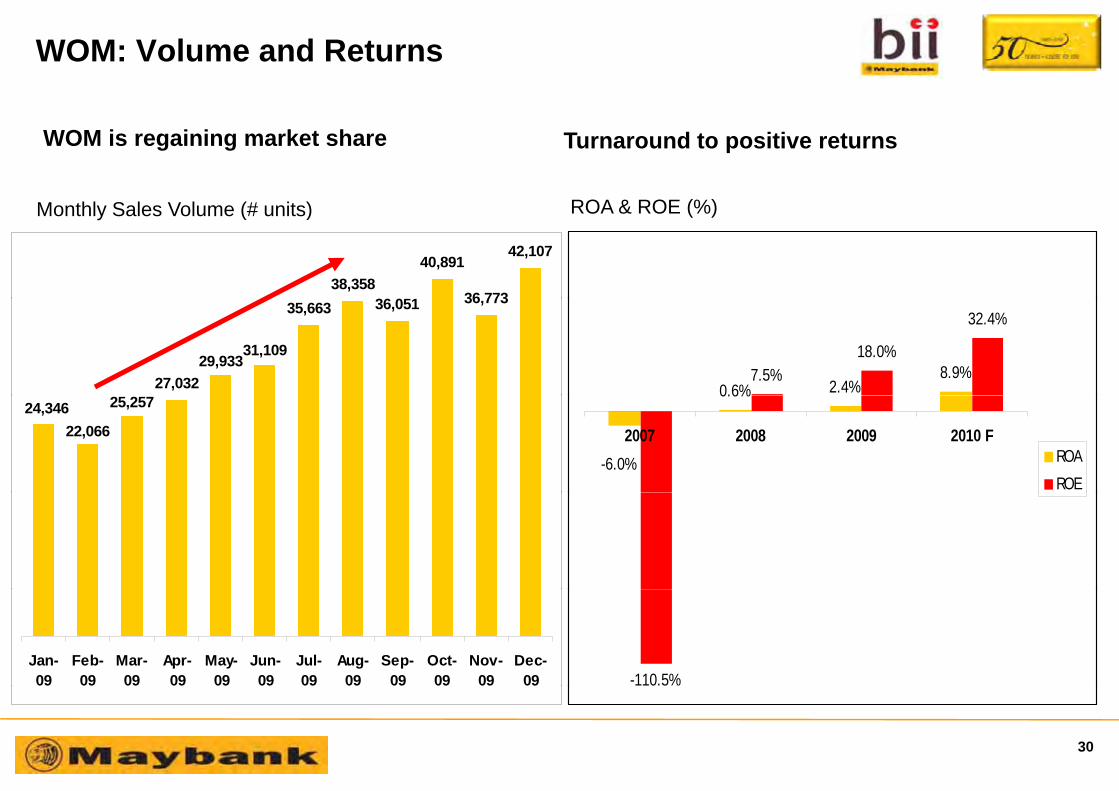
WOM: Volume and Returns
Turnaround to positive returnsWOM is regaining market share
M hl S l V l (# i ) ROA & ROE (%)
38,35836 051
40,891
36 773
42,107
Monthly Sales Volume (# units) ROA & ROE (%)
27,032
35,663 36,051 36,773
29,93331,109
0.6% 2.4%8.9%7.5%
18.0%
32.4%
25,25724,34622,066
0.6%
-6.0%
2007 2008 2009 2010 FROAROE
Jan-09
Feb-09
Mar-09
Apr-09
May-09
Jun-09
Jul-09
Aug-09
Sep-09
Oct-09
Nov-09
Dec-09 -110.5%
30

Summary and Prospects
Indonesian macroeconomic outlook is positive on the back of infrastructure development, recovery in consumer spending, domestic investment and FDI, as well as stable IDRas stab e
2009 was a year of consolidation in Bii, 2010-11 will be concentration on strengthening the infrastructure (IT and network) in order to build a sustainable g g ( )foundation for exceptional growth and in order to compete effectively in an ever tightening market
One of two top ten banks that has dedicated two wheelers subsidiary. Our prospect is to strengthen this and to expand it into a full fledge consumer financing business
Leverage our subsidiaries and increase cross-sell
Continue to maintain and strengthen our service differentiationg
Develop winning businesses in key areas and utilize synergy with Maybank to the fullest
31

Leading Banking Franchise
Stronger Financial Footing
St th i R i l PStrengthening Regional Presence
Strategy 2010 and beyond
32

Strategy 2010 and beyond
Focus on 3 key business pillars:y p
Community Financial Services
Wholesale BankingWholesale Banking
Insurance & Takaful
Supported by strong Enterprise Transformation Services,covering Operations and IT
33
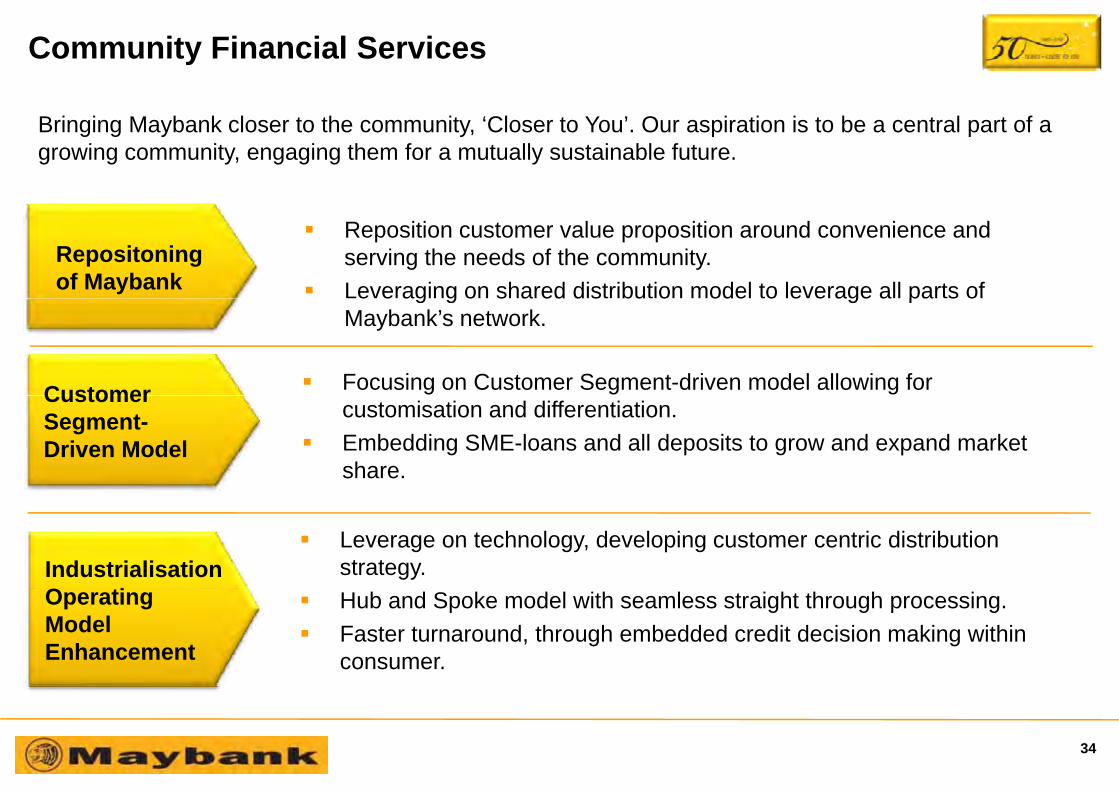
Community Financial Services
Bringing Maybank closer to the community, ‘Closer to You’. Our aspiration is to be a central part of a growing community, engaging them for a mutually sustainable future.
Reposition customer value proposition around convenience and serving the needs of the community.Leveraging on shared distribution model to leverage all parts of
Repositoningof Maybank
Focusing on Customer Segment-driven model allowing for
e e ag g o s a ed d s bu o ode o e e age a pa s oMaybank’s network.
Customercustomisation and differentiation.Embedding SME-loans and all deposits to grow and expand market share.
Customer Segment-Driven Model
Leverage on technology, developing customer centric distribution strategy.Industrialisation
O ti Hub and Spoke model with seamless straight through processing.Faster turnaround, through embedded credit decision making within consumer.
Operating ModelEnhancement
34
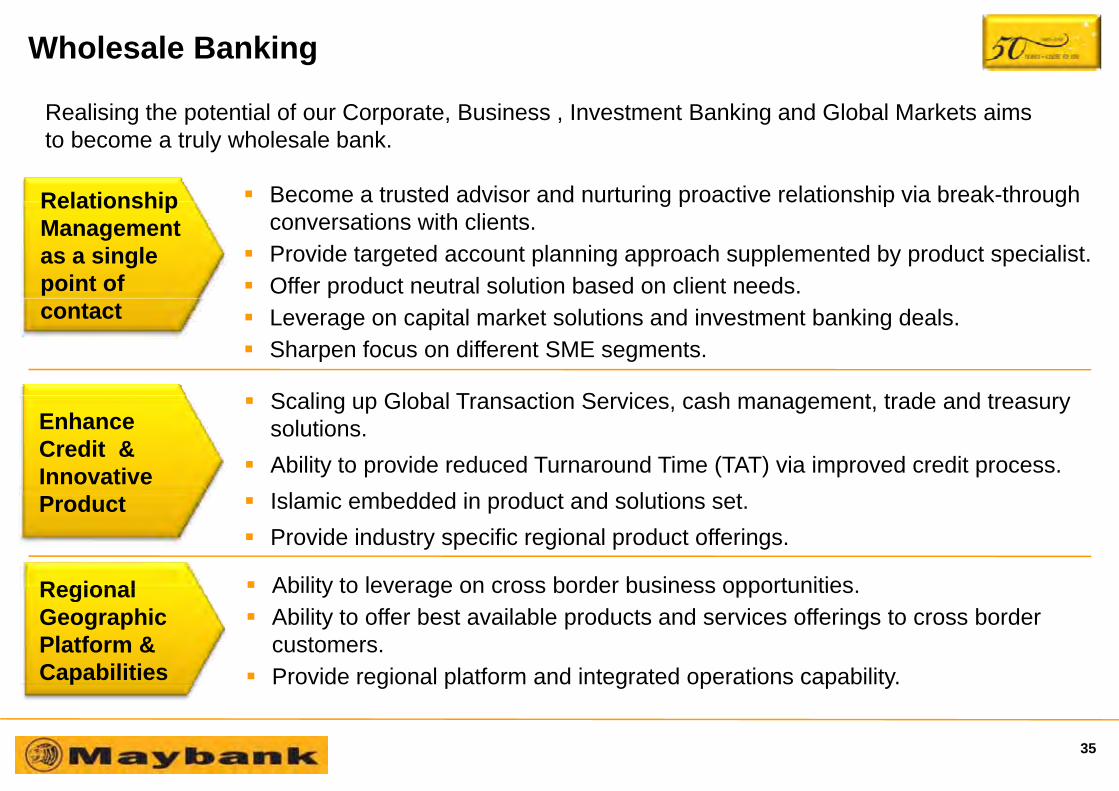
Wholesale BankingEnhanceCredit & Innovative ProductR li i th t ti l f C t B i I t t B ki d Gl b l M k t i
Become a trusted advisor and nurturing proactive relationship via break-through
ProductRealising the potential of our Corporate, Business , Investment Banking and Global Markets aims to become a truly wholesale bank.
Relationship Become a trusted advisor and nurturing proactive relationship via break through conversations with clients.Provide targeted account planning approach supplemented by product specialist.Offer product neutral solution based on client needs.
RelationshipManagement as a single point of
Leverage on capital market solutions and investment banking deals.Sharpen focus on different SME segments.
S li Gl b l T ti S i h t t d d t
contact
Scaling up Global Transaction Services, cash management, trade and treasury solutions. Ability to provide reduced Turnaround Time (TAT) via improved credit process.I l i b dd d i d d l i
EnhanceCredit & Innovative
Ability to leverage on cross border business opportunities
Islamic embedded in product and solutions set.Provide industry specific regional product offerings.
Product
Regional Ability to leverage on cross border business opportunities.Ability to offer best available products and services offerings to cross border customers.Provide regional platform and integrated operations capability.
RegionalGeographic Platform &Capabilities g p g p p y
35
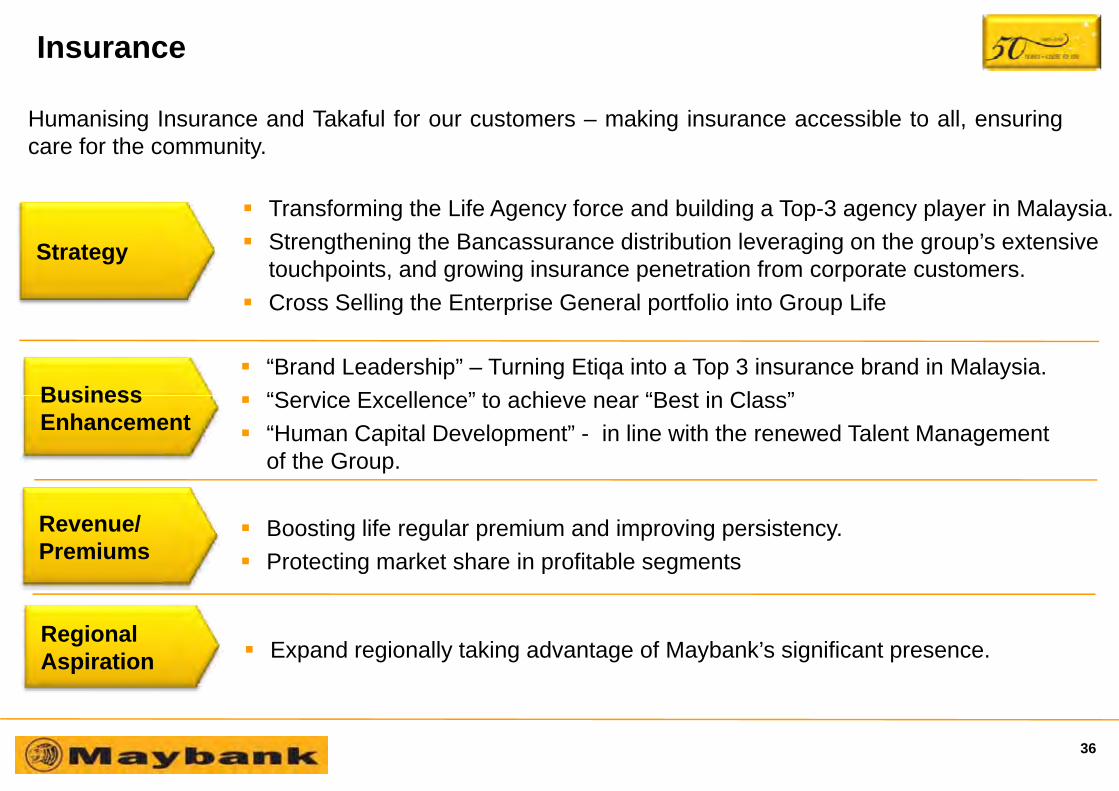
Insurance
T f i th Lif A f d b ildi T 3 l i M l i
Humanising Insurance and Takaful for our customers – making insurance accessible to all, ensuringcare for the community.
Transforming the Life Agency force and building a Top-3 agency player in Malaysia.Strengthening the Bancassurance distribution leveraging on the group’s extensive touchpoints, and growing insurance penetration from corporate customers.Cross Selling the Enterprise General portfolio into Group Life
Strategy
“Brand Leadership” – Turning Etiqa into a Top 3 insurance brand in Malaysia.“S i E ll ” t hi “B t i Cl ”
Cross Selling the Enterprise General portfolio into Group Life
Business “Service Excellence” to achieve near “Best in Class” “Human Capital Development” - in line with the renewed Talent Management of the Group.
Business Enhancement
Boosting life regular premium and improving persistency.Protecting market share in profitable segments
Revenue/Premiums
Expand regionally taking advantage of Maybank’s significant presence.Regional Aspiration
36
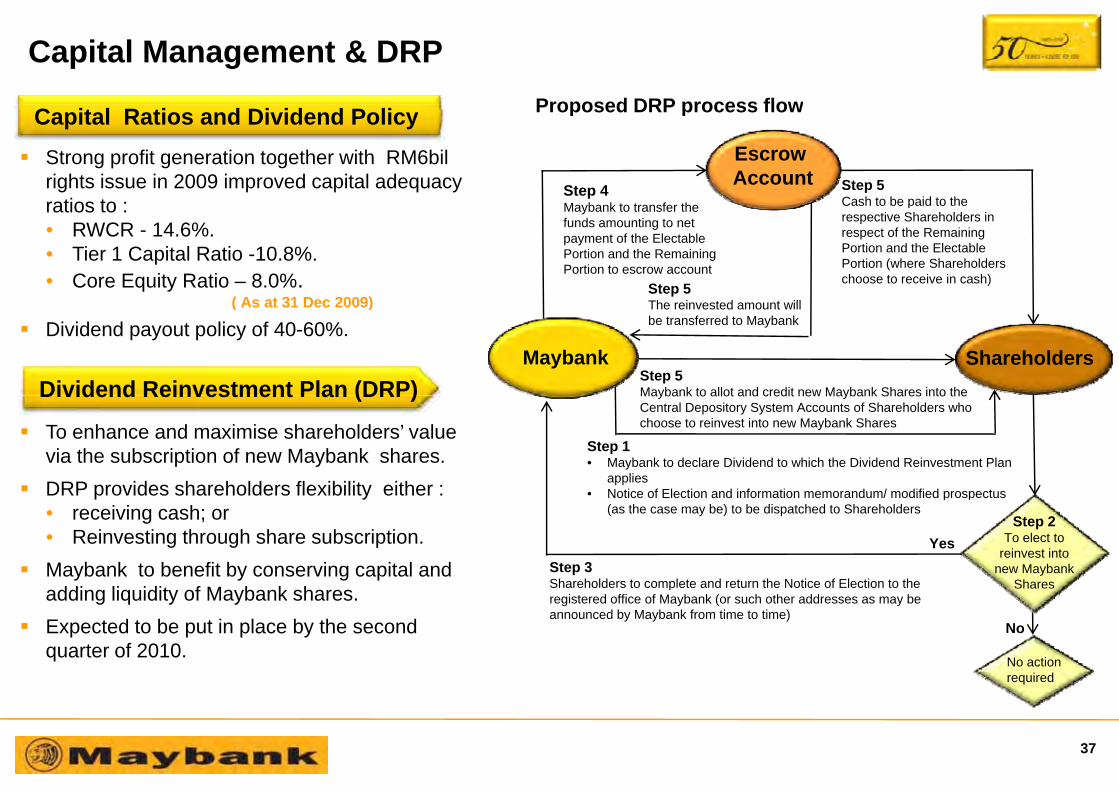
Capital Management & DRPProposed DRP process flow
Step 4 Step 5Cash to be paid to the
Escrow Account
Proposed DRP process flow
Strong profit generation together with RM6bil rights issue in 2009 improved capital adequacy ratios to
Capital Ratios and Dividend Policy
Maybank to transfer the funds amounting to net payment of the Electable Portion and the Remaining Portion to escrow account
Cash to be paid to the respective Shareholders in respect of the Remaining Portion and the Electable Portion (where Shareholders choose to receive in cash)
Step 5
ratios to :• RWCR - 14.6%.• Tier 1 Capital Ratio -10.8%.• Core Equity Ratio – 8.0%.
( A t 31 D 2009)
Step 5Maybank to allot and credit new Maybank Shares into the
The reinvested amount will be transferred to Maybank
Shareholders
( As at 31 Dec 2009)
Dividend payout policy of 40-60%.Maybank
Dividend Reinvestment Plan (DRP)
To enhance and maximise shareholders’ value via the subscription of new Maybank shares.DRP provides shareholders flexibility either :
Step 1• Maybank to declare Dividend to which the Dividend Reinvestment Plan
applies• Notice of Election and information memorandum/ modified prospectus
Maybank to allot and credit new Maybank Shares into the Central Depository System Accounts of Shareholders who choose to reinvest into new Maybank Shares
Dividend Reinvestment Plan (DRP)
DRP provides shareholders flexibility either :• receiving cash; or• Reinvesting through share subscription.Maybank to benefit by conserving capital and ddi li idit f M b k h
• Notice of Election and information memorandum/ modified prospectus (as the case may be) to be dispatched to Shareholders
Step 3Shareholders to complete and return the Notice of Election to the
Step 2To elect to
reinvest into new Maybank
Shares
Yes
adding liquidity of Maybank shares.Expected to be put in place by the second quarter of 2010.
No
pregistered office of Maybank (or such other addresses as may be announced by Maybank from time to time)
No action required
37
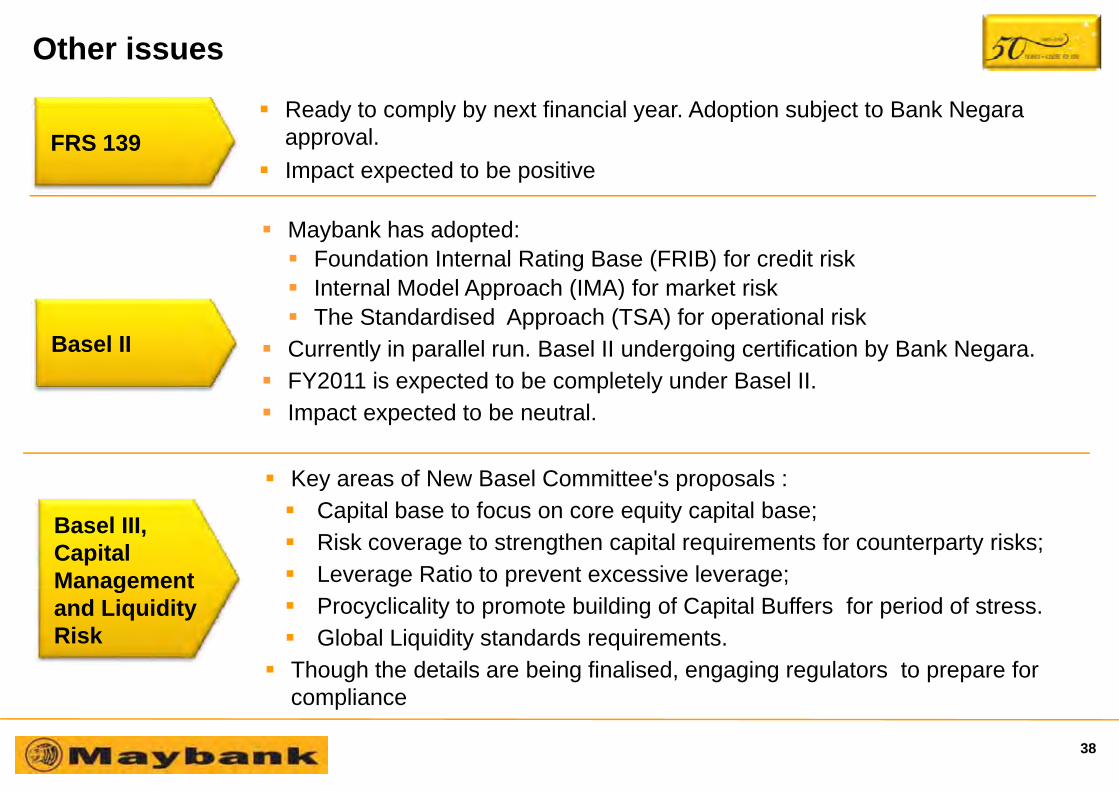
Other issues
R d t l b t fi i l Ad ti bj t t B k NReady to comply by next financial year. Adoption subject to Bank Negara approval.Impact expected to be positive
FRS 139
Maybank has adopted:Foundation Internal Rating Base (FRIB) for credit riskInternal Model Approach (IMA) for market riskpp ( )The Standardised Approach (TSA) for operational risk
Currently in parallel run. Basel II undergoing certification by Bank Negara.FY2011 is expected to be completely under Basel II.
Basel II
Impact expected to be neutral.
Key areas of New Basel Committee's proposals :Capital base to focus on core equity capital base;Risk coverage to strengthen capital requirements for counterparty risks;Leverage Ratio to prevent excessive leverage;
Basel III,Capital Management
Procyclicality to promote building of Capital Buffers for period of stress.Global Liquidity standards requirements.
Though the details are being finalised, engaging regulators to prepare for
gand Liquidity Risk
compliance
38
Key Take Aways
Maybank is strengthening its position as the leading banking f hi i M l i i li ith t f tifranchise in Malaysia in line with our transformation programme.
Current capital position, strong profit generation capability and Dividend Reinvestment Plan will strengthen our capital position andDividend Reinvestment Plan will strengthen our capital position and capture growth opportunities in domestic and overseas markets.
Profitability in our key markets in the South East Asia and South AsiaProfitability in our key markets in the South East Asia and South Asia are gaining momentum.
With the improving economic environment in the markets that weWith the improving economic environment in the markets that we operate, the Group expects its financial performance for the current financial year ending 30 June 2010 to improve significantly and we expect to exceed our KPIs.
39
Thank You
Khairussaleh RamliChief Financial OfficerContact: (6)03-2074 4288
MALAYAN BANKING BERHAD14th Floor, Menara Maybank100 Jalan Tun Perak
Hazimi KassimHead, Strategy and Corporate FinanceContact: (6)03-2074 8101
Raja Indra Putra Raja IsmailHead, Investor RelationsContact: (6)03-2074 8582Contact: (6)03 2074 4288
Email: [email protected], Jalan Tun Perak50050 Kuala Lumpur, MalaysiaTel : (6)03-2070 8833
www.maybank.com
Contact: (6)03 2074 8101Email: [email protected]
Contact: (6)03 2074 8582Email: [email protected]
40