Embed Size (px)
DESCRIPTION
For the complete report, get in touch with us at : [email protected] The Sugar Industry in India is part of Netscribes’ Food & Beverage Series reports. The market will be boosted by the rapidly growing food and beverage industry with increasing production of confectionaries, resulting in increased demand for sugar. The report begins with the market overview section, providing details on the domestic sugar production and consumption. India is the world’s largest sugar consuming country and is also the second largest in terms of sugar production. The growth of sugar factories along with the sugar industry segments depicts the sugar industry scenario in India. The sugarcane overview section provides a clear idea about the linkage between the sugarcane farmers and millers, including growth of sugarcane production and cane acreage. This is followed by the sugar industry value chain, illustrating the structure and operational mechanism in the sugar plants and sugar refineries, including the distillery and cogeneration process. The regional distribution section provides a vivid description of the sugar industry in the largest sugar producing states across the country, including Maharashtra, Uttar Pradesh, Karnataka, Tamil Nadu, Andhra Pradesh, Gujarat, Haryana, Punjab and Bihar. This section provides state-wise information, such as no. of sugar factories, sugar production, average sugarcane production, sugarcane area and production. Factors driving the growth of sugar industry in India are also explained in detail. Growing population coupled with rising income is providing impetus to the growth in the country’s sugar consumption, benefiting the overall sugar industry. India is the world’s second largest populated country, representing about 17.31% of the global population. Aggressive growth in the food and beverage industries will lead to the increasing demand for sugar. High sugar content in confectionaries, including chocolates, pastries and ice-creams, will drive the domestic demand for sugar. By-products, such as ethanol and power via cogeneration provides cross functional and cross business opportunities. Growing pharmaceutical market and low per capita sugar consumption in India provide opportunities for the players to capitalize upon. The challenges hindering the market are illustrated. Oversupply situation coupled with higher cane prices results in declining profit margin for the players in the sugar industry. Cyclical nature of the crop results in volatility in sugar production leading to high cane arrears. The present pricing policy is highly government regulated resulting in limited bargaining power of the sugar millers. The government initiatives section provides a detailed description about the Pre-Budget Memorandum 2012-13, including removal of 10% levy sugar quota, implementation of tax incentives, Cenvat Credit on Bagasse, tax deduction under section 35 AD and exemption from both se
Citation preview
Insert Cover Image using Slide Master ViewDo not distort
Sugar Industry IndiaSugar Industry – India
June 2012
Executive Summary
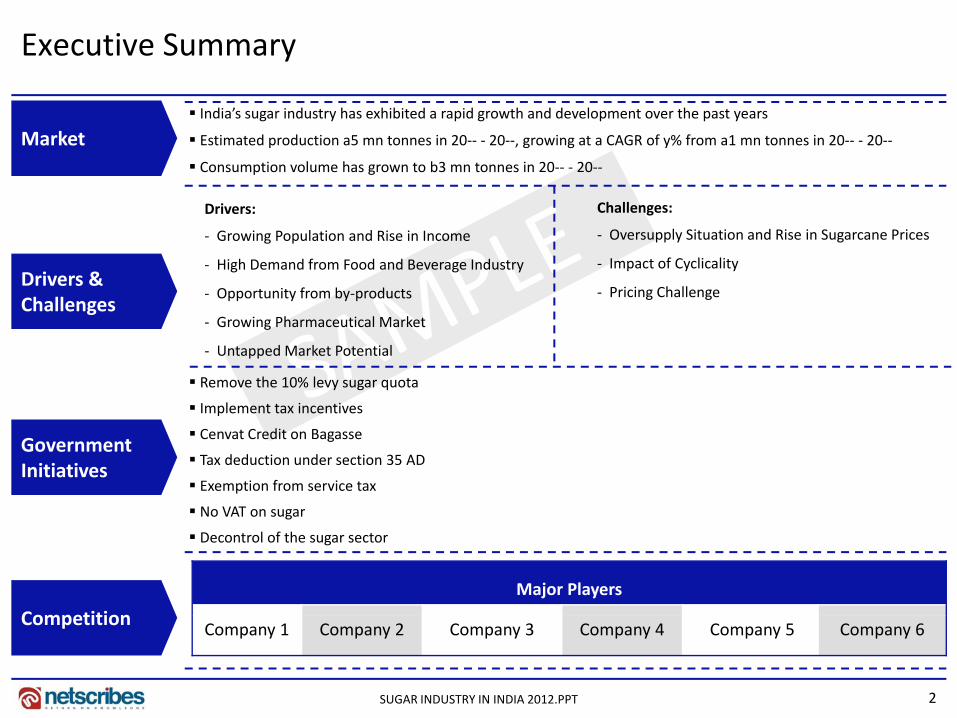
Market India’s sugar industry has exhibited a rapid growth and development over the past years
Estimated production a5 mn tonnes in 20‐‐ ‐ 20‐‐, growing at a CAGR of y% from a1 mn tonnes in 20‐‐ ‐ 20‐‐
Consumption volume has grown to b3 mn tonnes in 20‐‐ ‐ 20‐‐
D i Challenges
Drivers & Challenges
Drivers:
‐ Growing Population and Rise in Income
‐ High Demand from Food and Beverage Industry
‐ Opportunity from by‐products
Challenges:
‐ Oversupply Situation and Rise in Sugarcane Prices
‐ Impact of Cyclicality
‐ Pricing ChallengeChallenges
‐ Growing Pharmaceutical Market
‐ Untapped Market Potential
Remove the 10% levy sugar quota
Implement tax incentives
Government Initiatives
Implement tax incentives
Cenvat Credit on Bagasse
Tax deduction under section 35 AD
Exemption from service tax
No VAT on sugar
Competition
No VAT on sugar
Decontrol of the sugar sector
Major Players
2SUGAR INDUSTRY IN INDIA 2012.PPT
Competition Company 1 Company 2 Company 3 Company 4 Company 5 Company 6
•Market Overview
•Regional Distribution
•Export‐Import
•Drivers & Challengese s & a e ges
•Government Initiatives
•Competition•Competition
•Strategic Recommendations
3SUGAR INDUSTRY IN INDIA 2012.PPT
Sugar industry in India, exhibiting rapid development with annual double digit growth through 20‐‐ ‐ ‐‐
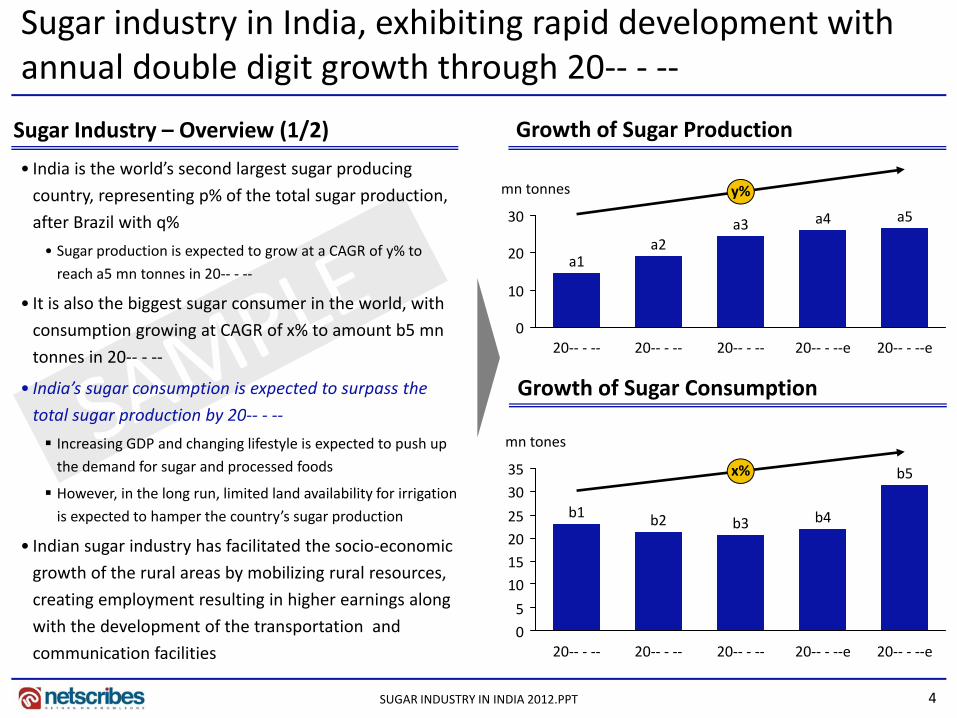
• India is the world’s second largest sugar producing
country, representing p% of the total sugar production,
Growth of Sugar ProductionSugar Industry – Overview (1/2)
mn tonnes y%
after Brazil with q%
• Sugar production is expected to grow at a CAGR of y% to
reach a5 mn tonnes in 20‐‐ ‐ ‐‐
• It is also the biggest sugar consumer in the world, with10
20
30 a5a4a3a2
a1
It is also the biggest sugar consumer in the world, with
consumption growing at CAGR of x% to amount b5 mn
tonnes in 20‐‐ ‐ ‐‐
• India’s sugar consumption is expected to surpass the
t t l d ti b 20
020‐‐ ‐ ‐‐e20‐‐ ‐ ‐‐e20‐‐ ‐ ‐‐20‐‐ ‐ ‐‐20‐‐ ‐ ‐‐
Growth of Sugar Consumptiontotal sugar production by 20‐‐ ‐ ‐‐
Increasing GDP and changing lifestyle is expected to push up
the demand for sugar and processed foods
However, in the long run, limited land availability for irrigation
i t d t h th t ’ d ti 25
30
35
mn tones
x% b5
b4b1is expected to hamper the country’s sugar production
• Indian sugar industry has facilitated the socio‐economic
growth of the rural areas by mobilizing rural resources,
creating employment resulting in higher earnings along 5
10
15
20
25 b4b3b2b1
4SUGAR INDUSTRY IN INDIA 2012.PPT
with the development of the transportation and
communication facilities0
20‐‐ ‐ ‐‐e20‐‐ ‐ ‐‐e20‐‐ ‐ ‐‐20‐‐ ‐ ‐‐20‐‐ ‐ ‐‐
Sugar industry had generated INR t bn in revenue in 20‐‐ ‐ ‐‐
Sugar Industry – Overview (2/2)
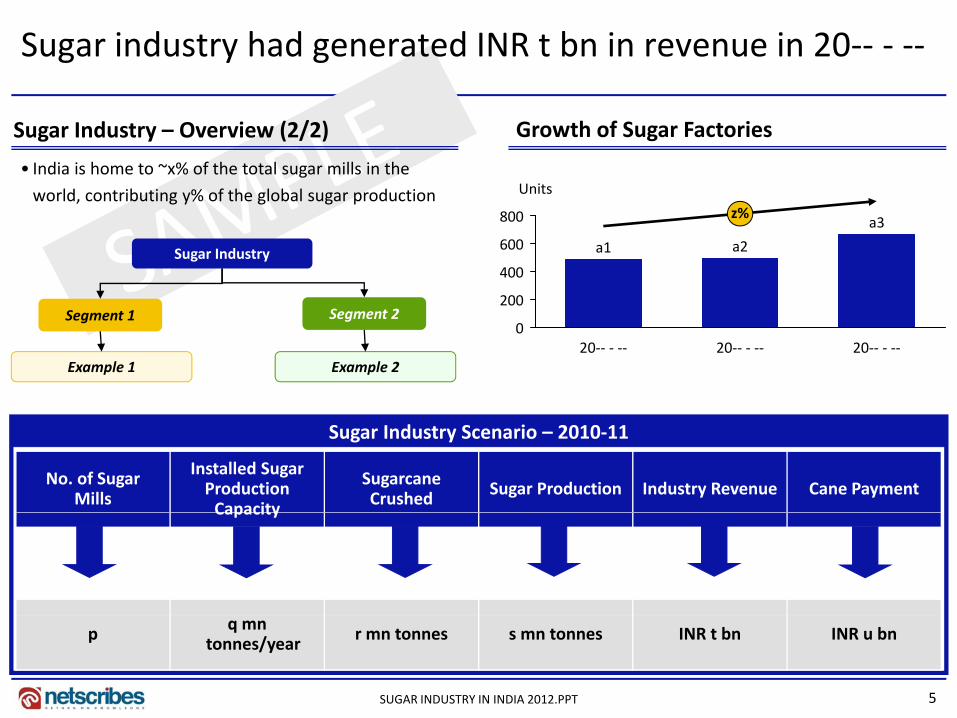
• India is home to ~x% of the total sugar mills in the
world, contributing y% of the global sugar production
Growth of Sugar Factories
Units
200
400
600
800 a3z%
a2a1Sugar Industry
020‐‐ ‐ ‐‐20‐‐ ‐ ‐‐20‐‐ ‐ ‐‐
Segment 1 Segment 2
Example 1 Example 2
No. of Sugar Mills
Installed Sugar Production Capacity
Sugarcane Crushed Sugar Production Industry Revenue Cane Payment
Sugar Industry Scenario – 2010‐11
Capacity
5SUGAR INDUSTRY IN INDIA 2012.PPT
p q mn tonnes/year r mn tonnes s mn tonnes INR t bn INR u bn
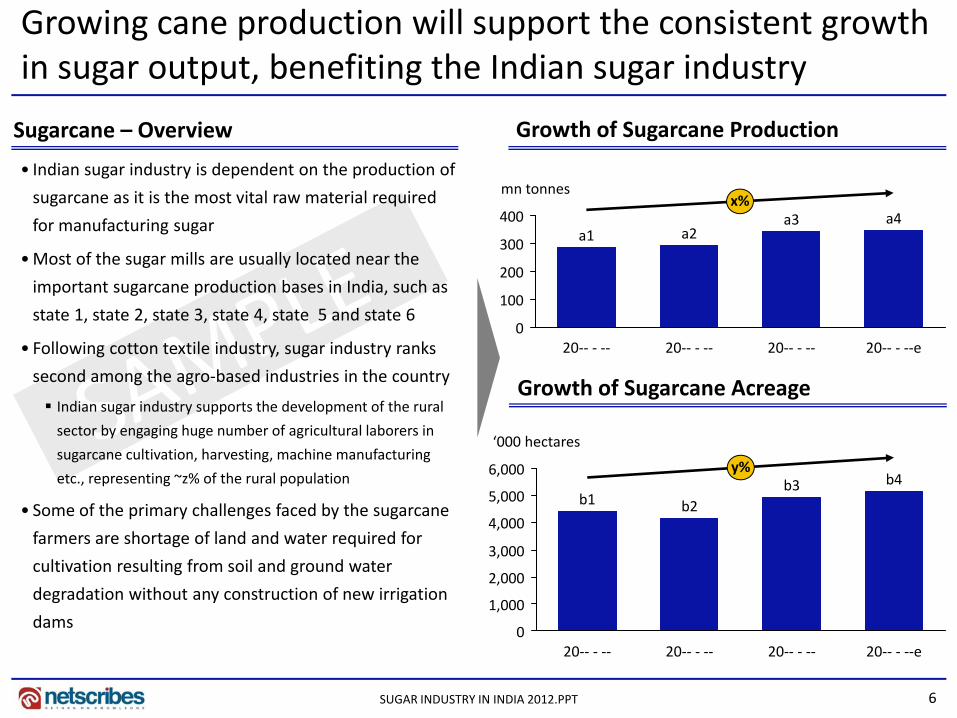
Growing cane production will support the consistent growth in sugar output, benefiting the Indian sugar industry
• Indian sugar industry is dependent on the production of
sugarcane as it is the most vital raw material required
Growth of Sugarcane ProductionSugarcane – Overview
mn tonnesx%g q
for manufacturing sugar
•Most of the sugar mills are usually located near the
important sugarcane production bases in India, such as 100
200
300
400x%
a4a3a2a1
state 1, state 2, state 3, state 4, state 5 and state 6
• Following cotton textile industry, sugar industry ranks
second among the agro‐based industries in the country
Indian sugar industry supports the development of the rural
020‐‐ ‐ ‐‐e20‐‐ ‐ ‐‐20‐‐ ‐ ‐‐20‐‐ ‐ ‐‐
Growth of Sugarcane AcreageIndian sugar industry supports the development of the rural
sector by engaging huge number of agricultural laborers in
sugarcane cultivation, harvesting, machine manufacturing
etc., representing ~z% of the rural population
• Some of the primary challenges faced by the sugarcane5,000
6,000
‘000 hectares
b1
y%b4b3
b2• Some of the primary challenges faced by the sugarcane
farmers are shortage of land and water required for
cultivation resulting from soil and ground water
degradation without any construction of new irrigation
d1,000
2,000
3,000
4,000
6SUGAR INDUSTRY IN INDIA 2012.PPT
dams0
20‐‐ ‐ ‐‐ 20‐‐ ‐ ‐‐e20‐‐ ‐ ‐‐20‐‐ ‐ ‐‐
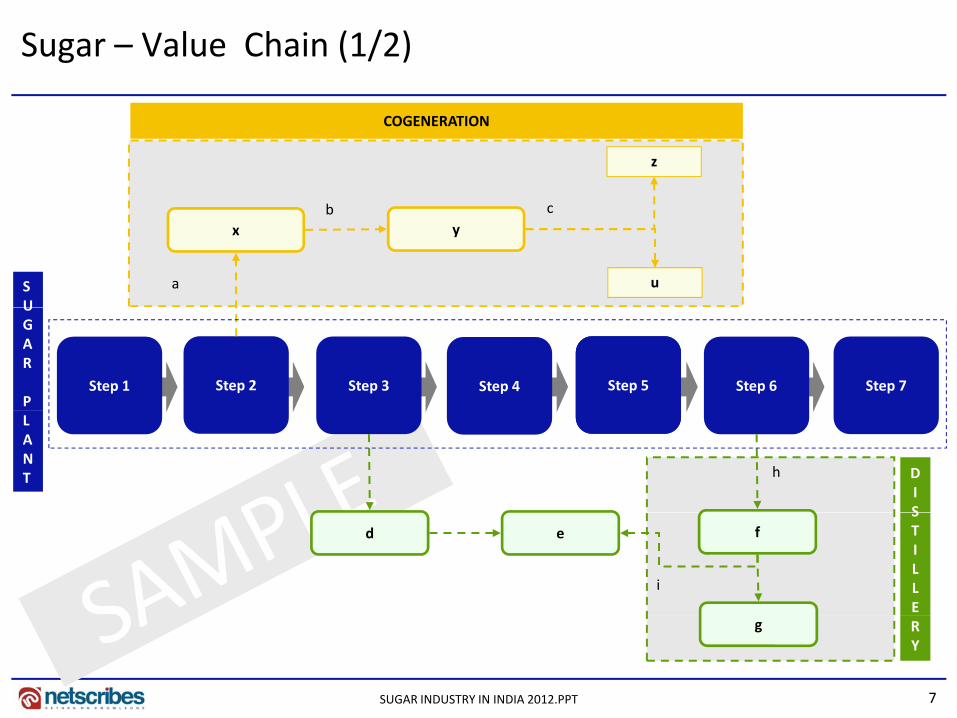
Sugar – Value Chain (1/2)
z
b
COGENERATION
x y
ua
b c
SU
Step 1 Step 2 Step 3 Step 4Syrup Boiling Step 6 Step 7Step 5
UGAR
P
h DIS
LANT
d e f
i
STILLE
7SUGAR INDUSTRY IN INDIA 2012.PPT
g RY
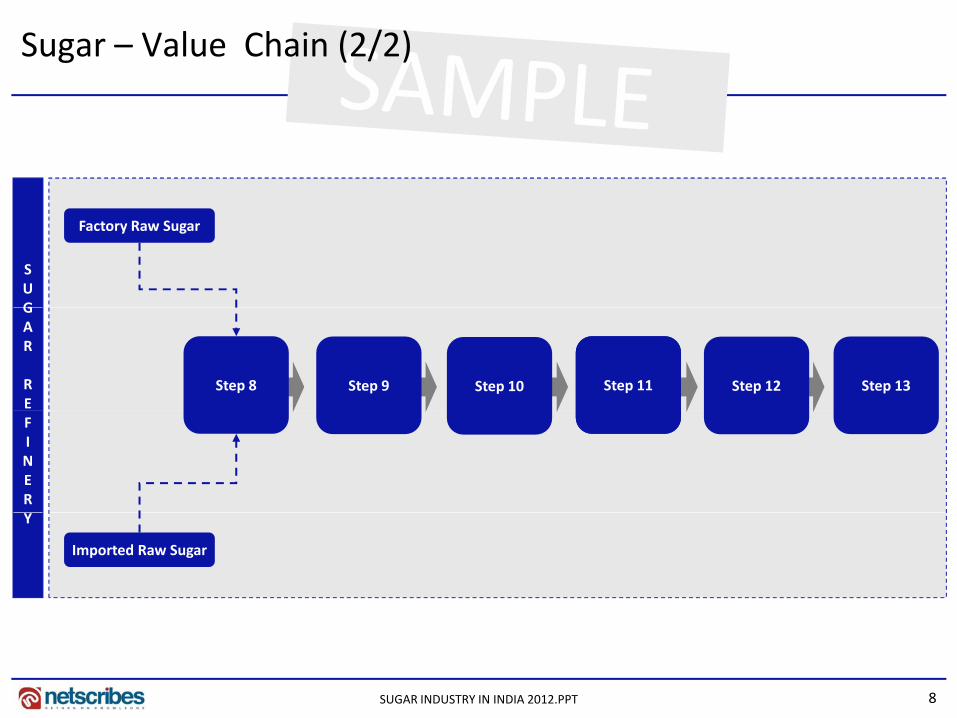
Sugar – Value Chain (2/2)
SUG
Factory Raw Sugar
Step 8 Step 9 Step 10Syrup Boiling Step 12 Step 13Step 11
GAR
REFINERY
Imported Raw Sugar
8SUGAR INDUSTRY IN INDIA 2012.PPT
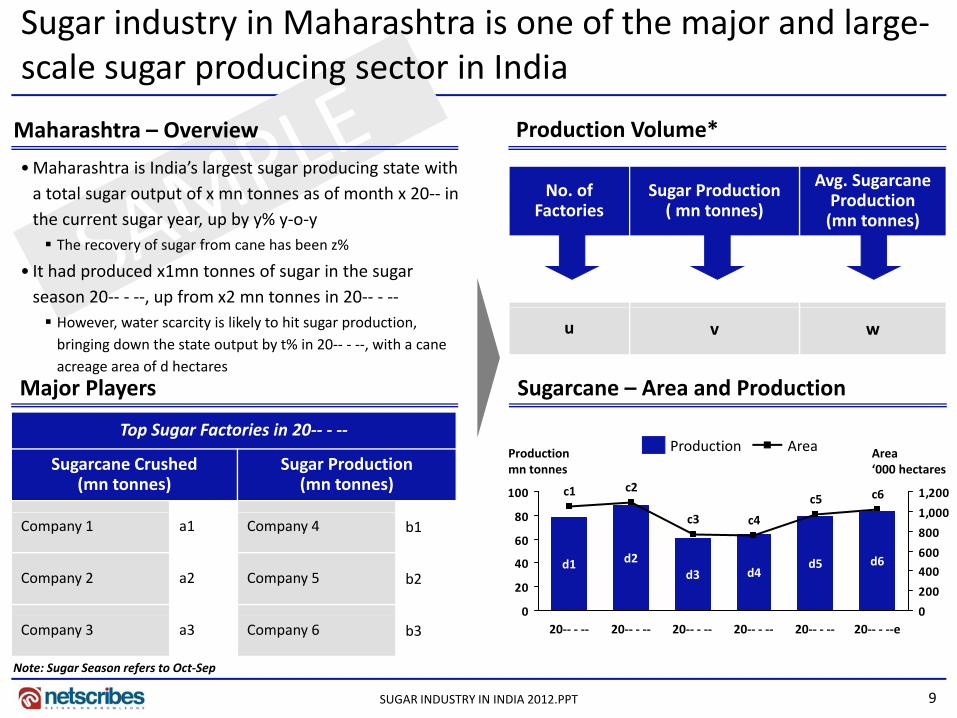
Sugar industry in Maharashtra is one of the major and large‐scale sugar producing sector in India
•Maharashtra is India’s largest sugar producing state with a total sugar output of x mn tonnes as of month x 20‐‐ in
Production Volume*Maharashtra – Overview
No. of F i
Sugar Production( )
Avg. Sugarcane Production
the current sugar year, up by y% y‐o‐y The recovery of sugar from cane has been z%
• It had produced x1mn tonnes of sugar in the sugar season 20‐‐ ‐ ‐‐, up from x2 mn tonnes in 20‐‐ ‐ ‐‐
Factories ( mn tonnes) Production(mn tonnes)
However, water scarcity is likely to hit sugar production, bringing down the state output by t% in 20‐‐ ‐ ‐‐, with a cane acreage area of d hectares
Sugarcane – Area and ProductionMajor Players
u v w
Top Sugar Factories in 20‐‐ ‐ ‐‐
Sugarcane Crushed (mn tonnes)
Sugar Production (mn tonnes)
80
100
1 000
1,200
Area‘000 hectares
Productionmn tonnes
c6c5c2c1
AreaProduction
Company 1 a1 Company 4 b1
Company 2 a2 Company 5 b2
0
20
40
60
80
0
200
400
600
800
1,000
d6d5
c4
d4
c3
d3d2d1
9SUGAR INDUSTRY IN INDIA 2012.PPT
Note: Sugar Season refers to Oct‐Sep
Company 3 a3 Company 6 b30 0
20‐‐ ‐ ‐‐e20‐‐ ‐ ‐‐20‐‐ ‐ ‐‐20‐‐ ‐ ‐‐20‐‐ ‐ ‐‐20‐‐ ‐ ‐‐
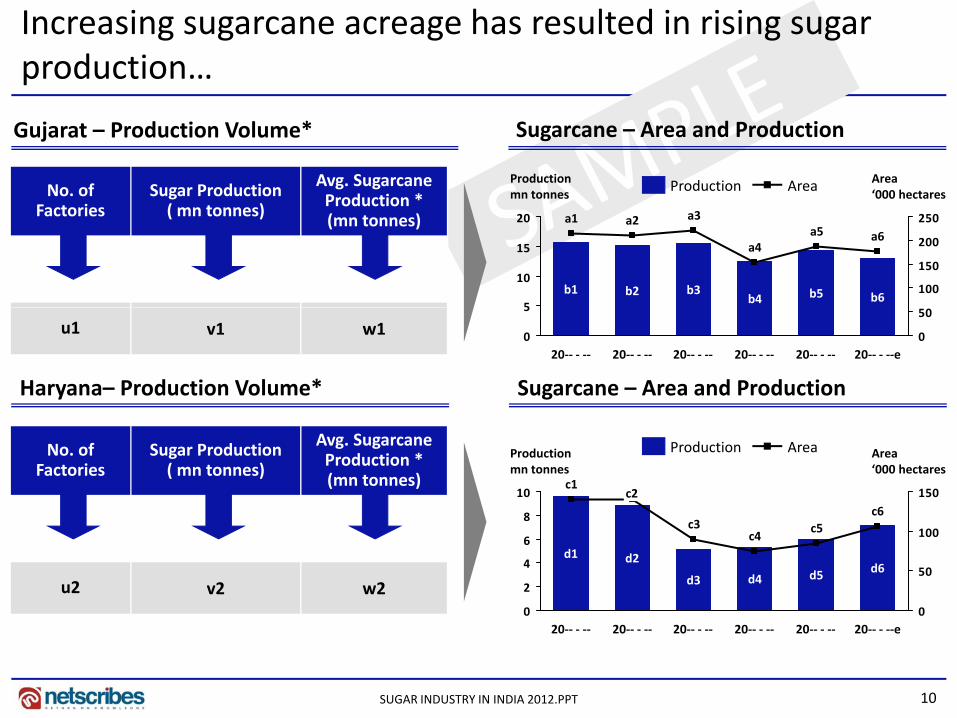
Increasing sugarcane acreage has resulted in rising sugar production…
Sugarcane – Area and ProductionGujarat – Production Volume*
No. of F i
Sugar Production( )
Avg. Sugarcane Production *
Area‘000 hectares
Productionmn tonnes
AreaProduction
Factories ( mn tonnes) Production (mn tonnes)
5
10
15
20
100
150
200
250a6
b6
a5
b5
a4
b4
a3
b3
a2
b2
a1
b1
Haryana– Production Volume*
u1 v1 w1 0
5
0
50
20‐‐ ‐ ‐‐e20‐‐ ‐ ‐‐20‐‐ ‐ ‐‐20‐‐ ‐ ‐‐20‐‐ ‐ ‐‐20‐‐ ‐ ‐‐
Sugarcane – Area and Production
No. of Factories
Sugar Production( mn tonnes)
Avg. Sugarcane Production *(mn tonnes)
8
10 150c2c1
c6
Productionmn tonnes
Area‘000 hectares
AreaProduction
u2 v2 w20
2
4
6
8
0
50
100
d4
c3
d3
d2d1
c5
d5
c6
d6
c4
10SUGAR INDUSTRY IN INDIA 2012.PPT
0 020‐‐ ‐ ‐‐20‐‐ ‐ ‐‐20‐‐ ‐ ‐‐ 20‐‐ ‐ ‐‐ 20‐‐ ‐ ‐‐e20‐‐ ‐ ‐‐
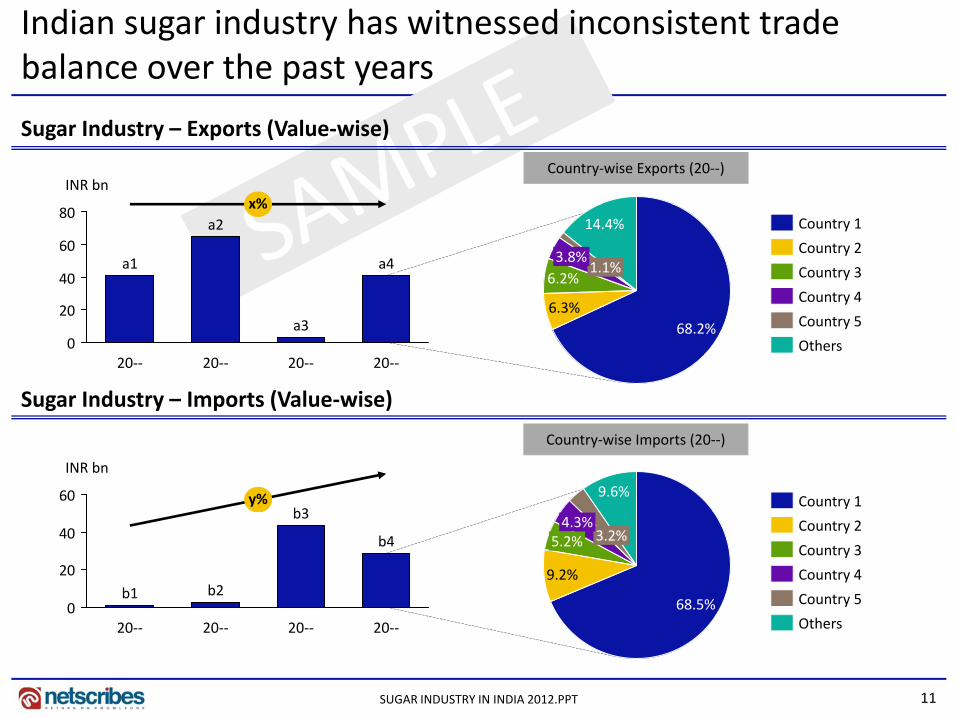
Indian sugar industry has witnessed inconsistent trade balance over the past years
Sugar Industry – Exports (Value‐wise)
x%INR bn
Country‐wise Exports (20‐‐)
20
40
60
80x%
a4
a2
a1 1.1%3.8%
6.2%
6 3%
14.4%
Country 4
Country 3
Country 2
Country 1
Sugar Industry – Imports (Value‐wise)
0
20
20‐‐20‐‐
a3
20‐‐20‐‐
6.3%68.2% Country 5
Others
g y p ( )
Country‐wise Imports (20‐‐)
60 y%
INR bn
b39.6%
Country 1
0
20
40 b4
b3
b2b1
3.2%4.3%
5.2%
9.2%
68.5% Country 5
Country 4
Country 3
Country 2
11SUGAR INDUSTRY IN INDIA 2012.PPT
20‐‐20‐‐20‐‐20‐‐ Others
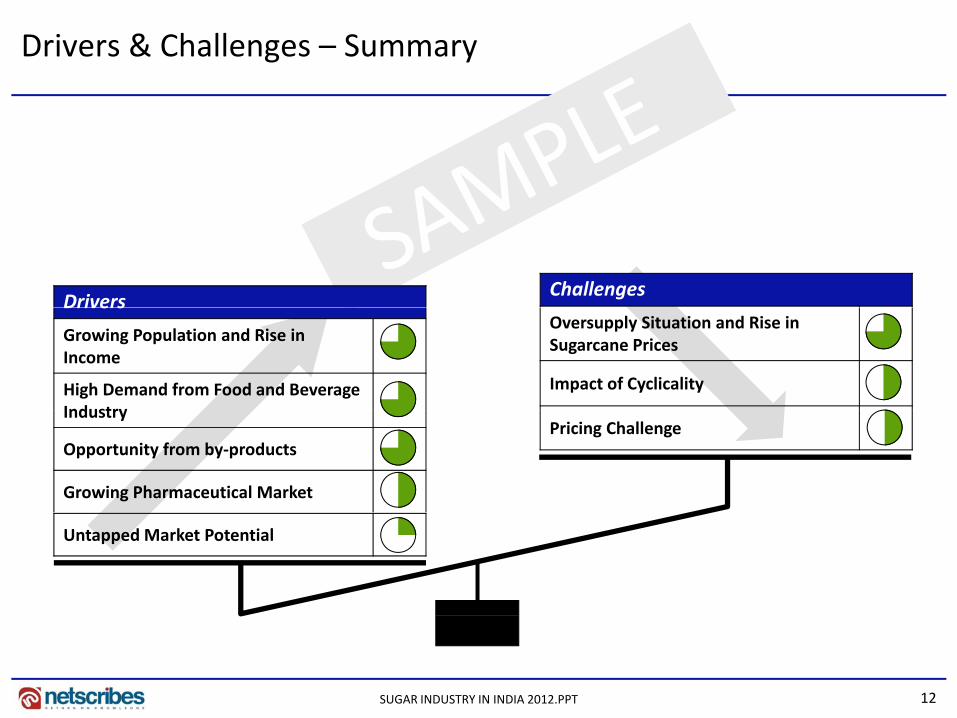
Drivers & Challenges – Summary
DriversChallenges
Drivers
Growing Population and Rise in Income
High Demand from Food and Beverage Industry
Oversupply Situation and Rise in Sugarcane Prices
Impact of Cyclicality
Industry
Opportunity from by‐products
Growing Pharmaceutical Market
Pricing Challenge
Untapped Market Potential
12SUGAR INDUSTRY IN INDIA 2012.PPT
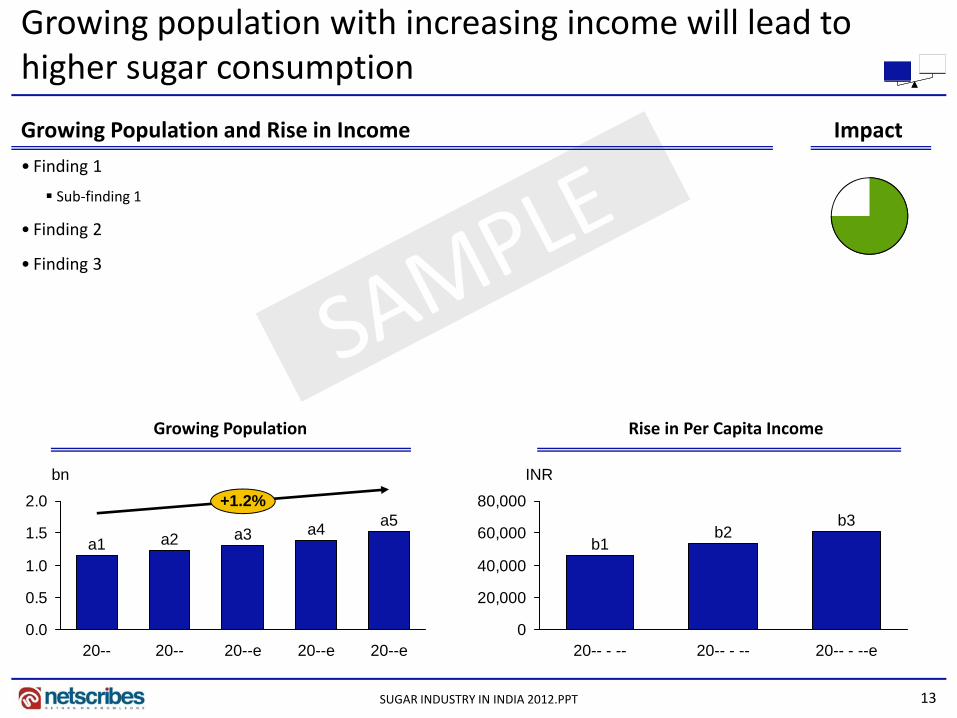
Growing population with increasing income will lead to higher sugar consumption
ImpactGrowing Population and Rise in Income
• Finding 1
Sub‐finding 1
• Finding 2
• Finding 3
Growing Population Rise in Per Capita Income
2.0bn
+1.2% 80,000INR
0.5
1.0
1.5a5a4a3a2a1
20,000
40,000
60,000b3
b2b1
13SUGAR INDUSTRY IN INDIA 2012.PPT
0.020--e20--e20--e20--20--
020-- - --e20-- - --20-- - --
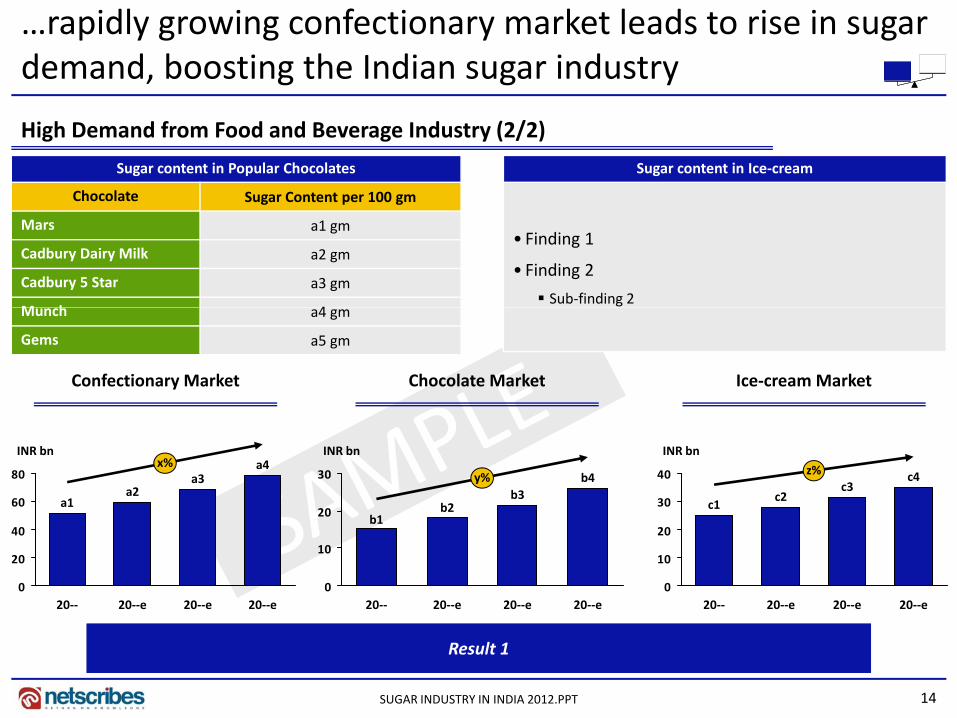
…rapidly growing confectionary market leads to rise in sugar demand, boosting the Indian sugar industry
High Demand from Food and Beverage Industry (2/2)
Sugar content in Popular Chocolates
Chocolate Sugar Content per 100 gm
Sugar content in Ice‐cream
Mars a1 gm
Cadbury Dairy Milk a2 gm
Cadbury 5 Star a3 gm
M h 4
• Finding 1
• Finding 2
Sub‐finding 2Munch a4 gm
Gems a5 gm
Ice‐cream MarketChocolate MarketConfectionary Market
60
80
INR bnx% a4
a3a2
a120
30
INR bn
y% b4b3
b2 30
40 c4c3
c2c1
INR bn
z%
0
20
40
20‐‐e20‐‐e20‐‐e20‐‐0
10
20
20‐‐e20‐‐e20‐‐e20‐‐
b1
0
10
20
20‐‐e20‐‐e20‐‐e20‐‐
14SUGAR INDUSTRY IN INDIA 2012.PPT
Result 1Result 1
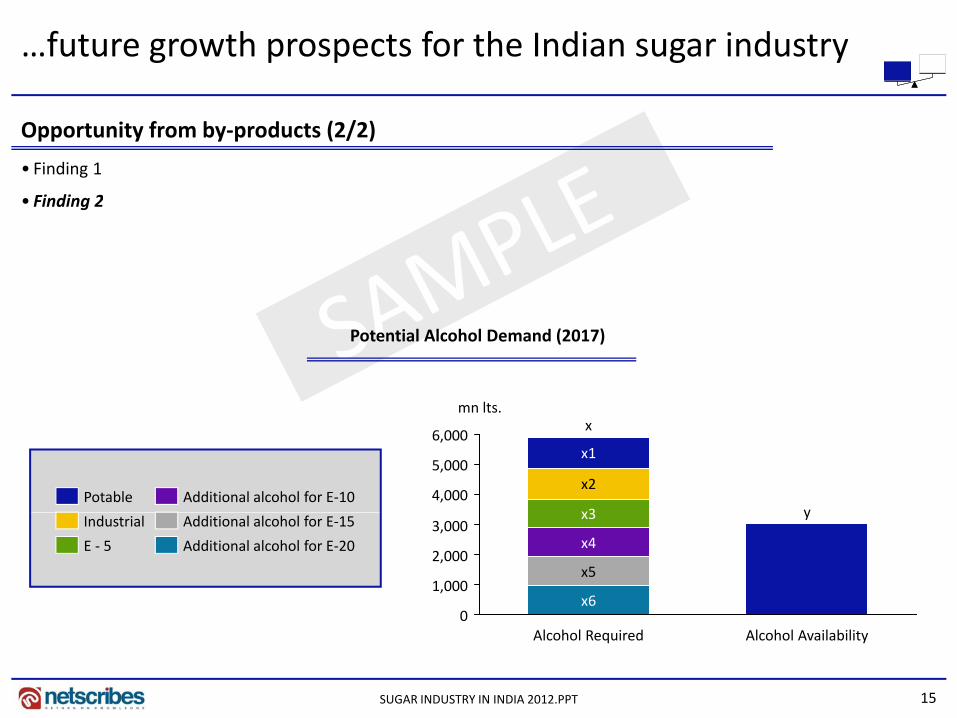
…future growth prospects for the Indian sugar industry
Opportunity from by‐products (2/2)
• Finding 1
• Finding 2Finding 2
mn lts
Potential Alcohol Demand (2017)
4,000
5,000
6,000
y
x
x3
x2
x1
mn lts.
Additional alcohol for E‐10Potable
0
1,000
2,000
3,000y
x6
x5
x4
x3
Additional alcohol for E‐20
Additional alcohol for E‐15
E ‐ 5
Industrial
15SUGAR INDUSTRY IN INDIA 2012.PPT
0Alcohol AvailabilityAlcohol Required
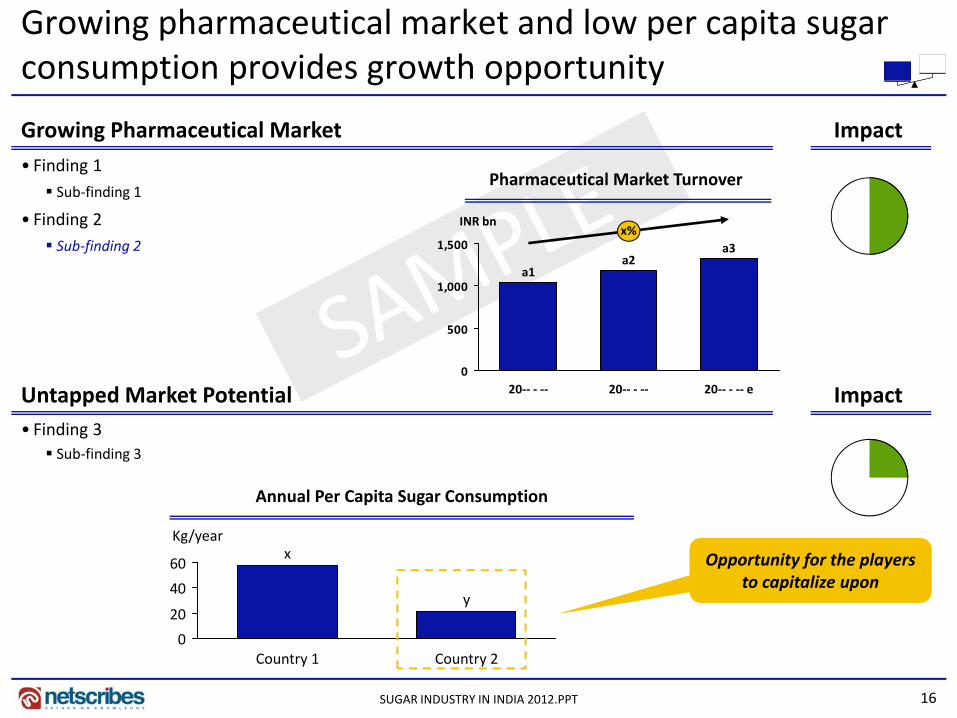
Growing pharmaceutical market and low per capita sugar consumption provides growth opportunity
•Finding 1 Sub‐finding 1
Growing Pharmaceutical Market Impact
Pharmaceutical Market Turnover
• Finding 2 Sub‐finding 2
1,000
1,500
INR bn
a3a2
a1
x%
Untapped Market Potential Impact0
500
20‐‐ ‐ ‐‐ e20‐‐ ‐ ‐‐20‐‐ ‐ ‐‐
• Finding 3 Sub‐finding 3
Annual Per Capita Sugar Consumption
20
40
60
y
xKg/year
Opportunity for the players to capitalize upon
16SUGAR INDUSTRY IN INDIA 2012.PPT
0
20
Country 2Country 1
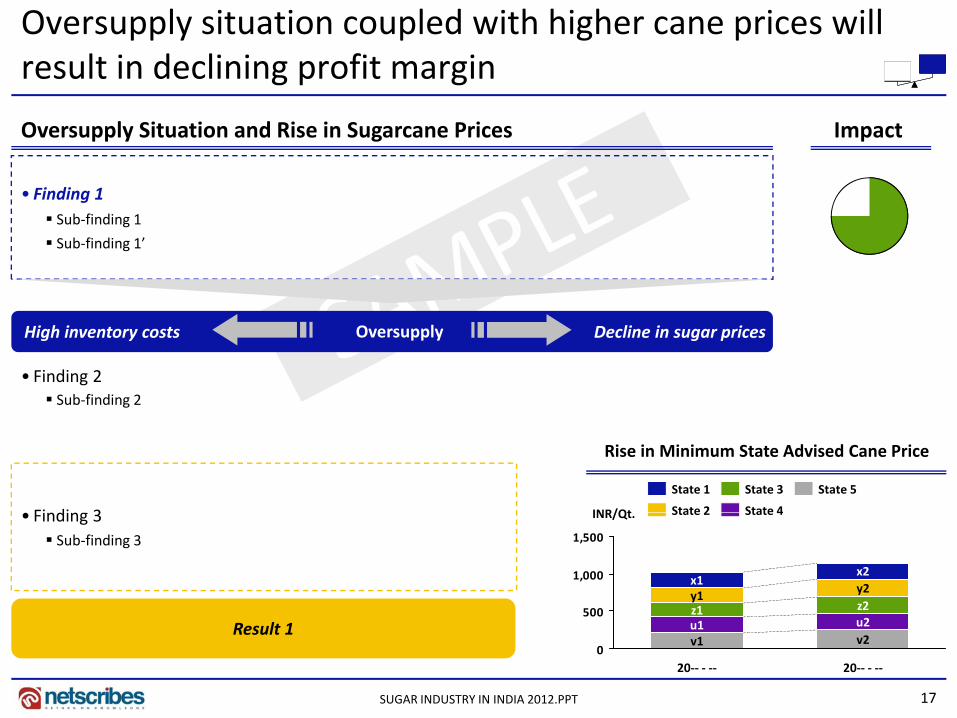
Oversupply situation coupled with higher cane prices will result in declining profit margin
Oversupply Situation and Rise in Sugarcane Prices Impact
• Finding 1 Sub‐finding 1
Sub‐finding 1’
High inventory costs Decline in sugar pricesOversupply
• Finding 2 Sub‐finding 2
Rise in Minimum State Advised Cane Price
Finding 3 INR/Qt
State 5
State 4
State 3
State 2
State 1
• Finding 3 Sub‐finding 3
500
1,000
1,500
INR/Qt.
z2y2x2
z1y1x1
State 4State 2
17SUGAR INDUSTRY IN INDIA 2012.PPT
Result 10
500
20‐‐ ‐ ‐‐
v2u2
20‐‐ ‐ ‐‐
v1u1
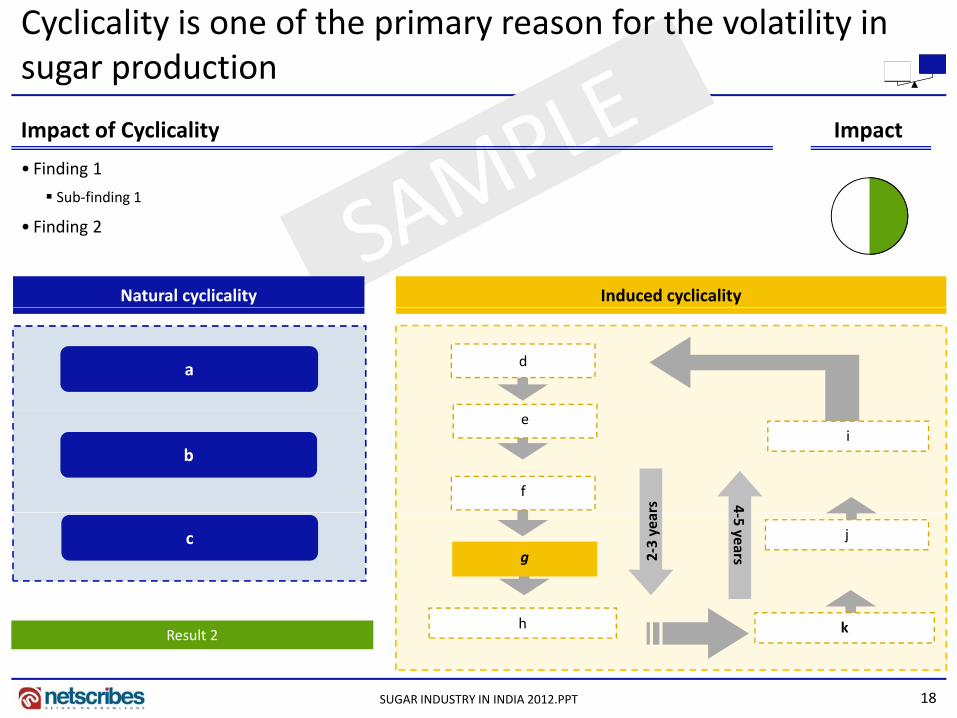
Cyclicality is one of the primary reason for the volatility in sugar production
ImpactImpact of Cyclicality
• Finding 1
Sub‐finding 1
• Finding 2
Induced cyclicalityNatural cyclicality
da
e
f
i
4rs
b
gj
4‐5 years2‐3 yea
c
18SUGAR INDUSTRY IN INDIA 2012.PPT
h kResult 2
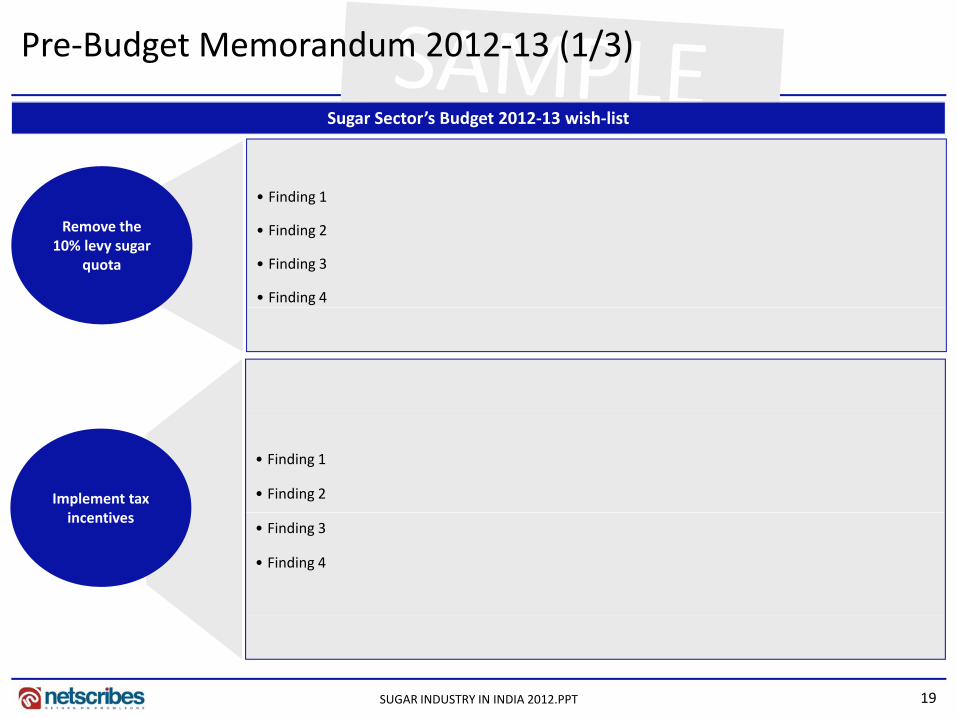
Pre‐Budget Memorandum 2012‐13 (1/3)
Sugar Sector’s Budget 2012‐13 wish‐list
• Finding 1
Remove the 10% levy sugar
quota
• Finding 2
• Finding 3
• Finding 4
Implement tax i i
• Finding 1
• Finding 2
incentives• Finding 3
• Finding 4
19SUGAR INDUSTRY IN INDIA 2012.PPT
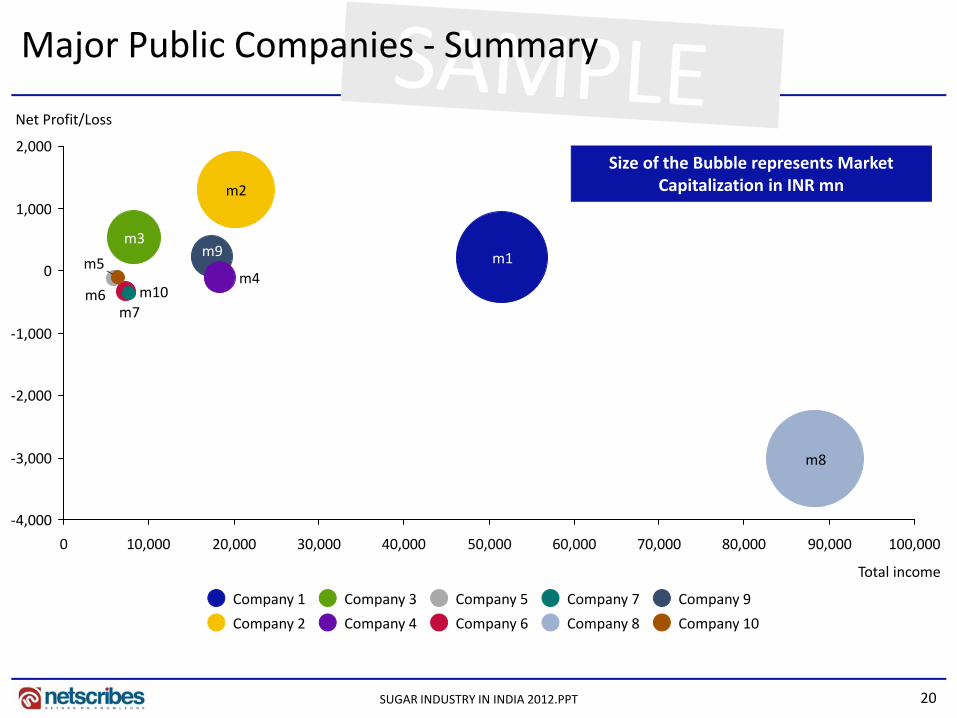
Major Public Companies ‐ Summary
1 000
2,000
m2
Net Profit/Loss
Size of the Bubble represents Market Capitalization in INR mn
0
1,000
m5m9
7m10m6
m4
m3m1
‐2,000
‐1,000m7
‐3,000 m8
‐4,000
0 10,000 20,000 30,000 40,000 50,000 60,000 70,000 80,000 90,000 100,000
Total income
Company 9Company 7Company 5Company 3Company 1
20SUGAR INDUSTRY IN INDIA 2012.PPT
Company 10Company 8Company 6Company 4Company 2
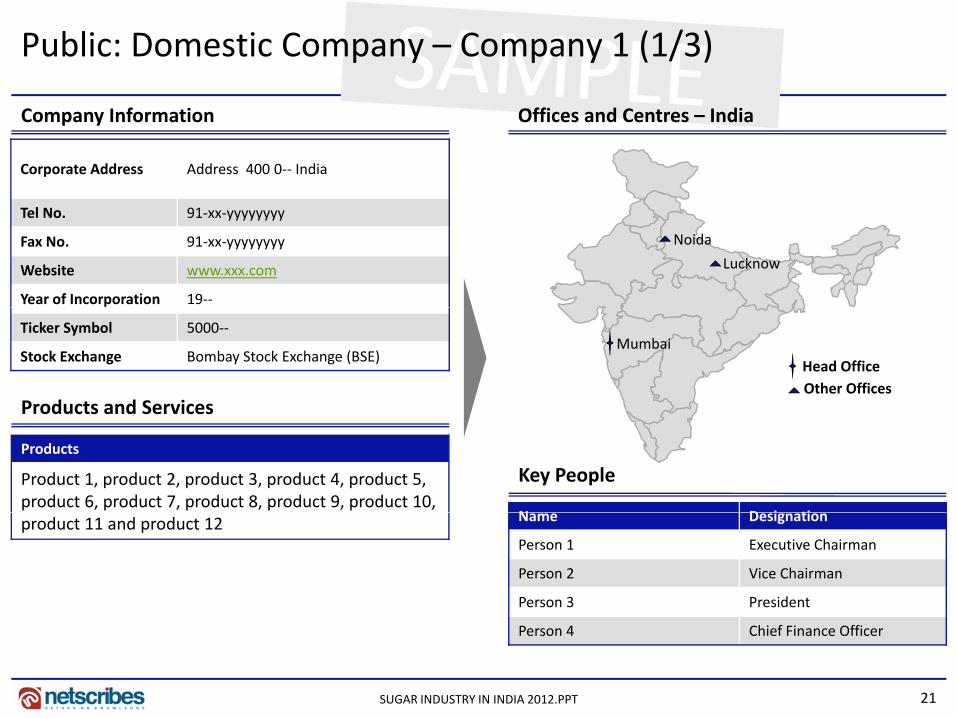
Public: Domestic Company – Company 1 (1/3)
Company Information Offices and Centres – India
Corporate Address Address 400 0‐‐ India
Tel No. 91‐xx‐yyyyyyyy
Fax No. 91‐xx‐yyyyyyyy
Website www.xxx.com
Year of Incorporation 19‐‐
Noida
Lucknow
Products and Services
Ticker Symbol 5000‐‐
Stock Exchange Bombay Stock Exchange (BSE)Head Office
Mumbai
Other Offices
Key People
Products and Services
Products
Product 1, product 2, product 3, product 4, product 5, product 6, product 7, product 8, product 9, product 10,
N D i tiproduct 11 and product 12 Name Designation
Person 1 Executive Chairman
Person 2 Vice Chairman
Person 3 President
21SUGAR INDUSTRY IN INDIA 2012.PPT
Person 4 Chief Finance Officer
i i l S h K i
Public: Domestic Company – Company 1 (2/3)
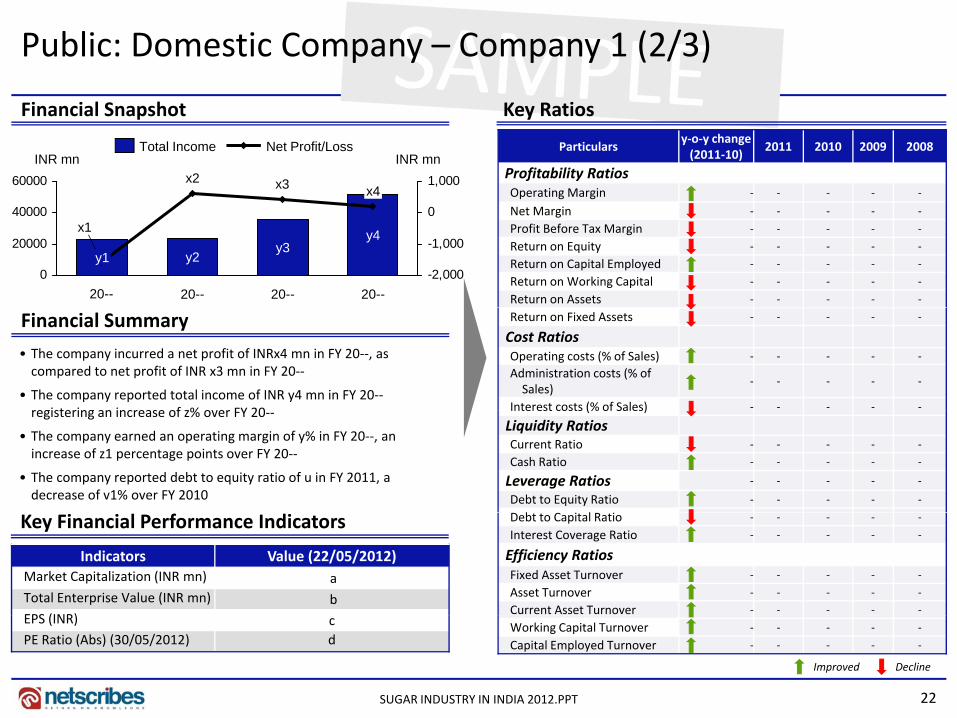
Financial Snapshot Key Ratios
Particulars y‐o‐y change (2011‐10)
2011 2010 2009 2008
Profitability RatiosOperating Margin ‐ ‐ ‐ ‐ ‐
Net Profit/LossTotal Income
60000 1,000INR mn INR mn
x4x3x2
Net Margin ‐ ‐ ‐ ‐ ‐
Profit Before Tax Margin ‐ ‐ ‐ ‐ ‐
Return on Equity ‐ ‐ ‐ ‐ ‐
Return on Capital Employed ‐ ‐ ‐ ‐ ‐
Return on Working Capital ‐ ‐ ‐ ‐ ‐
Return on Assets ‐ ‐ ‐ ‐ ‐
0
20000
40000
-2,000
-1,000
0
20--
y4
20--
y3
20--
y2
x1
y1
20--
Financial Summary
• The company incurred a net profit of INRx4 mn in FY 20‐‐, as compared to net profit of INR x3 mn in FY 20‐‐
• The company reported total income of INR y4 mn in FY 20‐‐registering an increase of % over FY 20
Return on Fixed Assets ‐ ‐ ‐ ‐ ‐
Cost RatiosOperating costs (% of Sales) ‐ ‐ ‐ ‐ ‐
Administration costs (% of Sales)
‐ ‐ ‐ ‐ ‐
Interest costs (% of Sales) ‐ ‐ ‐ ‐ ‐registering an increase of z% over FY 20‐‐
• The company earned an operating margin of y% in FY 20‐‐, an increase of z1 percentage points over FY 20‐‐
• The company reported debt to equity ratio of u in FY 2011, a decrease of v1% over FY 2010
Interest costs (% of Sales)
Liquidity RatiosCurrent Ratio ‐ ‐ ‐ ‐ ‐
Cash Ratio ‐ ‐ ‐ ‐ ‐
Leverage Ratios ‐ ‐ ‐ ‐ ‐
Debt to Equity Ratio ‐ ‐ ‐ ‐ ‐
b i l iKey Financial Performance Indicators
Indicators Value (22/05/2012)Market Capitalization (INR mn) aTotal Enterprise Value (INR mn) bEPS (INR)
Debt to Capital Ratio ‐ ‐ ‐ ‐ ‐
Interest Coverage Ratio ‐ ‐ ‐ ‐ ‐
Efficiency RatiosFixed Asset Turnover ‐ ‐ ‐ ‐ ‐
Asset Turnover ‐ ‐ ‐ ‐ ‐
Current Asset Turnover ‐ ‐ ‐ ‐ ‐
22SUGAR INDUSTRY IN INDIA 2012.PPT
EPS (INR) cPE Ratio (Abs) (30/05/2012) d
Working Capital Turnover ‐ ‐ ‐ ‐ ‐
Capital Employed Turnover ‐ ‐ ‐ ‐ ‐
Improved Decline
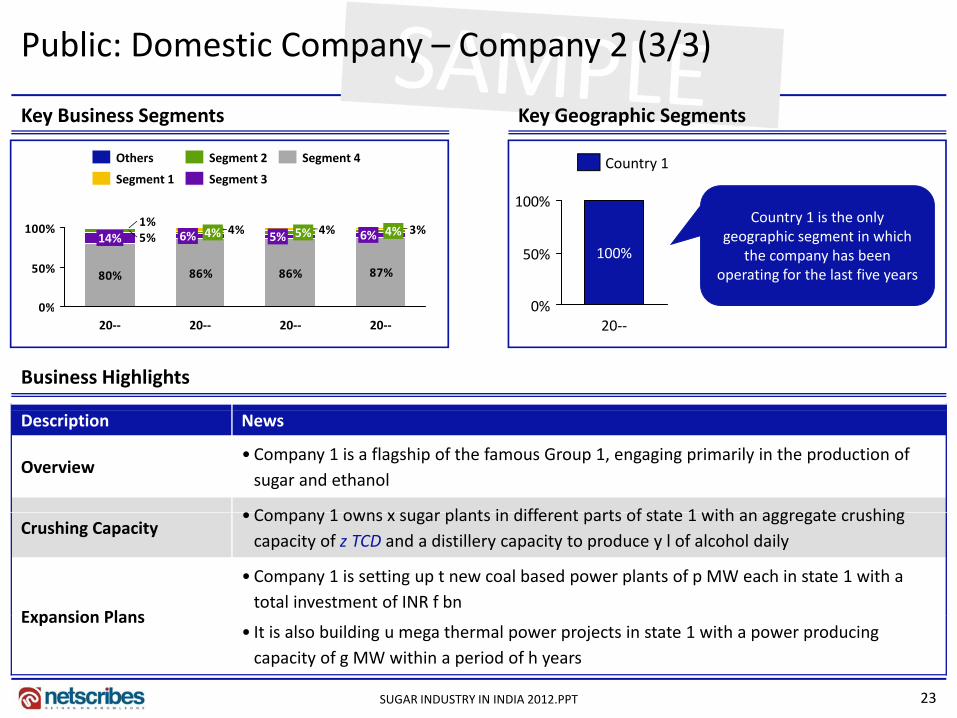
Public: Domestic Company – Company 2 (3/3)
Key Business Segments Key Geographic Segments
Segment 4
Segment 3
Segment 2
Segment 1
Others
100%
Country 1
80% 86% 86% 87%
5%3%4%4%
1%
0%
50%
100% 6% 4%5% 5%6% 4%14%
0%
50%
100%
100%
Country 1 is the only geographic segment in which
the company has been operating for the last five years
Business Highlights
0%20‐‐20‐‐20‐‐20‐‐
0%20‐‐
Description News
Overview• Company 1 is a flagship of the famous Group 1, engaging primarily in the production of sugar and ethanol
• Company 1 owns x sugar plants in different parts of state 1 with an aggregate crushingCrushing Capacity
• Company 1 owns x sugar plants in different parts of state 1 with an aggregate crushing capacity of z TCD and a distillery capacity to produce y l of alcohol daily
Expansion Plans
• Company 1 is setting up t new coal based power plants of p MW each in state 1 with a total investment of INR f bn
23SUGAR INDUSTRY IN INDIA 2012.PPT
Expansion Plans• It is also building u mega thermal power projects in state 1 with a power producing capacity of g MW within a period of h years
Thank you for the attentionThe Sugar Industry – India report is part of Research on India’s Food & Beverage Series.For more detailed information or customized research requirements please contact:
Phone: +91 33 4064 6214Phone: 91 33 4064 6214E‐Mail: [email protected]
Follow us on:
About NetscribesNetscribes is a knowledge‐consulting and solutions firm with clientele across the globe. The company’s expertise spans areas of investment & g g f g p y p p fbusiness research, business & corporate intelligence, content‐management services, and knowledge‐software services. At its core lies a true value proposition that draws upon a vast knowledge base. Netscribes is a one‐stop shop designed to fulfil clients’ profitability and growth objectives.
Disclaimer: This report is published for general information only Although high standards have been used in the preparation “Netscribes” is
24SUGAR INDUSTRY IN INDIA 2012.PPT
Disclaimer: This report is published for general information only. Although high standards have been used in the preparation, Netscribes is not responsible for any loss or damage arising from use of this document. This document is the sole property of Netscribes and prior permission is required for guidelines on reproduction.