Embed Size (px)
Citation preview

Stonnington Survey Group Community Panel
Road Safety SurveyAnalysis Report

Contents
1. EXECUTIVE SUMMARY 5
1.1 Overview. 5
1.2 Results Summary: 6
1.3 Sample. 7
2. SUMMARY OF OVERALL RESULTS 8
Q1a. Safety of pedestrians 8
Q1b. Pedestrian safety issues 9
Q2. Measures to improve road safety for pedestrians 10
Q3a. Cyclists Safety 11
Q3b. Cyclists Safety Issues 12
Q4a. Measures to improve road safety for cyclists 13
Q4b. Ride a bike 14
Q4c. Cyclists safety in riding a bike in local area 15
Q5. Pedestrian Safety 16
Q6. Respondent street type 17
Q7. Speed limits in local streets 18
Q8. Safe speed limit 19
Q9. What respondents consider a safe speed limit 20
Q11. Motor vehicle 21
Q12. No speed limit signs 22
Q13. Speed limit near schools 23
Q14. Confusion with frequent changes in the speed limits 24
Q15. Speeds which respondents generally drive in local streets 25
Q16. General speed limit in all local streets 26
Q17. What speed limits should be in local streets 27
Q18. Driving after consuming alcohol 28
Q19. Attitude towards drinking and driving 29
Q20. Over the legal limit 30
Q21. Consumed alcohol in a premises other than respondents home how often they drive31
Q22. Consumed alcohol in premises other than respondents home how did they leave the premises 32
Q23. Drinking arrangements 33Stonnington Survey Group Page 2 of 61
Q24. Type of arrangements made 34
3. APPENDIX: FULL RESPONSES TO OPEN-ENDED QUESTIONS 35
4. APPENDIX: SURVEY 55
Stonnington Survey Group Page 3 of 61

1. Executive Summary 1.1 Overview.
Topic: Transport safety
Date: Survey – March 2015
Report – May 2015
Audience: Stonnington Survey Group
Number of respondents: 212
Purpose: Transport safety: The purpose of this section is to increase Council’s understanding of residents’ knowledge, attitudes, behaviour and perception of safety with regards to road use within the City of Stonnington. The results will assist Council’s Transport Department in future program planning and service delivery.
Methodology: The Transport Survey Report 2015 was informed by a survey in online and hard copy formats provided via email and post. Survey data was collated on Excel spreadsheets. Where possible, data was analysed quantitatively and put into a graph. When analysing the qualitative data from open-ended questions, attention was given to the variety of responses, as well as giving a ranking of popularity of responses (through counting responses of a similar theme).
Corporate and Community Planning:Corporate and Community Planning (CCP) as part of the broader Communications and Community Planning department provides timely, high quality social policy and planning advice to assist and support the decision-making, service delivery and community development processes of Council. CCP uses social research and community engagement through the Stonnington Survey Group to assist business units to gather data on a variety of service and social issues. Analysis on a range of social and community research leads to improvements and effective outcomes in service and amenity in the City of Stonnington.
Stonnington Survey Group Page 4 of 61

1.2 Results Summary:
Stonnington Survey Group Page 5 of 61

1.3 Sample.
An analysis of the Stonnington Survey Group sample in shown on the table below. Of those respondents who provided their personal details, just over half were females (58%). The age group with the greatest representation was persons aged 55-64 years (28%). The response from 15-24 year olds was very low (just four respondents). This limits the value of analysis for respondents of this age range and these results should not be regarded as representative of this age group. The largest proportions of respondents were from Malvern (18%), Malvern East and Prahran (15%) (see table 1).
% Number
GenderFemale 58% 122
Male 43% 90
Age Structure15-24 years 2% 425-34 years 6% 1235-44 years 18% 3845-54 years 22% 4655-64 years 28% 5965-74 years 19% 4175+ years 6% 12
SuburbArmadale 14% 29Toorak 6% 13South Yarra 8% 17Prahran 15% 32Malvern 18% 39Malvern East 15% 32Windsor 8% 18Glen Iris 12% 25Kooyong 2% 5Hawksburn 1% 2
Key demographics2015 Respondents
Table 1: SSG profile
Stonnington Survey Group Page 6 of 61

2. Summary of Overall results Q1a. Safety of pedestrians
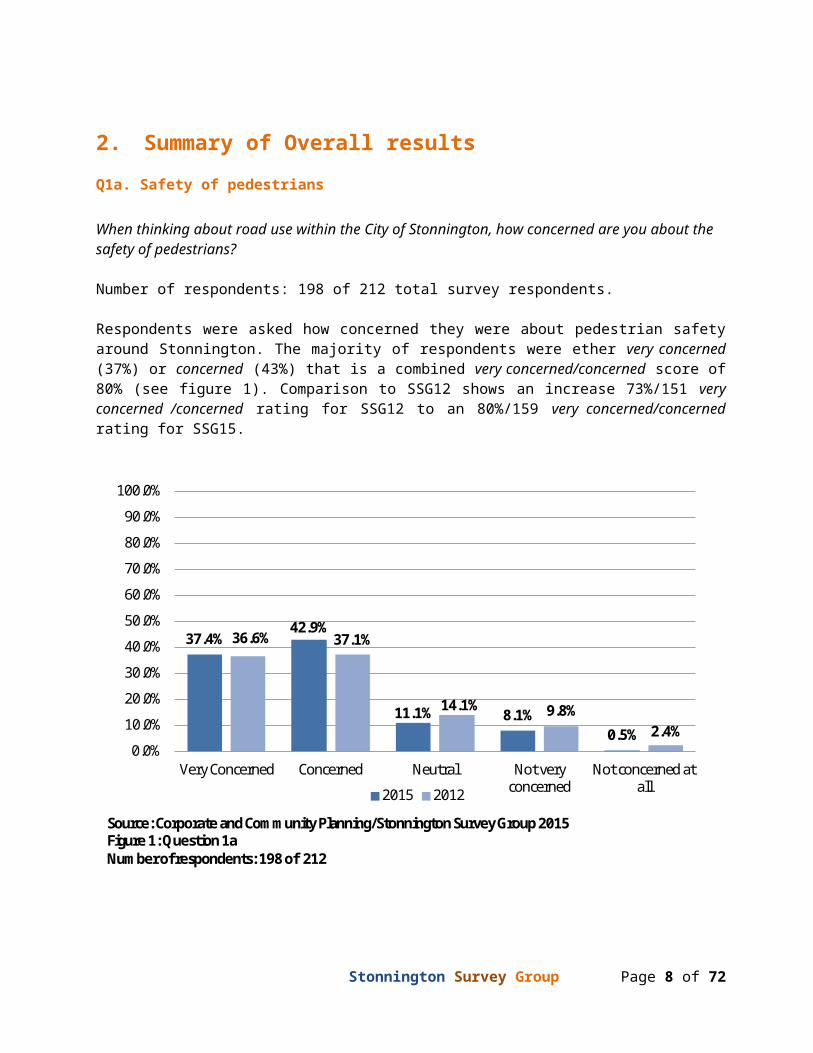
When thinking about road use within the City of Stonnington, how concerned are you about the safety of pedestrians?
Number of respondents: 198 of 212 total survey respondents.
Respondents were asked how concerned they were about pedestrian safety around Stonnington. The majority of respondents were ether very concerned (37%) or concerned (43%) that is a combined very concerned/concerned score of 80% (see figure 1). Comparison to SSG12 shows an increase 73%/151 very concerned /concerned rating for SSG12 to an 80%/159 very concerned/concerned rating for SSG15.
37.4%42.9%
11.1% 8.1%0.5%
36.6% 37.1%
14.1% 9.8%2.4%
0.0%
10.0%
20.0%
30.0%
40.0%
50.0%
60.0%
70.0%
80.0%
90.0%
100.0%
Very Concerned Concerned Neutral Not very concerned
Not concerned at all2015 2012
Source: Corporate and Community Planning/Stonnington Survey Group 2015Figure 1: Question 1aNumber of respondents: 198 of 212
Stonnington Survey Group Page 7 of 61
Q1b. Pedestrian safety issues
What do you believe are the main road safety concerns for pedestrians within City of Stonnington?
Number of respondents: 197 of 212 total survey respondents.
Respondents were then asked what are the main road safety concerns for pedestrians within City of Stonnington. Just over half of respondents (66%/131) said the main issue was pedestrian behaviour and awareness of vehicles followed by driver awareness of pedestrians (61%/122) and speeding vehicles (52%/103) (see figure 2). All of these results motioned above line up with most of the results from 2012 but the 2015 figures are slightly higher.
52.3%61.9% 66.5%
24.4%17.3%
38.6%
17.3% 17.3%
49.8% 52.7%56.0%
19.3%14.5%
45.4%
15.5% 16.4%
0.0%10.0%20.0%30.0%40.0%50.0%60.0%70.0%80.0%90.0%
100.0%
Speeding vehicles
Driver awareness
of pedestrians
Pedestrian behaviour
and awareness of vehicles
Not enough crossings
with pedestrian operated
signals
Insufficient street
lighting
Uneven footpaths
Cross-overs (driveways)
Other.
2015 2012
Source: Corporate and Community Planning/Stonnington Survey Group 2015Figure 2: Question 1bNumber of respondents: 197 of 212
Note: These percentages will not add up to 100% because respondents were allowed to choose multiple responses.
Summary responses to other:
Bicycles on footpaths or running through pedestrian crossings x10 Drivers running red lights x4 Distracted drivers x2
(For full comments please refer to page 35)
Stonnington Survey Group Page 8 of 61

Q2. Measures to improve road safety for pedestrians
What measures do you think would improve road safety for pedestrians within City of Stonnington?
Number of respondents: 197 of 212 total survey respondents.
Respondents were then asked what measures could be used to improve road safety for pedestrians within Stonnington. Just below half of respondents (46%/90) said improving the footpaths would help pedestrian safety, followed by more median line markings (34%/68) and reducing speed limits (32%/63) (see figure 3).
32.0% 30.5%34.5% 31.0%
18.3%
45.7%
28.4% 22.8%33.3%
26.1% 29.5% 26.1% 19.8%
47.8%
21.7% 26.6%
0.0%10.0%20.0%30.0%40.0%50.0%60.0%70.0%80.0%90.0%
100.0%
Reducing speed limits
Altering road layout (eg. speed
humps, kerb extensions)
More median line
markings enabling
pedestrians to stage
road crossings
More crossings
with pedestrian operated
signals
Improved street
lighting
Improved footpaths
(eg. quality, width)
Advisory signs for
motorists
Other
2015 2012
Source: Corporate and Community Planning/Stonnington Survey Group 2015Figure 3: Question 2Number of respondents: 197 of 212
Note: These percentages will not add up to 100% because respondents were allowed to choose multiple responses.
Summary responses to other:
Pedestrian/ driver awareness x6 Enforce pedestrian illegal actives (e.g. jaywalking) x5 Education campaigns for drivers and pedestrians x4
(For full comments please refer to page 35)
Stonnington Survey Group Page 9 of 61

Q3a. Cyclists Safety
When thinking about road use within the City of Stonnington, how concerned are you about the safety of cyclists?
Number of respondents: 198 of 212 total survey respondents.
Respondents were asked how concerned they were about cyclist’s safety around Stonnington. The majority of respondents were ether very concerned or concerned with a combined score of 73% (see figure 4). Comparison to SSG12 shows an increase from a 34%/70 very concerned rating for SSG12 to a 40%/80 very concerned rating for SSG15.
40.4%32.3%
18.7%
7.6%1.0%
34.0% 37.4%
16.5%8.3%
3.9%
0.0%
10.0%
20.0%
30.0%
40.0%
50.0%
60.0%
70.0%
80.0%
90.0%
100.0%
Very Concerned Concerned Neutral Not very concerned
Not concerned at all2015 2012
Source: Corporate and Community Planning/Stonnington Survey Group 2015Figure 4: Question 3aNumber of respondents: 198 of 212
Stonnington Survey Group Page 10 of 61

Q3b. Cyclists Safety Issues
What do you believe are the main road safety concerns for cyclists within the City of Stonnington?
Number of respondents: 201 of 212 total survey respondents.
Respondents were then asked what are the main road safety concerns for cyclists within City of Stonnington. Nearly seven out of ten respondents (73%146) said driver awareness of cyclists was the main issue followed by cyclist behaviour and awareness of motorists (72%/144) and car doors unexpectedly opening (68%/136) (see figure 5). Comparison to SSG12 shows a slight increase in the three issues mentioned above for SSG15 ranging from a 7% to 9% increase.
32.8% 36.3%
72.6% 71.6%
4.5%
16.4%
67.7%
8.5%17.9%
30.4%
38.6%
66.2% 63.3%
7.7%15.9%
58.5%
8.2%14.5%
0.0%10.0%20.0%30.0%40.0%50.0%60.0%70.0%80.0%90.0%
100.0%
2015 2012
Source: Corporate and Community Planning/Stonnington Survey Group 2015Figure 5: Question 3bNumber of respondents: 201 of 212
Note: These percentages will not add up to 100% because respondents were allowed to choose multiple responses.
Summary responses to other:
Cyclists need to use bike lanes/ bike lanes too narrow x7 Cyclists not visible in the day or night x4 Cyclists do not obey road rules x3
(For full comments please refer to page 35)
Stonnington Survey Group Page 11 of 61

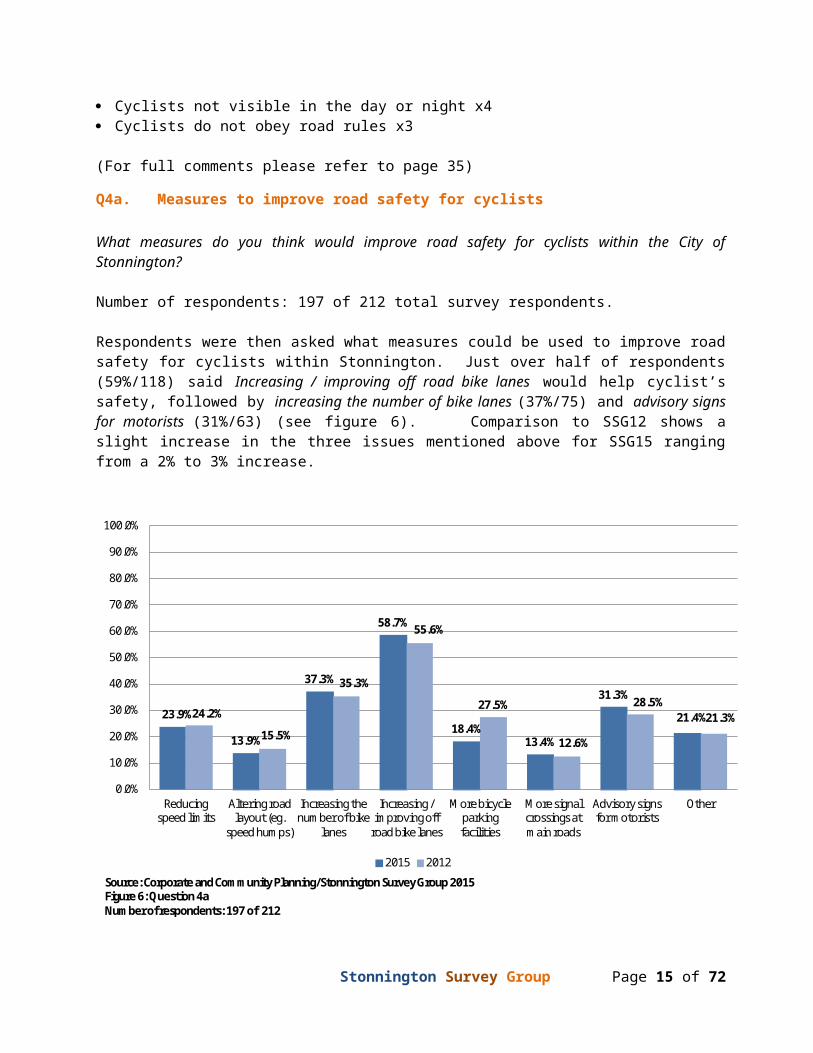
Q4a. Measures to improve road safety for cyclists
What measures do you think would improve road safety for cyclists within the City of Stonnington?
Number of respondents: 197 of 212 total survey respondents.
Respondents were then asked what measures could be used to improve road safety for cyclists within Stonnington. Just over half of respondents (59%/118) said Increasing / improving off road bike lanes would help cyclist’s safety, followed by increasing the number of bike lanes (37%/75) and advisory signs for motorists (31%/63) (see figure 6). Comparison to SSG12 shows a slight increase in the three issues mentioned above for SSG15 ranging from a 2% to 3% increase.
23.9%
13.9%
37.3%
58.7%
18.4%13.4%
31.3%
21.4%24.2%
15.5%
35.3%
55.6%
27.5%
12.6%
28.5%21.3%
0.0%
10.0%
20.0%
30.0%
40.0%
50.0%
60.0%
70.0%
80.0%
90.0%
100.0%
Reducing speed limits
Altering road layout (eg.
speed humps)
Increasing the number of bike
lanes
Increasing / improving off
road bike lanes
More bicycle parking facilities
More signal crossings at main roads
Advisory signs for motorists
Other
2015 2012
Source: Corporate and Community Planning/Stonnington Survey Group 2015Figure 6: Question 4aNumber of respondents: 197 of 212
Note: These percentages will not add up to 100% because respondents were allowed to choose multiple responses.
Summary responses to other:
Cyclists awareness x4 Cyclists need to be visible x3 Cyclists education x2
(For full comments please refer to page 35)
Stonnington Survey Group Page 12 of 61

Q4b. Ride a bike
Do you ride a bike?
Number of respondents: 193 of 212 total survey respondents.
Respondents were then asked if they ride a bike, just over one third (35%/67) of respondents ride bikes (see figure 7).
34.7%
65.3%
Yes NoSource: Corporate and Community Planning/Stonnington Survey Group 2015Figure 7: Question 4bNumber of respondents: 193 of 212
Stonnington Survey Group Page 13 of 61

Q4c. Cyclists safety in riding a bike in local area
As a cyclist, I feel safe riding a bike in my local area in terms of the surrounding traffic?
Number of respondents: 67 of 212 total survey respondents.
Respondents who ride bikes were asked if they feel safe in their local area in terms of the surrounding traffic. Slightly over half of cyclist respondent’s 54%/36 do not feel safe riding in their local streets (see figure 7).
7.5%
17.9% 20.9%
35.8%
17.9%
0.0%
0.0%
10.0%
20.0%
30.0%
40.0%
50.0%
60.0%
70.0%
80.0%
90.0%
100.0%
Strongly Agree Agree Neutral Disagree Strongly Disagree No Answer Supplied
Source: Corporate and Community Planning/Stonnington Survey Group 2015Figure 7: Question 4cNumber of respondents: 67 of 212
Stonnington Survey Group Page 14 of 61
Q5. Pedestrian Safety
To what extent do you agree or disagree with the following statements?
Number of respondents: 201 of 212 total survey respondents.
The majority of respondents (82%/161) said they ether a strongly agree (23%/45) or agree (49%/116) with feeling safe using a pedestrian crossings to cross main roads in strip shopping centres (see figure 8). A high percentage of respondents 41%/104 said they ether disagree or strongly disagree with feeling safe crossing main roads in strip shopping centres without using a pedestrian crossing.
18.2%
17.8%
23.0%
6.7%
59.1%
58.9%
59.2%
30.8%
11.1%
10.7%
6.6%
21.0%
9.1%
10.2%
10.2%
32.3%
2.5%
2.5%
1.0%
9.2%
0.0% 20.0% 40.0% 60.0% 80.0% 100.0%
As a pedestrian, I feel safe crossing local residential streets
As a pedestrian, I feel safe walking in my local area in terms of the surrounding traffic
As a pedestrian, I feel safe using pedestrian crossings to cross main roads in strip shopping centres
As a pedestrian, I feel safe crossing main roads in strip shopping centres without using a pedestrian crossing
Strongly Agree Agree Neutral Disagree Strongly Disagree
Source: Corporate and Community Planning/Stonnington Survey Group 2015Figure 8: Question 5Number of respondents: 201 of 212
Stonnington Survey Group Page 15 of 61

Q6. Respondent street type
Which best describes the street in which you live:
Number of respondents: 197 of 212 total survey respondents.
The majority of respondents live on a local street (84%/166) (see figure 9).
16.2%
83.8%
Main Road Local StreetSource: Corporate and Community Planning/Stonnington Survey Group 2015Figure 9: Question 6Number of respondents: 197 of 212
Stonnington Survey Group Page 16 of 61

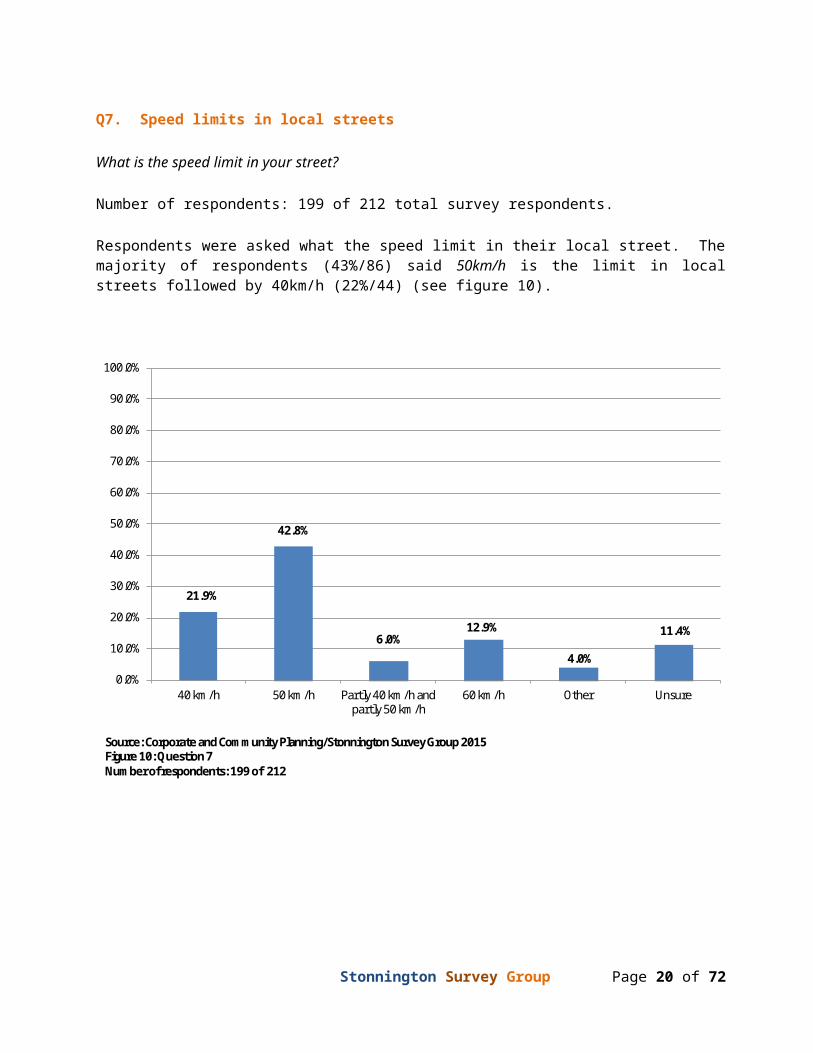
Q7. Speed limits in local streets
What is the speed limit in your street?
Number of respondents: 199 of 212 total survey respondents.
Respondents were asked what the speed limit in their local street. The majority of respondents (43%/86) said 50km/h is the limit in local streets followed by 40km/h (22%/44) (see figure 10).
21.9%
42.8%
6.0%12.9%
4.0%
11.4%
0.0%
10.0%
20.0%
30.0%
40.0%
50.0%
60.0%
70.0%
80.0%
90.0%
100.0%
40 km/h 50 km/h Partly 40 km/h and partly 50 km/h
60 km/h Other Unsure
Source: Corporate and Community Planning/Stonnington Survey Group 2015Figure 10: Question 7Number of respondents: 199 of 212
Stonnington Survey Group Page 17 of 61

Q8. Safe speed limit
Do you consider the speed nominated in Q7 to be a safe speed limit for road users?
Number of respondents: 193 of 212 total survey respondents.
Respondents were asked if the speed they nominated in Q7 to be a safe speed limit for road users. The majority of respondents who nominated partly 40 km/h and partly 50 km/h (92%/11) said it was a safe speed followed by 40km/h (84%/37) and 50km/h (57%/49) (see figure 11). A high percentage of respondents who nominated 50km/h (43%/37) said it was unsafe.
84.1%
57.0%
91.7%
73.1%63.2%
15.9%
43.0%
8.3%
26.9%
36.8%
0.0%
10.0%
20.0%
30.0%
40.0%
50.0%
60.0%
70.0%
80.0%
90.0%
100.0%
40 km/h 50 km/h Partly 40 km/h and partly 50 km/h
60 km/h Unsure
Yes NoSource: Corporate and Community Planning/Stonnington Survey Group 2015Figure 11: Question 8Number of respondents: 193 of 212
Stonnington Survey Group Page 18 of 61

Q9. What respondents consider a safe speed limit
What do you believe would be a safe speed limit for your street?
Number of respondents: 63 of 212 total survey respondents.
Respondents were then asked what they think the speed limit should be for all local streets. Just over half of respondents (57%/36) indicated that it should be 40km/h followed by 50km/h (31%/20).
31.7%
57.1%
6.3% 1.6%0.0% 3.2%
0.0%
10.0%
20.0%
30.0%
40.0%
50.0%
60.0%
70.0%
80.0%
90.0%
100.0%
Less than 40 km/h 40 km/h 50 km/h 60 km/h Other Unsure
Source: Corporate and Community Planning/Stonnington Survey Group 2015Figure 12: Question 9Number of respondents: 63 of 212
Stonnington Survey Group Page 19 of 61
Q11. Motor vehicle
Do you drive a motor vehicle?
Number of respondents: 197 of 212 total survey respondents.
The majority of respondents drive a motor vehicle (86%/172) (see figure 13).
85.6%
12.4%
Yes NoSource: Corporate and Community Planning/Stonnington Survey Group 2015Figure 12: Question 11Number of respondents: 197 of 212
Stonnington Survey Group Page 20 of 61

Q12. No speed limit signs
If a street in your suburb has no speed limit signs, what is the speed limit?
Number of respondents: 167 of 212 total survey respondents.
Respondents were asked if a street in your suburb has no speed limit signs, what the speed limit is. The majority of respondents (73%/121) said 50km/h is the limit in local streets followed by 60km/h (13%/22) (see figure 14). Comparison to 2012 results shows an increase for 50km/h from 67%/133 to 72%/121 for 2015.
6.0%
72.5%
13.2%5.4% 3.0%
10.2%
67.5%
13.2%6.1% 3.0%
0.0%
10.0%
20.0%
30.0%
40.0%
50.0%
60.0%
70.0%
80.0%
90.0%
100.0%
40 km/h 50 km/h 60 km/h Unsure Other2015 2012
Source: Corporate and Community Planning/Stonnington Survey Group 2015Figure 13: Question 12Number of respondents: 167 of 212
Stonnington Survey Group Page 21 of 61

Q13. Speed limit near schools
What is the speed limit most likely to be near schools during drop off and pick up times?
Number of respondents: 171 of 212 total survey respondents.
The majority of respondents (99%/169) said the speed limit most likely to be near schools during drop off and pick up times is 40km/h (see figure 15). Comparison to 2012 results shows an increase for 50km/h from 94%/184 to 99%/169 for 2015.
98.8%
0.0% 0.0% 0.6% 0.6%
93.9%
1.5% 0.5% 2.0% 2.0%
0.0%
10.0%
20.0%
30.0%
40.0%
50.0%
60.0%
70.0%
80.0%
90.0%
100.0%
40 km/h 50 km/h 60 km/h Unsure Other
Source: Corporate and Community Planning/Stonnington Survey Group 2015Figure 15: Question 13Number of respondents: 171 of 212
Stonnington Survey Group Page 22 of 61

Q14. Confusion with frequent changes in the speed limits
To what extent (if any) do you find frequent changes in the speed limit confusing?
Number of respondents: 172 of 212 total survey respondents.
The majority of respondents are ether extremely confused (27%) or quite confused (22%) with the frequent changes in the speed limits (see figure 16). Comparison to 2012 results shows a small increase for extremely confused from 23%/45 to 27%/46 for 2015.
26.7%
20.9% 22.1% 19.8%
10.5%
23.2% 23.7% 22.2%17.5%
13.4%
0.0%
10.0%
20.0%
30.0%
40.0%
50.0%
60.0%
70.0%
80.0%
90.0%
100.0%
Extremely confusing Very confusing Quite confusing Just a little confusing Not confusing at all
Source: Corporate and Community Planning/Stonnington Survey Group 2015Figure 15: Question 14Number of respondents: 172 of 212
Stonnington Survey Group Page 23 of 61

Q15. Speeds which respondents generally drive in local streets
For each of the following statements, please indicate which best describes the speed at which you generally drive in local streets:
Number of respondents: 172 of 212 total survey respondents.
Respondents were asked what best describes the speed at which they generally drive in local streets. The majority of respondent’s ether always (52%/88) or most of the time (47%/80) drive within the speed limit (see figure 17). A number of respondents (17%/24) drive over the speed limit by less than 5 kilometres per hour (km/h).
51.8%
3.5%
47.1%
4.3%
1.2%
17.0%
2.9%
57.4%
30.4%
17.7%
66.7%
0.0% 20.0% 40.0% 60.0% 80.0% 100.0%
I drive within the speed limit.
I drive over the speed limit by less than 5 kilometres per hour (km/h).
I drive over the speed limit by more than 5 km/h.
Always Most of the Time Often Rarely NeverSource: Corporate and Community Planning/Stonnington Survey Group 2015Figure 17: Question 15Number of respondents: 172 of 212
Stonnington Survey Group Page 24 of 61

Q16. General speed limit in all local streets
Do you believe the speed limit should be the same in all local streets (not including main roads) within the City of Stonnington?
Number of respondents: 171 of 212 total survey respondents.
When respondents were asked if they believe the speed limit should be the same in all local streets (not including main roads) within the City of Stonnington the majority said yes (70%/120) (see figure 18).
70.2%
21.6%
8.2%
Yes No UnsureSource: Corporate and Community Planning/Stonnington Survey Group 2015Figure 17: Question 16Number of respondents: 171 of 212
Stonnington Survey Group Page 25 of 61

Q17. What speed limits should be in local streets
What do you believe the speed limit should be for all local streets?
Number of respondents: 132 of 212 total survey respondents.
A small majority of respondents believe the speed limit should be 50km/h (43%/57) followed closely by 40km/h (40%/52) (see figure 19).
6.1%
39.4% 43.2%
7.6% 3.8%
0.0%
10.0%
20.0%
30.0%
40.0%
50.0%
60.0%
70.0%
80.0%
90.0%
100.0%
Less than 40km/h 40 km/h 50 km/h 60 km/h Unsure
Source: Corporate and Community Planning/Stonnington Survey Group 2015Figure 18: Question 17Number of respondents: 132 of 212
Stonnington Survey Group Page 26 of 61

Q18. Driving after consuming alcohol
In the past twelve months, how often have you driven after consuming alcohol?
Number of respondents: 171 of 212 total survey respondents.
Respondents were asked how often they have driven after consuming alcohol, in the past twelve months. The majority of respondents indicated they never drink and drive with 40%/68 followed by rarely 36%/62 and sometimes 22%/37 (figure 19). Comparison to 2012 results shows small decrease for respondents sometimes driving after consuming alcohol from 28%/54 to 22%/37 for 2015.
39.8% 36.3%
21.6%
2.3%
39.8%
29.3% 28.3%
2.6%0.0%
10.0%
20.0%
30.0%
40.0%
50.0%
60.0%
70.0%
80.0%
90.0%
100.0%
Never Rarely Sometimes Frequently2015 2012
Source: Corporate and Community Planning/Stonnington Survey Group 2015Figure 19: Question 18Number of respondents: 171 of 212
Stonnington Survey Group Page 27 of 61

Q19. Attitude towards drinking and driving
Which of the following statements best describes your attitude to drinking and driving:
Number of respondents: 168 of 212 total survey respondents.
Respondents were then asked what their attitude is towards drinking and driving. The majority of respondents said if I am driving, I restrict how much alcohol I drink to make sure that I am under the limit (70%/117) followed by if I am driving, I never drink alcohol (29%/49) (see figure 20). Comparison to 2012 results shows small decrease for respondents never drinking and driving from 33%/61 to 29%/49 for 2015.
29.2%
69.6%
1.2% 0.0%
32.6%
67.4%
0.0% 0.0%0.0%
10.0%
20.0%
30.0%
40.0%
50.0%
60.0%
70.0%
80.0%
90.0%
100.0%
If I am driving, I never drink alcohol.
If I am driving, I restrict how much alcohol I drink to
make sure that I am under the limit.
If I am driving, I restrict how much alcohol I drink but
don’t worry too much about staying under the limit.
If I am driving, I do not restrict what or how much I
drink.
2015 2012
Source: Corporate and Community Planning/Stonnington Survey Group 2015Figure 20: Question 19Number of respondents: 168 of 212
Stonnington Survey Group Page 28 of 61

Q20. Over the legal limit
Over the past twelve months, how often would you have considered yourself to be near or over the legal limit, but have driven anyway?
Number of respondents: 171 of 212 total survey respondents.
Respondents were asked over the past twelve months, how often would they have considered them self’s to be near or over the legal limit, but have driven anyway. The majority of respondents (86%/147) said they never drove (see figure 21). Comparison to 2012 results shows a small increase in people never driving from 82%/153 in 2012 to 86%/147 in 2015.
86.0%
11.7%
2.3% 0.0% 0.0%
82.3%
15.1%
2.2% 0.5% 0.0%
0.0%
10.0%
20.0%
30.0%
40.0%
50.0%
60.0%
70.0%
80.0%
90.0%
100.0%
Never Rarely Sometimes Frequently Always2015 2012
Source: Corporate and Community Planning/Stonnington Survey Group 2015Figure 21: Question 20Number of respondents: 171 of 212
Stonnington Survey Group Page 29 of 61

Q21. Consumed alcohol in a premises other than respondents home how often they drive
During the past twelve months, if you consumed alcohol in a premise other than your home and thought that you were under the limit, how often did you drive?
Number of respondents: 168 of 212 total survey respondents.
Respondents were asked over the past twelve months, if they consumed alcohol in a premise other than their home and thought that you were under the limit, how often they drove. The majority of respondents (36%/61) said they never drove followed by rarely (27%/45) (see figure 22). Comparison to 2012 results shows a decrease in people always driving from 16%/28 in 2012 to 9%/15 in 2015.
36.3%
26.8%
16.1%11.9%
8.9%
37.2%
13.3%18.9% 15.0% 15.6%
0.0%
10.0%
20.0%
30.0%
40.0%
50.0%
60.0%
70.0%
80.0%
90.0%
100.0%
Never Rarely Sometimes Frequently Always2015 2012
Source: Corporate and Community Planning/Stonnington Survey Group 2015Figure 22: Question 21Number of respondents: 168 of 212
Stonnington Survey Group Page 30 of 61

Q22. Consumed alcohol in premises other than respondents home how did they leave the premises
In the past twelve months, if you consumed alcohol in premises other than your home and thought that you were near or over the limit, how did you leave the premises?
Number of respondents: 172 of 212 total survey respondents.
Respondents were then asked how they left the premises after thinking they were near or over the limit. Most respondents arranged a lift with someone else (29%/50) followed by taxi (27%/46) and took public transport (26%/46) (see figure 23).
2.3%
23.8%29.1% 25.6% 26.7%
22.1% 21.5%
4.8%
16.4% 18.4%22.7%
28.5%24.2%
14.5%
0.0%
10.0%
20.0%
30.0%
40.0%
50.0%
60.0%
70.0%
80.0%
90.0%
100.0%
Drove my vehicle
Arranged for someone else
to drive my vehicle
Arranged a lift with someone
else
Took public transport
Took a taxi Walked Other
Source: Corporate and Community Planning/Stonnington Survey Group 2015Figure 23: Question 22Number of respondents: 172 of 212
Summary responses to other:
I do not drink alcohol x11 Not applicable x5
(For full comments please refer to page 35)
Stonnington Survey Group Page 31 of 61

Q23. Drinking arrangements
In the last twelve months, if you knew that you would be going out and at some stage would be over the limit, how often did you make arrangements so that you would not be drinking and driving?
Number of respondents: 172 of 212 total survey respondents.
When respondents were asked how often they made arrangements so that you would not be drinking and driving, the majority always made arrangements (75%/85) (see figure 24).
10.6%
0.9%3.5%
9.7%
75.2%
Never Rarely Sometimes Frequently AlwaysSource: Corporate and Community Planning/Stonnington Survey Group 2015Figure 24: Question 23Number of respondents: 172 of 212
Stonnington Survey Group Page 32 of 61

Q24. Type of arrangements made
What arrangements did you make?
Number of respondents: 101 of 212 total survey respondents.
Respondents who did make arrangements so they would not be drinking and driving were asked what arrangements they made. A small majority of respondents took public transport (58%/59) followed closely by taxi (51%/52) and arranged someone else to drive (46%/47) (see figure 25).
Drove my vehicle
Arranged for someone else to drive my
vehicle
Arranged a lift with someone
else
Took public transport
Took a taxi Walked Other0.0%
10.0%
20.0%
30.0%
40.0%
50.0%
60.0%
70.0%
80.0%
90.0%
100.0%
0.0%
24.8%
46.5%
58.4%
51.5%
33.7%
5.9%
Source: Corporate and Community Planning/Stonnington Survey Group 2015Figure 25: Question 24Number of respondents: 101 of 212
Stonnington Survey Group Page 33 of 61

3. Appendix: Full responses to open-ended questions1b. What do you believe are the main road safety concerns for pedestrians within City of Stonnington?
Other:
Bicycle riders who do not use their bells
All small streets would benefit if they were one way traffic
Bicycle riders
Bicycle riders and skate boarding on roads, bicycle lanes and footpaths.
Bicycles
Builders vehicles and construction mess, Overcrowded tram stops, South yarr station
Cars & bikes not stopping for tram
Bars cutting corners
Cars turning out of Cabrini
Cars using laneways as rabbit runs
Commercial waste collection vehicle and trucks roaming in residential streets, drivers ignore the local traffic law which supposes to protect residential streets.
Cyclists - worst of all
Cyclists apparently subject to no control so no laws
Cyclists going through pedestrian crossings
Cyclists on footpaths
Cyclists riding on footpaths and they are over 12!!!
Cyclists riding on the footpath and across pedestrian crossings and paths in parks
Distracted drivers
Don't believe this is an issue
Drivers going through red lights. ie. Toorak rd. (Sth Yarra). Crossing near the Post office.
Stonnington Survey Group Page 34 of 61

Drivers running red lights frequently. Lights at Park St Prahran, outside BP station. I have Multiple Sclerosis, walk slowly with walker.
Drivers running red lights, especially at pedestrian crossings.
Drivers who do not obey laws
Given I'm not concerned the above are irrelevant
Is Kings Way in Stonnington - a pedestrian overpass is desp needed
None
Obstruction of view from high fences, overgrown vegetation, large parked vehicles
Pedestrian talking on phones
People leaving Wheelie Bins on narrow walkways forcing pedestrians to walk on the road. Anchor Place in Prahran is a CLASSIC example.
Poor traffic management around roadwork, building works and traffic diversions AND poor street design like the New roads/bike path near Kanteen on Alexandra Avenue
Rubbish on walk domains
Skateboarders not watching out for pedestrians and cyclists also.
Talking on mobiles while crossing the road and earphones cutting out input from surrounding environment
There is no street lighting on foot paths where they are shaded by tress
Too many cafes & stalls on footpaths in the main streets
Trucks and large vehicles - too many out on the road. They are dangerous for other drivers, pedestrians and cyclists and cause congestion on the roads.
When builder come in with their vehicles they make mess + cause obstruction.
Stonnington Survey Group Page 35 of 61

2. What measures do you think would improve road safety for pedestrians within City of Stonnington?
Other:
Advertising Campaign for drivers to give way to pedestrians
Advisory signs for pedestrians
Awareness programmed
Better traffic management around roadwork, building works and traffic diversions AND better road/bike path designs - NOT like the dangerously designed New road/bike path near Kanteen on Alexandra Avenue
Campaign re crossing the street. Awareness for early morning tradies seeing red lights on Toorak rd.
Cannot answer 29a thereby cannot proceed to complete survey
Cautious pedestrians
Common sense
Cyclists off footpaths and monitor furniture on footpaths
Don't think that Pedestrians have a problem
Driver education
Enforcement of laws beyond speeding laws
Enforcement of pedestrian awareness (eg. electronic absorption, earphones etc)
Fines
Footpath fence either side of established crossing in day glow colour
I am a pedestrian most of the time and I don’t really see a concern with any of the above
I think almost everything is in place - pedestrian and driver awareness seem to be my concern
Inattention/ distractibility
Keep cyclists off footpaths and pedestrian crossings
Stonnington Survey Group Page 36 of 61

year minimum.
Median lines into/out of car parks
Monitoring illegally parked trucks and cars
More red light cameras on pedestrian crossings where red lights are repeatedly jioned
More red-light cameras - many vehicles run red-lights, particularly at the South Yarra train station pedestrian crossing.
More rubbish bins provided
Need extend hours for goods loading area, need traffic management and waste collection and goods loading management for Hawksburn Village shopping area, in Sams Way/May Road area. Council local law restriction needs to be enforced.
Not allowing skateboarders on roads
Partial rail (tram only) in chapel st
Pedestrians using pedestrian crossings would help.
Pedestrians need to take responsibility for themselves. There are already too many sign + driver restrictions.
Pedestrian attitudes in ignoring common sense and road rules
Pedestrian awareness
Pedestrian awareness of correct road usage
Pedestrian Education
pedestrian education/signs
Pedestrians and drivers need to change their behavior- cluttering up the road won’t improve the situation. Education may
Pedestrians and motorists being more aware and co-operative
Pedestrians knowledge to cross at correct crossings not crossing roads with no lights
Policing speed limits - so many cars travel through shopping centers above 40 km, particularly at afternoon clearway times. Lights on pedestrian crossings taking too long to change - pedestrians get sick of waiting and cross nearby
Prosecutions for Jay Walking
Stonnington Survey Group Page 37 of 61

Prosecute pedestrians disobeying the rules/lights etc.
Publicity campaign to alert motorists to pedestrians.
Reduce sign pollution
Remove cyclists from footpaths and paths in parks
Restricting large vehicles from parking on corners, enforcing vegetation removal from cut off corners
Ruthless police action for inconsiderate motorists
Signs of where builders/trades can park
Simplify complex areas
Stop People leaving Wheelie Bins on narrow walkways forcing pedestrians to walk on the road. Anchor Place in Prahran is a CLASSIC example.
Taking actions against pedestrians who ignore pedestrian crossings in close proximity
3b. What do you believe are the main road safety concerns for cyclists within the City of Stonnington?
Other:
1. Lack of safety vest on all bike riders. 2. Wearing dark clothes and/or dark helmet should be an offence. 3. Require use of bell when passing.
Behavior above 7 CROSSING AGAINSTS LIGHTS
Better lights on bikes, High visibility vests and bike bells all needed
Bluestone road edge west of Tooronga Rd
Cars and bikes should not share same roads -eg Bordeaux France
Cars/trucks parked in clearways during peak
Chapel St is too narrow for cyclists. Send them along Hornby St (one way traffic)
Cycle on foot paths
Cyclist need to use the cycle path instead of main road. e.g. cyclist use cyclist path along Yarra river instead of using Alexsandra Ave to compete and slow down the cars.
Stonnington Survey Group Page 38 of 61

Cyclists attitudes & visibility
Cyclists ignoring road behavior. Riding two abreast, hell rides etc. Cyclists have bike/walk paths to use.
Cyclists should be aware of courtesy and their responsibility and vulnerability.
Cyclists using footpaths and not the cycle lane provided
Cyclists weaving between cars stopped at lights and not adhering to stop signs. Also, multiple cyclists riding abreast on single lane roads
Driver aggression
Extra signs CONFUSE
Insufficient lane space & car adherence
Insufficient lighting on bikes/riders
Insufficient publicity about dangers to cyclists by motorists
Many cyclists have no lights on their bikes at twilight and in the dark. They don't seem to realise they can't be seen.
narrow roads with lots of parked cars
Narrow roads, too few bikes, meaning that drivers do not have an inbuilt safety attitude.
Narrow streets with parking, trams, cars, and cyclists, particularly when there are a number of cyclists together. Chapel St between Alex. Ave and Toorak Rd can have 7-8 cyclists coming down on your left and if you want to turn left this can cause nervous
Narrowness of on-road bike paths lack of
Nobody wants to hit a cyclist with a car, or car door. But they are so hard to see and they don't ride in a way that acknowledges this.
Not a cyclist. Cannot think like they do.
One solution. Mandate all cyclists to wear yellow vest when riding on roads
Pedestrians
Poor roads especially at edge of roads where cyclists are forced to ride
Some dedicated bike paths are too narrow or uneven or poorly designed and/or on shared paths there is sometimes insufficient space/layout or signage to encourage correct pedestrian behavior/useage.
Stonnington Survey Group Page 39 of 61

speed of cyclists
Speeding cyclists
SPEEDING CYCLISTS ON SHARED PARTHS
Take away parking in Chapel St
Visibility of cyclists themselves
When there are cycle paths they often have gratings, potholes, cobblestones which require detouring outside the lane.
Wish bikes were on the bike paths not on roads. Also not on main roads during peak times
4a. What measures do you think would improve road safety for cyclists within the City of Stonnington? (Please select as many as apply)
Other:
Advertising to raise awareness, not more regulations.
Advisory signs for cyclists and cyclist education
Better education of motorists - that it is not acceptable to look at a cyclist and think he/she doesn't matter, I'll just pull out anyway
Bike lanes which disappear suddenly without warning are hazardous
Bikes cars should be separated
Cars are just too close to bikes when overtaking. They are also too impatient to wait until a suitable width of road occurs to overtake.
Cyclist awareness of their responsibility caution and vulnerability.
Cyclist being more aware and not breaking the law
Cyclist education
Cyclist education/signs
Cyclist seems to go through red lights for too often.
Cyclist to wear high contrast clothing
Cyclist training for road use
Stonnington Survey Group Page 40 of 61

Cyclists clearly lighted both front and back with fines for observing same.
Cyclists have to take responsibility for their own actions
Cyclists should be responsible, obey laws and get BELLS!!
Cyclists should not be on main roads. Not good for them or motorists. Unsafe.
Dedicated bike paths need upgrading so sufficiently wide and clearer instructions / signage for pedestrians use of shared paths
Do not wear black
Don't think this is a an issue
Driver and cyclist education
Drivers and cyclists respect each other’s space.
Educate bicycle riders and car drivers
Educate Cyclists to obey road rules and fine them if they don't. You might want to start with the pedestrian crossing in Chapel Street near Prahran Town Hall. Cyclists frequently speed through the red light when pedestrians are attempting to cross.
Encouraging motorists to back in and drive out frontwards
Enforcement of road rules for cyclists and real penalties for cyclists who do not comply
Ensure cyclists follow road rules and wear orange jackets
I heard of a green flour light cyclists can use to notify drivers of they are coming
Improved awareness of cyclists and drivers of road rules and common sense
Improved expectations of bike rider behavior
Keep clearways clear
Laws that require motorists to check for cyclists before opening doors
Make bicycles to be registered
Manners
More responsibility and awareness of traffic and pedestrians by cyclists
Obeying road rules ie. red lights
Stonnington Survey Group Page 41 of 61

Police action
policing of existing speed limits
Provide stickers re 'dooring'
Punitive action for thoughtless motorists
Requiring cyclists to be registered
Road sharing and awareness
Mandate for all cyclists to wear yellow vests when riding on roads.
SLOW CYCLISTS DOWN ON SHARED WALKING PARTHS
Widen bike path on Chapel St
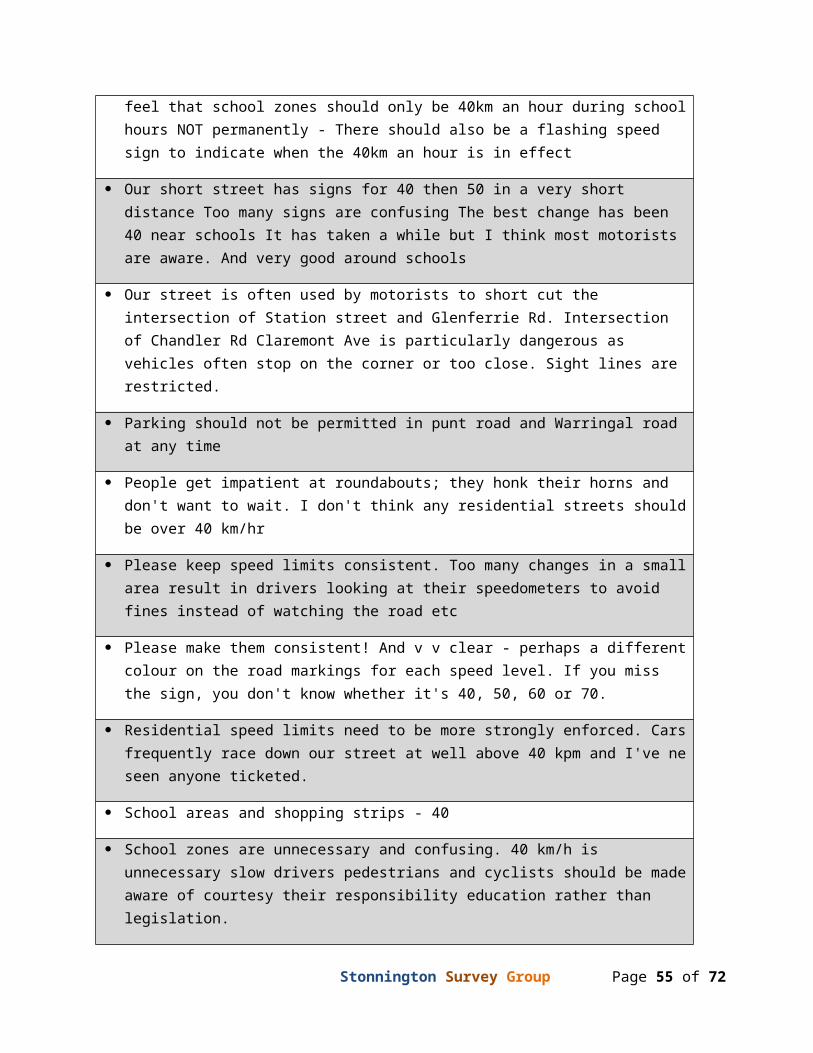
10. Do you have any additional comments regarding speed limits in local residential streets within City of Stonnington?
50 IS SAFE FOR A CAR THAT CAN STOP ON 30 METERS ITS NOT SAFE FOR I BIKE THAT TAKES 60 METERS TO STOP BIKE PATHS SHARED WITH PEDESTRIANS - i HAVE SEEN A BIKE PASS A PEDESTRIAN WITHIN 3 INCHES AT 50 kph. I KNOW HOSPITALS ARE GETTING INJURED PEDESTRIANS FROM BIKES
50 km is an appropriate limit. I feel unsafe crossing in my street because some drivers don't observe the 50 km limit the street is a long, straight street.
Ailsa avenue - Cars speeding to cut through to Malvern Road
All 40 k/h speed signs should be lit up (LED lights).
All seem O.K.
All streets with 40K zones should be signed - our street, Chatsworth Road has no signage to the effect that the speed limit is 40
Any slower than 60 and we may as well get out and walk
As a motorist turning from a side street into a main road the maximum speed is an unknown (sometimes down to 40kph or even to 60kph). I suggest that at major intersections especially the SPEED required is PAINTED onto the ROAD - not a sign on a post amongst many other signs, poles, trees etc for a motorist to try to guess
Stonnington Survey Group Page 42 of 61
3984 3507

what speed is now in operation.
Being a NON driver, speed limits are not relevant to me as a pedestrian, so I am unable to give an opinion on this question
Better speed limit signs.
Bike riders should not ride on foot paths you cannot see them when driving out of driveway as they speed. Motorists speed along Chadstone rd and Waverly rd. Also traffic build up in Chadstone Rd.
Cars come speeding down Airlie Avenue just having a look at the houses and area. The locals drive very slowly.
Cars need to slow down when turning onto Yarra street from Toorak road and vice versa
Cars often come at fast speed down Rockley Rd, for example, from north to Toorak Rd. You have to stand in front of cars parked along the kerbed and peek to see what is coming. OK for most adults, not so good for the elderly or for children
Cars speed down our Grove, the Council has taken a survey a few years ago and didn't see a need to install speed humps, which have been installed in surrounding streets. We also have a kindergarten off a lane in our Grove and 2 churches utilise our Grove for congregation parking all weekend. We reside on the lower side and leaving our driveway is tremendously hard to navigate with cars travelling a great speed.
Cars use the streets close to Chapel Street to escape the delays with the traffic. Consequently they speed down these streets happy to be away from the queues of traffic. These cars are making our roads dangerous.
Council undertook traffic monitoring in my street. Average speed was 55km even though speed limit is 50km. Was advised by Council that this did not warrant any changes to street by way of humps/roundabouts or speed limit.
Council/Police could enforce the speed limits in shopping precincts and local streets.
Cyclists are often travelling too fast for their own safety. Skateboarders should NOT be allowed to use bike lanes.
Despite most local streets in my area having speed bumps and/or restrictions slowing traffic the street where I live has nothing, and there is a fair volume of traffic using this street with some excessive speed being used
Do not reduce limits any further. Do not create a mish-mash of differing speed limits on a single road
Stonnington Survey Group Page 43 of 61

Drivers should be made more aware that the posted limit is the MAXIMUM safe speed and lower speeds may be required depending upon the conditions eg weather, many pedestrians or cyclists.
Due to the pressure on local infrastructure and lack of off street parking due to apartment development, and lack of addressing the rail issue at Kooyong - clearly lowering speed limits will ensure safety but frustrate the already frustrated motorists due to traffic congestion. Around the corner of Toorak and Glenferrie Roads in the afternoons even quite early this can be gridlocked!
Edgar Street Glen Iris is a 'rat run' particularly during rush hours and weekends. The speed limit needs to be 30 in vicinity of the pool complex and 40 for the rest of the street.
Finch Street Glen Iris needs reduced speed limit because it is used as a thoroughfare and is narrow. More cars are now needing to/choosing to park in the street.
Further decreasing speed limits will cause more frustration for motorists and pedestrians and not improve safety.
Hard to know the speed limit in streets you rarely drive do
Hones using the side streets between Williams and Chapel remain a speed issue... need things to slow them down.
I believe they are correct for traffic flow.
I drive according to what feels safe in a particular street, depending on parked cars, etc., rather than thinking 'the speed limit is 50kmh therefore I will drive at 50kmh. Where there are parked cars on both sides of a narrow street I often find myself going 30-40 kph
I have 3 young children. Where we live on Malvern Road we are around a bend on on a hill. You can't see a car coming until it is rather close. When a car is doing 60km per hour, by the time you see the car it may be unable to stop in time. My children are not permitted to cross the road outside our house with my supervision. We only ride our bikes on the bike track along the creek, not the bike lanes in traffic, as I feel that are unsafe. I have personally witnessed cars who where speeding outside our house along Malvern road, that went on to smash into residents reversing out of their drive way further down the hill. You don't see them coming till it is too late. if you cross Malvern road between burke and High, you have to do it really fast. One second it is clear the next it is not -a car is coming down fast.
I live in a cup-de-sac which is very safe. The streets around me appear to be safe, except for Dandenong Rd.
Stonnington Survey Group Page 44 of 61

I live in leopold street near the corner of Tooronga rd on one side and high street on the other. People are always speeding and treating our street as a two ways when it is only a one way street
I see so many cars speed and in my street Monaro Rd Kooyong, i have seen cars get up to 80km as the road goes from Toorak Rd to Glenferrie rd have asked for ' no right turn 'from Toorak rd into Monaro rd from 7-9 as the amount of cars using the street to get to Glenferrie Rd is unbelievable and the speed is so fast and the cars run the red lights at the Kooyong shops and i have seen on 2 occasions where cars run the lights and almost knock over pedestrians about the walk as the light has turned red.. but the council told me to contact VicRoads and I did and they refuse to limit the number of cars using the street as a way to get to Glenferrie rd so one day someone will be killed from this risk
I think 40-50 Kms an hour low enough
I think consideration needs to be given in relation to changing speed limits everywhere without visibility of signs. i.e. if you turn out of Albany Rd into Malvern Rd during school hours there is no sign to indicate 40kph. Also there are some local streets that are constantly 40 and others 50. It is difficult to keep watching for changing sign speed limits. Please do not lower speed limits anymore.
I think so many motorists speed at about 5/10km/h above the 60 km/h limit, so maybe reduce all speeds and the safety of others. (except for Dandenong Road of course)
I think that through traffic often exceeds the 50 kph limit
I think they should all be 30km/h in local streets
I want to congratulate Stonnington Council on installing speed humps TODAY in Aintree Rd. Glen Iris. I regularly use this street & notice people speeding down this street (& MANY other local side streets in our area). Particularly, drivers appear distracted as they speed down these streets which are quite narrow for two cars to pass due to parked cars on both sides. It feels VERY dangerous.
It is like cars are more important than people. 150 yr old streets were not made for speeding cars.
It seems to work well, there is a school which is clearly marked and the speed limit reduces in school hours.
keep within speed limits
Local streets not a problem. Speeding in main roads is.
many cars drive faster as they use our street as a short cut
many motorists ignore the 50k limit in our street - very dangerous considering cars
Stonnington Survey Group Page 45 of 61

parked on both sides of road.
Many motorists ignore the limits already in place. There should be more random speed cameras in residential streets.
May road in Toorak need to reduce speed to 40, commercial waste collection, restaurant staff and delivery trucks often speed in May Rd and turn into Sams Way when they are running late or in a hurry. Sa they need to turn from May Rd to Sams Way driver will hit the air brake many times, it is unbearable to the resident.
Mckinley Ave is used as a through road to Dandenong road and as a result there is always speeding traffic
Mine is a one way street and most times there is no speeding.
More control over to ensure cars observe speed limit
More policing of speeding cars etc.
More visual appearance of police, ensuring drivers obeys the road rules.
Mostly I find that the traffic in main roads where I live is at walking pace or stopped due to railway crossings and pedestrian lights. The cycling lanes marked on streets are very dangerous for everyone. Cyclists should be on special paths away from cars. Have a look at what they do in Germany
Motorists generally exceed the safe speed limit in my street because it is a cut through to get their kids to school in the morning rush hours. Mostly mums stressed out and making things unsafe for others. Cyclists need to share the road. Dedicated bike lanes give cyclists an unreasonable sense of ownership of the lane and generally are arrogant about lane ownership. Cycle lanes between parked cars and the curb are unsafe for everyone as cyclists have nowhere to go if a door is suddenly opened by a car passenger.
My street is used as a short cut between 2 Main roads by a lot of traffic. Since drivers are 'saving time' by avoiding a major intersection they speed in my street. It's not really the speed limit that's the problem but the speed traffic moves at.
No speed humps. Noisy
Off peak speed enforcement is just a revenue stream for government
One cannot make every road a 40km an hour speed limit - I also feel that school zones should only be 40km an hour during school hours NOT permanently - There should also be a flashing speed sign to indicate when the 40km an hour is in effect
Our short street has signs for 40 then 50 in a very short distance Too many signs are confusing The best change has been 40 near schools It has taken a while but I think
Stonnington Survey Group Page 46 of 61

most motorists are aware. And very good around schools
Our street is often used by motorists to short cut the intersection of Station street and Glenferrie Rd. Intersection of Chandler Rd Claremont Ave is particularly dangerous as vehicles often stop on the corner or too close. Sight lines are restricted.
Parking should not be permitted in punt road and Warringal road at any time
People get impatient at roundabouts; they honk their horns and don't want to wait. I don't think any residential streets should be over 40 km/hr
Please keep speed limits consistent. Too many changes in a small area result in drivers looking at their speedometers to avoid fines instead of watching the road etc
Please make them consistent! And v v clear - perhaps a different colour on the road markings for each speed level. If you miss the sign, you don't know whether it's 40, 50, 60 or 70.
Residential speed limits need to be more strongly enforced. Cars frequently race down our street at well above 40 kpm and I've ne seen anyone ticketed.
School areas and shopping strips - 40
School zones are unnecessary and confusing. 40 km/h is unnecessary slow drivers pedestrians and cyclists should be made aware of courtesy their responsibility education rather than legislation.
See previous. Too many speed changes causing confusion.
Service lanes are used as alternate routes during high traffic times. Service lanes should force drivers to the main road at regular intervals rather than providing an easy route between 2 traffic lights
Should be 50 in larger local streets and 40 or less in smaller streets, particularly if streets where children's activities occur. eg, schools, kinders, parks, sports grounds, tennis and netball courts etc.
Sign pollution. Difficult to see the important sign
Small streets ensure traffic slows. But wider roads, particularly near a primary school, need slower limits set.
Smaller roads smaller speeds
Some are too low
Some motorists disregard the speed limits.
Some streets close to main road intersections are used as 'rat runs'. Although I don't
Stonnington Survey Group Page 47 of 61

know that anything other than a police car slows people down!
Speed limiting devises need to be used - vehicles cut corners and drive around corners in the middle of a street to avoid slowing down. Also, if limiting speed device used in one street ALL adjoining streets need to be considered as it only moves issue to other streets.
Speed limits are never tested in local streets
Speed limits do not seem to affect tragic much as does congestion. Curb-side parking inhibits traffic flow, and is dangerous for cyclists. Wider footpaths, less parking along the curbs and more off street parking seems to provide for better shopping and travel, both for cars and cyclists. More use of the many tramways with more platform stops is more use than lower speed limits for providing safety.
Speed limits even on main roads are not sufficiently scrutinised or enforced, I doubt if smaller streets are ever even looked at?
Speed limits in laneways should be 20km/hr and signposted
Speed limits in local residential streets seem to be completely ignored especially by p plate drivers and young females
Speed limits in streets with traffic islands etc. should be reduced to 40km/h. eg. Armadale St. Armadale Sutherland Rd, Armadale. Furthermore, speed limits in short streets such as Fetherston St and Cambridge St Armadale should be reduced to 40km/h to prevent drivers accelerating aggressively in these streets, which carry a lot of pedestrian traffic.
Speed limits need to be policed or they are not observed by some. I often see speeding motorists, sometimes using mobile phones and there is no officer about to follow up.
Speed limits need to be reduced in local, cut through streets such as Washington & Bruce Streets in Toorak. Cars need to be discouraged from using these streets particularly as it is close to a school.
Speed limits should generally be reduced in Stonnington. Also more speed humps nee to be installed in side streets, particularly if the street leads to a main road or freeway.
Street limits are fine, the problem is that drivers do not stick to the limits. More policing and fines needed. Also, sick of seeing so many driving while talking on mobiles. Once again, we need more policing and fines.
the 40 K areas at Beech St area is very strange and not needed
Stonnington Survey Group Page 48 of 61

and 40 km within 4km of home, and all before I even drive onto a freeway!
The current limits are fine, enforcement is not. I strongly disagree with speed humps as a solution because they generate additional car acceleration and crash-bang-thump noise 24/7 for residents who are unfortunate enough to live near one.
The limits aren't the real issue. The real issue is the way some motorists ignore them.
The problem in my street is that cars entering the street from the main road cut the corner - T intersection (Grandview Gve and High St) and accelerate away quite fast. I know several speed and volume measurements have been taken over the last 12 months and I have been advised that the problem is not severe enough to warrant traffic calming measures. I still disagree. WE have an old people residence 50m from the corner and at least 4 of those people have very compromised mobility. In fact one woman is so terrified of crossing she stands on the corner yelling for assistance to cross the road. She is usually helped by a shop worker, me or a passerby. Modern big cars and utes are able to accelerate very quickly and whilst they can brake equally fast they leave little time to see a slow moving pedestrian(child, adult, bike or dog) who may be in shadows (many trees) or may unexpectedly emerging from behind parked cars.
The problem is not the speed limit but drivers who exceed it. There should be more emphasis on driving at an appropriate speed instead of bureaucratic, legalistic speed limits and other regulations. Drivers should take responsibility for their behavior and not just blindly confirm to abstract laws.
The speed limits seem appropriate already. Even though the limit is 50k in my street, it is not long enough for cars to reach this speed. They tend only to get to 30 km/h before braking for an intersection anyway. So no need to lower the speed limit.
There are a couple of hoons who speed down our street and our cat has been hit on 2 occasions as they were going too fast to avoid her. It would be the same for other animals or children. Our street is quite short and not a through road so people shouldn't go very fast.
There needs to be more frequent policing
There's no point in lowering speed limits if the limits are not enforced and therefore not observed.
They are fine however, in spite of good quality footpaths each side some pedestrians still choose to walk down the centre of the street.
They should all be 40 km/hr to avoid confusion
They should all be uniform
Stonnington Survey Group Page 49 of 61

This will be a huge problem when work starts on the Burke Street rail crossing, and through traffic will use side streets as 'rat runs'.
Too many different ones.
Too many signs. Increase it to 50 Kmh as 40 or lower is routinely ignored
Tradies vehicles in the morning around 6am are an issue. Many not observing lights at crossings- in particular Toorak rd between South Yarra Station and Punt rd.
Wide straight streets eg. Finch Street need traffic calming measures. Traffic drives too fast for a residential street, using it as a short cut between two main roads.
With so many speed changes all the speed should the illuminated.
Yes - more signs saying 50 kph
Yes - The 40km hr speed limits in may streets and areas is not safe or appropriate, drivers get aggressive behind you while planning under 40km. The frequent changes in speed limit and lack of signs is also dangerous and inappropriate.
Stonnington Survey Group Page 50 of 61

22. In the past twelve months, if you consumed alcohol in premises other than your home and thought that you were near or over the limit, how did you leave the premises? (Please tick as many as apply).
Other
(Never over)
Always make arrangements
Did not happen
Didn’t get to near the limit
Didn't happen
Do not consume enough to go near let alone over the limit
Do not drink
Does not apply. Never drink when driving
Has not occurred
I
I am teetotal. ie. do not drink at all.
I do not drink
I do not drink alcohol
I dont drink
I don't drink
I don't drink alcohol
I don't drink alcohol
I have not had alcohol since 1997
I haven't had that much alcohol in the last 12 months while out.
I there no option for tea totallers
I wouldn't drive in those circumstances
Never - don’t drink
Stonnington Survey Group Page 51 of 61

Never been in that situation
Never drink alcohol
Never in this situation
Never over the limit
None of these. I am teetotal
Not applicable
Not Applicable
Not applicable - I do not drink
Not relevant
Stayed the night
Stayed the night and drove home in the morning
Would have been under the limit
Would never be near the limit.
Stonnington Survey Group Page 52 of 61

4. APPENDIX: SURVEY
Section 1 - Road Safety
The purpose of this section is to increase Council’s understanding of residents’ knowledge, attitudes, behaviour and perception of safety with regards to road use within the City of Stonnington. The results will assist Council’s Transport Department in future program planning and service delivery.
Perceptions of Safety
Q1a. When thinking about road use within the City of Stonnington, how concerned are you about the safety of pedestrians?
Very Concerned
Concerned
Neutral
Not very concerned
Not concerned at all (go to question 3a)
Q1b. What do you believe are the main road safety concerns for pedestrians within City of Stonnington? (Please select as many as apply)
Speeding vehicles
Driver awareness of pedestrians
Pedestrian behaviour and awareness of vehicles
Not enough crossings with pedestrian operated signals
Insufficient street lighting
Uneven footpaths
Cross-overs (driveways)
Other. Please specify ___________________________________
Stonnington Survey Group Page 53 of 61

Q2. What measures do you think would improve road safety for pedestrians within City of Stonnington? (Please select as many as apply)
Reducing speed limits
Altering road layout (eg. speed humps, kerb extensions)
More median line markings enabling pedestrians to stage road crossings
More crossings with pedestrian operated signals
Improved street lighting
Improved footpaths (eg. quality, width)
Advisory signs for motorists
Other. Please specify ___________________________________
Q3a. When thinking about road use within the City of Stonnington, how concerned are you about the safety of cyclists?
Very Concerned
Concerned
Neutral
Not very concerned
Not concerned at all (go to question 5)
Q3b. What do you believe are the main road safety concerns for cyclists within the City of Stonnington? (Please select as many as apply)
Speeding vehicles
Not enough bike lanes
Driver awareness of cyclists
Cyclist behaviour and awareness of motorists
Not enough signalised crossings at main roads
Double parking
Car doors opening unexpectedly
Insufficient street lighting
Other. Please specify ___________________________________
Stonnington Survey Group Page 54 of 61
Q4a. What measures do you think would improve road safety for cyclists within the City of Stonnington? (Please select as many as apply)
Reducing speed limits
Altering road layout (eg. speed humps)
Increasing the number of bike lanes
Increasing / improving off road bike lanes
More bicycle parking facilities
More signal crossings at main roads
Advisory signs for motorists
Other. Please specify ___________________________________
Q4b. Do you ride a bike?
Yes
No (skip to Q5)
Q4c. As a cyclist, I feel safe riding a bike in my local area in terms of the surrounding traffic?
Strongly Agree
Agree
Neutral
Disagree
Strongly Disagree
Stonnington Survey Group Page 55 of 61

Q5. To what extent do you agree or disagree with the following statements?
Strongly Agree Agree Neutral Disagree Strongly
Disagree
As a pedestrian, I feel safe crossing local residential streets As a pedestrian, I feel safe walking in my local area in terms of the surrounding traffic
As a pedestrian, I feel safe using pedestrian crossings to cross main roads in strip shopping centres
As a pedestrian, I feel safe crossing main roads in strip shopping centres without using a pedestrian crossing
Q6. Which best describes the street in which you live:
Main Road
Local Street
Q7. What is the speed limit in your street?
40 km/h
50 km/h
Partly 40 km/h and partly 50 km/h
60 km/h
Other. Please specify _______________
Unsure
Q8. Do you consider the speed nominated in Q7 to be a safe speed limit for road users?
Yes (Skip to Q10)
No
Stonnington Survey Group Page 56 of 61

Q9. What do you believe would be a safe speed limit for your street?
Less than 40 km/h
40 km/h
50 km/h
60 km/h
Other. Please specify _______________
Unsure
Q10. Do you have any additional comments regarding speed limits in local residential streets within City of Stonnington?
________________________________________________________________________________________________________________________________________________________________________________________________________________________________________________________________
Speed in Residential Streets
Q11. Do you drive a motor vehicle?
Yes
No (if no skip to Q26 on page 10)
Q12. If a street in your suburb has no speed limit signs, what is the speed limit?
40 km/h
50 km/h
60 km/h
Unsure
Other (Please specify) _____________________
Stonnington Survey Group Page 57 of 61

Q13. What is the speed limit most likely to be near schools during drop off and pick up times?
40 km/h
50 km/h
60 km/h
Unsure
Other (Please specify) _____________________
Q14. To what extent (if any) do you find frequent changes in the speed limit confusing?
Extremely confusing
Very confusing
Quite confusing
Just a little confusing
Not confusing at all
Q15. For each of the following statements, please indicate which best describes the speed at which you generally drive in local streets:
Always Most of the Time
Often Rarely Never
I drive within the speed limit. I drive over the speed limit by less than 5 kilometres per hour (km/h). I drive over the speed limit by more than 5 km/h.
Q16. Do you believe the speed limit should be the same in all local streets (not including main roads) within the City of Stonnington?
Yes
Stonnington Survey Group Page 58 of 61

No (Skip to Q18)
Unsure
Q17. What do you believe the speed limit should be for all local streets?
Less than 40km/h
40 km/h
50 km/h
60 km/h
Unsure
Please answer the following questions only if you were a fully licensed driver for the past twelve months, otherwise skip to section 2 (page 10).
Drinking and Driving
Q18. In the past twelve months, how often have you driven after consuming alcohol?
Never
Rarely
Sometimes
Frequently
Q19. Which of the following statements best describes your attitude to drinking and driving:
If I am driving, I never drink alcohol.
If I am driving, I restrict how much alcohol I drink to make sure that I am under the limit.
If I am driving, I restrict how much alcohol I drink but don’t worry too much about
staying under the limit.
If I am driving, I do not restrict what or how much I drink.
Stonnington Survey Group Page 59 of 61

Q20. Over the past twelve months, how often would you have considered yourself to be near or over the legal limit, but have driven anyway?
Never
Rarely
Sometimes
Frequently
Always
Q21. During the past twelve months, if you consumed alcohol in a premise other than your home and thought that you were under the limit, how often did you drive?
Never
Rarely
Sometimes
Frequently
Always
Q22. In the past twelve months, if you consumed alcohol in a premises other than your home and thought that you were near or over the limit, how did you leave the premises? (Please tick as many as apply).
Drove my vehicle
Arranged for someone else to drive my vehicle
Arranged a lift with someone else
Took public transport
Took a taxi
Walked
Other (Please specify) ____________________________
Stonnington Survey Group Page 60 of 61

Please answer the following questions only if in the last twelve months you knew that you would be going out and at some stage would be over the limit. Otherwise please skip to section 2 (page 10).
Q23. In the last twelve months, if you knew that you would be going out and at some stage would be over the limit, how often did you make arrangements so that you would not be drinking and driving?
Never (go to question 25)
Rarely
Sometimes
Frequently
Always
Q24. What arrangements did you make? (Please tick as many as apply).
Drove my vehicle
Arranged for someone else to drive my vehicle
Arranged a lift with someone else
Took public transport
Took a taxi
Walked
Other (Please specify) ____________________________
Stonnington Survey Group Page 61 of 61