Embed Size (px)
Citation preview

Un
sa
ve
d D
ocu
me
nt / 7
/11
/20
13
/ 2
2:5
5
Essar – Lets Begin
Madhu Vuppuluri, CEO, Essar Americas
IMM Conference, November 11, 2013

Un
sa
ve
d D
ocu
me
nt / 7
/11
/20
13
/ 2
2:5
5
Essar Global Overview
PRIVATE & CONFIDENTIAL
Leading Business Group with Globally Diversified Operations
Oil & Gas
2,034 MMBOE reserves
36 MMTPA refineries
1,400 retail outlets
Power
455 MT coal reserves
3,910 MW operational capacity
Going up to 6,700 MW by 2014
Shipping***26 ships, 15 rigs incl. semisubmersible and 4,200 chartered trucks
BPO55 global Aegis locations
Real Estate~16 Mn Sq ft. Portfolio in residential, commercial and mixed use projects
Telecom ServicesGSM services in Kenya 900 branded retail outlets
Projects
Engineering, Procurement & Construction
2nd largest equipment bank in India
Ports***
104 MTPA operational capacity
181 MTPA planned capacity
Resources
2 Bn tonnes of reserves
27 MTPA pellet capacity
172 MT coal reserves
Steel Making & Marketing
14 MTPA steel-making capacity
5 MTPA processing and distribution capacity
350 retail outlets
Energy ** Infrastructure ServicesSteel
2
73000 Employees, Presence in 25 countries with Revenues of US$ 35 Bn
** Listed on LSE ***Listed on BSE & NSE
PRIVATE & CONFIDENTIAL
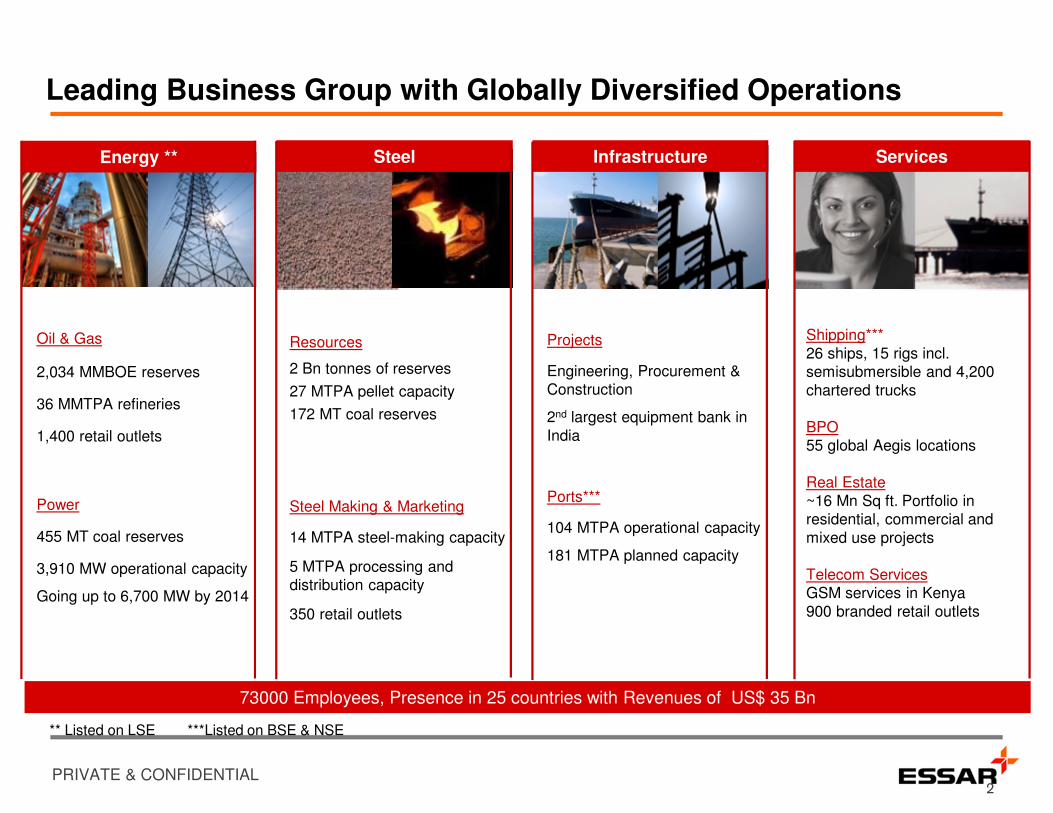
A diversified worldwide footprint
USA/CANADA
Steel
Minerals
BPO Operations
Power
AFRICA
Oil & Gas
Steel
Telecom
BPO Operations
Minerals
INDONESIA
Steel
Oil & Gas
Minerals
INDIA
Steel
Oil & Gas
Power
Projects
Ports
Shipping
Minerals
Telecom Services
BPO operations
UNITED KINGDOM
Oil & Gas
Steel
BPO Operations
AUSTRALIA/NEW ZEALAND
BPO Operation
MIDDLE EAST
Steel
BPO Operations
VIETNAM
Oil & Gas
PHILIPPINES
BPO Operations
ARGENTINA
BPO Operations
Americas Europe & Middle East IndiaAfrica Australia & Asia ex India
• Algoma steel – 2.8 mmtpa
• 2bn tonnes iron ore reserves
at Minnesota; 7 mmpta pellet
plant under construction
• Aegis BPO headquarters
• Stanlow refinery, UK; 296k
bpd capacity, producing 15%
of UK transport fuel
• Steel distribution centres,
UK and Middle East
• 20 mmpta Vadinar refinery
•14 mmtpa Hazira steel plant
• Ports at 5 locations
• 3,825MW installed power
plant capacity
• GSM network in Kenya
• 50% stake in Kenya
Petroleum Refineries
• Zimbabwe iron ore project
•Indonesia steel distribution
centre
• BPO centres in Philippines
and Australia
3

Un
sa
ve
d D
ocu
me
nt / 7
/11
/20
13
/ 2
2:5
5
Addressing global overcapacity challenges
PRIVATE & CONFIDENTIAL
Global Steel Market Outlook
� Global capacity utilization increased from 75% in August’13 to 79% in September’13. The increase
is significantly higher than the seasonal 1-2% increase in capacity utilization in the month of
September in the past few years.
� Flat steel prices recovered in Q3 2013 with a 7% q-o-q increase in U.S. Domestic HRC prices, 8%
increase in China HRC export prices and 4% increase in China HRC domestic prices.
� Low inventories in China and U.S. reflect an end to destocking in Q3’13 and overall pricing outlook
is favorable for the steel industry.
� Recent price increases in finished products coupled with stable raw material prices is expected to
increase profitability of steelmakers in the near term.
� Positive Global economic indicators in U.S., Europe and China strongly point towards a recovery of
steel market in the near term.
� Overcapacity, especially in China continues to remains the biggest threat for steel industry in the
near future. The pace and extent of execution of capacity reduction plan in China will have a strong
impact of global steel industry in the next few years.
5
PRIVATE & CONFIDENTIAL
Improvement in Worldwide Purchasing Managers Index
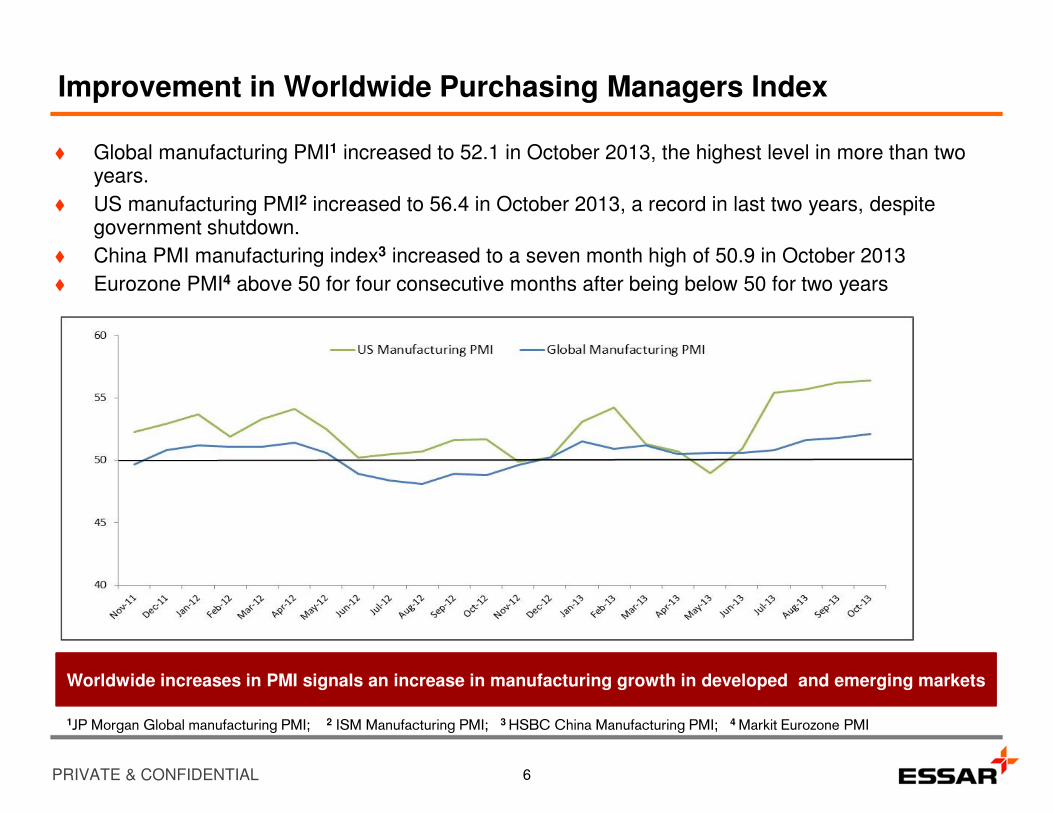
� Global manufacturing PMI1 increased to 52.1 in October 2013, the highest level in more than two years.
� US manufacturing PMI2 increased to 56.4 in October 2013, a record in last two years, despite government shutdown.
� China PMI manufacturing index3 increased to a seven month high of 50.9 in October 2013
� Eurozone PMI4 above 50 for four consecutive months after being below 50 for two years
6
Worldwide increases in PMI signals an increase in manufacturing growth in developed and emerging markets
1JP Morgan Global manufacturing PMI; 2 ISM Manufacturing PMI; 3 HSBC China Manufacturing PMI; 4 Markit Eurozone PMI
PRIVATE & CONFIDENTIAL
World Steel Capacity Utilization
7
Source: WorldSteel.org
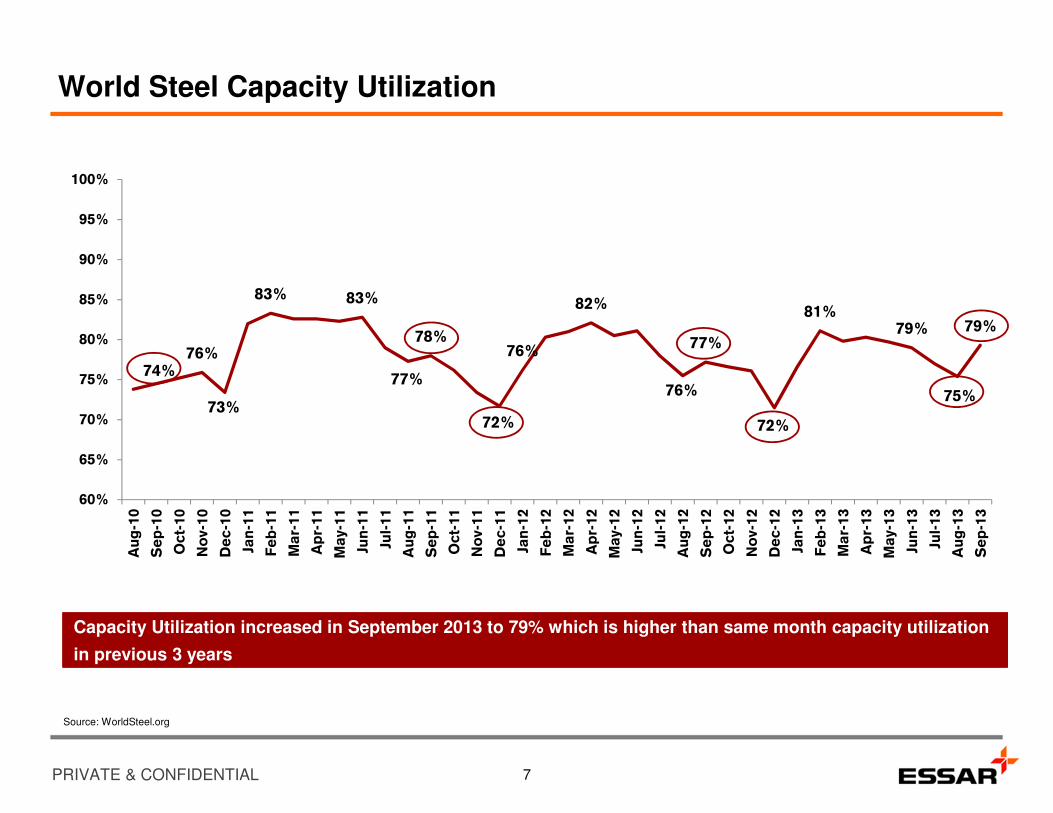
Capacity Utilization increased in September 2013 to 79% which is higher than same month capacity utilization
in previous 3 years
74%76%
73%
83% 83%
77%
78%
72%
76%
82%
76%
77%
72%
81%79%
75%
79%
60%
65%
70%
75%
80%
85%
90%
95%
100%
Au
g-1
0
Se
p-1
0
Oct-
10
No
v-1
0
De
c-1
0
Jan
-11
Fe
b-1
1
Ma
r-11
Ap
r-11
Ma
y-1
1
Jun
-11
Jul-
11
Au
g-1
1
Se
p-1
1
Oct-
11
No
v-1
1
De
c-1
1
Jan
-12
Fe
b-1
2
Ma
r-12
Ap
r-12
Ma
y-1
2
Jun
-12
Jul-
12
Au
g-1
2
Se
p-1
2
Oct-
12
No
v-1
2
De
c-1
2
Jan
-13
Fe
b-1
3
Ma
r-13
Ap
r-13
Ma
y-1
3
Jun
-13
Jul-
13
Au
g-1
3
Se
p-1
3
PRIVATE & CONFIDENTIAL
World Crude Steel Production And Utilization
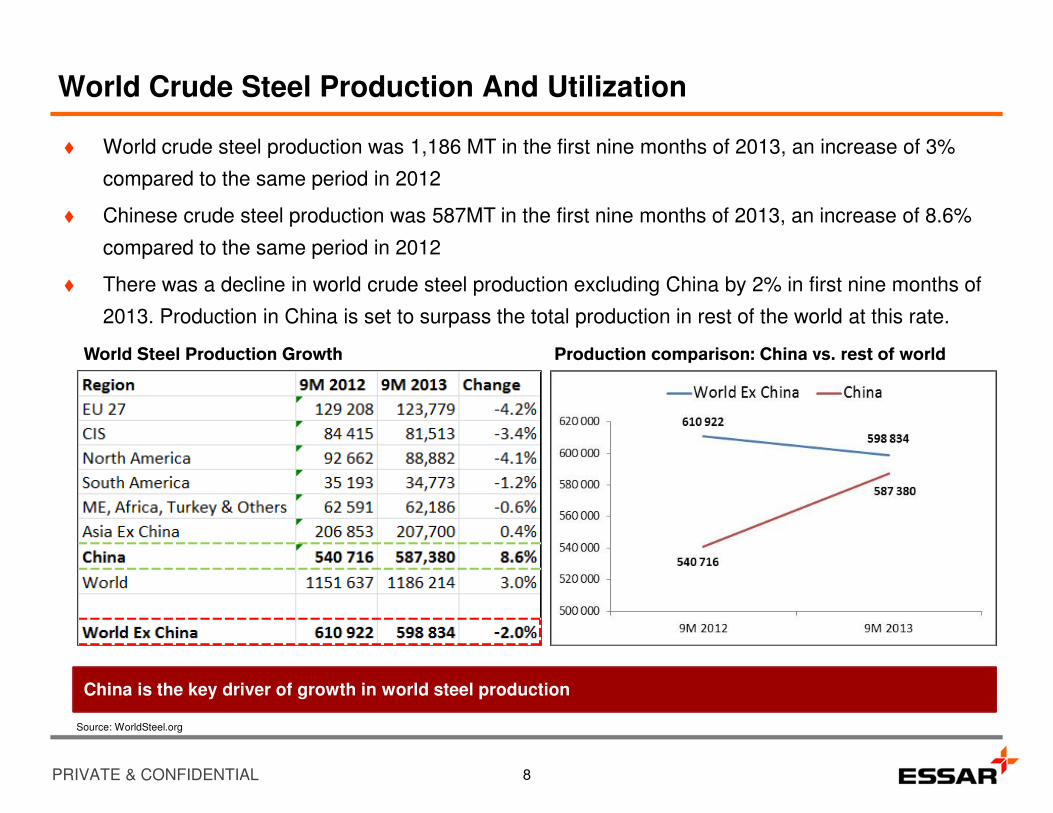
� World crude steel production was 1,186 MT in the first nine months of 2013, an increase of 3%
compared to the same period in 2012
� Chinese crude steel production was 587MT in the first nine months of 2013, an increase of 8.6%
compared to the same period in 2012
� There was a decline in world crude steel production excluding China by 2% in first nine months of
2013. Production in China is set to surpass the total production in rest of the world at this rate.
8
World Steel Production Growth Production comparison: China vs. rest of world
China is the key driver of growth in world steel production
Source: WorldSteel.org
PRIVATE & CONFIDENTIAL
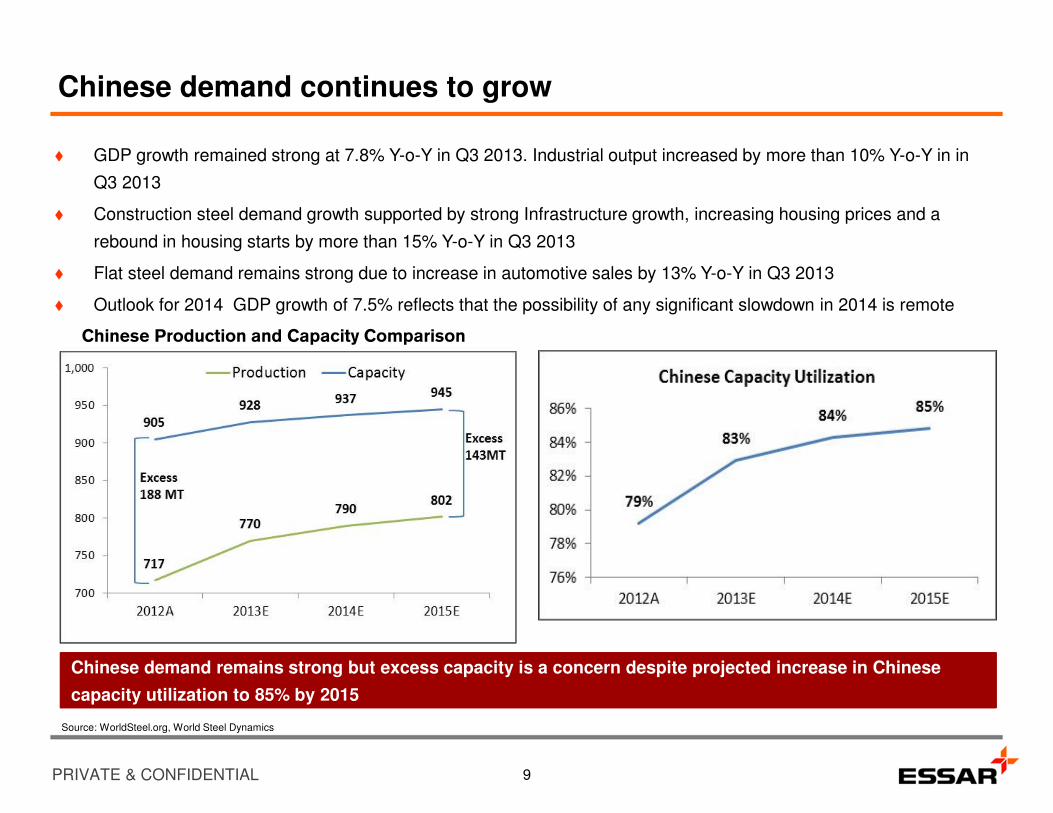
Chinese demand continues to grow
� GDP growth remained strong at 7.8% Y-o-Y in Q3 2013. Industrial output increased by more than 10% Y-o-Y in in
Q3 2013
� Construction steel demand growth supported by strong Infrastructure growth, increasing housing prices and a
rebound in housing starts by more than 15% Y-o-Y in Q3 2013
� Flat steel demand remains strong due to increase in automotive sales by 13% Y-o-Y in Q3 2013
� Outlook for 2014 GDP growth of 7.5% reflects that the possibility of any significant slowdown in 2014 is remote
9
Chinese Production and Capacity Comparison
Chinese demand remains strong but excess capacity is a concern despite projected increase in Chinese
capacity utilization to 85% by 2015
Source: WorldSteel.org, World Steel Dynamics
PRIVATE & CONFIDENTIAL
Chinese Steelmaking Capacity
� China's effective steelmaking capacity is still rising despite significant overcapacity.
� In 2013, crude steel capacity is estimated to be about 928 million tonnes, up 23 million tonnes from
2012 and by 2015, capacity may rise another 17 million tonnes to 945 million tonnes.
� Overcapacity is estimated at ~160 MTPA at present, consisting of 90 MTPA for long products , 40
MTPA for steel sheet products and 20 MTPA for plates.
� Capacity reduction goals will be difficult to achieve since all but four of China's larger steel
companies are partly owned by municipalities. As the objective of municipalities is maximization of
employment, output and tax revenues, they will maintain their resistance to capacity reduction
plans.
� Due to sizable oversupply and low domestic price for hot-rolled band, Chinese mills have put
downward price pressure in the export markets in the last few years.
� Consolidation is happening at a very slow pace. By 2020, the top 4 steel mills are expected to
have a market share of 35% versus 28% in 2012; for the top 10, the estimate is 60% and 48%,
respectively.
10
Chinese overcapacity will continue to remain the biggest threat for steel industry in the near future
Source: World Steel Dynamics
Un
sa
ve
d D
ocu
me
nt / 7
/11
/20
13
/ 2
2:5
5
North American Steel Market
PRIVATE & CONFIDENTIAL
Current North American Industry Scenario: Flat Products
� 2013 estimated North American (US & Canada only) flat roll consumption – 80 million NT
� Average USD YTD 2013 HRC price - $620/NT
� Flat Roll Capacity
– HSM – 95.5 million NT
– Reversing Plate Mill – 7 million NT
– Steckle Mill – 6.5 million NT
� YTD 2013 2013 Raw Steel Capacity Utilization averaging 77.2%, currently 76.5%
12
PRIVATE & CONFIDENTIAL
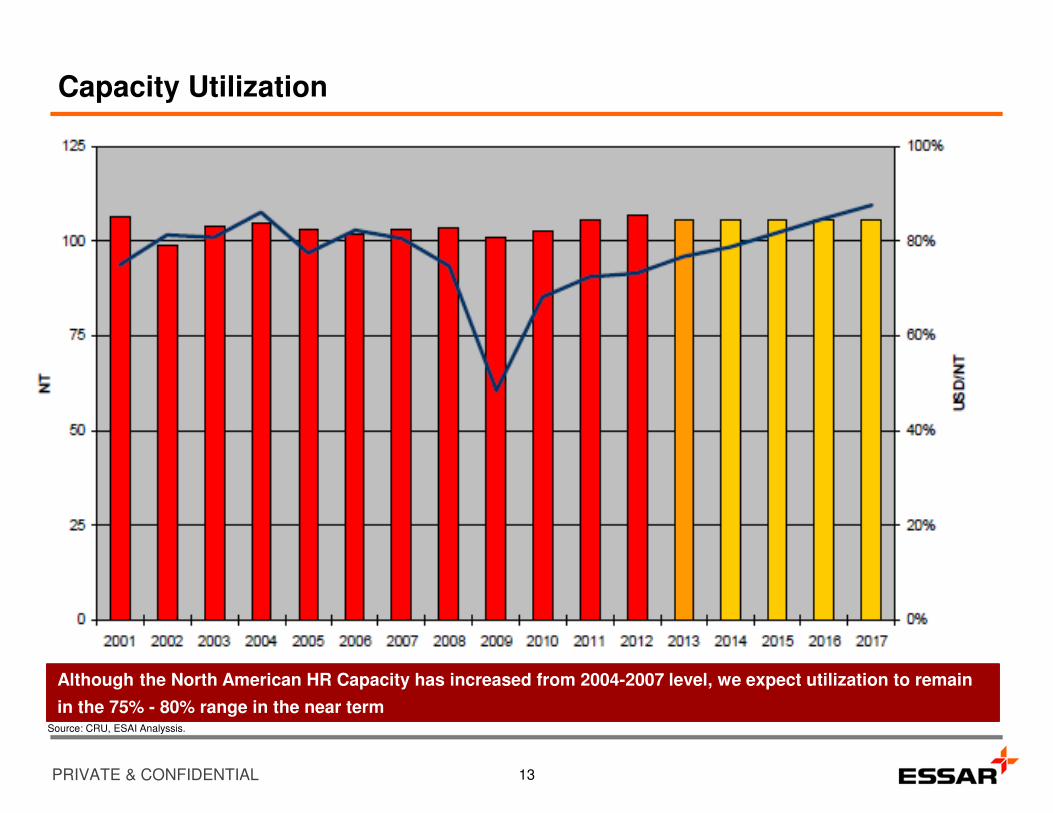
Capacity Utilization
13
Although the North American HR Capacity has increased from 2004-2007 level, we expect utilization to remain
in the 75% - 80% range in the near termSource: CRU, ESAI Analyssis.
PRIVATE & CONFIDENTIAL
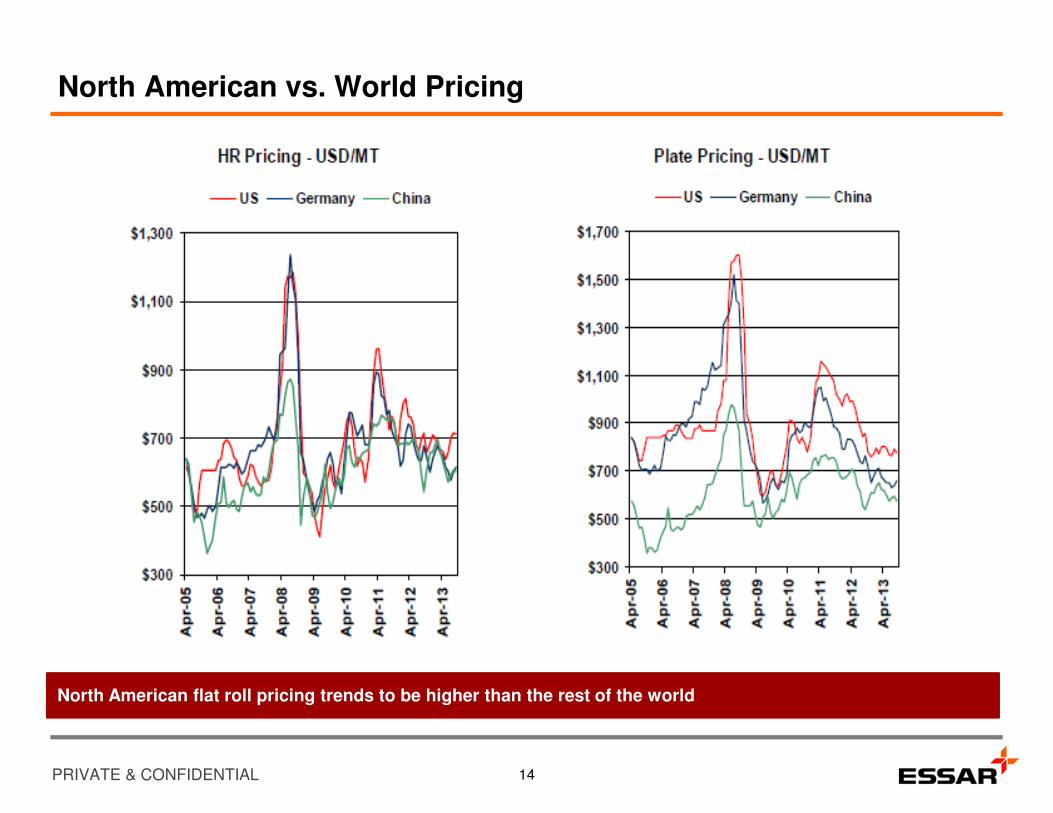
North American vs. World Pricing
14
North American flat roll pricing trends to be higher than the rest of the world
PRIVATE & CONFIDENTIAL
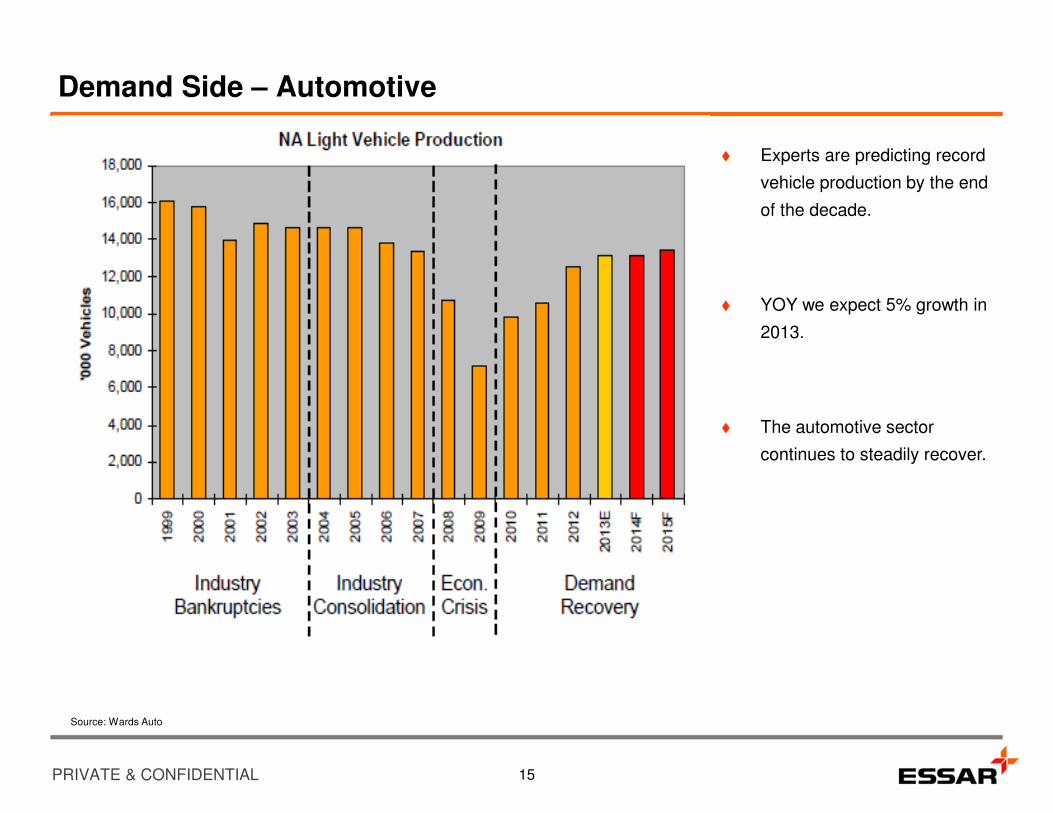
Demand Side – Automotive
15
� Experts are predicting record
vehicle production by the end
of the decade.
� YOY we expect 5% growth in
2013.
� The automotive sector
continues to steadily recover.
Source: Wards Auto
PRIVATE & CONFIDENTIAL
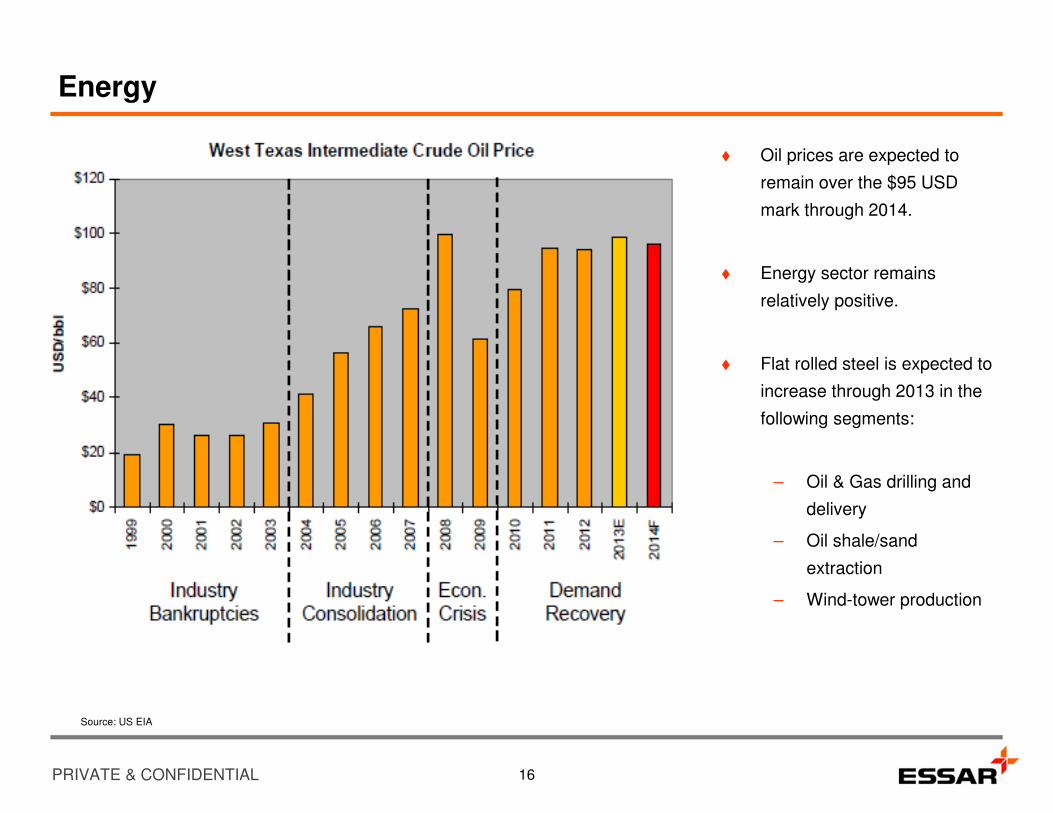
Energy
16
� Oil prices are expected to
remain over the $95 USD
mark through 2014.
� Energy sector remains
relatively positive.
� Flat rolled steel is expected to
increase through 2013 in the
following segments:
– Oil & Gas drilling and
delivery
– Oil shale/sand
extraction
– Wind-tower production
Source: US EIA
PRIVATE & CONFIDENTIAL
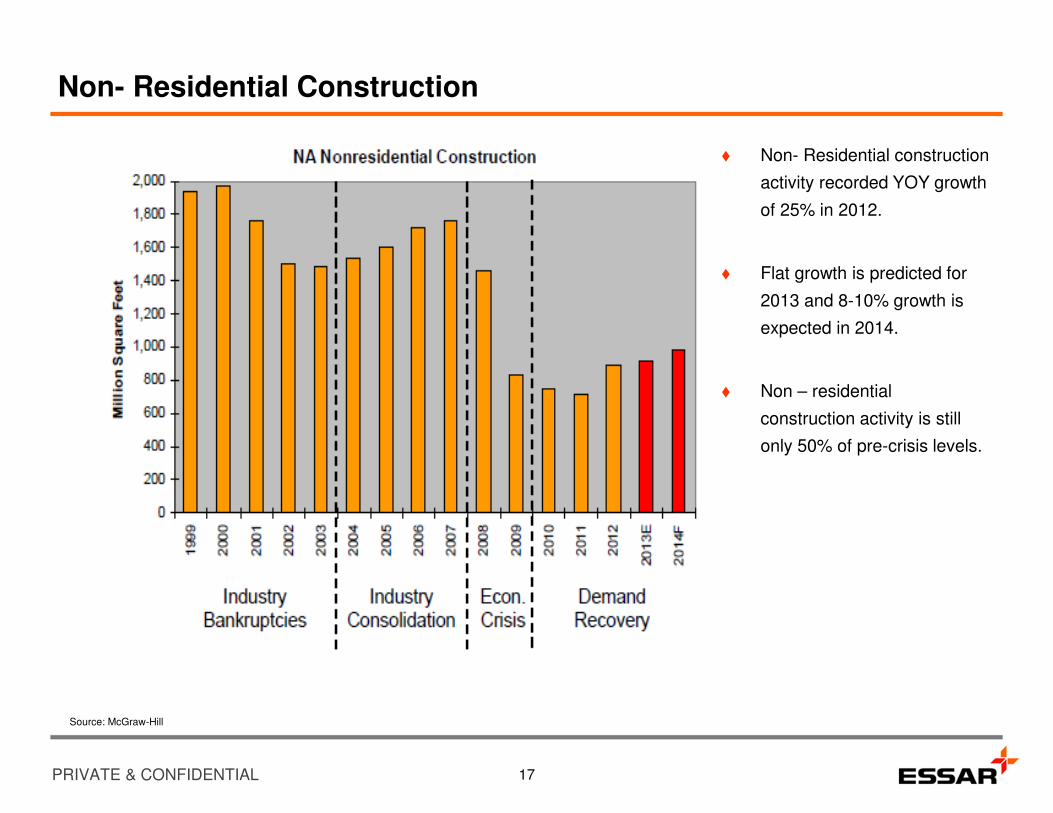
Non- Residential Construction
17
� Non- Residential construction
activity recorded YOY growth
of 25% in 2012.
� Flat growth is predicted for
2013 and 8-10% growth is
expected in 2014.
� Non – residential
construction activity is still
only 50% of pre-crisis levels.
Source: McGraw-Hill
PRIVATE & CONFIDENTIAL
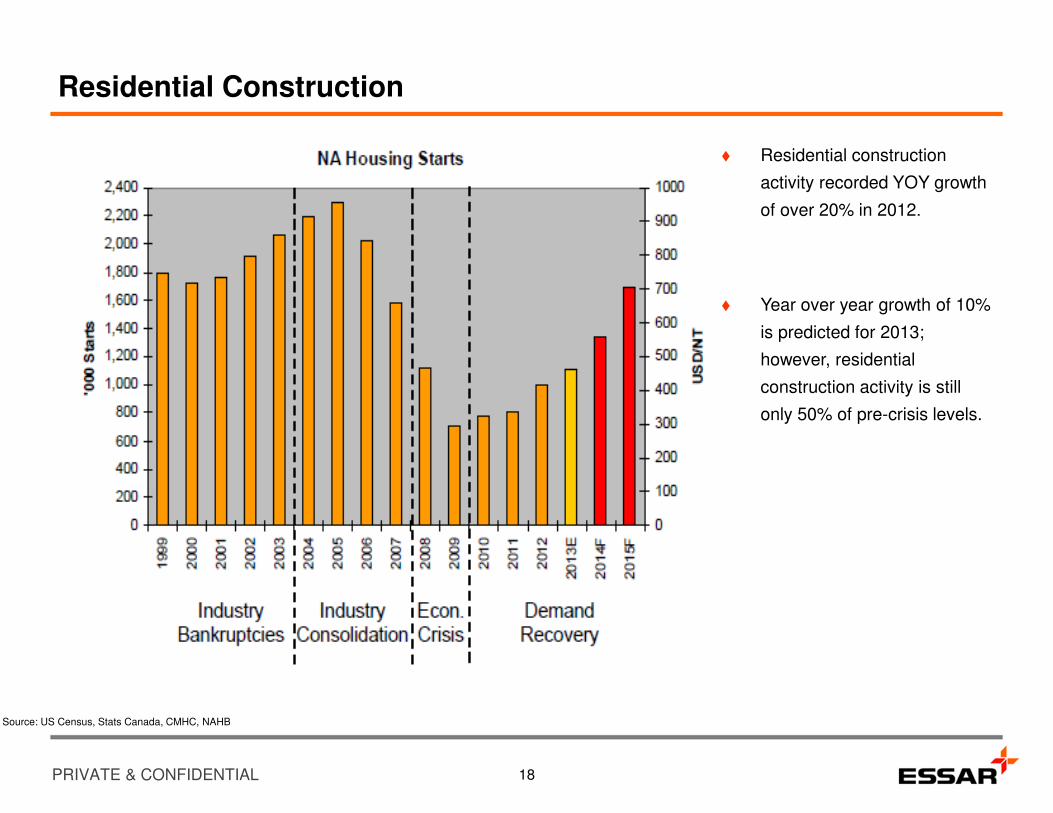
Residential Construction
18
� Residential construction
activity recorded YOY growth
of over 20% in 2012.
� Year over year growth of 10%
is predicted for 2013;
however, residential
construction activity is still
only 50% of pre-crisis levels.
Source: US Census, Stats Canada, CMHC, NAHB

Un
sa
ve
d D
ocu
me
nt / 7
/11
/20
13
/ 2
2:5
5
Essar Steel Minnesota Overview
PRIVATE & CONFIDENTIAL
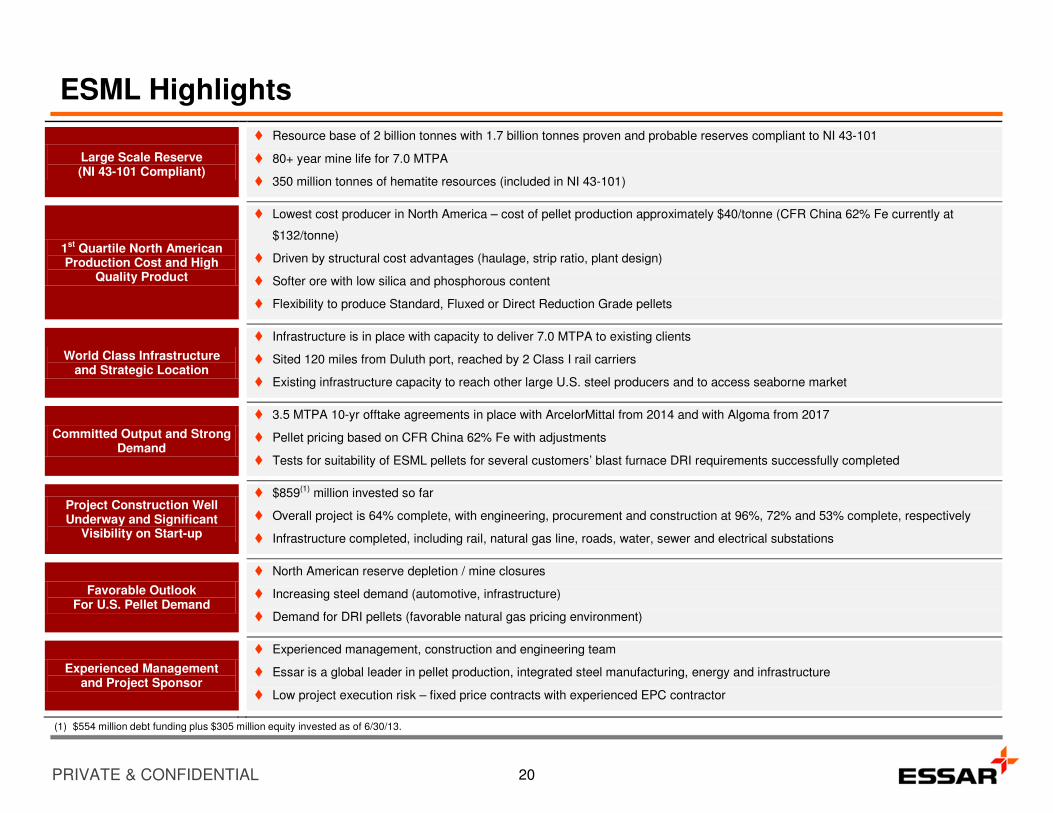
ESML Highlights
Large Scale Reserve (NI 43-101 Compliant)
� Resource base of 2 billion tonnes with 1.7 billion tonnes proven and probable reserves compliant to NI 43-101
� 80+ year mine life for 7.0 MTPA
� 350 million tonnes of hematite resources (included in NI 43-101)
1st Quartile North American Production Cost and High
Quality Product
� Lowest cost producer in North America – cost of pellet production approximately $40/tonne (CFR China 62% Fe currently at
$132/tonne)
� Driven by structural cost advantages (haulage, strip ratio, plant design)
� Softer ore with low silica and phosphorous content
� Flexibility to produce Standard, Fluxed or Direct Reduction Grade pellets
World Class Infrastructure and Strategic Location
� Infrastructure is in place with capacity to deliver 7.0 MTPA to existing clients
� Sited 120 miles from Duluth port, reached by 2 Class I rail carriers
� Existing infrastructure capacity to reach other large U.S. steel producers and to access seaborne market
Committed Output and Strong Demand
� 3.5 MTPA 10-yr offtake agreements in place with ArcelorMittal from 2014 and with Algoma from 2017
� Pellet pricing based on CFR China 62% Fe with adjustments
� Tests for suitability of ESML pellets for several customers’ blast furnace DRI requirements successfully completed
Project Construction Well Underway and Significant
Visibility on Start-up
� $859(1) million invested so far
� Overall project is 64% complete, with engineering, procurement and construction at 96%, 72% and 53% complete, respectively
� Infrastructure completed, including rail, natural gas line, roads, water, sewer and electrical substations
Favorable Outlook For U.S. Pellet Demand
� North American reserve depletion / mine closures
� Increasing steel demand (automotive, infrastructure)
� Demand for DRI pellets (favorable natural gas pricing environment)
Experienced Management and Project Sponsor
� Experienced management, construction and engineering team
� Essar is a global leader in pellet production, integrated steel manufacturing, energy and infrastructure
� Low project execution risk – fixed price contracts with experienced EPC contractor
20
(1) $554 million debt funding plus $305 million equity invested as of 6/30/13.
PRIVATE & CONFIDENTIAL
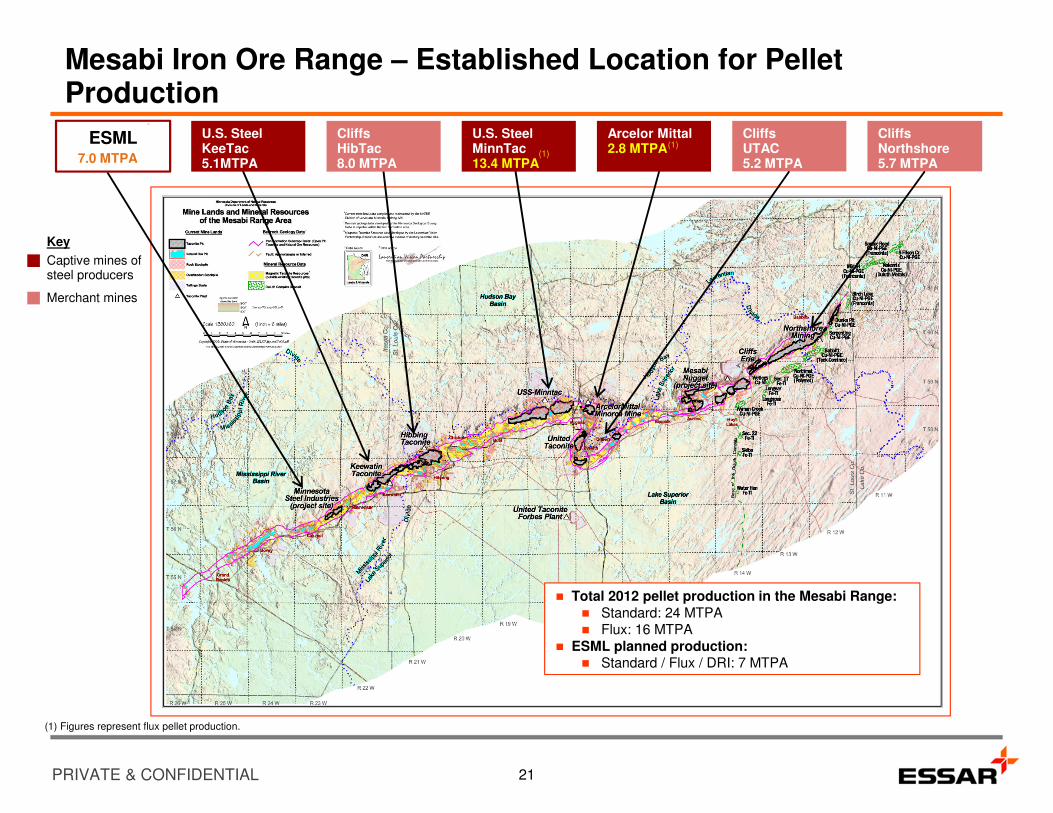
Mesabi Iron Ore Range – Established Location for Pellet Production
CliffsHibTac8.0 MTPA
CliffsUTAC5.2 MTPA
CliffsNorthshore5.7 MTPA7.0 MTPA
U.S. SteelKeeTac5.1MTPA
U.S. SteelMinnTac13.4 MTPA
Arcelor Mittal 2.8 MTPA
Captive mines of steel producers
Merchant mines
Key
21
ESML
(1) Figures represent flux pellet production.
(1)(1)
� Total 2012 pellet production in the Mesabi Range:� Standard: 24 MTPA� Flux: 16 MTPA
� ESML planned production:� Standard / Flux / DRI: 7 MTPA
PRIVATE & CONFIDENTIAL
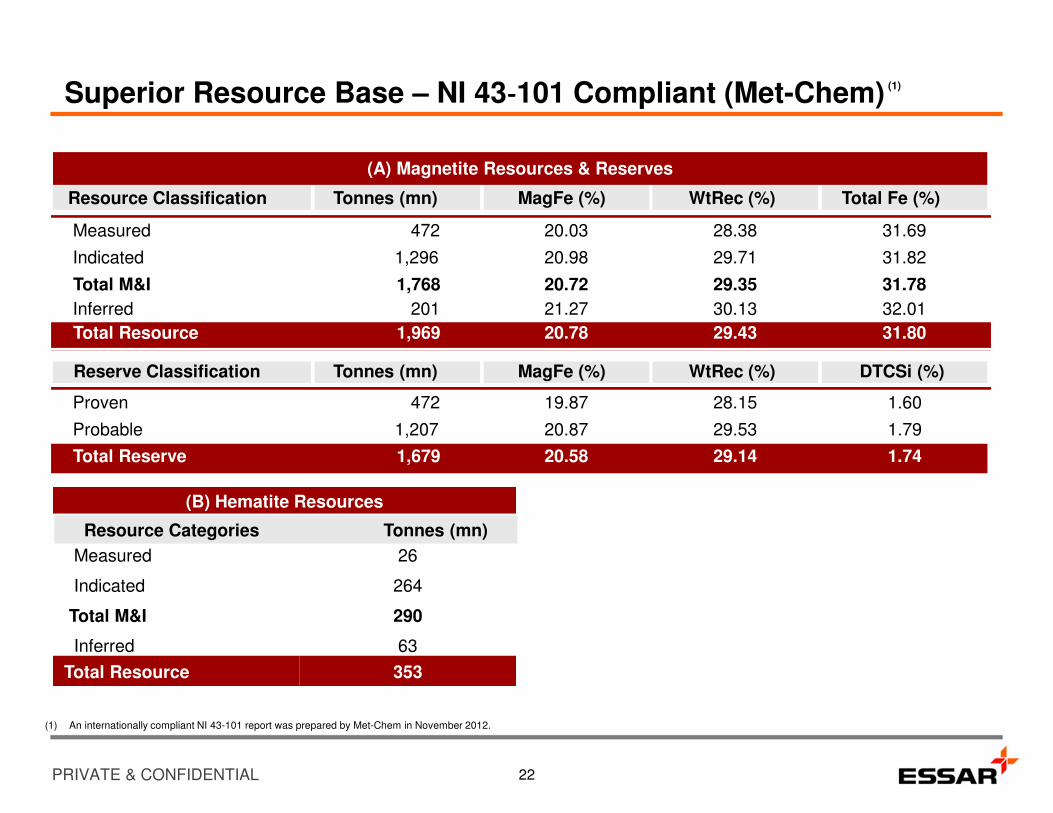
(1) An internationally compliant NI 43-101 report was prepared by Met-Chem in November 2012.
Resource Classification Tonnes (mn) MagFe (%) WtRec (%) Total Fe (%)
Measured 472 20.03 28.38 31.69
Indicated 1,296 20.98 29.71 31.82
Total M&I 1,768 20.72 29.35 31.78
Inferred 201 21.27 30.13 32.01
Total Resource 1,969 20.78 29.43 31.80
Reserve Classification Tonnes (mn) MagFe (%) WtRec (%) DTCSi (%)
Proven 472 19.87 28.15 1.60
Probable 1,207 20.87 29.53 1.79
Total Reserve 1,679 20.58 29.14 1.74
(A) Magnetite Resources & Reserves
Superior Resource Base – NI 43‐‐‐‐101 Compliant (Met-Chem)
(B) Hematite Resources
Measured 26
Indicated 264
Total M&I 290
Inferred 63
Total Resource 353
Resource Categories Tonnes (mn)
22
(1)
PRIVATE & CONFIDENTIAL
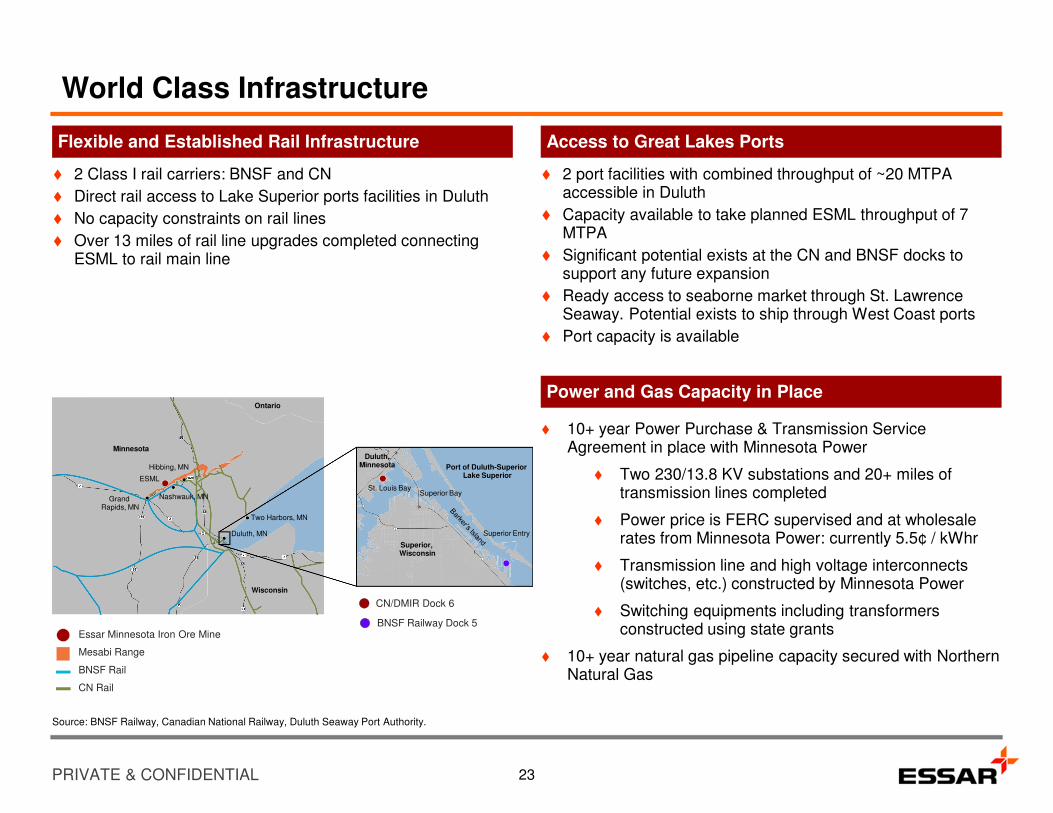
World Class Infrastructure
Flexible and Established Rail Infrastructure
� 2 Class I rail carriers: BNSF and CN
� Direct rail access to Lake Superior ports facilities in Duluth
� No capacity constraints on rail lines
� Over 13 miles of rail line upgrades completed connecting ESML to rail main line
Access to Great Lakes Ports
� 2 port facilities with combined throughput of ~20 MTPA accessible in Duluth
� Capacity available to take planned ESML throughput of 7 MTPA
� Significant potential exists at the CN and BNSF docks to support any future expansion
� Ready access to seaborne market through St. Lawrence Seaway. Potential exists to ship through West Coast ports
� Port capacity is available
Power and Gas Capacity in Place
Minnesota
ESML
Grand Rapids, MN
Nashwauk, MN
Hibbing, MN
Two Harbors, MN
Duluth, MN
Wisconsin
Ontario
St. Louis BaySuperior Bay
Duluth,Minnesota Port of Duluth-Superior
Lake Superior
Superior Entry
Superior, Wisconsin
Essar Minnesota Iron Ore Mine
Mesabi Range
BNSF Rail
CN Rail
CN/DMIR Dock 6
BNSF Railway Dock 5
Source: BNSF Railway, Canadian National Railway, Duluth Seaway Port Authority.
23
� 10+ year Power Purchase & Transmission Service Agreement in place with Minnesota Power
� Two 230/13.8 KV substations and 20+ miles of transmission lines completed
� Power price is FERC supervised and at wholesale rates from Minnesota Power: currently 5.5¢ / kWhr
� Transmission line and high voltage interconnects (switches, etc.) constructed by Minnesota Power
� Switching equipments including transformers constructed using state grants
� 10+ year natural gas pipeline capacity secured with Northern Natural Gas
PRIVATE & CONFIDENTIAL
–
20
40
60
80
100
120
140
– 29 54 79
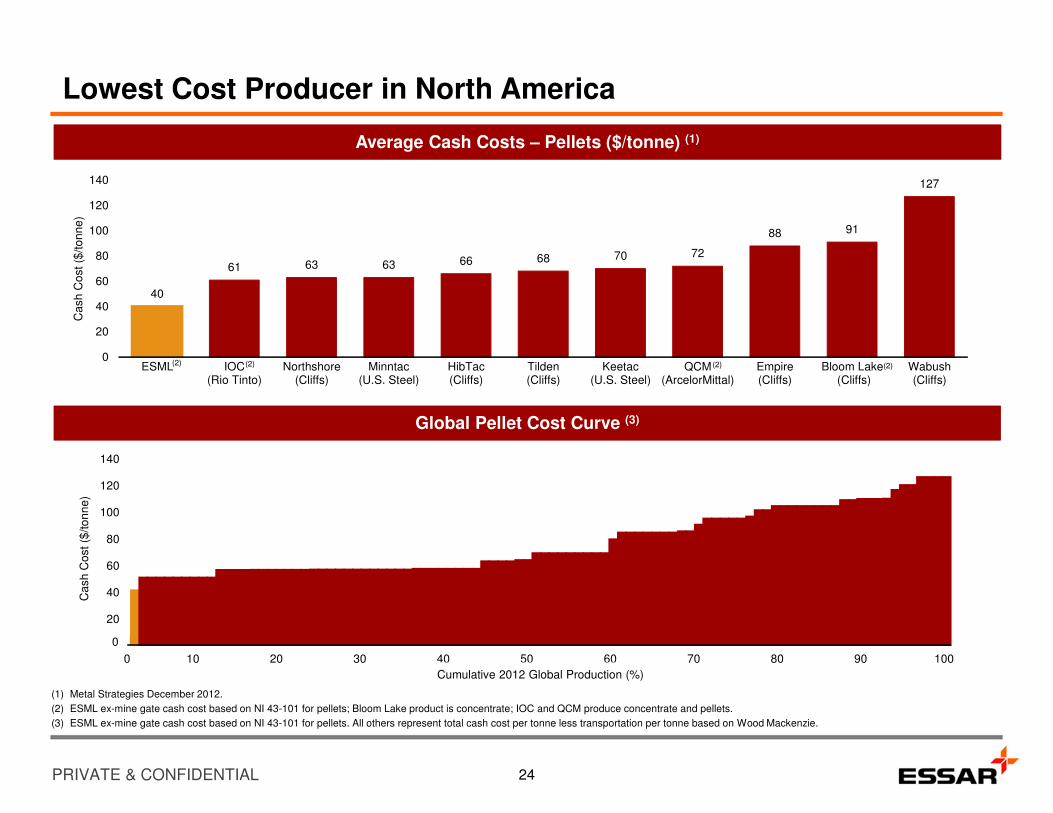
Lowest Cost Producer in North America
(1) Metal Strategies December 2012.
(2) ESML ex-mine gate cash cost based on NI 43-101 for pellets; Bloom Lake product is concentrate; IOC and QCM produce concentrate and pellets.
(3) ESML ex-mine gate cash cost based on NI 43-101 for pellets. All others represent total cash cost per tonne less transportation per tonne based on Wood Mackenzie.
24
40
61 63 63 66 68 70 72
88 91
127
0
20
40
60
80
100
120
140
ESML IOC(Rio Tinto)
Northshore(Cliffs)
Minntac(U.S. Steel)
HibTac(Cliffs)
Tilden(Cliffs)
Keetac(U.S. Steel)
QCM(ArcelorMittal)
Empire(Cliffs)
Bloom Lake (Cliffs)
Wabush(Cliffs)
Ca
sh
Co
st ($
/to
nn
e)
Average Cash Costs – Pellets ($/tonne) (1)Average Cash Costs – Pellets ($/tonne) (1)
Global Pellet Cost Curve (3)Global Pellet Cost Curve (3)
(2) (2) (2) (2)
10 20 30 40 50 60 70 80 90 100
Cumulative 2012 Global Production (%)
140
120
100
80
60
40
20
0
Ca
sh
Co
st
($/to
nn
e)
0
PRIVATE & CONFIDENTIAL
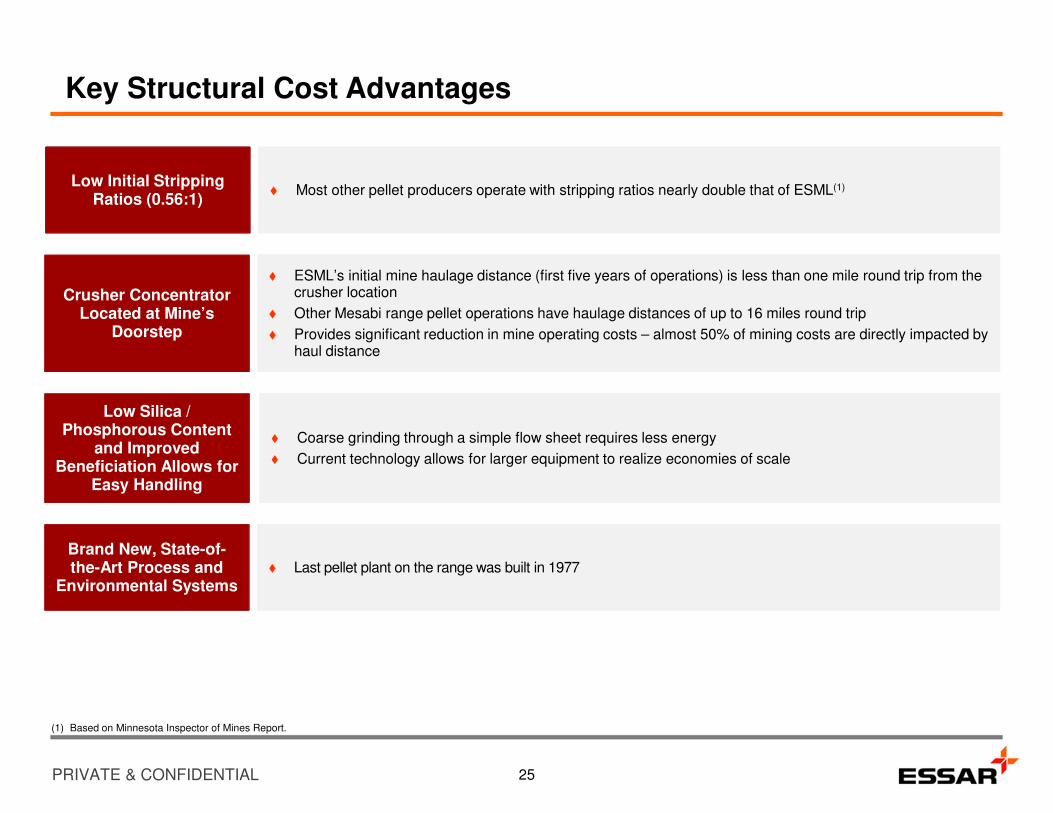
Key Structural Cost Advantages
� Most other pellet producers operate with stripping ratios nearly double that of ESML(1)Low Initial Stripping Ratios (0.56:1)
� ESML’s initial mine haulage distance (first five years of operations) is less than one mile round trip from the crusher location
� Other Mesabi range pellet operations have haulage distances of up to 16 miles round trip
� Provides significant reduction in mine operating costs – almost 50% of mining costs are directly impacted by haul distance
Crusher Concentrator Located at Mine’s
Doorstep
25
Brand New, State-of-the-Art Process and
Environmental Systems� Last pellet plant on the range was built in 1977
(1) Based on Minnesota Inspector of Mines Report.
� Coarse grinding through a simple flow sheet requires less energy
� Current technology allows for larger equipment to realize economies of scale
Low Silica / Phosphorous Content
and Improved Beneficiation Allows for
Easy Handling
PRIVATE & CONFIDENTIAL
Favorable Outlook for U.S. Pellet Demand
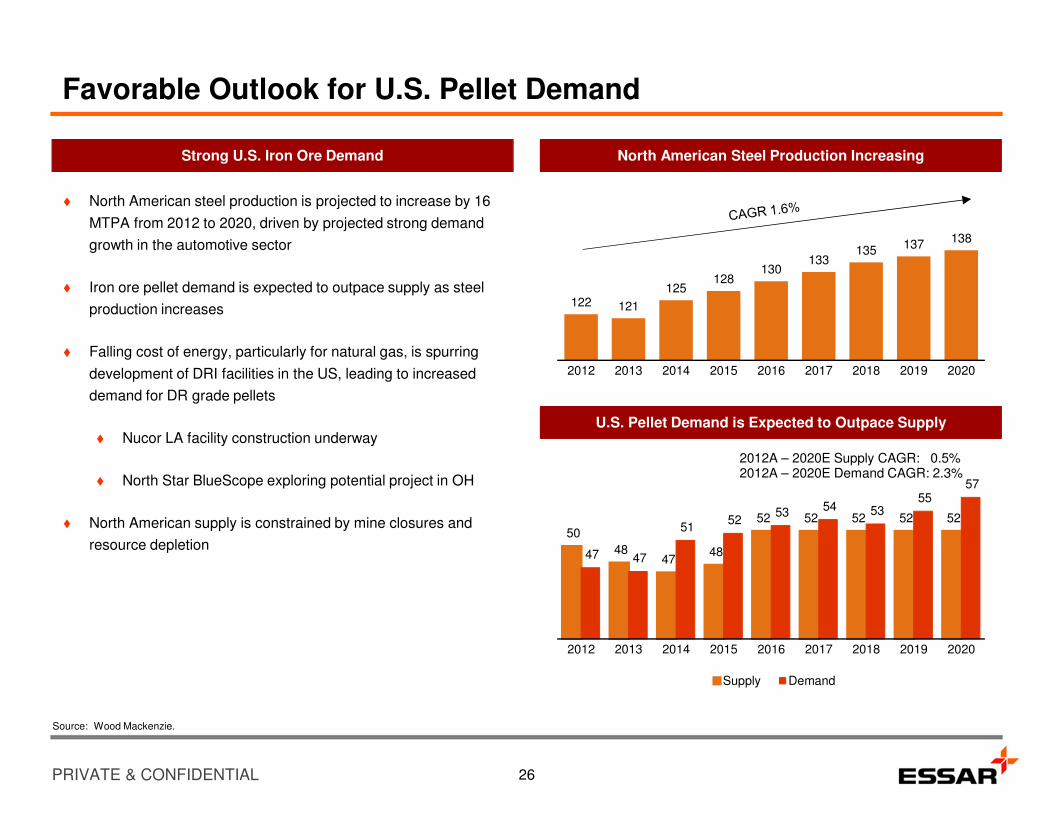
Strong U.S. Iron Ore Demand
� North American steel production is projected to increase by 16
MTPA from 2012 to 2020, driven by projected strong demand
growth in the automotive sector
� Iron ore pellet demand is expected to outpace supply as steel
production increases
� Falling cost of energy, particularly for natural gas, is spurring
development of DRI facilities in the US, leading to increased
demand for DR grade pellets
� Nucor LA facility construction underway
� North Star BlueScope exploring potential project in OH
� North American supply is constrained by mine closures and
resource depletion
North American Steel Production Increasing
U.S. Pellet Demand is Expected to Outpace Supply
122 121
125128
130133
135 137 138
2012 2013 2014 2015 2016 2017 2018 2019 2020
50
48 47
48
52 52 52 52 52
47 47
51 52
53 54 53 55
57
2012 2013 2014 2015 2016 2017 2018 2019 2020
Supply Demand
Source: Wood Mackenzie.
2012A – 2020E Supply CAGR: 0.5%2012A – 2020E Demand CAGR: 2.3%
26
PRIVATE & CONFIDENTIAL
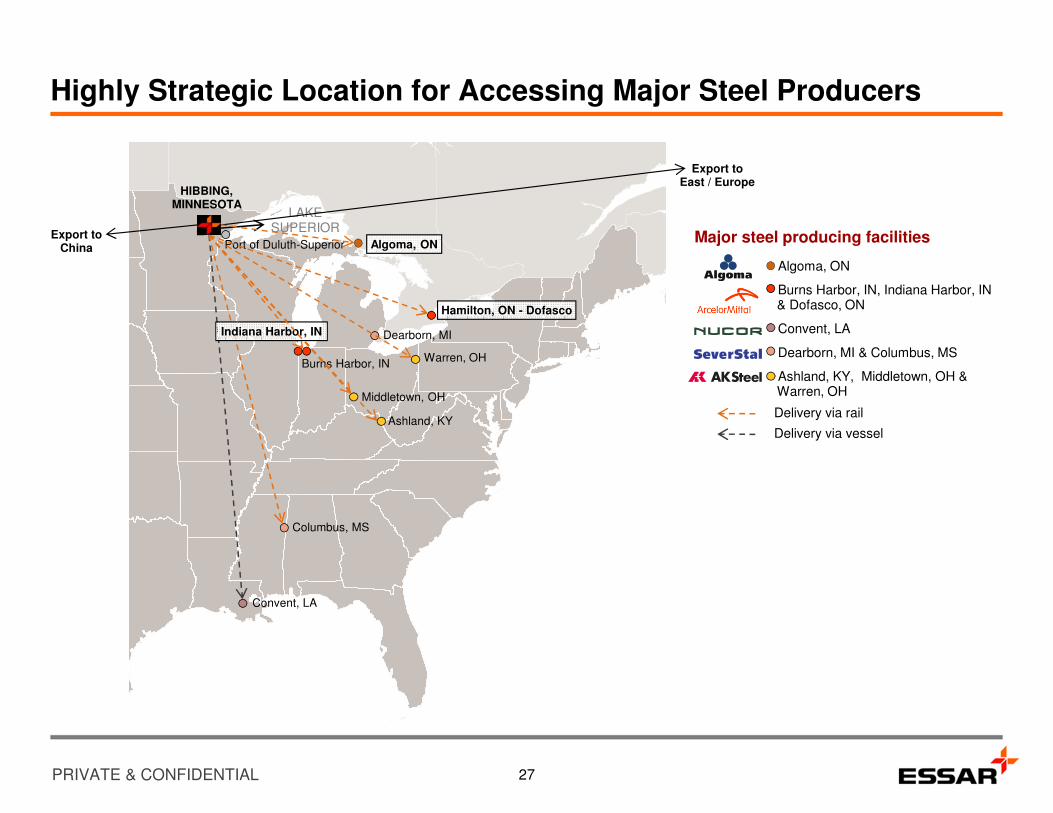
LAKESUPERIOR
Highly Strategic Location for Accessing Major Steel Producers
27
Hamilton, ON - Dofasco
Algoma, ON
Warren, OH
Middletown, OH
Ashland, KY
Convent, LA
Columbus, MS
- Algoma, ON
- Burns Harbor, IN, Indiana Harbor, IN & Dofasco, ON
- Convent, LA
- Dearborn, MI & Columbus, MS
- Ashland, KY, Middletown, OH & Warren, OH
HIBBING, MINNESOTA
Export to China
Burns Harbor, IN
Export to East / Europe
Delivery via rail
Delivery via vessel
Port of Duluth-Superior Major steel producing facilities
Dearborn, MIIndiana Harbor, IN
PRIVATE & CONFIDENTIAL
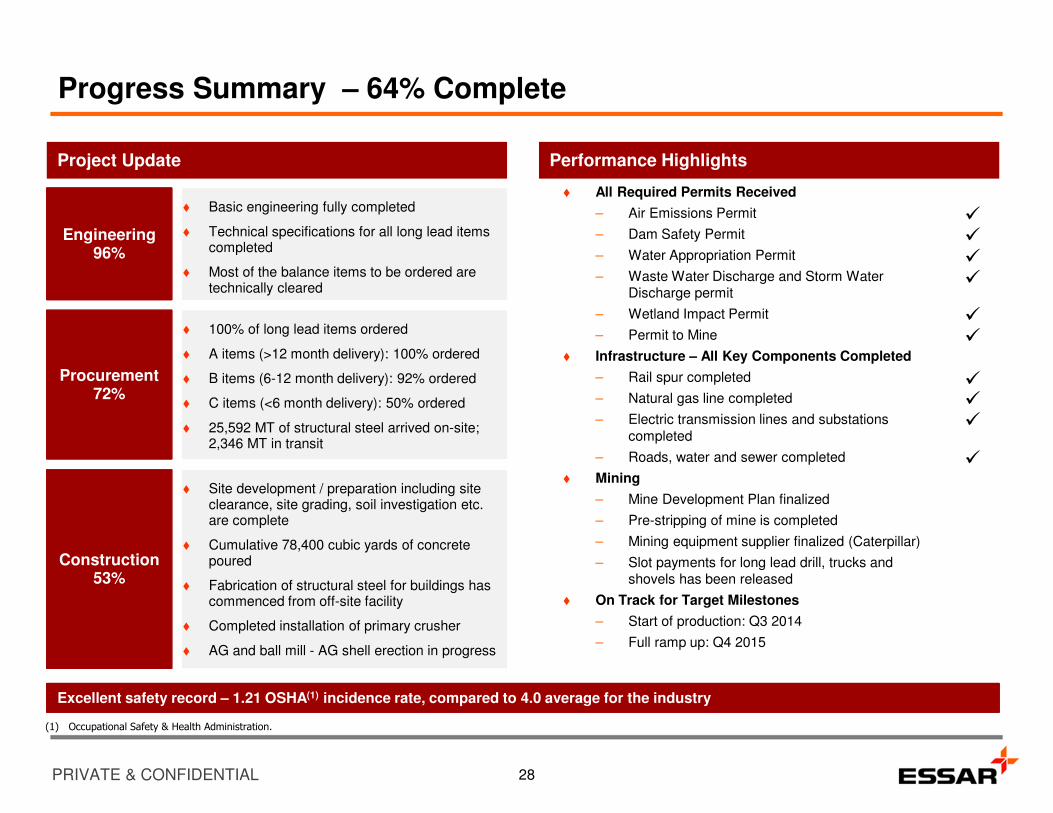
� All Required Permits Received
– Air Emissions Permit
– Dam Safety Permit
– Water Appropriation Permit
– Waste Water Discharge and Storm Water Discharge permit
– Wetland Impact Permit
– Permit to Mine
� Infrastructure – All Key Components Completed
– Rail spur completed
– Natural gas line completed
– Electric transmission lines and substations completed
– Roads, water and sewer completed
� Mining
– Mine Development Plan finalized
– Pre-stripping of mine is completed
– Mining equipment supplier finalized (Caterpillar)
– Slot payments for long lead drill, trucks and shovels has been released
� On Track for Target Milestones
– Start of production: Q3 2014
– Full ramp up: Q4 2015
Progress Summary – 64% Complete
Performance Highlights
28
Project Update
Engineering96%
� Basic engineering fully completed
� Technical specifications for all long lead items completed
� Most of the balance items to be ordered are technically cleared
� Basic engineering fully completed
� Technical specifications for all long lead items completed
� Most of the balance items to be ordered are technically cleared
Procurement72%
� 100% of long lead items ordered
� A items (>12 month delivery): 100% ordered
� B items (6-12 month delivery): 92% ordered
� C items (<6 month delivery): 50% ordered
� 25,592 MT of structural steel arrived on-site; 2,346 MT in transit
� 100% of long lead items ordered
� A items (>12 month delivery): 100% ordered
� B items (6-12 month delivery): 92% ordered
� C items (<6 month delivery): 50% ordered
� 25,592 MT of structural steel arrived on-site; 2,346 MT in transit
Construction53%
� Site development / preparation including site clearance, site grading, soil investigation etc. are complete
� Cumulative 78,400 cubic yards of concrete poured
� Fabrication of structural steel for buildings has commenced from off-site facility
� Completed installation of primary crusher
� AG and ball mill - AG shell erection in progress
�
�
�
�
�
�
��
�
�
(1) Occupational Safety & Health Administration.
Excellent safety record – 1.21 OSHA(1) incidence rate, compared to 4.0 average for the industry
PRIVATE & CONFIDENTIAL
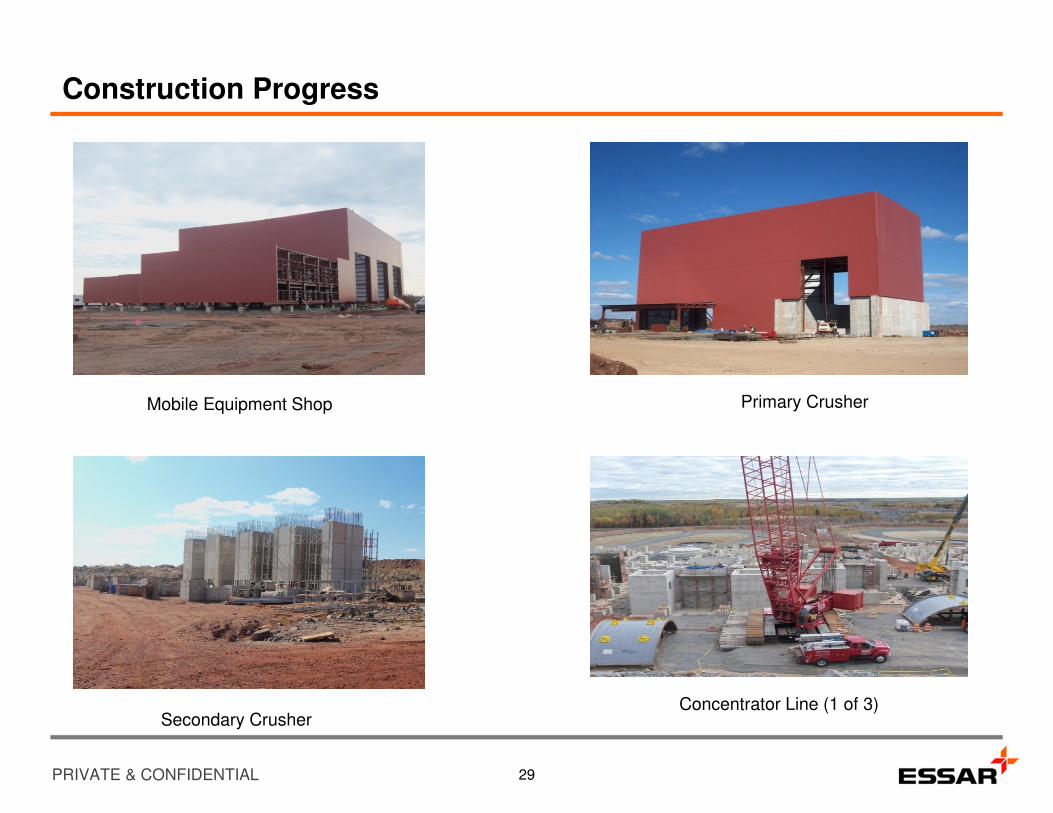
Construction Progress
Primary Crusher
Secondary CrusherConcentrator Line (1 of 3)
Mobile Equipment Shop
29
PRIVATE & CONFIDENTIAL
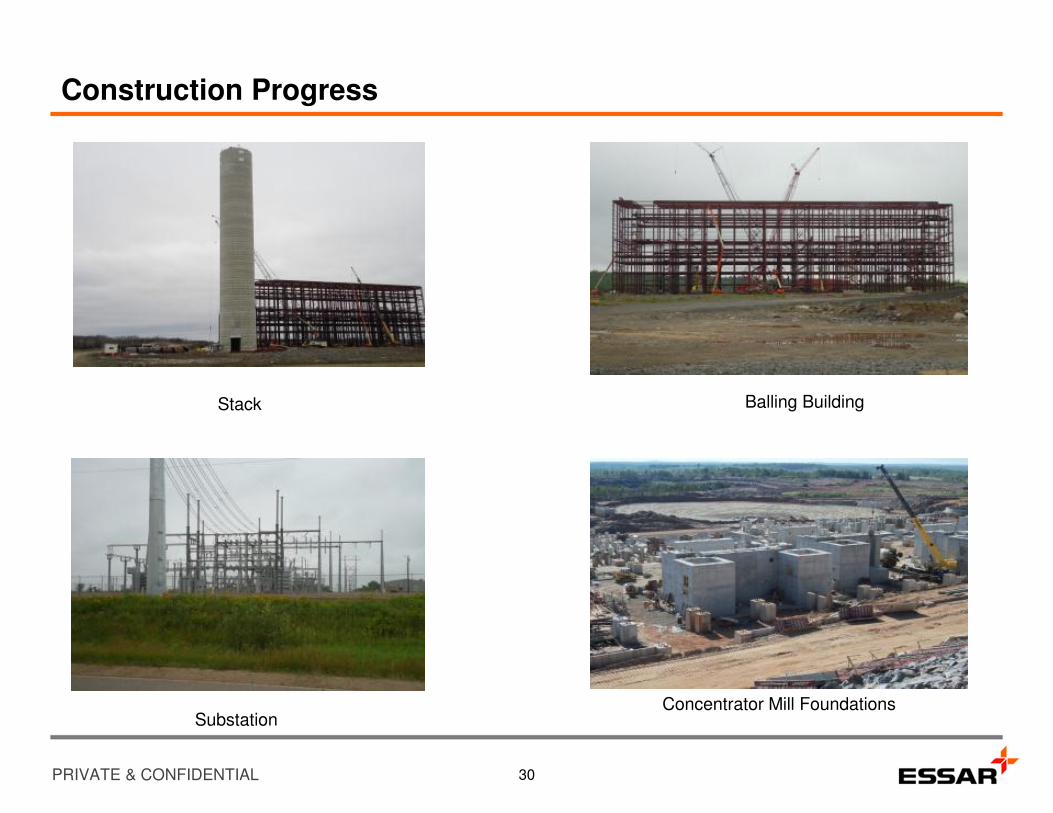
Construction Progress
Balling Building
SubstationConcentrator Mill Foundations
Stack
30
PRIVATE & CONFIDENTIAL
Cautionary Statement
CAUTIONARY STATEMENT
No stock exchange, securities commission or other regulatory authority has approved or disapproved the information contained in this presentation. The information contained in this presentation is current as of the date of the presentation, unless otherwise indicated. This information in a summary form and does not purport to be complete. It is not intended to be relied upon as advice to investors or potential investors and does not take into account the investment objectives, financial situation or needs of any particular investor. These should be considered, with or without professional advice, when deciding if an investment is appropriate.
By attending the presentation, or reading the presentation materials, you acknowledge and agree to the contents of this disclaimer.
No representation or warranty, express or implied, is made or given by or on behalf of Essar Steel Minnesota LLC (“ESML” or the “Company”) or any of their subsidiary undertakings or any of the directors, officers or employees of any such entities as to the accuracy, completeness or fairness of the information or opinions contained in this presentation and no responsibility or liability is accepted by any person for such information or opinions. This presentation is confidential and contains confidential information and may not be reproduce, further distributed or published. Distribution of this presentation may also be restricted or prohibited by law. Recipients are required to inform themselves of, and comply with, all such restrictions or prohibitions.
This presentation does not constitute or form part of any offer or invitation for the sale or purchase of securities or any of the assets, business or undertaking described herein nor shall it or any part of it form the basis of or be relied on in connection with, or act as any inducement to enter into, any contract or commitment whatsoever. It has been prepared by management of the Company for general information purposes only, and, in particular, is not intended to be, nor shall it be received or construed as, an “offering memorandum” or similar document.
Certain statements in this presentation have been derived from third party sources, including the Metal Strategies Inc. report, and are used by consent or are otherwise publicly available. The Company has not independently verified the information from such third party sources and takes no responsibility for such statements.
Certain Technical Information. Unless otherwise indicated, the Company has prepared the technical information in this presentation (“Technical Information”) based on information contained in the National Instrument 43-101 technical report for ESML obtained by the Company written by Met-Chem Canada Inc. and Barr Engineering Co. This report was prepared by or under the supervision of a qualified person (a “Qualified Person”) as defined in National Instrument 43-101 – Standards of Disclosure for Mineral Projects of the Canadian Securities Administrators (“NI 43-101”). For readers to fully understand the information in this presentation, they should read this report in its entirety, including all qualifications, assumptions and exclusions that relate to the information set out in this presentation which qualifies the Technical Information. Readers are advised that Mineral Resources that are not Mineral Reserves do not have a demonstrated economic viability. The NI 43-101 is intended to be read as a whole, and sections should not be read or relied upon out of context. The Technical Information is subject to the assumptions and qualifications contained in the NI 43-101.
The stated Mineral Reserves and Mineral Resources estimates have been prepared in accordance with NI 43-101 and are classified in accordance with the Canadian Institute of Mining, Metallurgy and Petroleum’s “CIM Definition Standards – For Mineral Resources and Mineral Reserves”. Mineral Reserves are equivalent to Proven and Probable Reserves as defined by the SEC Industry Guide 7. Mineral Reserve and Mineral Resource estimates reflect our reasonable expectation that all necessary permits and approvals will be obtained and maintained. Mining dilution and mining recovery have been applied in estimating the Mineral Reserves.
Certain of the Technical Information contained in presentation is based upon management’s expectations, which in some cases differ from the information that is contained in the Company’s NI 43-101 technical report. Such differences relate to, among other things, the anticipated start date of commercial production being in Q1 of calendar year 2014 vsJune 2013 and additional capital costs attributable to a debt offering vs no such additional cost being contemplated in the technical report.
Cautionary Note to United States and Other Investors Concerning Estimates of Measured, Indicated and Inferred Mineral Resources: This presentation uses the terms “Measured”, “Indicated” and “Inferred” Resources. United States investors are advised that while such terms are recognized by Canadian regulations, the United States Securities and Exchange Commission (“SEC”) only permits United States mining companies, in filings with the SEC, to disclose those mineral deposits that a company can economically and legally extract or produce in accordance with SEC Industry Guide 7. United States and other investors are cautioned not to assume that all or any part of Measured or Indicated Mineral Resources will ever be converted into Mineral Reserves or that all or any part of an Inferred Mineral Resource exists, or is economically or legally mineable.
31

PRIVATE & CONFIDENTIAL
Forward-Looking and Qualified Persons Statements
FORWARD-LOOKING STATEMENTS
Certain statements in this presentation constitute “forward-looking statements” or “forward-looking information” within the meaning of applicable securities laws (collectively, “forward-looking statements”). Such statements involve known and unknown risks, uncertainties and other factors which may cause the actual results, performance or achievements of the Company, or industry results, to be materially different from any future results, performance or achievements expressed or implied by such forward-looking statements or information. Such statements can be identified by the use of words such as “may”, “would”, “believe”, “plan”, “estimate”, and other similar terminology, or state that certain actions, events or results “may” or “would” be taken, occur or be achieved.
Forward-looking statements are based on a number of assumptions that may or may not prove to be correct, and involve significant risks and uncertainties, and accordingly should not be read as guarantees of future performance or results, and will not necessarily be accurate indicators of whether or not such results will be achieved. A number of factors could cause actual results to differ materially from the forward-looking statements set forth in this presentation.
The forward-looking statements contained in this presentation are based upon the Company’s current expectations and are made as of the date of this presentation. The Company cannot assure readers that actual results will be consistent with these forward-looking statements and they are expressly qualified in their entirety by this cautionary statement.
The Company does not assume any obligation to update or revise the forward-looking statements contained herein to reflect events or circumstances occurring after the date of this presentation.
QUALIFIED PERSONS STATEMENT
Met-Chem Canada Inc. and Barr Engineering Co. have prepared an independent NI 43-101 report for ESML’s iron ore project, including a 7.0 mtpa pellet plant with potential expansion to 14.0 mtpa. The NI 43-101 report was prepared by the following independent “qualified persons” as defined in NI 43-101: Daniel M. Gagnon Eng.; Yves A. Buro Eng.,; Denns Murr, a licensed professional engineer; and Michel L. Bilodeau, a licensed professional engineer.
Certain Technical Information in this presentation is derived from, and based upon, the aforementioned NI 43-101 report. Unless specifically noted otherwise, the disclosure contained herein relating to ESML’s iron ore project has been prepared and the data presented herein verified, including sampling, analytical and test data underlying the technical information under the authority and supervision of the authors, Daniel M. Gagnon Eng., Yves A. Buro Eng., or Michel L Bilodeau or Dennis Murr, “qualified persons” within the meaning of NI 43-101. Met-Chem Canada Inc. implemented a complete set of procedures aiming at checking the validity and reliability of the dataset used for the resources estimation in the NI 43-101 report. This verification included a review of databases, results from ESML and of the laboratory’s quality control samples, as well as a visit to the Lerchlaboratory and independent checks samples selected by Met-Chem Canada Inc’s qualified person.
Met-Chem Canada Inc. could not verify the results from Butler Taconite drilling since no core was available for viewing by Met-Chem Canada Inc. There are few examples of saved core from the early drilling programs and the only remaining core may be found in the Minnesota State core laboratory in Hibbing or Great Northern Iron Ore Properties. Surveying in the hole collars in ESML’s iron ore project area is probably precise, as the survey crew had to fulfill the need of good survey control for royalty payments. The practice used by the former operators generally favored saving pulps rather than drill core.
Based on these observations and results, Met-Chem Canada Inc. did not see any factor in the procedures applied in the core logging, sampling, sample preparation and analytical procedures that may significantly impact the integrity of the data. Met-Chem Canada Inc. believes the data is sufficiently reliable and adequate for the purposes of the resource estimation.
Each of Daniel M. Gagnon Eng., Yves A. Buro Eng., or Michel L Bilodeau or Dennis Murr consents to the inclusion in this presentation of the matters based on his information in the form and context in which it appears
32