Embed Size (px)
Citation preview

By: Mohammed Salem Awad
Keeping
The Same Rule
www.slideshare.net/airports_forecasting

ON
TARG
ET
Data Input
“Excellence is never an accident. It is always the result of high intention, sincere effort, and intelligent execution; it represents the wise choice of many alternatives - choice, not chance, determines your destiny.”
― Aristotle
ON
TARG
ET
Objective
Outline
Forecasting Approach
Input Data
Keeping The Same Rules
Seasonality Model
Seasonality Model
Forecasting Accuracy Matrix
Conclusions
Final Results
Trend Forecasting
Seasonality Model
Contact

ON
TARG
ET
Keeping The Same Rule

ON
TARG
ET
Keeping The Same Rule

ON
TARG
ET
Forecasting Approach
We will use the concept of
Forecasting by Objectives
to develop a fair matrix decision, so
forecasting by objective ; can be either by:
- Classical Method by Evaluation R2
- Setting Signal Tracking S. T. (36 ) to Zero
- Defining the Max/Min S. T. in the control
band.
- Targeting the final results of the annual long
term forecast.
- Reflecting the impact of the most recent
monthly data.

ON
TARG
ET
Forecasting Approach
Golden Rule -4 < Signal Tracking < + 4
And Coefficient of Determination > 80 %
Defining the Max/Min S. T. in the control band.

ON
TARG
ET
Data Input

ON
TARG
ET
Objective

ON
TARG
ET
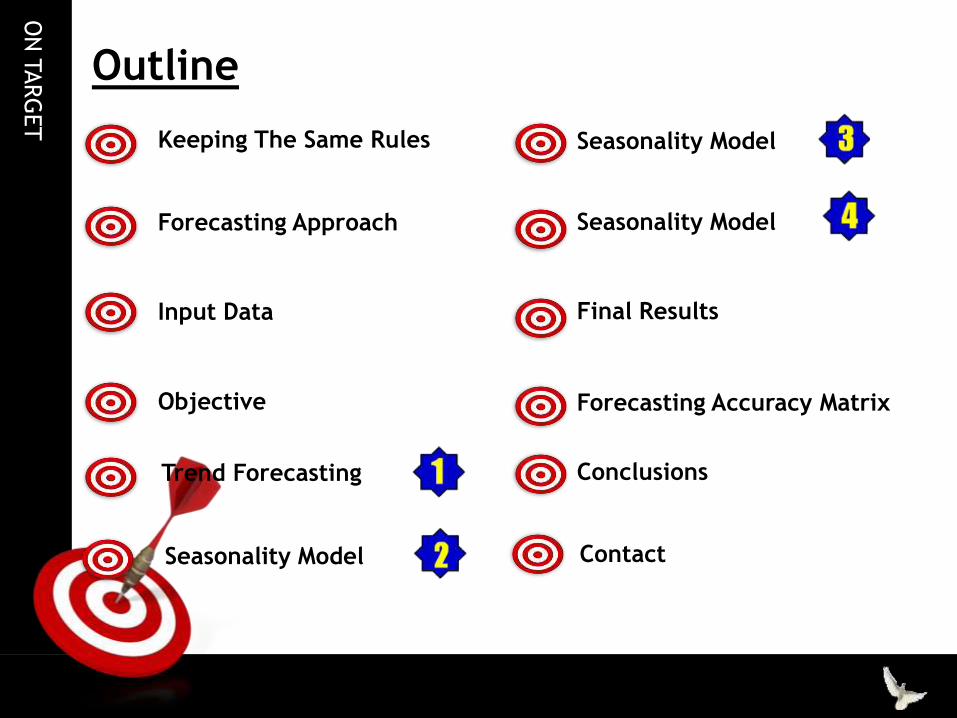
Trend Forecasting
Max/Min Signal Tracking Analysis:
The aim of this analysis is to keep
most of the signal tracking values in
constrain band ( -4 and + 4 )
maintaining high value of R2 .
The graph shows the residual values
by yellow color are out of the band
for 21 set data base, which reached
the highest extreme value by ± 5.71.
Input Data :
Based on 21 data set (21 years - from 1992- 2012). By implement trend approach
using the best of line fit ( Power Function ) the results of fair fitting are
R2 = 96.5 while Signal Tracking = ± 5.71
The Forecasting of 2014
= 54,203,771 Pax
ON
TARG
ET
Trend Forecasting
R2 = 96.5 while Signal Tracking = ± 5.71
The Forecasting of 2014 = 54,203,771 Pax

ON
TARG
ET
Seasonality Model ( Short Term ) :
Europe + Intercontinental = xGenerally speaking the normal
method to evaluate short range
data with seasonality impacts is
AREMA Model, but in this
analysis we will try use the best
of art technique that reflect two
parameters only, they are
displacement and Rotational.
Our approach is to find the line of fit that passing through the year
of accumulated forecasted figures of 12 months for 2014, and that
reflects a minimum errors and high relation factor ( R2 ) for both
series ( Europe & Intercontinental ) which satisfies the following
relation
Europe + Intercontinental = x

ON
TARG
ET
Seasonality Model ( Short Term ) :
Europe + Intercontinental = x

ON
TARG
ET
Seasonality Model ( Short Term ) :
Europe + Intercontinental = x

ON
TARG
ET
Seasonality Model ( Short Term ) :
Europe + Intercontinental = x

ON
TARG
ET
Seasonality Model ( Short Term ) :
Europe + Intercontinental = x

ON
TARG
ET
Seasonality Model ( Short Term ) :
O & D + Transfer = xGenerally speaking the normal
method to evaluate short range
data with seasonality impacts is
AREMA Model, but in this
analysis we will try use the best
of art technique that reflect two
parameters only, they are
displacement and Rotational.
Our approach is to find the line of fit that passing through the year
of accumulated forecasted figures of 12 months for 2014, and that
reflects a minimum errors and high relation factor ( R2 ) for both
series ( O & D and Transfer ) which satisfies the following relation
O & D + Transfer = x

ON
TARG
ET
Seasonality Model ( Short Term ) :
O & D + Transfer = x

ON
TARG
ET
Seasonality Model ( Short Term ) :
O & D + Transfer = x

ON
TARG
ET
Seasonality Model ( Short Term ) :
O & D + Transfer = x

ON
TARG
ET
Seasonality Model ( Short Term ) :
O & D + Transfer = x
ON
TARG
ET
Seasonality Model ( Short Term ) :
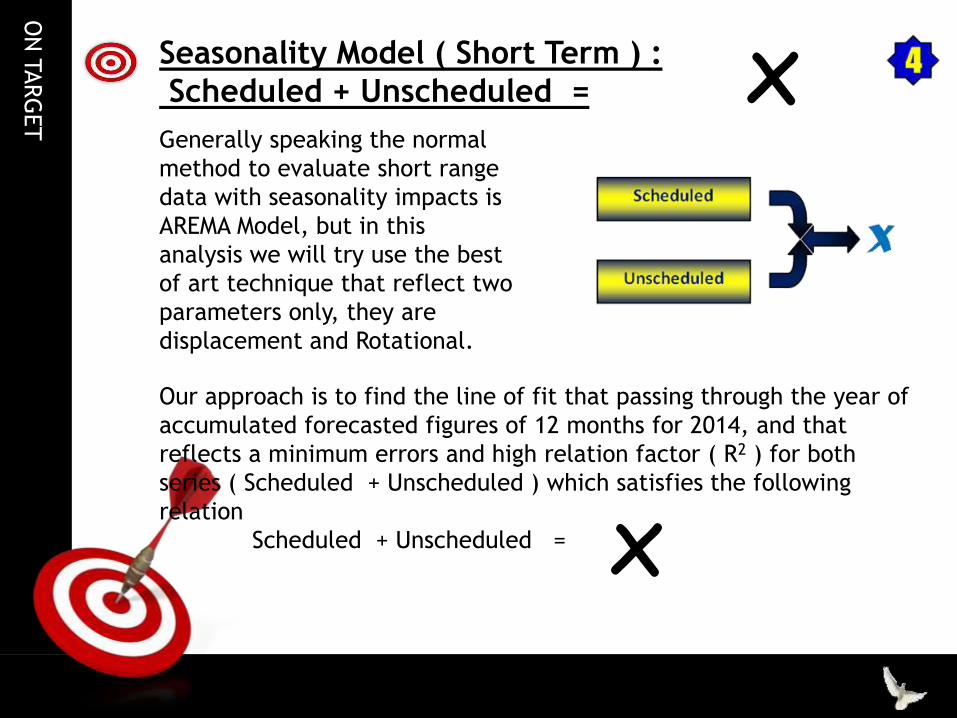
Scheduled + Unscheduled = xGenerally speaking the normal
method to evaluate short range
data with seasonality impacts is
AREMA Model, but in this
analysis we will try use the best
of art technique that reflect two
parameters only, they are
displacement and Rotational.
Our approach is to find the line of fit that passing through the year of
accumulated forecasted figures of 12 months for 2014, and that
reflects a minimum errors and high relation factor ( R2 ) for both
series ( Scheduled + Unscheduled ) which satisfies the following
relation
Scheduled + Unscheduled = x

ON
TARG
ET
Seasonality Model ( Short Term ) :
Scheduled + Unscheduled = x

ON
TARG
ET
Seasonality Model ( Short Term ) :
Scheduled + Unscheduled = x

ON
TARG
ET
Seasonality Model ( Short Term ) :
Scheduled + Unscheduled = x

ON
TARG
ET
Seasonality Model ( Short Term ) :
Scheduled + Unscheduled = x

ON
TARG
ET
KEEPING THE SAME RULE
ON
TARG
ET
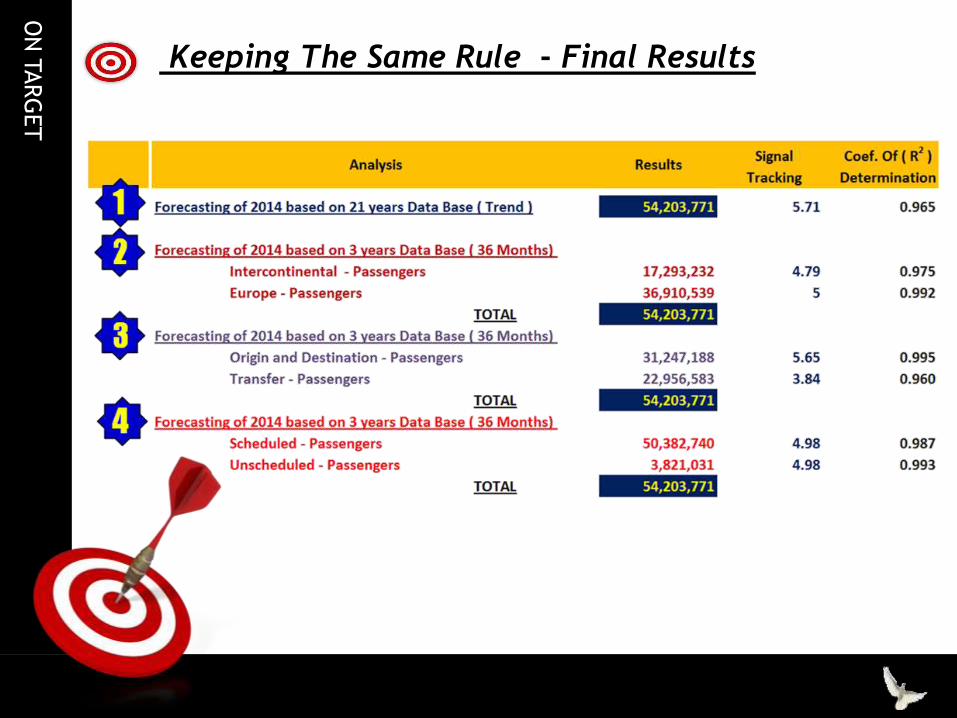
Keeping The Same Rule - Final Results

ON
TARG
ET
Forecasting Accuracy Matrix:
Forecasting Accuracy Matrix can be represented by four regions i.e Fair , Mislead, Poor, and Unrelated, for our cases : only one case (Transfer) is FAIR as it is satisfied the pre- request
constrains while most of the other segments are Mislead which actually fairs results that deny the mislead issue for the following reasons :
- The Signal Tracking values are defined on both sides of the trend line so the issue of displacement is not exist.- By visual inspection, the forecasted model is lay on the actual data.

ON
TARG
ET
Forecasting Accuracy Matrix:

ON
TARG
ET
Conclusions:
The study shows, that there is possibility to design our targets even
though to have same target, off course it hard task but it needs
patience and time to deliver a fine results.
The rule of the signal tracking is to refine the final results and
positioning the trend line in the final direction of analysis.
Two methods can be used to get the forecasted figure of 2014 =
= 54,203,771 Passengers either in one step ( analysis ) based on 72
data set – optimum case which is applied.
Or in two steps ( two analysis ) one optimum and the other one is
adjusted based on 36 data set each.
All data segment are reported, and any researcher can compare the
forecasted figure by the actual data to evaluate the forecasting
approach. The study shows high accuracy.

ON
TARG
ET
Welcome in the Club :

ON
TARG
ET
Contact :
Mohammed Salem Awad
Consultant
Email:
www.slideshare.net/airports_forecasting
Tel: 00967736255814
P.O. Box: 6002
Kahormaksar
Aden
Yemen
Date of Issue: 07 MAR 2014


![Development of the Prudent Man Rule for Fiduciary ... · 1951] DEVELOPMENT OF THE PRUDENT MAN RULE 493 This same sort of placid conservatism marked the fiduciary developments in much](https://img.pdfslide.us/doc/110x75/603179790a3077733d5974a3/development-of-the-prudent-man-rule-for-fiduciary-1951-development-of-the-prudent.jpg)