Embed Size (px)
Citation preview
Africa Harnessing Globalization
John Hancock
Counsellor, World Trade Organization
Globalization has transformed the development dynamic…
“Since 1950, 13 economies have grown at an average rate of 7 per cent a year or more for 25 years or longer. At that pace of expansion, an economy almost doubles in size every decade…. Growth of 7 per cent a year, sustained over 25 years, was unheard of before the latter half of the 20th century.
It is possible only because the world economy is now more open an integrated. This allows for fast-growth economies to import ideas, technologies, and know-how from the rest of the world…. An open economy also offers developing countries a deep, elastic market for their exports….
The growth of GDP may be measured up in the macroeconomic rooftops, but all the action is in the microeconomic undergrowth, where new limbs sprout and dead wood is cleared always”
Commission on Growth and Development, 2008
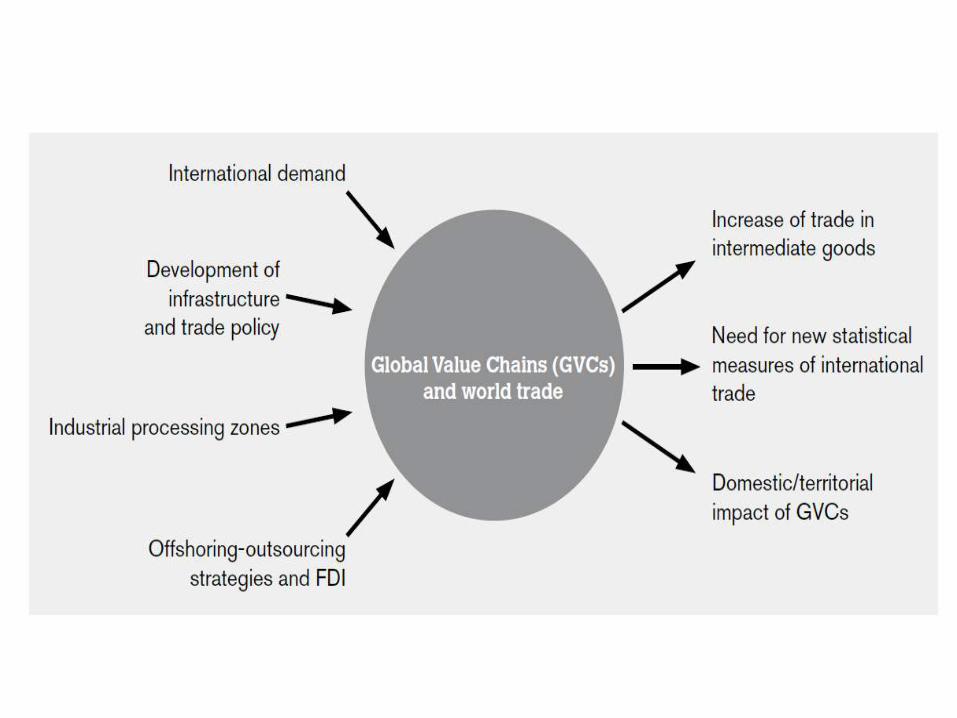
From trade in goods to trade in tasks… The rise of global value chains
‘Products are no longer “made in Japan” or “made in France”; they are truly “made in the world”.’
Pascal Lamy, WTO Director-General
“The integrated factory floor, which had dominated manufacturing since the 19th century, has been replaced with a network of individual suppliers specializing in specific services or phases or production. In this second great unbundling, production is “sliced and diced” into separate fragments that can be spread around the globe. … The value of the entire “global value chain” depends on the way companies are interconnected. The emergence of “Factory Asia” is one reflection this unfolding process”.
Trade Patterns and Global Value Chains in East Asia, WTO, 2009
Economic growth in Africa has been robust - driven by the boom in commodityprices, which led to very high growth in export values, especially for minerals, to newfast-growing markets such as India and China.
For example, EAC exports to the OECD countries were over 20 times the value ofthose to China in the first half of 2008 ($1.9 billion versus $88 million) but two yearslater were only six times higher ($1.7 billion versus $259 million). However, most ofthis new trade with China is in primary commodities, particularly precious metals,which are low value-added and/or capital intensive.
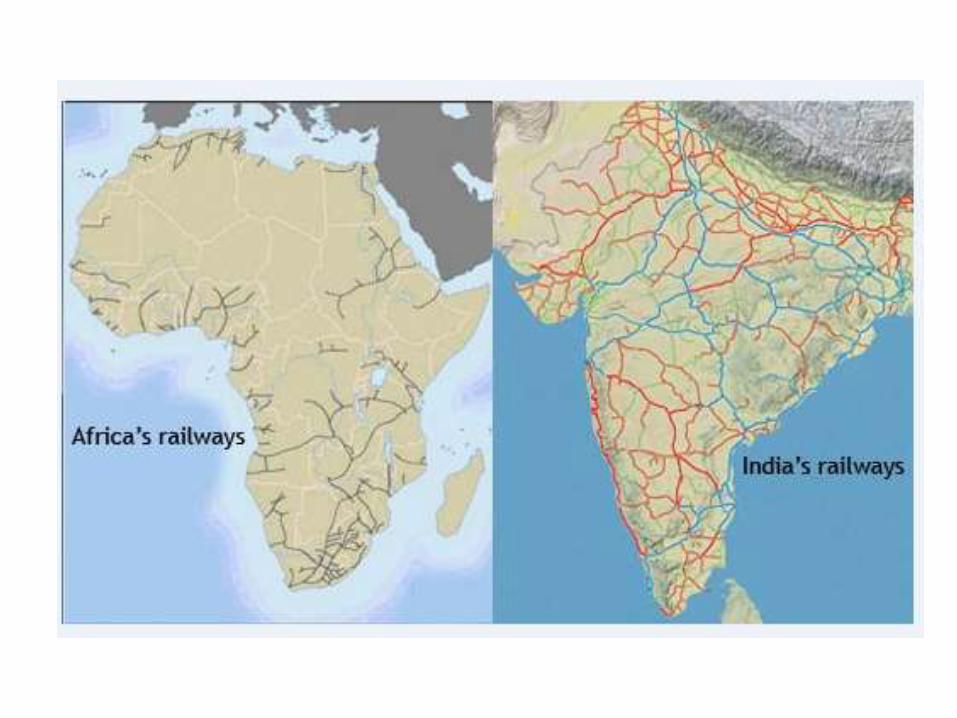
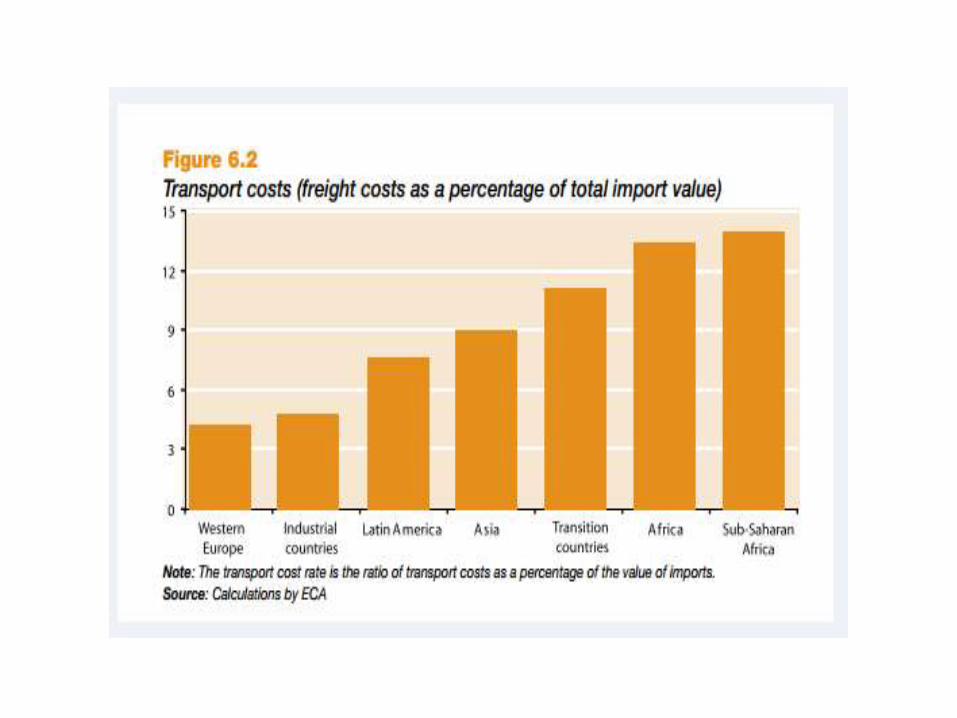
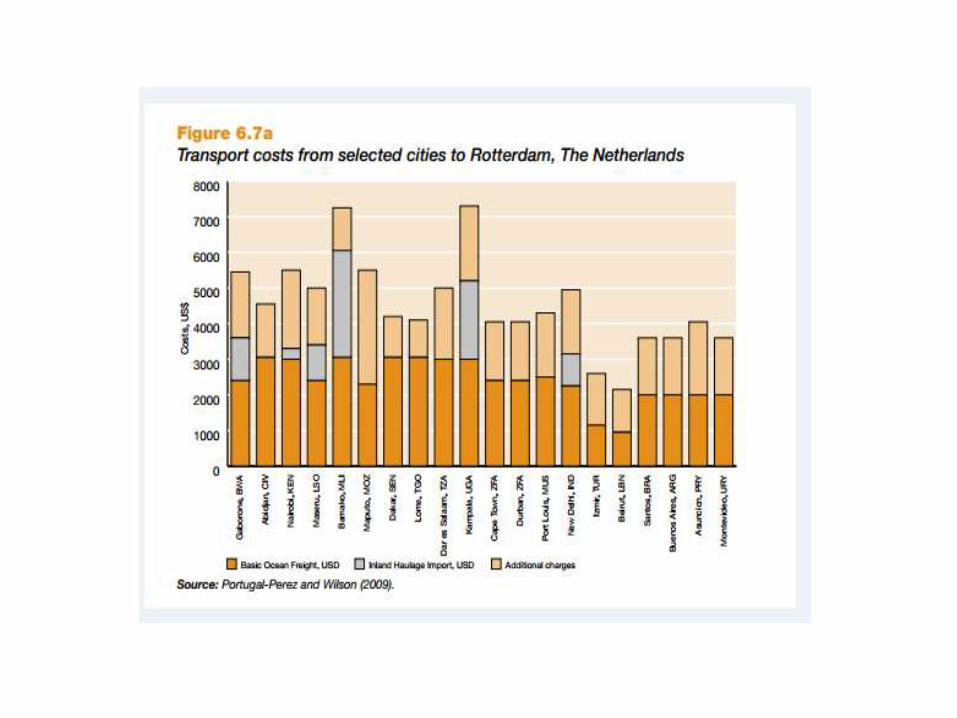
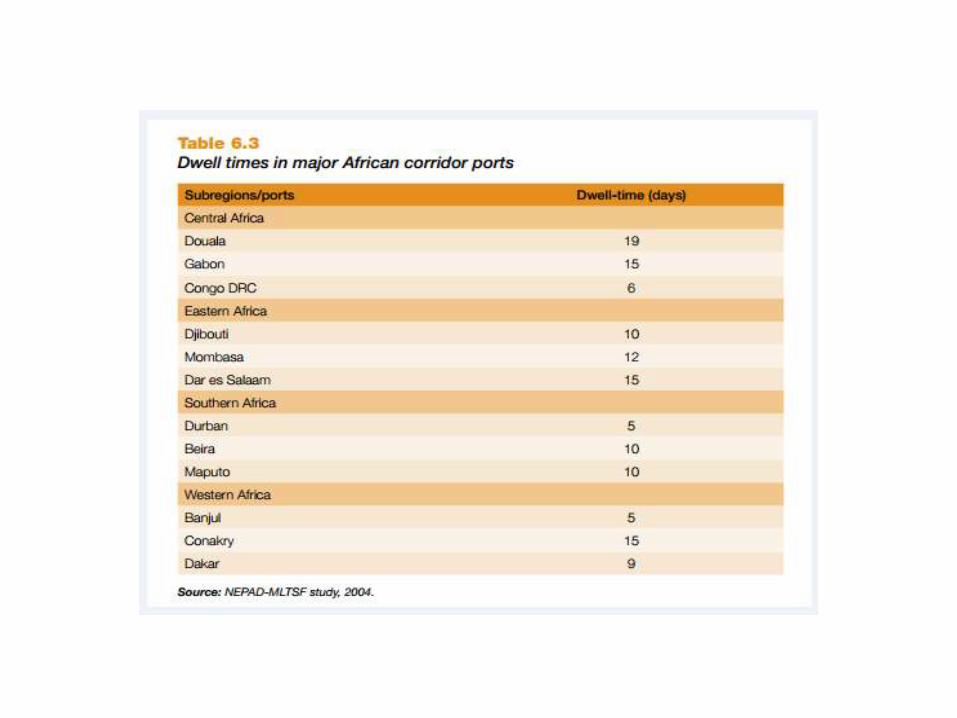
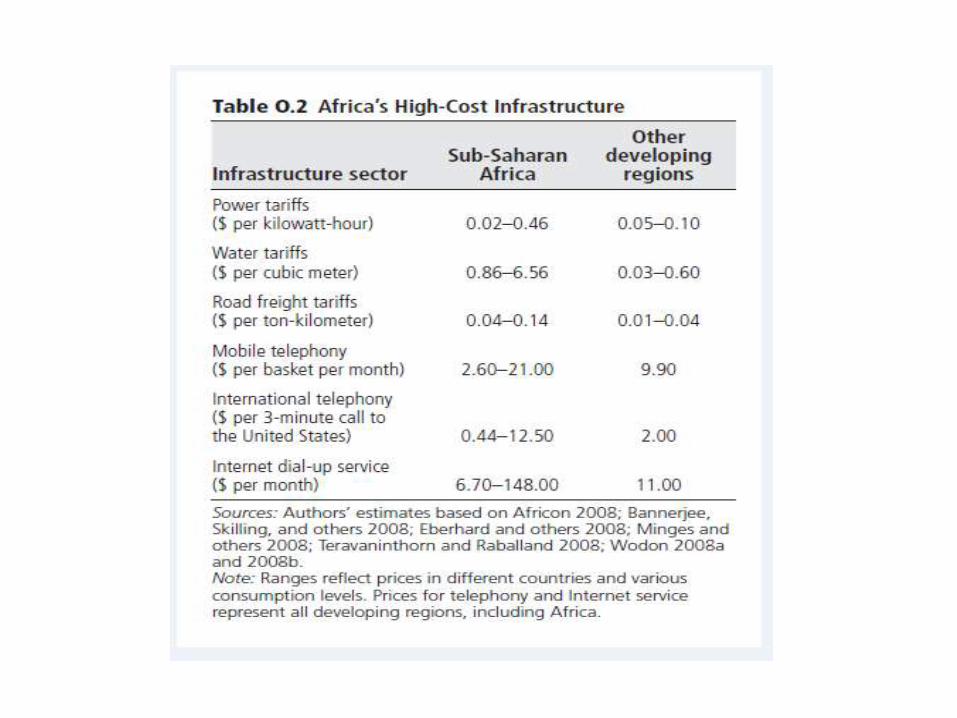
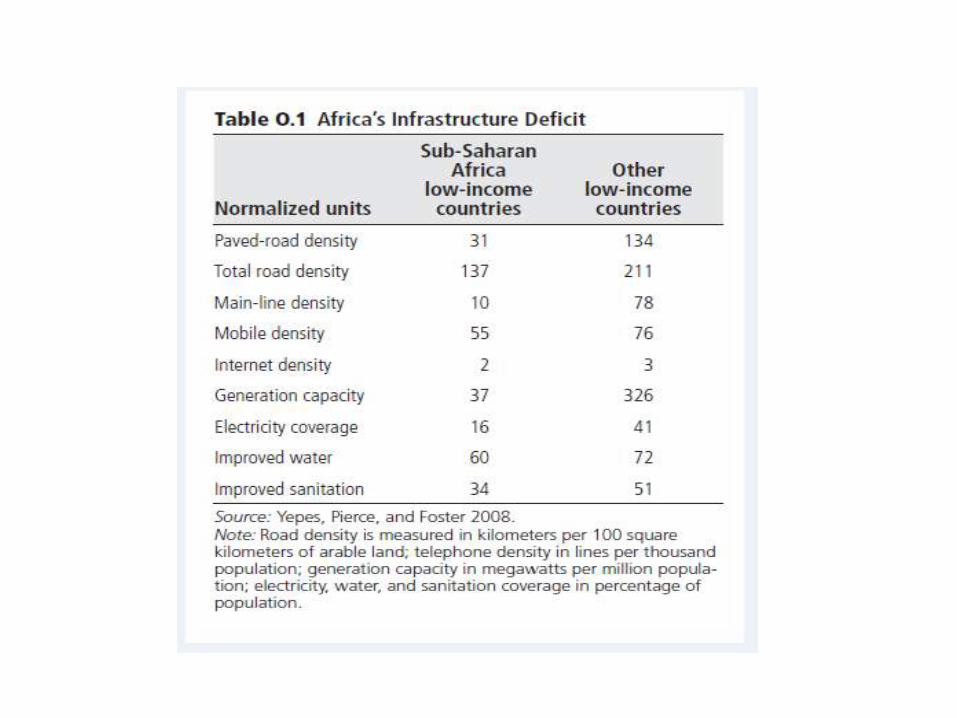
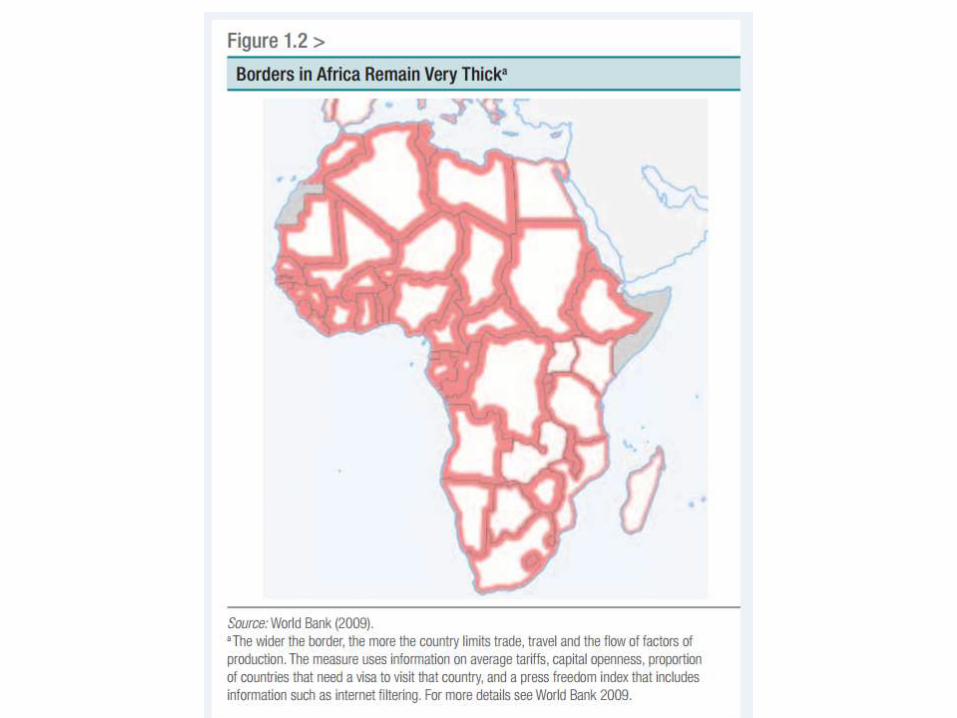
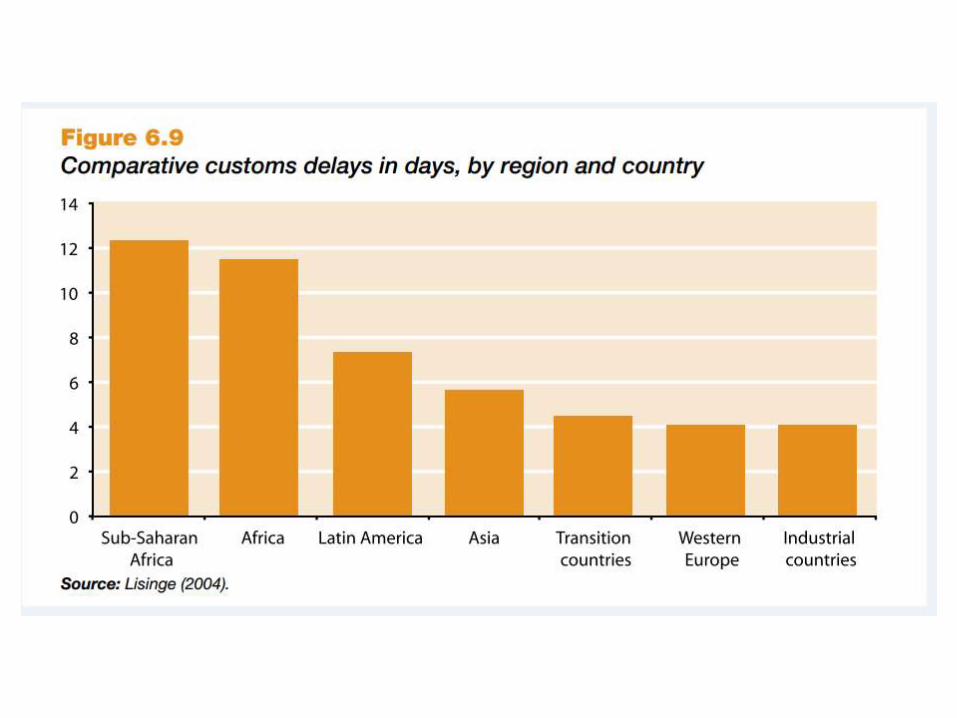
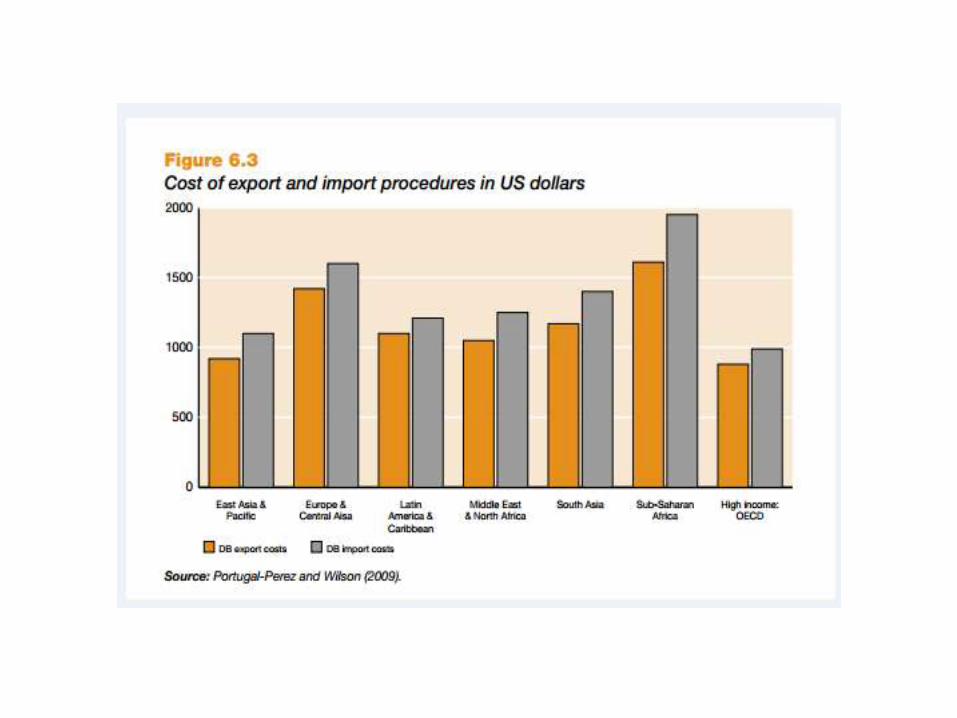
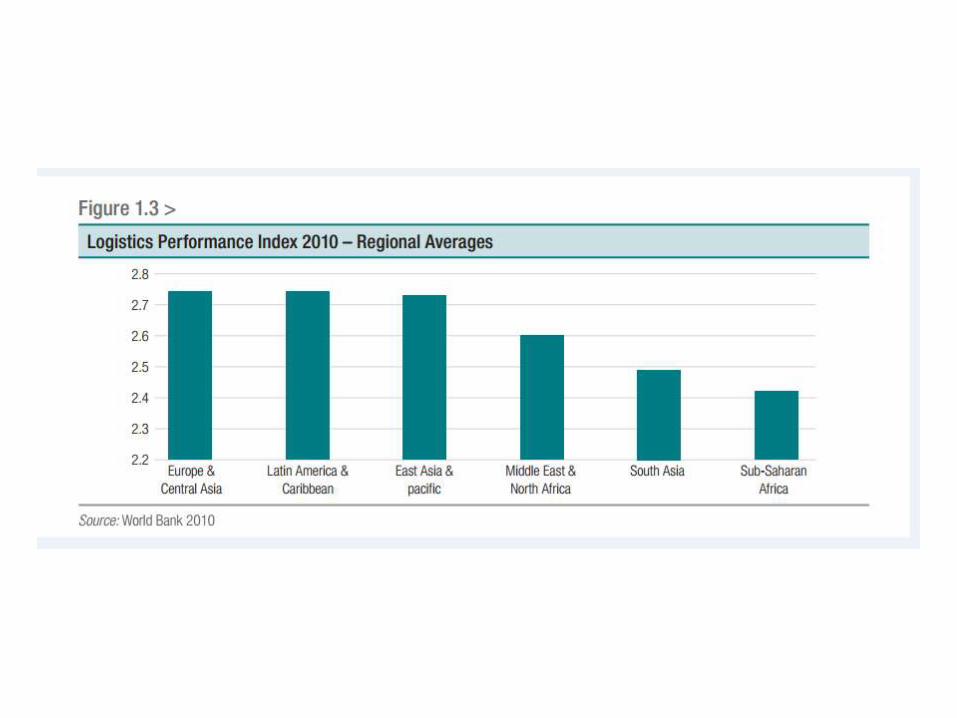
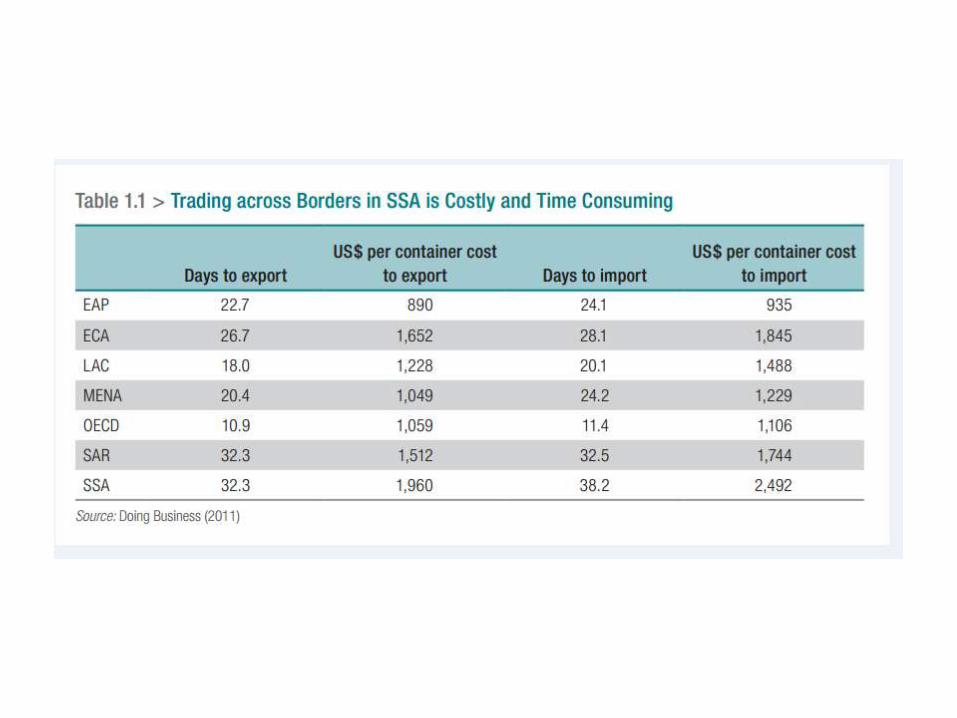
Regional integration in Africa has not provided a springboard for new exports to theglobal economy, as happened in East Asia, and cross-border trade remains primarilyinformal because the costs of trading across borders in Africa remain very high.
A key objectives in Africa is to diversify the export base away fromdependence on commodities and implement policies that allowmore people to participate in trade.
Regional integration and the boosting of intra-regional trade canplay a critical role in achieving these objectives in Africa. Deeperintegration of regional markets can lower trade and operatingcosts and relax the constraints faced by many firms in accessingthe essential services and skills that are needed to boostproductivity and diversify into higher value-added production andtrade.
There has been considerable success in removing tariffs on intra-regional trade,especially in Eastern and Southern Africa where, for example, the EAC hasimplemented a Customs Union and 85 per cent of intra-regional trade in SADC isduty free.
Nevertheless, the importance of tariff preferences has diminished. In the modernworld economy the scope for tariff preferences to drive economic integration andeconomic development has been very much neutered. This reflects, first, that allcountries in Africa reduced their external tariffs during the final 20 years of thelast century. This has reduced the scope for significant trade preferences in all buta few sectors.
Second, and more important, as tariffs have come down the need to address arange of non-tariff barriers that severely limit corss-border trade has becomeapparent. At the same time, the declines in communication costs and the splittingup of production chains to allow different tasks to be completed in differentlocations have transformed the nature of global trade. This has put a highpremium of on low transaction costs for shifting goods, services, people, andcapital across borders.
But trade priorities have moved beyond tariffs. Old regionalism focused on the mutual exchange of tariff preferences and trade in goods. The new regionalism concerns a wide range of regulatory issues and is about the "trade-investment-services nexus".
One imperative is to address the long-standing problem of overlapping trade agreements that have different commitments. Many countries are party to multiple agreements. This hampers trade flows by raising the costs involved for trades in meeting multiple sets of trade rules and gives rise to inconsistencies in the rules and procedures applied by the different trade agreements, distorting regional markets and causing severe problems of effective implementation.
-There is also the potential for regional production chains. In Asia, advanced production networks have deepened regionally and underpinned its spectacular global export growth from a poor, underdeveloped agricultural backwater to becoming the global factory over a 50-year period. In the 1960's, developing Asian economies lacked natural resources and had high levels of poverty. There seemed to be little prospect of economic advancement. However, Asian economies had ample supplies of inexpensive, productive manpower, not unlike many African countries today. They were also close to an expanding high-income Japan, with firms seeking to expand to lower cost destinations. Subsequently, intra-regional trade in Asia increased significantly, particularly in the production of parts and components with each process relocating to the most cost-effective destination in the region.

12
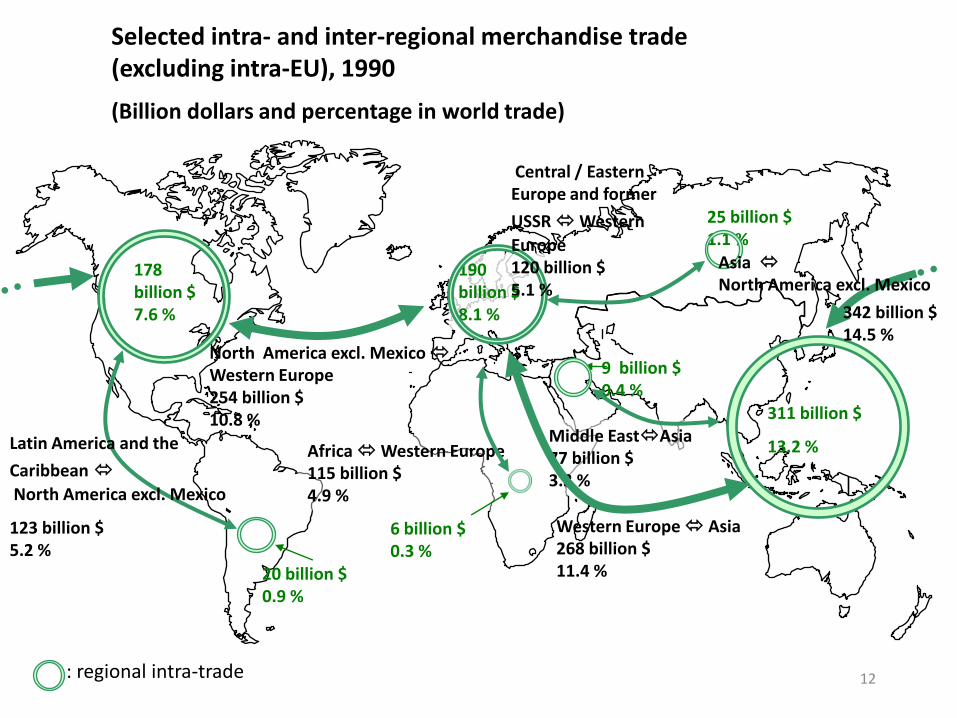
Selected intra- and inter-regional merchandise trade (excluding intra-EU), 1990
(Billion dollars and percentage in world trade)
190 billion $8.1 %
311 billion $
13.2 %
178 billion $ 7.6 %
North America excl. Mexico Western Europe254 billion $10.8 %
Western Europe Asia268 billion $11.4 %20 billion $
0.9 %
6 billion $0.3 %
9 billion $0.4 %
25 billion $1.1 %
Latin America and the
Caribbean
North America excl. Mexico
123 billion $5.2 %
Africa Western Europe115 billion $4.9 %
342 billion $14.5 %
: regional intra-trade
Central / Eastern Europe and former
USSRWestern
Europe120 billion $5.1 %
Middle EastAsia77 billion $3.3 %
Asia North America excl. Mexico
13
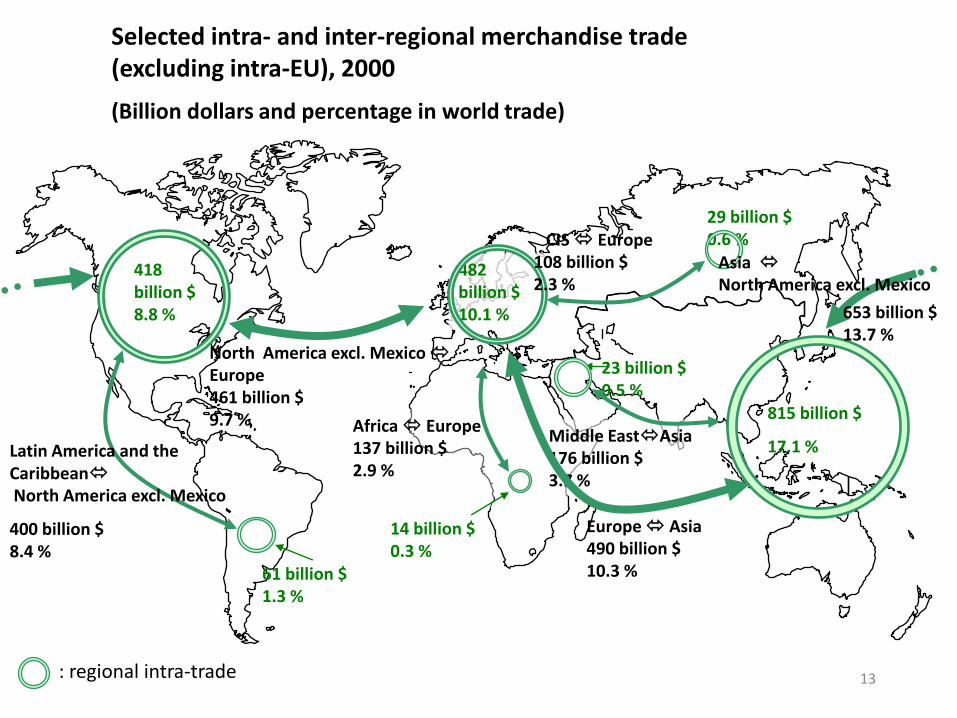
Selected intra- and inter-regional merchandise trade (excluding intra-EU), 2000
(Billion dollars and percentage in world trade)
482 billion $10.1 %
815 billion $
17.1 %
418 billion $ 8.8 %
Europe Asia490 billion $10.3 %61 billion $
1.3 %
14 billion $0.3 %
23 billion $0.5 %
29 billion $0.6 %
Africa Europe137 billion $2.9 %
653 billion $13.7 %
: regional intra-trade
CIS Europe108 billion $2.3 %
Middle EastAsia176 billion $3.7 %
North America excl. Mexico Europe461 billion $9.7 %
Latin America and the CaribbeanNorth America excl. Mexico
400 billion $8.4 %
Asia North America excl. Mexico
14
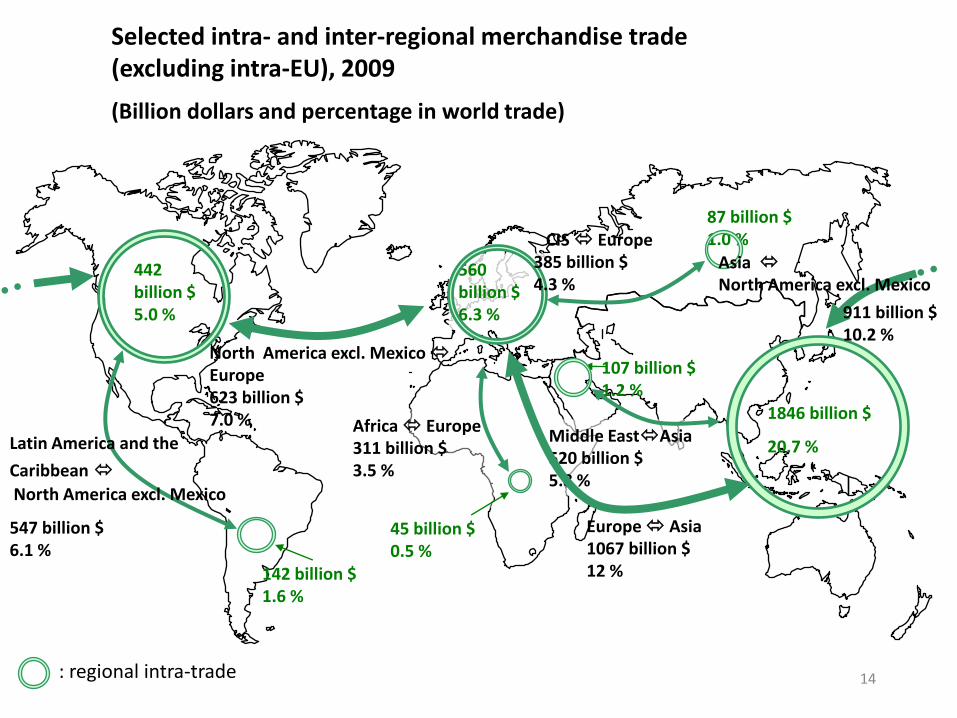
Selected intra- and inter-regional merchandise trade (excluding intra-EU), 2009
(Billion dollars and percentage in world trade)
560 billion $6.3 %
1846 billion $
20.7 %
442 billion $ 5.0 %
Europe Asia1067 billion $12 %142 billion $
1.6 %
45 billion $0.5 %
107 billion $1.2 %
87 billion $1.0 %
Africa Europe311 billion $3.5 %
911 billion $10.2 %
: regional intra-trade
CIS Europe385 billion $4.3 %
Middle EastAsia520 billion $5.8 %
North America excl. Mexico Europe623 billion $7.0 %
Latin America and the
Caribbean
North America excl. Mexico
547 billion $6.1 %
Asia North America excl. Mexico
15
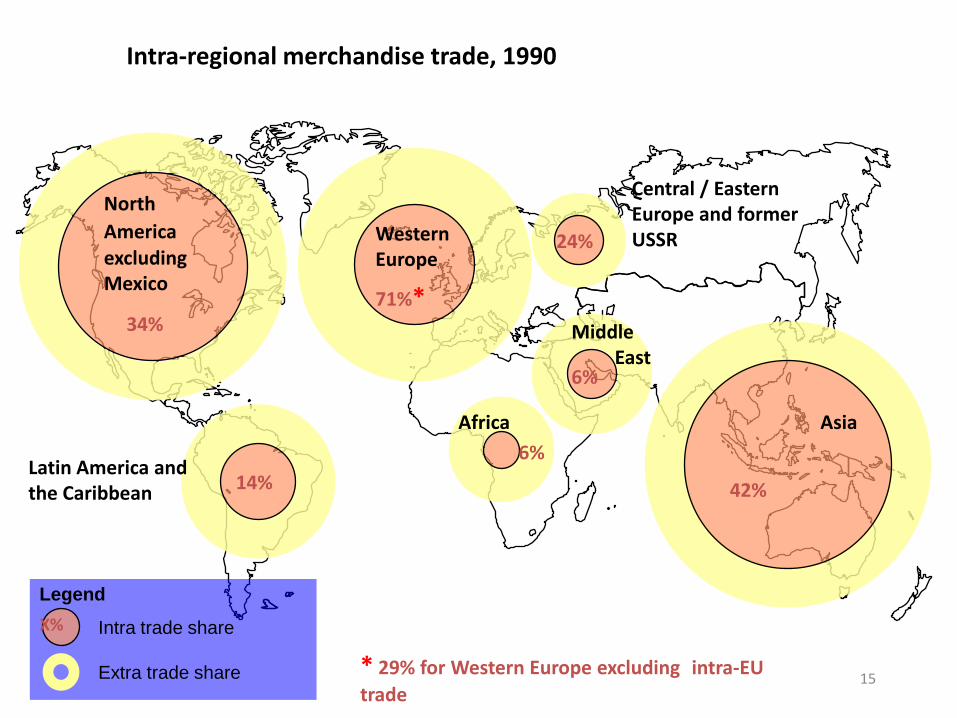
Intra-regional merchandise trade, 1990
Central / Eastern Europe and former USSR
Africa
6%
24%
Asia
42%
WesternEurope
71%*Middle
East6%
Latin America and the Caribbean 14%
North
Americaexcluding Mexico
34%
X%
Extra trade share
Intra trade share
Legend
* 29% for Western Europe excluding intra-EU
trade
16
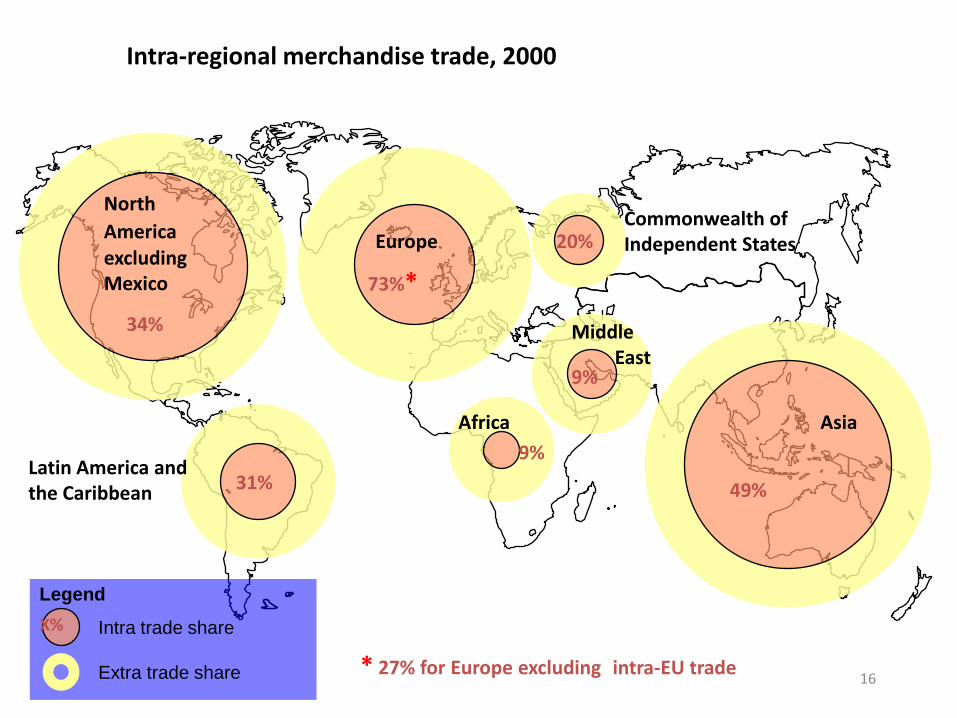
Intra-regional merchandise trade, 2000
Commonwealth of Independent States
Africa
9%
20%
Asia
49%
Europe
73%*
Middle East
9%
31%
34%
X%
Extra trade share
Intra trade share
Legend
* 27% for Europe excluding intra-EU trade
North
Americaexcluding Mexico
Latin America and the Caribbean
17
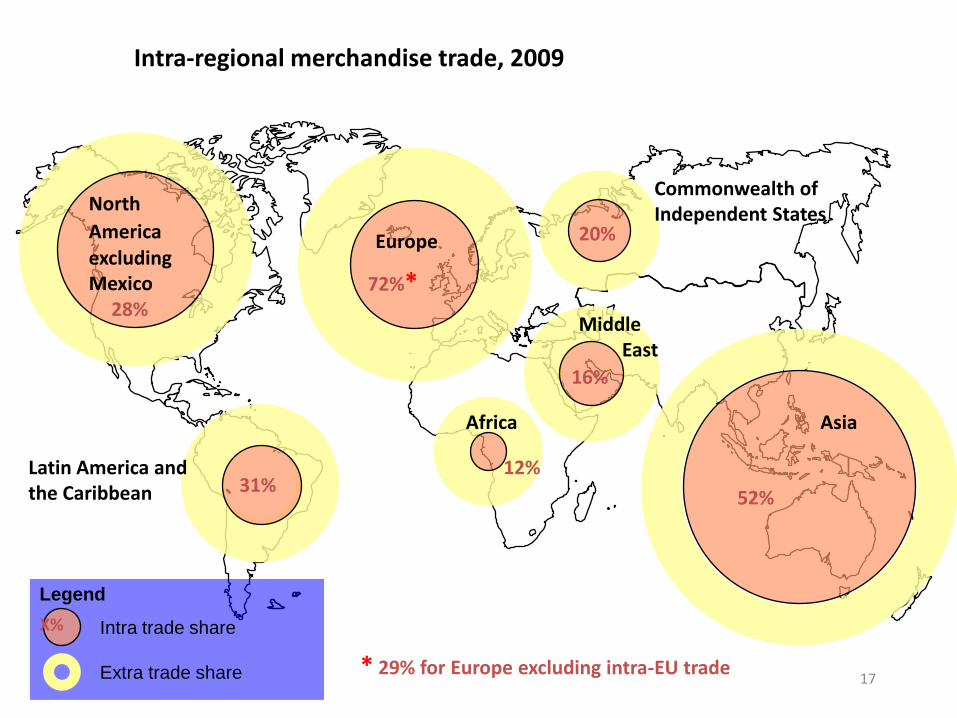
Intra-regional merchandise trade, 2009
Commonwealth of Independent States
Africa
12%
20%
Asia
52%
Europe
72%*
Middle East
16%
31%
28%
X%
Extra trade share
Intra trade share
Legend
* 29% for Europe excluding intra-EU trade
North
Americaexcluding Mexico
Latin America and the Caribbean