Embed Size (px)
Citation preview

1
Evaluation of Share Price of A.G. Barr PLC
2
ABSTRACT
The main aim of this dissertation is to evaluate the share price of A. G. Barr Plc. and to provide
recommendations to investors. For this, the existing literature is reviewed and various theories on
capital structure decision are analysed. The traditional approach and MM approach of capital
structure are examined under this. Using weighted average cost of capital, A.G. Barr’s capital
structure is evaluated. It is mainly composed of equity and reserves and only 0.1 of the capital is
debt. As the company is less depending on debt, its interest rates are very low. The profitability,
liquidity and financial performance of the company are good. The cash flow statement analysis
reveals that the company efficiently meets its operating activities without any burden.
Using Dividend Discount Model, discounted cash flows and abnormal earnings method, A. G.
Barr’s share price is evaluated as per which the company’s current trading price is overvalued.
However, all these method have certain limitations. It mainly depends on the historic dividend
and forecasts the future dividends which may not be accurate in the real scenario. This method is
also not ideal for firms that do not pay dividends. The procedures of both discounted cash flow
method and discounted abnormal earnings are different, and the values mainly depend on
forecasts which may not be accurate in true situations. The trends of share price reveal that the
price is volatile to major up hills and down trends constantly. Furthermore, the forecasted share
price is far ahead of the current market price. Hence, ideally it is recommended buy the share.
3
Contents
1. Introduction ....................................................................................................................................8
1.1. Objectives ................................................................................................................................8
1.2. Structure ..................................................................................................................................8
1.3. Company Overview ..................................................................................................................8
1.4. Limitations of Analysis ........................................................................................................... 10
2. The Outlook for the Economy........................................................................................................ 12
2.1. Global Economy .................................................................................................................... 12
2.2. UK Economy ......................................................................................................................... 14
2.3. Implications for A. G. Barr Plc. ............................................................................................... 16
2.4. Conclusion............................................................................................................................. 16
3. The Structure and Outlook for the Industry ..................................................................................... 17
3.1. The UK Soft drink Industry..................................................................................................... 17
3.2. The Outlook for Soft drink Industry ......................................................................................... 18
3.3. The Five Forces...................................................................................................................... 19
3.3.1. Threat of New Entrants..................................................................................................... 19
3.3.2. Rivalry among the Existing Firms ..................................................................................... 20
3.3.3. Bargaining Power of Suppliers .......................................................................................... 21
3.3.4. Bargaining Power of Buyers ............................................................................................. 21
3.3.5. Threat of Substitutes......................................................................................................... 21
3.4. Conclusion............................................................................................................................. 22
4. Literature Review ......................................................................................................................... 23
4.1 Introduction ............................................................................................................................ 23
4.2 Dividend Policy theoretical framework ..................................................................................... 26
4.3 Hypothesis of Dividend Irrelevance .......................................................................................... 27
4.4 Common Irrelevance Thesis ..................................................................................................... 28
4.5 M&M Irrelevancy Proof ........................................................................................................... 29
4.6 The conception of earning theory............................................................................................. 30
4.7 Theoretical review of Macroeconomic factors and Dividends ..................................................... 31
4.8 Dividends and Models of Equilibrium....................................................................................... 32
4.9 Dividend policy Signaling effect .............................................................................................. 32
4.10 Dividend Policy behavioral models ......................................................................................... 33
5. The Capital Structure Decision ...................................................................................................... 37
4
5.1. Introduction ........................................................................................................................... 37
5.2. Various Theories on Capital Structure...................................................................................... 38
5.3. The Traditional Approach ....................................................................................................... 42
5.3.1. Explanation ..................................................................................................................... 42
5.3.2. Aside............................................................................................................................... 42
5.4. The Economic Approach......................................................................................................... 43
5.3.1. MM Propositions without Taxes........................................................................................ 43
5.3.1. MM Propositions with Corporate Taxes............................................................................. 45
5.5. Imperfections ......................................................................................................................... 46
5.6. Additional Research ............................................................................................................... 47
5.7. Conclusion............................................................................................................................. 47
6. Company Analysis ........................................................................................................................ 48
6.1. Introduction ........................................................................................................................... 48
6.2. Strategic Capabilities .............................................................................................................. 48
6.3. Board of Directors and Corporate Governance.......................................................................... 49
6.4. Capital Structure .................................................................................................................... 50
6.4.1. Shareholding.................................................................................................................... 51
6.4.2. Leverage.......................................................................................................................... 51
6.5. Financial Performance ............................................................................................................ 52
6.5.1. Profitability ..................................................................................................................... 52
6.5.2. Liquidity.......................................................................................................................... 54
6.5.3. Cash Flow Analysis .......................................................................................................... 55
6.6. SWOT Analysis ..................................................................................................................... 55
6.7. Conclusion............................................................................................................................. 57
7. Company Share Valuation ............................................................................................................. 58
7.1. Introduction ........................................................................................................................... 58
7.2. Dividend Discount Model ....................................................................................................... 58
7.2.1. Discount Rate .................................................................................................................. 58
7.2.2. Discount Cash Flow Method ............................................................................................. 59
7.2.3. Discount Abnormal Earnings Method ................................................................................ 61
7.3. Sensitivity Analysis ................................................................................................................ 64
7.4. Limitations of Share Valuation Methods .................................................................................. 69
7.5. Technical Analysis ................................................................................................................. 69
5
7.6. Conclusion............................................................................................................................. 72
8. Conclusion and Recommendations ................................................................................................. 73
8.1. Summary ............................................................................................................................... 73
8.2. Share Price Performance ......................................................................................................... 74
8.3. Recommendations .................................................................................................................. 74
Appendices ...................................................................................................................................... 75
Appendix 1 Assumptions for Valuation Models .............................................................................. 75
Appendix 2 Predicted Income Statement and Balance Sheet ............................................................ 77
Appendix 3 Weighted Average Cost of Capital ............................................................................... 78
References ....................................................................................................................................... 79
6
List of Tables
Table 1 Shows the Profitability Ratios of A. G. Barr in 2013 and 2014 38
Table 2 Shows the Profitability Ratios of A. G. Barr and its Competitors 38
Table 3 Shows the Liquidity Ratios of A. G. Barr in 2013 and 2014 39
Table 4 Shows the Liquidity Ratios of A. G. Barr and its Competitors 39
Table 5 Shows the Discounted Cash Flows of A. G. Barr 45
Table 6 Shows the Discounted Abnormal Earnings of A. G. Barr 48
Table 7 Shows the Probable Equity Values with Varying WACC and growth rate for DCF
49
Table 8 Shows the Probable Share Values with Varying WACC and growth rate for DCF 50
Table 9 Shows the Probable Equity Values with Varying WACC and growth rate for Abnormal
Earnings 51
Table 10 Shows the Probable Equity Values with Varying WACC and growth rate for Abnormal
Earnings 52

7
List of Figures
Figure 1 Global outlook for GDP during 2014 – 2025 12
Figure 2 Trends of Share price of A. G. Barr Plc. for the last six months 41
Figure 3 Trends of Share price of A. G. Barr Plc. for the last five years 42
8
1. Introduction
1.1. Objectives
This dissertation is written as part of Master’s degree. The objectives of this dissertation are to
evaluate the share price of A.G. Barr Plc. and make a forecast based on the annual reports of last
five years. It is also aimed to make recommendations to current and prospective investors
whether to buy, hold or sell the shares of the company.
1.2. Structure
This dissertation consists of total seven chapters. The first chapter begins with the objectives of
the dissertation and consists of the structure of dissertation, company overview and limitations of
analysis. Chapter 2 describes the outlook of economy and its implications for A.G. Barr Plc.,
chapter 3 states the structure and outlook for the industry, chapter 4 examines the existing
literature on the topic i.e. the capital structure of the company, chapter 5 indicates the analysis of
A.G. Barr Plc. with the help of ratios and SWOT1, chapter 6 discusses the valuation of company
shares using various available models such as Dividend Discount Model, and sensitivity analysis,
and chapter 7 contains the conclusions and recommendations.
1.3. Company Overview
A.G. Barr Plc. is a Scottish soft drink manufacturing company that is listed on the London stock
exchange. The Company in this dissertation is sometimes referred as A.G. Barr for the sake of
convenience. It was founded by Robert Barr in 1876 and headquartered at Cumbernauld. The can
line here can produce 690 million cans per year. The company is commonly known as Barr’s.
1 Strengths, Weaknesses, Opportunities and Threats
9
The company is renowned for its IRN-BRU for more than a century. It has a huge market
throughout the UK. Other brands of A.G. Barr Plc. include KA, Rubicon, Barr, Simply, St
Clements, Findlays, Abbot’s, Sun exotic, Strathmore Water, D‘N’B and Tizer (A.G. Barr Plc.,
2014). Their partnership brands are Orangina, Rockstar and Snapple (A.G. Barr Plc. Annual
Report, 2014).
The popular brand of A. G. Barr - IRN-BRU is famous in Scotland and the bestselling drink
there after scotch. The company has constantly growing year by year with their three vital
channels that distribute soft drinks in the UK. These include take home category that contains
several grocers, impulse that consists of newsagents, corner shops etc. and premise that has
hotels, pubs, cafes, restaurants, clubs etc. (A.G. Barr Plc. (a), 2014).
The turnover of the company has increased by 6.9%2 and the profit margin has increased by
13.5%3 in 2014. The company wants to establish long-term relationships by focusing on their
needs, creates brands accordingly using innovations. The performance of A.G. Barr is increased
due to growth in carbonate drinks which is raised by 8.2% in the total value. IRN-BRU and Barr,
the main carbonate brands promoted this growth. Except the brand KA all other brands exhibit
some growth in terms of sales and revenue (A.G. Barr Plc. Annual Report, 2014).
In terms of brands, IRN-BRU is the major brand that is sold more in 2014 and accounted for
4.3%4 growth in sales. In terms of geography, Scotland contributed to about 40% of sales
2 A.G. Barr Plc. Annual Report and Accounts 2014, p. 4 3 A.G. Barr Plc. Annual Report and Accounts 2014, p. 4 4 A.G. Barr Plc. Annual Report and Accounts 2014, p. 8
10
revenue. Wales and England contributed to the remaining of their domestic sales revenue which
has grown by 9% (A.G. Barr Plc. Annual Report, 2014).
Among their partnership brands, Rockstar is the best performing brand which is growing over
the years. Different flavors are introduced with various pack designs to attract customers. Even
though the growth for energy drink market is slow, Rockstar has been proving its performance
with a growth of more than 60%5 (A.G. Barr Plc. Annual Report, 2014).
The competitors of A. G. Barr Plc. in the UK are Britvic Plc., Cadbury Schweppes Plc. and
Nichols Plc. The main global competitors of the company are The Coca–Cola Company and
PepsiCo Inc. They are referred to as Britvic, Cadbury Schweppes or Cadbury, Nichols, Coca–
Cola and Pepsi for the sake of convenience. The company proposed to merge with one of its
competitors Britvic Plc. It was approved by both boards and also after getting the approval of
Competition Commission6. But, later the decision was aborted.
1.4. Limitations of Analysis
The share price valuation is done using Dividend Discount Model which is useful only for the
companies that pay dividends. Other models are also described but not done due to constraints
like time.
While comparing the performance of the company with its competitors, only the significant
rivals are taken. There are mainly three domestic competitors and two global companies that are
5 A.G. Barr Plc. Annual Report and Accounts 2014, p. 11 6 Competition Commission provisionally cleared the merger of A.G. Barr Plc. with Britvic Plc. (BBC News, 2013).

11
significant to compete with A.G. Barr as described in the previous section. The comparison of
performance with limited number of competitors may limit the results and analysis.
12
2. The Outlook for the Economy
Under this chapter, the outlook of global economy as well as the UK economy are studied. The
consequences of them on the chosen company i.e. on A.G. Barr Plc. are also discussed. The
global economy and the macro-economic factors that influence the industry are analyzed and the
UK economy as well. This chapter concludes with the consequences of these economies on A.G.
Barr.
2.1. Global Economy
The GDP for global economy after adjusting for inflation has increased to 3.3%7 in 2014 from
2.9% in 2013 which is significant in developed economies. Though the Eurozone is expected to
grow, it is reversed in 2014 due to bad weather. The growth of GDP in developing economies
has decreased slightly in 2014. The economic transformations of China slowed down its
increase. Emerging economies such as Russia, Brazil and Central Asia exhibit a deceleration in
growth rates, whereas India, Mexico and other emerging nations in Asia witness minor
improvement in their performance (Conference-board.org, 2014).
For a third year in row, developing countries are facing a disappointing growth below 5 percent.
This is due to the weakness in first quarter of 2014 which hindered an anticipated increase in
economic activity according to recent Global Economic Prospects report of World Bank. This
report was delivered on 10 June, 2014. On the other hand, the recovery in high income countries
is increasing in a fast pace even though United States faced a weakness in the first quarter. It is
7 Conference-board.org. (2014). Global Economic Outlook 2014.
13
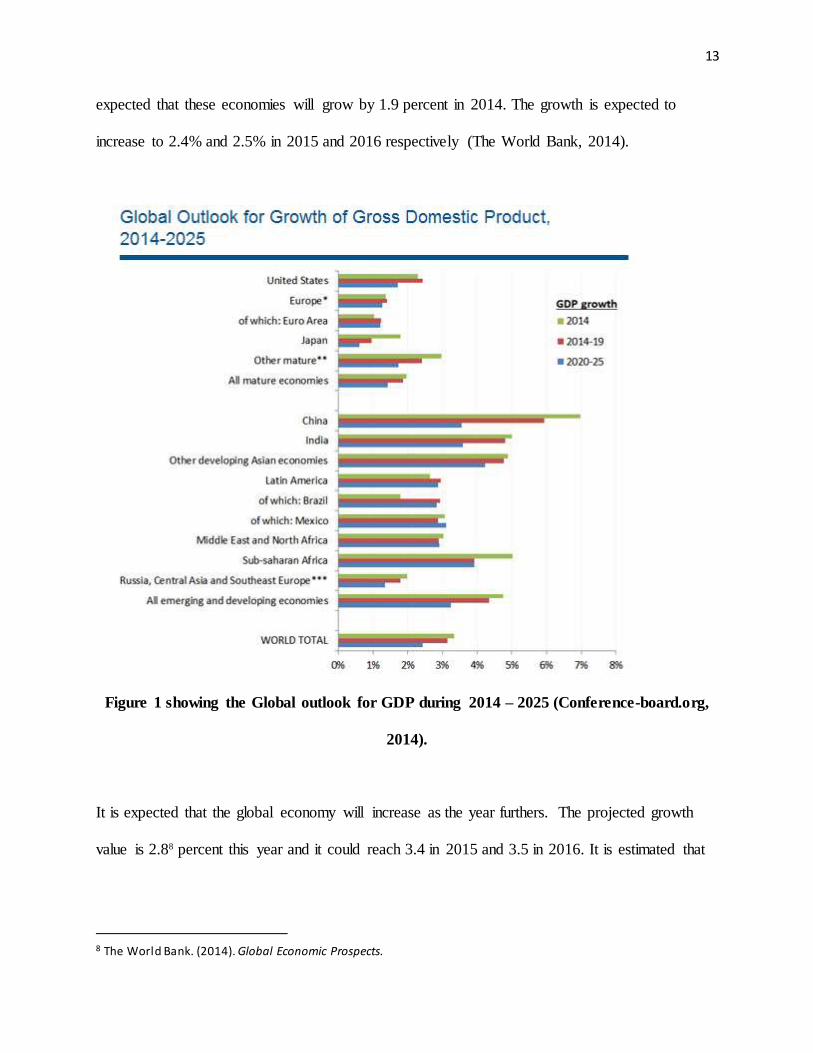
expected that these economies will grow by 1.9 percent in 2014. The growth is expected to
increase to 2.4% and 2.5% in 2015 and 2016 respectively (The World Bank, 2014).
Figure 1 showing the Global outlook for GDP during 2014 – 2025 (Conference-board.org,
2014).
It is expected that the global economy will increase as the year furthers. The projected growth
value is 2.88 percent this year and it could reach 3.4 in 2015 and 3.5 in 2016. It is estimated that
8 The World Bank. (2014). Global Economic Prospects.
14
high income countries will account for half of the worldwide growth in the years 2015 and 2016
where as they accounted for less than 40 percent in the year 2013 (The World Bank, 2014).
The GDP estimates of second quarter have shown expectations that the British economy has
increased beyond its peak in 2008. Another boost which supports these expectations is the IMF
forecast upgrade. All this puts Britain on the path of growing more than any other major
economy in the world (Stylianou, 2014).
However, it is not just Britain that has received such increases in the projections of IMF. IMF
projections have also given positive news to Spain on the day its unemployment rate fell to its
lowest level in two years. That was the largest quarterly increase in the number of people who
are employed since the second quarter of year 2005 (Stylianou, 2014).
2.2. UK Economy
The recovery of the UK seems to be continuing with a growth of around 3 percent in the year to
the first quarter of 2014. The main drive for the recovery seems to be the services sector.
However, there have been positive news from various other sectors like construction and
manufacturing. Several business surveys conducted on all three sectors have found that the
growth observed should continue to grow at a good pace during the second of half 2014.
It is found that the increase in GDP has been mainly due the increased employment and the
confidence in consumers. Over the past year, fixed investment has also increased as business
investment and house building have increased.
15
It is expected that UK economy could grow around 3 percent in 2014 which is an increase from
the 1.7 percent growth in 2013 (Pwc, 2014). However, the growth might slightly adjust to around
2.69 percent in 2015. It is expected that all the regions of UK to have a faster growth rate in the
year 2014 as opposed to 2013. It is also estimated that London will see the fastest growth rate of
3.4 percent and that Northern Ireland will see the slowest growth rate of 2.2 percent (Pwc, 2014).
However, there are still some significant downside risks that could affect the recovery of UK
economy. These include the slowdown in activity in the Eurozone, the unrest in Ukraine and the
Middle East which could have a potential impact on global energy prices, and potential problems
in some major emerging markets. On the other hand, there are some upside possibilities. These
include business investments being stronger than expected and an increase in real wage growth
which has led to the increase spending of consumers than predicted.
At present, the level of inflation is below the Bank of England’s target of 210 percent and it is
expected that the level will remain mostly stable over the next 18 months. It is however expected
that the interest rates might start to increase from the late 2014 or early 2015. This is to
overcome longer term inflationary risks which include overheating in the housing market.
In the year 2013, the UK had the sixth largest economy in the world and the third largest
European economy. It was right behind Germany and France. It is estimated that by the year
2030, the UK is expected to remain the sixth largest economy in the world by falling behind
India but overtaking France with which there is already a narrow margin. When it comes to
European economies, UK is expected to become the second largest EU economy before the year
9 Pwc. (2014). UK Economic Outlook July 2014. 10 Pwc. (2014). UK Economic Outlook July 2014.
16
2020 as it overtakes France. It is also expected that the gap between Germany and UK
economies will be narrowed by the year 2030 (Pwc, 2014).
It is found that the UK has ranked 5th in the G7 in 2013. This means it was down from 3rd in
2000 and 2007. This is because of the deep recession suffered by the UK during the years 2008 –
2009. This downfall in rank shows the slow recovery before 2013 (Pwc, 2014).
2.3. Implications for A. G. Barr Plc.
Since the global economy has expected to grow in the future years, A. G. Barr Plc. can expect
increase in its revenue. Though there are some significant downside risks in the UK economy, it
is anticipated to grow11 in the future years. The management of A. G. Barr is ready to make
adjustments to the capital structure according to the economic conditions. Their revenue by the
end of January in 2014 grew by 6.9%12, beating the wider soft drinks market. The volume of the
company grew more than double the market rate by 5.0%13.
2.4. Conclusion
This chapter describes the outlook for global economy and UK economy as well. It also reveals
the implications for A. G. Barr Plc. The global economy performance has been increased in 2014
from the previous year. Compared to developed economies, emerging economies have improved
their performance. A. G. Barr improved its revenue in 2014 even in the adverse economic
conditions. Expecting the growth of global economy and UK in the future years, A. G. Barr Plc.
expects bright future.
11 Pwc. (2014). UK Economic Outlook July 2014. 12 A.G. Barr Plc. Annual Report and Accounts 2014, p. 7 13 A.G. Barr Plc. Annual Report and Accounts 2014, p. 7
17
3. The Structure and Outlook for the Industry
Soft drink industry is a highly profitable industry. It is especially more profitable for concentrate
producers than the bottler’s. This can be amazing due to the fact that the product that is sold as a
commodity can even be made with ease. However, there are numerous reasons for this. With the
help of five force analysis we can easily understand how each reason contributes to the
productivity of the industry.
3.1. The UK Soft drink Industry
Since the year 2007 the UK carbonated soft drink have increased by almost 17 percent. It was
estimated that the value of the industry would reach 4.5 billion pounds in 2012. However, most
of this growth is due to inflation with the volume sales increasing 3.4 percent in that period
(Bainbridge, 2012).
Main members of the carbonated soft drink sector:
Coca-Cola, the most dominating company of the sector. It has market of share of almost 5014
percent. It increased global exposure by being the official sponsor of London Olympics. A. G.
Barr, one of the leading soft drink sellers in the UK market and popular for its IRN – BRU.
Though Coca-Cola is a major company it is led by Pepsi in the on trade. Pepsi makes best use of
its improved distribution with the help of partnership with Britvic. They have invested in staff
training which focused on serving consumers perfectly.
14 Bainbridge. (2012). Sector Insight: Carbonated Soft drinks.
18
The value of Schweppes has fallen by 1.515 percent between 2009 and 2011. Due to the price
rises in the market its lemonade was affected. This made it hard to compete against colas and
other fruit carbonates. Others include minor companies like Own-label. When compared to the
strength of other brands it has minor value in the soft drink market. It accounts for less than 1016
percent of value sales in take home market.
3.2. The Outlook for Soft drink Industry
Soft drink industry has mainly five trends. They are penetration, price, older consumers,
advertising and health. These are described in detail as below:
Carbonated soft drink generally tend to have a penetration of more than 90 percent which is
mainly associated with young mainly people under 35. Older consumers influence the soft drink
market. One of the major problems in soft drink market is that people over 55 generally are less
inclined to buy them. It is predicted that by the year 2017 this demographic will grow by 8.6
percent17 to 20 million.
Price also affect the soft drink market. CSD category has a relative benefit from low price point.
This can help it overcome competition from the more upmarket and recent entrants in the soft
drinks category. Big brands like Coca-Cola and Pepsi invest a lot of money on heavy
advertisement as it influences the sales and thereby profits. This makes them brands that come to
the mind of consumers when they think of soft drinks.
15 Bainbridge. (2012). Sector Insight: Carbonated Soft drinks. 16 Bainbridge. (2012). Sector Insight: Carbonated Soft drinks. 17 Bainbridge. (2012). Sector Insight: Carbonated Soft drinks.
19
Health conscious is growing among consumers. It is found that two out of five users have stated
that they try to avoid carbonated soft drink because they are not good for health. On the other
hand, more than half users drink sugar free variants of the carbonated drink for the sake of
health. The sales of sugar free variants has increased by 25 percent from 2009 to 2011
(Bainbridge, 2012).
3.3. The Five Forces
Michael Porter’s five forces are key to any business and industry. They are mentioned as below.
3.3.1. Threat of New Entrants
The following are the barriers to entry for new competition to enter the soft drink market:
Bottling Network: Coke and PepsiCo have agreements of franchisees with their respective
bottler’s. The bottlers have certain rights in certain geographic area. Using these agreements the
brands prevent the bottler’s in making similar products. Thus, they prevent new competing
brands from entering in the market for same products. Coke and Pepsi have bought the
significant percent of bottling companies. This, combined with the recent consolidation among
the bottler’s has made it very difficult for new companies entering the market to find bottlers.
The alternative for finding a bottler is to try and build their own bottling plants which would be
highly capital intensive.
Advertising Spend:
In the year 2000, the money spent in advertising and marketing in the soft drink industry was
around $2.618 billion. This money was mainly spent by Coke, Pepsi and their bottler’s. In the
18 Vulpala, L.G. (2007). Cola Wars: Five Force Analysis.
20
year 2000, 8.319 million was spent in the form of advertisement per point of market share
(Vulpala, 2007). Such a high number makes it difficult for any new entrants to compete and gain
visibility.
Brand Image/loyalty: Due to the long history of heavy advertising by Pepsi and Coke, they have
gained a lot of brand loyalty and image from customers across the world. This means that any
new entrant cannot virtually match up to their scale in the market place.
Retailer Shelf Space:
Generally, retailers get a significant margin of soft drink for the shelf space they offer (usually
15 – 2020 percent). This margin makes it difficult for new entrants as they cannot influence
retailers to carry their products instead of Coke and Pepsi.
Fear of retaliation:
A new comer entering a market in which giants like Pepsi and Coke already exist is not easy as it
could to lead to price wars which could affect the new comer.
3.3.2. Rivalry among the Existing Firms
In the concentrate producer industry, Pepsi and Coke are the two main firms competing and it
can be classified as a duopoly. The rest of the competition in this industry has a market share
which is too small to make any upheaval of pricing or industry structure. The competit ion
between Pepsi and Coke has mainly been regarding differentiation and advertising instead of
pricing except for a period in 1990s. This helped in the prevention of a big dent in profits
(Vulpala, 2007).
19 Vulpala, L.G. (2007). Cola Wars: Five Force Analysis. 20 Vulpala, L.G. (2007). Cola Wars: Five Force Analysis.
21
3.3.3. Bargaining Power of Suppliers
There are several basic commodities which are required as raw materials for the production of
concentrate. These are color, taste, caffeine or additives, sugar and packaging. These products
are produced by producers who have no power over the pricing. For this reason, the suppliers in
this industry are weak (Vulpala, 2007).
3.3.4. Bargaining Power of Buyers
In order to sell soft drinks there are several channels that are typically used in the Soft Drink
Industry. These include food stores, vending machines, Fast food fountains, convenience stores21.
Each of these has variations in the power of buyers. Food stores are mainly commanded by
buyers with lower prices. Fountains enable buyers to have freedom to negotiate. Hence, they are
also considered to have the power of buyers. The power of buyers is fragmented in convenience
stores and hence they pay higher prices. Buyers have no powers on vending channel.
3.3.5. Threat of Substitutes
Soft drink Industry has several substitutes like beer, water, coffee, juices etc. These are available
to end consumers with ease. However, these products are countered by the concentrate producers
by huge advertising, brand reputation, and increasing the availability of their products to
consumers22 (Vulpala, 2007). These strategies cannot be matched by the substitutes mentioned
above. Furthermore, the soft drink companies use diverse substitutes themselves to shield
themselves from competition.
21 Vulpala, L.G. (2007). Cola Wars: Five Force Analysis. 22 Vulpala, L.G. (2007). Cola Wars: Five Force Analysis.
22
3.4. Conclusion
This chapter explains the structure and outlook for the soft drink industry and the UK industry as
well. It also describes the Porter’s five forces that influence the soft drink industry. Advertising,
brand image, retailer shelf space and retaliation are some barriers that prevent new entrants in
soft drink industry. The soft drink industry is mainly leading by Coke and Pepsi. The threat of
substitutes is more in the industry. The threat of suppliers is weak and the threat of buyers
depends on the channels the companies use to sell them. Buyers have more power in food stores
and fountains, lower power in convenience stores and no power on vending channels.
23
4. Literature Review
4.1 Introduction
Dividend policy has an utmost relevance to AG Barr Plc. Dividend policy has always been a
crucial corporate finance area which can be analyzed with the help of rigorous model. There are
various theories associated with the policy of dividend and there are lesser evidences gained
from empirical studies. The conceptions behind the theories of corporate dividends are also very
different in nature. AG Barr Plc on the other hand has been using dividend policy only because it
has a responsibility to provide signal for its shareholders with respect to the status of capital
investment of their organization. In addition, this chapter has been prepared in order to discuss
the signals that AG Barr plc sends to its shareholders by the applicable dividend policies usage
and certain evidences for supporting those theoretical frameworks. There are various theories
associated with the policy of dividend and there are lesser evidences gained from empirical
studies. The conceptions behind the theories of corporate dividends are also very different in
nature.
Dividends are the payments that companies such as A.G Barr plc make from the total profit
made by the company to the associated shareholders either on annual or interim basis. The
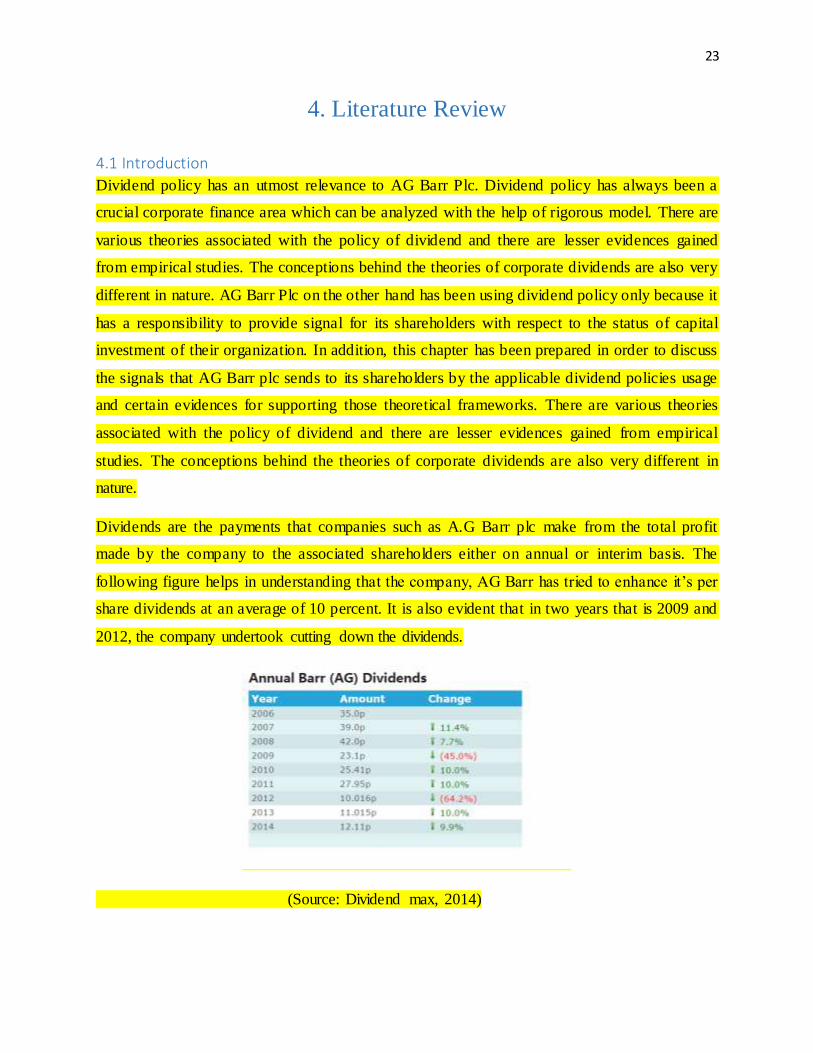
following figure helps in understanding that the company, AG Barr has tried to enhance it’s per
share dividends at an average of 10 percent. It is also evident that in two years that is 2009 and
2012, the company undertook cutting down the dividends.
(Source: Dividend max, 2014)
24
Additionally, during the year 2011, A.G Barr consistently made efforts to contribute to the
scheme of pension wherein total dividends distributed were 9 million euros. The resulting
dividend for the year attributable to shareholders equity totaled to 22.585 million Euros. A
dividend interim for 2011 was of 6.75 p for every general share. The final dividend proposed was
18.66 p per general share to be given if approval is given to this amount. From this perspective
and as evident from the annual report of the company for the year 2011, the distribution of
dividends at A.G Barr plc to its shareholders has been recognized as a financial statement
liability wherein the shareholders are responsible for the dividends approval. In addition, the
dividend policy advantage for AG Barr Plc lies in the fact that the company uses the policy to
manage capital risks. The capital structure and adjustments to be made by the company are done
by considering the changing economic conditions. For mainaining or even for adjusting the
capital structure, the company uses the dividends. These dividend payments are modified to
return the capital for the shareholders or they are issued new shares. This is the manner by which
AG Barr balances the shareholder returns between growth in long term and present returns
wherein capital discipline maintenance is related to activities of investment.
A dividend cut can take place when A.G Barr Plc was making an effort for reducing the payout
amount. This made A.G Barr Plc to experience stock prices to decline sharply. According to
Holder et al, 1998, dividends are cut due to reasons such as weak company earnings and limited
fund availability for meeting the payment required as the dividend policy. Furthermore, he also
stated that usually sharp declining stock prices imply weak position of finances with regard to a
specific company. At AG Barr plc the dividend reduction explains the lower price of stock
amounts after 2012. From this perspective the importance of dividend policy to A.G Barr plc can
be explained implying that it is the simple way that A.G Barr Plc adopts for communication its
well-being financially to the shareholder.
4.2 Literature Review
The corporate dividends issue has a wider historical perspective and as observed in the theories
of Frankfurter and Wood, the issue is bind with the corporate form of development. Dividends
on corporate have a historical perspective present since the 16th century wherein Holland and
Great Britain sailed their ships to start financial claims selling towards the investors. The
25
dividend policy literature has led towards producing a wide variety of theoretical research and
empirical research specifically being following by the dividend irrelevant publication presented
in the hypothesis based study of Miller and Modigliani, 1961. In the initial corporate history
stages, it was realized by the managers that an essential position is held by dividend payments
that are highly stabilized in nature. In certain ways, the reason behind this were the investor’s
analogy which with government bonds (Holder et al, 1998). A regular and stabilized payment of
interest was paid through these bonds and further corporate managers engaged in finding that
shares with the performance similar to bonds are preferred by investors.
However to the major extent, capital dividend theory helps in understanding that dividends are
not crucial when an organization needs to finance its actions whether in absence or presence of
taxes. It was the same period when researchers such as Miller-Modiliani, 1961 and Miller-
Scholes, 1978 presented their documentation to highly the statistically important relationship
present between the yields of dividends and prices of stock. The main issue however has still
remained unsolved that why dividends are paid by the companies (Holder et al, 1998). Dividend
policy in Finland for example has been the main issue in relation to certain studies of empirical
nature. There are various models which explain theoretical share in the market pricing value.
Most of the assumptions are based on separate security with intrinsic value on the basis of the
firm’s economic conditions. These conditions have their basis on earning, dividends, structure of
capital and potential growth from which the economic development conditions can be evaluated
(Holder et al, 1998). This is known as the fundamental analysis of stock. Common method used
in the analysis of fundamental methods are formulated basically for developing distinct types of
models of valuation which usually have their basis on 4 main criterion inclusive of earnings,
flowing cash, total assets and dividends. The analysis of fundamental stocks helps in explaining
26
that the share value can be divided into 2 classifications which are inclusive of dividend and
earning theories. The share value can be evaluated then based upon the dividends discounted.
4.3 Dividend Policy theoretical framework
The most commonly applied model is known as the share prices model of dividend having its
basis on the total earning that are gained by a shareholder over the shares. Future dividends are
presumed to be bought by private investors when shares are bought by them and the value of the
share then becomes only limited to what value it can offer to the shareholder on its selling. The
share prices market establishment is done by discounted the future dividends anticipated stream.
Models which have their basis on this perception are for example model of Walter, 1956 and the
model given by Gordon, 1959 (Gaver et al, 1993).
The model of Solomon, 1963 is inclusive of dividend discounts and even earnings, however on
the other side, the by discounting the earnings retained investments can be made. This model by
Solomon is only a widened version of models given by Walter and Gordon and therefore both
the models important features are also inclusive within both. Other models based on dividends
are propositioned by Lintner in 1962, conceptions of Portenfield’s in 1967 along with the
Malkiel-Cragg and Bower-Bower, 1970. These models have their basis completely limited on
dividend discounts. The presumption here is that the investor is already knowledgeable of the
dividends in future streams and so these models have complete information. The Whitbeck-
Kisord model, 1963 does not have a basis on dividends discounting but also within their dividend
based model is one of the main factors. A dividend signally model was developed by Eades,
1982 with regard to cost type dissipative signaling (Gaver et al, 1993). The stochastic process
market value on the other hand was determined by Hagen in the year 1973 wherein the process
was illustrated to represent the dividend policy of a company. It was reviewed by Ohlson, 1990
27
after synthesizing the security valuation theory for various uncertain settings that the result
determined the value of security to be an expected dividend adjustment function which has been
modified in order to adjust the risks. The discounted price here is done through the risk free rates
structure (Gaver et al, 1993). CAPM is one such model which is evident from historical literature
review to be in limited state. The view of earnings is of a data variable sufficing for determining
the payoff of security, the cost in addition to the dividends. It was postulated by Ohlson that
dividends only have the capability of serving as a common valid capital attributed with respect to
security. According to the re-examination done by Goetzmann-Jorion in the year 1995, it was
illustrated that the dividend ability for yielding long stock returns over the horizon are present
(Gaver et al, 1993). Two considerable series were used by them starting in the year 1873 wherein
they took U.S monthly series and the UK annual series. The result from this led towards
depicting that only marginal ability display is yielded by dividends for predicting the return of
stock market in either US or in UK. In Torkko, Finland, 1974, Gordon models application was
tested (Frankfurter et al, 2002). The sample selected constituted of 23 participating organizations
selected between the years 1971-1986 but the results appeared to be very discouraging in nature
because positive correlation was found to be present between the growth rate of dividends and
the market returns on the stock market.
4.4 Hypothesis of Dividend Irrelevance
There was a basic belief of an increment in the value of a firm if the dividends are higher, this
belief was in the place before the Miller and Modigliani’s seminal paper was published on the
policy of dividend. The bird-in-the-hand was considered to be the basis of this belief. Moreover,
in the very initial stages of the corporate history, it was considerably realized by the managers
that an essential position is held by dividend payments that are highly stabilized in nature. In a
very certain way, the reason behind this were the investor’s analogy which with government
28
bonds (Holder et al, 1998). A much stabilized amount of interest was paid through the bonds and
further corporate managers engaged in finding that shares that have the performance similar to
the bonds are the ones that are preferred by the investors. As per various researchers in the years
of 1930s clearly mentioned that the corporations’ only purpose was to pay for the dividends in
order to increase the prices of the shares.
4.5 Common Irrelevance Thesis It was a common belief that the organizations that pays higher amount of dividends must price
their shares at a higher level accordingly. However, the demonstration about calculated
assumptions on the capital markets, made by the M&M in the years of 1960’s, actively declared
the dividend policy to be of no relevance.
Applied the same in a capital market of assumed perfection as per M&M, the dividend policy
showed no change in an organization’s cost of capital or the stock. Moreover, the wealth of a
shareholder is not effected by the decision of the dividends which drives them to remain
indifferent between the capital gains and the devidents. The reasoning behind the indifference of
the shareholders was given by M&M that their wealth is primarily affected by the generation of
income from the investiment decisions that an organization takes. Hence, there is no affect by the
method of distributing the same income, by which the dividends become irrelevant. It was also
argues that the value of the firm is only determined by the core earning power that an
organization possess and by the decisions of its investments. The argument of M&M was
entirely based on the investors being rational and upon the perfect capital market’s assumptions
there were idealistic. It was also stated that the capitalized value of an organization’s future
earnings were the basis behind the calculations of evaluating an organization by the investors.
29
M&M strongly suggested the investors to look at all of the dividend policies as effectively same,
due to the ability that can be made in use by the investors to create dividends that can be
classified as homemade by the simple procedure of portfolio adjustments which can be carried
out by the investors in order to meet with their own preferences.
There are certain assumptions of the capital market being perfect that are necessary for the
hypothesis of dividend irrelevancy. The first is the indifferences between the taxes on capital
gains and dividends, the second factor asks for absolutely no costs of floatation or transaction
added between the duration of securities trade. Equal and free access to all of the participants in
market for the same information is considered to be the third. Fourthly, there is not supposed to
be any interests’ conflict between the security holders and the managers. It is also of a very vital
importance that all of the participants that are present in the market are considered to be the price
takers.
4.6 M&M Irrelevancy Proof
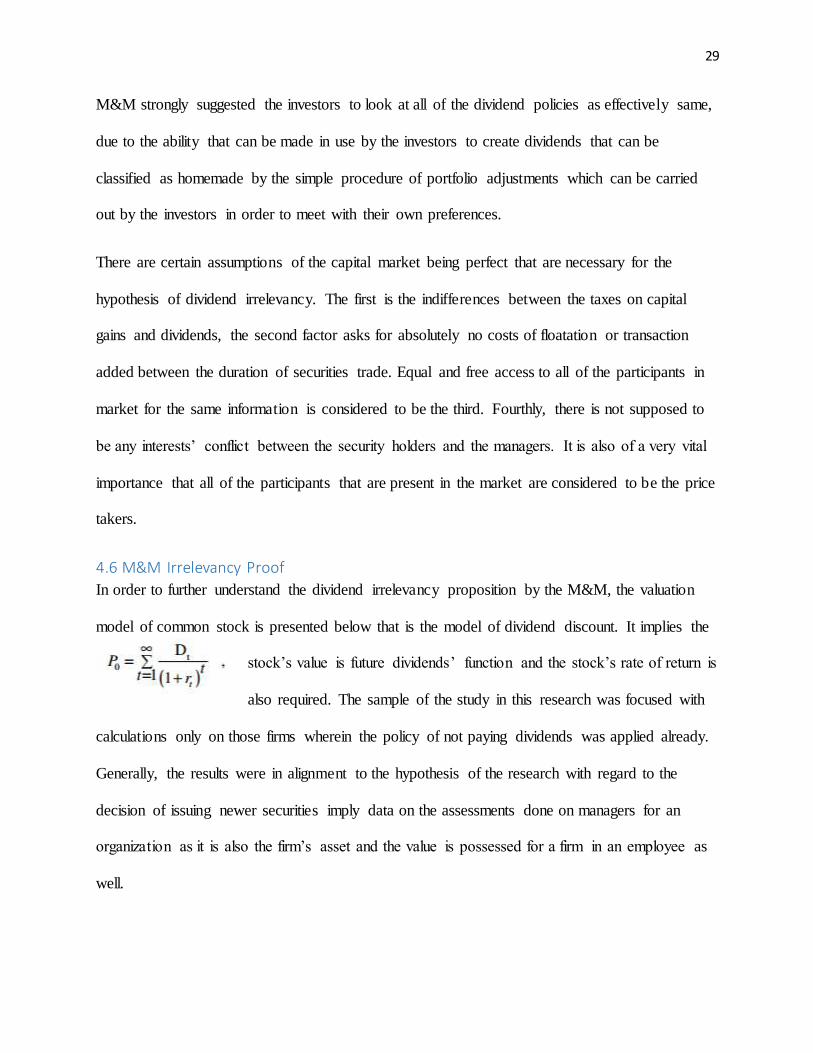
In order to further understand the dividend irrelevancy proposition by the M&M, the valuation
model of common stock is presented below that is the model of dividend discount. It implies the
stock’s value is future dividends’ function and the stock’s rate of return is
also required. The sample of the study in this research was focused with
calculations only on those firms wherein the policy of not paying dividends was applied already.
Generally, the results were in alignment to the hypothesis of the research with regard to the
decision of issuing newer securities imply data on the assessments done on managers for an
organization as it is also the firm’s asset and the value is possessed for a firm in an employee as
well.
30
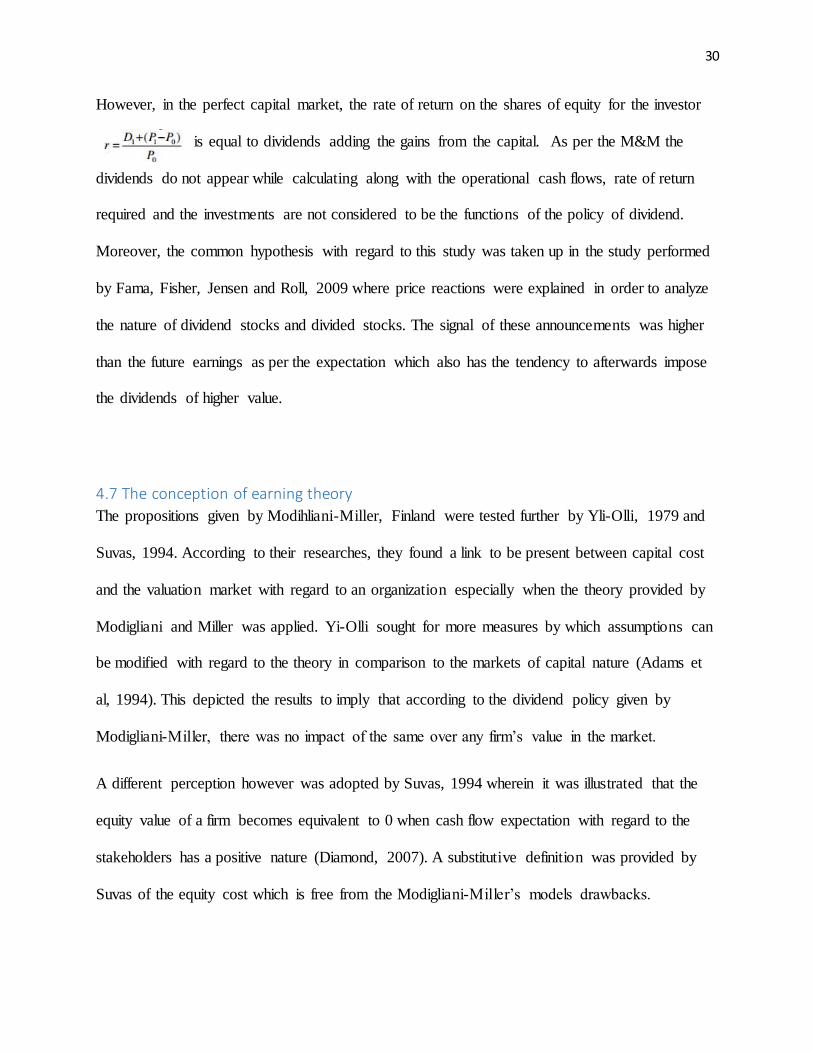
However, in the perfect capital market, the rate of return on the shares of equity for the investor
is equal to dividends adding the gains from the capital. As per the M&M the
dividends do not appear while calculating along with the operational cash flows, rate of return
required and the investments are not considered to be the functions of the policy of dividend.
Moreover, the common hypothesis with regard to this study was taken up in the study performed
by Fama, Fisher, Jensen and Roll, 2009 where price reactions were explained in order to analyze
the nature of dividend stocks and divided stocks. The signal of these announcements was higher
than the future earnings as per the expectation which also has the tendency to afterwards impose
the dividends of higher value.
4.7 The conception of earning theory
The propositions given by Modihliani-Miller, Finland were tested further by Yli-Olli, 1979 and
Suvas, 1994. According to their researches, they found a link to be present between capital cost
and the valuation market with regard to an organization especially when the theory provided by
Modigliani and Miller was applied. Yi-Olli sought for more measures by which assumptions can
be modified with regard to the theory in comparison to the markets of capital nature (Adams et
al, 1994). This depicted the results to imply that according to the dividend policy given by
Modigliani-Miller, there was no impact of the same over any firm’s value in the market.
A different perception however was adopted by Suvas, 1994 wherein it was illustrated that the
equity value of a firm becomes equivalent to 0 when cash flow expectation with regard to the
stakeholders has a positive nature (Diamond, 2007). A substitutive definition was provided by
Suvas of the equity cost which is free from the Modigliani-Miller’s models drawbacks.
31
Furthermore, valuation models were also derived by Suvas with regard to finding out more
opportunities of growth for the organizations.
4.8 Theoretical review of Macroeconomic factors and Dividends
There are various researches which have tried to provide explanation on the share’s market price
with the help from several information sources. The division of this information can be done in
the form of 2 categories inclusive of data under the manager’s control and data out of the control
of management (Gaver et al, 1993). The inclusion in second group is of factors of
macroeconomic considerations. It has been assumed that efficiency being semi-strong implies
that the markets for stock involve all information in published form. It simply seems from this
perspective that these market has a tendency towards reacting to earnings made and possess
some characteristic elements of economy. Announcements of dividends have obtained mixture of
results (Eastebrook, 1984). Factors of macroeconomic nature have a variable of explanatory
having their concern over US stock prices as evident from the stock market of US but the same is
not the situation in other countries such as Finland wherein performed studies by Kjellman-
Hansen have found managers of Finland view the issues of microeconomic as more essential
than the issues of macroeconomic perspectives and therefore the macroeconomic considerations
are not important for them especially when dividend decisions are to be made. Ina accordance to
the study performed by Kallunki-Martikainen, 2008, the connection between factors of macro-
economy and returns from stock are instead specific to samples and are variants of time (Eades et
al, 1984). As per the considerations on macroeconomic factors in Finland, there is no basis of
these factors on policy of dividends.
32
4.9 Dividends and Models of Equilibrium
2 models of equilibrium explain mostly the behavior of stock market inclusive of the model of
pricing the capital assets and the pricing theory arbitrage. The relationship present between the
firm value and dividends involve testing mostly in the perspective of the pricing model of
Capital Assets (Frankfurter et al, 2002). The most inherent presumption being made is the
application of general CAPM with regard to policy of dividend. Use of CAPM in an implicit
manner takes the assumption that hypothesis is irrelevant providing an indication towards a
strong capability of the researchers for accepting their irrelevant status. Expected returns from
equity and anticipated yields of dividends are related together leading towards a positively
related hypothesis to develop. The before tax return differential testing has also been done in
various studies such as Brennan, 2001 wherein formulation of the model of pricing based on
capital assets after payment of tax was developed.
4.10 Dividend policy Signaling effect
The dividends signaling effect takes up the assumption that dividends have the capability of
conveying data on earnings that can be gained by a company. Dividend changes provides a
message for the investors on the future flow of cash for an organization. It was further
hypothesized in the critical study presented by Modigliani-Miller, 1961 that the reduction of
dividend helps in conveying data that provides assurance on earning prospects for a firm in the
future (Friend et al, 1964). The general hypothesis however is inclusive of earnings in the future
and dividends being inter-related. Further the studies proceeded on examining the fundamental
reason by which the impact on future earnings can be laid by the policy of dividends. These
studies were inclusive of the propositions presented in the research study of Lintner, 1956 and
Warr, 2002 (Gaver et al, 1993). Under the signaling conception of dividend policy, there have
33
been various studies performed to analyze the stock market reaction towards the announcements
in dividends. In fact, these studies have also presented analysis on the market of stock efficiency
in the semi-strong nature.
The results from empirical studies have depicted that the dividends signaling effect is visible
efficiently from the data taken from U.S. The basic hypothesis with regard to this study was
taken up in the study performed by Fama, Fisher, Jensen and Roll, 2009 where price reactions
were explained in order to analyze the nature of dividend stocks and divided stocks. The signal
of these announcements was higher than future earnings expectation which also has the tendency
to later impose higher dividends on cash.
On the testing of dividends as per the study of Taylor, 1979, it was found that there is lesser
unanimity present in the concluding section rather than in several areas to test the reactions.
There was a further possibility that the announced earnings in the same stipulated time was
equivalent to the dividends raising concerns for the effect of signaling to develop.
4.11 Dividend Policy behavioral models
Dividend policy behavioral models have taken up the assumption that the changing dividends are
explainable by the dividends in the last period and the dividends targeted which can lead towards
being expressed in the form of periodic earnings fraction (Holder et al, 1998). The initial
publication of Lintner, 1956 illustrated the general model in order to investigate the application
of dividend policy. The basis of this model was on interview sets taken as a data collection
instrument wherein the participants were managers and they were providing their perspective
about their firm’s policies of dividend. It was further illustrated in the study that across firm’s
dividend policies do not have any uniformity (Howe et al, 1992).
34
The question of stable policy of dividends was tested by Mantripragada, 1976 in order to identify
the relationship of this policy with the prices of shares in the market. The hypothesis of stable
dividend argued that the share’s market price with stable payments of dividends need to be kept
at a high position that the similar share prices in the market with regard to payments because
they involve considerable fluctuation. There was however only less support gained by this
theoretical hypothesis as the dividend policies instable nature was evident to mostly all the
researchers.
By using the analysis of discriminants, a model was developed by Kolb 1981 on the basis of
economic factors and institutional factors for determining the dividends payment and for
predicting the annual cash changes dividend with regard to any particular firm (Gerald et al,
1992). The most crucial factor however in this study was given to liquidity and ability of profit
making of a firm.
Conclusion to the chapter
A.G Barr Plc has, what can be described as a progressive dividend policy, which implies that the
decision makers at the company wish to maintain or keep increasing dividend pay-outs year after
year. This year, the dividend payout has increased by about 7.7%. This does not imply that
earnings will not fluctuate over time, however, it can be seen as the Board’s confidence in the
future propositions of the business and the stability in its investment cycles. In doing so, they
endeavor to strike the perfect balance between the interests of the company (for future
expansions etc.) as well as managing the external stakeholders of the company (such as
creditors) and also providing confidence for the shareholders. Moreover, after ensuring there is
enough surpluses for business related investments, and financing the progressive dividend
35
policy, and handling the debt obligations of the company, the company may decide to give back
some extra cash to its shareholders in the form of buy back or repurchase of shares.
As discussed in the review of the literature on dividend policies and models, a growing dividend
payout is generally a sign that the company’s finances are in a good health. However, there is
also a risk of “window dressing” of the Financial Statements. However, higher dividend pay outs
do not suggest a window dressing, especially in the case of A.G Barr plc as the Total Income of
the company has seen consistent growth on a year to year basis, and this has resulted in better
compensation to its owners.
The dividend policy at A.G Barr plc gives a boost to share holder confidence. As evidenced by
Mantripragada, 1976, growing dividends point to stability in a company’s operation and hint at
good prospects for the future.
While almost all the researchers may argue that higher dividend payouts are a good sign for the
company, there is a small problem which most of them may have ignored. One of the many ways
of stock valuation, or estimating the price of a certain share, is also the dividend discount model
(DDM) the model suggests that the share price must be equal to the present value of all the future
dividends the company will pay. Based on this model, the share prices are generally inflated and
hence artificial in nature. Hence, while higher dividends are a good sign for the future, and
means extra cash in the hands of the shareholders, it cannot be looked upon as a measure of the
future stock price of the company. This is because given the market risks, economic instabilities;
a company’s fortunes may be best described as volatile. A high dividend payout and a policy of
progressive dividend will not be able to stand the test of time in adverse economic conditions.
36
Moreover, in order to maintain its progressive dividend policy, the company may sacrifice some
of its future expansion or operational plans, to meet its dividend requirements. This becomes a
sort of a paradox for the company, as it may declare higher dividends today, which may signal
some good health in the finances of the company, but, it is actually sacrificing future profits on
the basis of decision not to invest in such operations in the future, which, in turn may lead to
lesser profits in the future, and hence, a lower capacity to pay dividends.
To conclude, while growing dividends are a good sign of health at a company, and a move that is
welcomed by its shareholders, and looked upon favorably by its external stakeholders, it is a
mistake to look at it solely as a sign of prosperity. A greater analysis into the operations of the
company, in this A.G Barr plc needs to be called for, and not just a look at its growing dividends.
37
5. The Capital Structure Decision
5.1. Introduction
The capital structure is the mixture of debt and equity of a company. In other words, the capital
structure reveals the proportion of debt and equity. Hence, the capital structure can be considered
as the ratio of total debt to total equities. On the other hand, leverage is somewhat different from
the capital structure, yet it has association with the capital structure. Leverage can be measured
by the dividing the firm’s debt with its capital. It can be used to check the proportion of the debt
level in a firm. Hence it is used alternatively to explain the capital structure. Both debt and equity
methods are used to measure the firm’s capital structure. Identifying the proportion of
components of capital structure helps the company to maintain cost of capital. The optimal
capital structure varies with firms and sectors in which they operate.
Certain conditions influence the capital structure. These may or may not affect the firm’s value.
This can be identified with the help of theoretical and empirical work based on the Modigliani
and Miller (1958). This approach proposes the value with irrelevance of leverage. It is reasoned
by many researchers such as Scott (1976) and Leland (1994) that a balance between tax benefits
and the business disruption costs (also known as bankruptcy) of debt results in a perfect mix of
debt and equity. The reasoning that optimal mix of finance maybe resulted from balancing tax
benefits of debt and the distress costs of debt is further supported by the studies by Altman
(1984) and Opler and Titman (1994). Another type of reasoning argues that a balance between
agency costs and benefits of debt will help in resulting an optimal financing mix (Jensen and
Meckling, 1976; Jensen, 1986).
38
Capital structure is important to value the firm as it affects the cost of capital. Cost of equity can
be calculated by using the current dividend that the company pays, the current market price of
the company’s share and expected growth rate of dividend. As per the dividend discount model
the value of stock is determined by dividing the dividend per share by subtracting the dividend
growth rate from the present value at discount rate. This model is used by investors to estimate
the future dividends based on the historic dividend growth rate.
If firms evaluate the income-based valuation methods like discounted cash flow, they apply a
present value discount rate. The expected cash flows are turned into present value using the
discount rate which is based on the weighted average cost of capital (WACC). WACC indicates
the proportion of firm’s debt and equity in its capital structure (Cshco.com, 2012).
There are several valuation techniques used by firms. Companies need to evaluate their
intangible assets using separate valuation methods for two reasons: One - due to new
international accounting standards issued by the Board and two – the average required return
obtained for intangible assets is more than the WACC. DCF (the discounting cash flow method
is one of the ideal method to estimate the value of intangible assets especially in such situations
if is not possible to estimate their fair value based on the market conditions (Schauten, 2008).
5.2. Various Theories on Capital Structure
The manager versus outside shareholder conflict is generally reduced by the debt. This is done
by reducing dependency on the external equity and also by creating a commitment to pay out
cash in the form of interest. However, on the other hand debt might create a conflict of interest
39
between owners and the holders of bonds. This can be done for the problems of underinvestment
or substitution of assets. When shareholders let go of the positive NPV projects then they think
that profits will be used to pay the holders of bonds that is when the underinvestment problem
occurs. This problem is even higher in the case of mature firms. When the bondholders have a
fixed claim on the cash flow of the firm but shareholders hold the residual claim, then the asset
substitution problem occurs in a relationship. In this relationship, the asset substitution problem
occurs when the shareholders have an incentive for risk shifting. The shareholders can take an
action in order to increase the value of their claims at the same time imposing additional, and
uncompensated risk on bondholders (Rajagopal, 2010).
In the context of U.S. and several other developed countries, the capital structure theories
mentioned above have been tested widely. It is found by Bradley et al., 1984, that bankruptcy
risk and the existence of collateral form the most important factors in explaining the cross
sectional variations in leverage. These findings result in the suggestions that bankruptcy costs
and asset substitution problems are related to the capital structure decision (Rajagopal, 2010). It
is found by Mackie-Mason (1990), the probability that the firm will issue debt will be lessened
due to the existence of non-debt tax shields. This is pointing to how important the tax is to the
capital structure decision.
It is observed negative relationship between debt and growth options in certain instances. In such
instances, there has been indirect evidence which suggests the relevance of underinvestment
problems to debt policy (Graham, 1996; Johnson, 1997). Based on the results from Titman and
Wessels (1988), the financial hierarchy theory or pecking order has received substantial support.
40
The results have found that generally the more profitable the firm, the less likely it is found to be
dependent on external sources of financing. This theory has been further supported by Masulis
and Korwar (1986) and Mikkelson and Partch (1986) which show a negative market reaction to
seasoned equity issues.
The recent literature that has been produced in the corporate finance sector found that there has
been an increasing interest in financial management practices among firms which are in
emerging economies as well. The desire to compare the financial behavior of firms which are
placed in very different institutional settings is one of the main motivations for conducting such a
study. This comparison is now becoming easy with the help of the increasing availability of
trustworthy data. One of the examples of such study is the study on capital structure decisions
which are made by small and medium sized businesses in Vietnam, conducted by Nguyen and
Ramachandran (2006).
The results of the study have found the Vietnamese average leverage ratio is similar to that of
firms in the U.S. (an approximate of 40 percent) even though the country is characterized by a
bank based financial system. Furthermore, it is also found from the study that the Vietnamese
have a strong dependency on short term credit almost to the extent of completely ignoring long
term debt. The Vietnamese enterprises with higher amount of growth options tend to have a
higher leverage when compared with their counterparts of the U.S. (Rajagopal, 2010).
Moreover, it has been found that the tangibility of assets (which are presumed to mitigate the
asset substitution problem) have a negative effect on leverage. And on the other hand, the
41
business risk and firm size are found to have a positive effect to debt use. These findings have a
lot of variation with the theory and with the common behavior of firms in the U.S. corporate
sector. The variation observed in the findings above shows the value of a comparative study of
firms which are operating under different organized, governing, and structural regimes.
In order to obtain the value of equity, expected cash flows are discounted to equity. This includes
the residual cash flows are all the expenses have been met, tax obligations and interest and
principal payments at the cost of equity (Rajagopal, 2010). If the expected cash flows are
discounted to the firm, the value of the firm can be found out. This includes the residual cash
flows after all the operating expenses and taxes have been met.
From the variation observed in the findings, the importance of the comparative studies of firms
which operate under different institutional regulatory and structural regimes. Depending on the
climate in which a firm operates, the financing policy may be influenced in markedly different
ways by a give set of explanatory factors.
In order to contrast the results of the Vietnamese study, the results of Supanvanji (2006), can be
cited. This study has tested various received theories of capital structure by using data for firms
in Japan, Korea, Hong Kong, Singapore, Malaysia, Philippines, Thailand, and Taiwan. The study
has given results which are in line with the results for the firms in the U.S. It is found in the
study that the financial leverage of the Asian firms’ studies is positively related to tangibility,
and negatively related to growth options (Rajagopal, 2010).
42
5.3. The Traditional Approach
In traditionalist theory, people generally consider that a company’s value will be influenced
when the cost of the company is changed. They consider that the cost of capital will be the
lowest for the moderate level of debt. In this situation the value of a company will be the
maximum. This is the optimal capital structure of a firm.
5.3.1. Explanation
As per this model firm has an optimum capital structure and the value of firm increases if the
financial leverage increases. This implies the lower cost of capital with a rise in the debt share in
firm’s capital structure (Kaviyani et al., 2014). (Kanani Amiri, 2005). As per this approach firm
raise their debt to increase their market value. The increase of debt retains the capital structure in
an optimum due to which weighted cost of capital is minimum and market value is maximum.
Under this approach, it is assumed that the returns of shareholders are taxed at a mixed rate, the
distributions are subject to dividend tax rate and retained earnings are liable to capital gains tax.
However, the rate is reduced to depict the deferral tax advantages (Auerbach, 2005).
5.3.2. Aside
The traditional approach is logically defective for the grown-up firms whose equity capital
source is retained earnings. This is because this approach overlooks the primary tax befits of
retained earnings and avoids current taxes on dividends (Auerbach, 2005).
43
5.4. The Economic Approach
Under this approach the MM approach is analyzed. According to the Modigliani-Miller
proposition, if there were no costs of separation along with no government dairy support
program, then the cream plus would result in giving the same price as the whole milk. The
argument basically states that if the amount of debt is increased as the cream in the above
situation, the value of outstanding equity which can be equivalent to skim milk in the above
situation will be reduced (Villamil, 2008). This means that if the safe cash flows are sold off to
debt holders, the firm will have a lower value equity while keeping the total value of the firm
unchanged.
The above mentioned theorem has given two important and basic contributions. The first is that
it represent one of the first formal uses of a no arbitrage argument in the context of modern
theory of finance even though the law of one price is longstanding. Furthermore it has
contributed fundamentally why irrelevance fails around Theorem’s assumptions which are: there
will be unbiased taxes; there will be no capital market frictions; credit markets can be accessed
symmetrically and the financial policy of firms do not disclose any information (Villamil, 2008).
5.3.1. MM Propositions without Taxes
Modigliani-Miller theory (MM theory) is the foremost theory to encounter the traditional
thinking and the effect of capital structure of the firms. According to Modigliani and Miller
(1958), it was assumed that each firm belongs to a risk class. A risk class is a set of firms which
have common earning across states of the world. However, Stiglitz (1969) has shown that this
44
assumption is not needed. It is stated that the relevant assumptions are vital because they set
conditions to have an effective arbitrate.
According to the Modigliani-Miller approach both the value of firm and its cost of capital are
independent. Hence, the debt and equity mix is not relevant for determining the value of the firm.
Here the capital market is assumed as perfect without transaction costs, and corporate taxes.
The ability of the investors to undo the financial actions of a firm has given life to the question
whether firms which issued equity were losing stockholder money in the form of corporate
income tax payments. However this question has been resolved by Miller (1977). It has been
shown that higher after tax income can be generated by a firm if the firm increases the debt
equity ratio. It is also said that this additional income can be used to give higher payout to
stockholders and bondholder but cannot be used to increase the value of the firm.
The main core of the argument made is that the more debt is substituted for equity, the more the
proportion of firm pays in the form of interest on its debt increases relative to disbursements in
the form of dividends and capital gains on equity. It is also argued that higher amount of taxes on
interest payments when compared to equity returns will lessen or completely remove the benefit
of debt finance to the firm.
From the studies of Modigliani and Miller (1963) and Miller (1977) have resulted that the value
of a firm is not dependent on the dividend policy. On the other hand, Bhattacharya (1979) and
others have shown that the dividend policy of a firm is one of the expensive indicators of the
state of a firm and hence it is relevant in a class of models which have: stochastic firm earnings
45
have asymmetric information; the liquidity of shareholder (a requirement to sell makes firm
valuation relevant); and (iii) deadweight costs that are required to pay dividends, refinance cash
flow shocks or protection under-investment (Villamil, 2008).
When it comes to a separating equilibrium, the firms which high anticipated earning generally
tend to pay high amount of dividends. This helps in signaling the stock market about their
prospects.
5.3.1. MM Propositions with Corporate Taxes
In the original paper by Modigliani and Miller (1958), the importance of taxes was considered
for the irrelevance of debt and equity in the firm’s capital structure. This issue has been even
specifically addressed in Miller and Modigliani (1963) and Miller (1977). It has showed that
under some conditions, the correct capital structure can be entirely debt finance because debt is
preferred in a tax code as opposed to equity. For example, the interest payments on debt in the
U.S. are excluded from corporate taxes. As a result of this, a surplus can be generated for firms
by substituting debt for equity. This is done by lessening firm tax payments to the government.
In the form of higher returns, this surplus can be passed to the investors by firms (Villamil,
2008).
Miller and Upton (1976) have shown that except when the firms have to face different tax rates,
they are not different to leasing and buying capital. In order to evaluate the decision to whether
buy or lease, Myers, Dill and Bautista (1976) have designed a formula. This is used when
different tax rates across the firms result in different discount rates. The formula has given the
46
results that it is ideal for a firm with low tax rate and hence high discount rate to lease. It is
shown by Alchian and Demsetz (1972) that due to the separation of ownership and control of
capital, leasing involves agency costs. It is an important point to note that a lessee might not have
the same motivation to use or maintain the capital as opposed to the owner.
A durable goods monopolist, it is argued by Coase (1972) and Bulow (1986), might lease in
order to avoid time inconsistency. On the other hand Hendel and Lizzari (1999, 2002) made the
argument and showed that the durable goods monopolist might lease in order to lessen
competition or contrary choice in secondary or used goods markets. It is shown by Eisfeldt and
Rampini (2005) that while compared to buying via secure lending, leasing has a repossession
advantage. They argue that this advantage is a trade off against the cost of standard ownership
versus control agency problem. When the debt in the capital structure increases, it leads to a
decrease in cost of capital. The value of firm will increase (Villamil, 2008).
5.5. Imperfections
The investors can replicate the financial actions of a firm without any cost if they financial
market is not distorted by taxes, imperfect information, transaction costs or bankruptcy costs or
any other friction that puts a limit on the access to the credit. This means that the investors have
the ability to undo the financial actions of a firm if they desire so. The market imperfections lead
to retain the capital structure decisions in a relevant manner (Villamil, 2008).
47
5.6. Additional Research
The static tradeoff, agency costs theories of capital structure, and pecking order are tested by
Eldomiaty (2007), using a sample of Egyptian firms. The tests have found considerable amount
of traditionalism between the capital structure determinants in developed economies and Egypt.
Contrasting the results by Eldomiaty (2007), Delcoure (2007) has found that some of the capital
structure theories established mainly for developed countries are convenient to the emerging
nations also especially in central and Eastern European emerging economies. These economies
include Russia, Poland, the Czech Republic, and Slovakia. Moreover she has find small amount
of evidence which supports the trade off and agency theories of capital structure. Furthermore
the firms used in her study seem to follow a modified pecking order in their financing choice.
These firms had the order of preference of retained earnings, external equity, bank debt, and
market debt.
5.7. Conclusion
This chapter reviews the earlier literature on the capital structure decisions. It provides a
theoretical background to meet the aims and objectives of research. Various approaches like
traditional approach and MM approach are studied in this chapter. The work of several
researchers on capital structure decisions and various theories on it are also examined.
48
6. Company Analysis
6.1. Introduction
This chapter reviews the strategic capabilities of A. G. Barr, board of directors, capital structure,
share holdings, leverage, its financial performance, profitability, liquidity, cash flow analysis and
SWOT analysis.
6.2. Strategic Capabilities
A. G. Barr has developed supply capability23, organisational capability24 to help in retaining
long-term brand building activity. The company also focuses in increasing their employees to
meet their business objectives25. It also takes several steps to improve their executional
capability. One such example is the initiation of centralisation to improve reaching their
customers (A.G. Barr Plc. Annual Report, 2014).
A. G. Barr constantly tries to improve their brands by focusing on consumers and geographical
areas. While developing portfolio, the company mainly focuses on health products, quality and
their taste. It acquires the brands in relevant times and builds competencies in specific channels
to serve their customers. The company develops franchise relationships and maintain healthy
relationships with their suppliers to ensure reducing waste and inadequacy. It improves the
operating efficiencies by controlling costs. The company follow leadership principles toward
their employees. It implements various social responsibility plants to sustain in the long-term
(A.G. Barr Plc. (a), (2014).
23 A.G. Barr Plc. Annual Report and Accounts 2014, p. 13 24 A.G. Barr Plc. Annual Report and Accounts 2014, p. 16 25 A.G. Barr Plc. Annual Report and Accounts 2014, p. 24
49
A. G. Barr has increased its operational efficiency by overcoming the challenges in the initial
states of upgrading its production plants. For instance when the company wanted to upgrade its
Cumbernauld production plant, it faced various operational challenges. Yet, the company
overcame them by considering them as short-term issues and increasing their manufacturing
capacity. In certain cases the company has to bear high raw material costs, but even in such cases
it does not pass them to their consumer rather trying to offset them by improving their
operational efficiency. Even the soft drinks market is volatile. The company’s successful strategy
is that popular brands and effective capabilities gain them good reputation in the market and
achieved success. The constant efforts of the company to offer fruitful innovations to the market
and customers helped them to grow and establish themselves as a successful player in the sector
(McCulloch, 2011).
6.3. Board of Directors and Corporate Governance
A. G. Barr has 9 board of Directors. Ronald G. Hanna, Roger A. White, Alex B.C. Short,
Jonathan D. Kemp, Andrew L. Memmott, W. Robin G. Barr, Pamela Powell, Martin A. Griffiths
and John R. Nicolson26 (A.G. Barr Plc. Annual Report, 2014). They are responsible for the
success of the Group. The directors can exercise their powers with subject to the Company’s
Articles of Association27. Both the Chairman and Chief Executive act in separate roles. The
Chairman leads the Board. The Chief Executive is responsible for all business of Group28.
26 A.G. Barr Plc. Annual Report and Accounts 2014, pp. 32-33. 27 A.G. Barr Plc. Annual Report and Accounts 2014, p. 34. 28 A.G. Barr Plc. Annual Report and Accounts 2014, p. 40
50
A. G. Barr has good standards of corporate governance which are compatible to the UK
corporate governance and Corporate Governance Codes wherever is applicable. The Code
regularly monitors the activities of the Company Board and its committees to make sure that they
are effectively performing their duties (A.G. Barr Plc. Annual Report, 2014).
The Company has three Boards – the remuneration committee, the audit committee and the
nomination committee. Adequate training will provided to new members of the board. These
boards review the performance to check the internal performance of all the individual directors.
A. G. Barr has regular interactions with their shareholders. The Chief Executive conducts
meetings twice a year. All shareholders can avail this opportunity to interact and know more
clearly about the performance and operations of the company (Nxtbook.com, 2008).
Internal control system is maintained in the company to protect the investments of shareholders
as well as company assets. The company follows the procedures of Turnbull report approved by
the U.K. Listing Authority. As per the specifications, the company monitors, recognizes,
estimates and controls the probable risks from time to time. Furthermore, the internal auditors of
the company evaluate the internal control throughout the company and provide statements on it
(Nxtbook.com, 2008).
6.4. Capital Structure
A. G. Barr Plc. has many options to adjust its capital structure. These include the issuance of new
shares, modification of dividend payments to shareholders, and returned capital to shareholders.
51
Thus, the company maintains balance between the current and long-term growth to yield returns
to their shareholders (A.G. Barr Plc. Annual Report, 2014).
While issuing the shares the company reviews the existing equity on the basis of the net
debt/EBITDA ratio. Interest-bearing loans, the net of cash and cash equivalents and borrowings
are used to calculate the net debt. This ratio aids A. G. Barr in planning its capital requirements
in the time of requirement (A.G. Barr Plc. Annual Report, 2014). It is believed by The Group
that, an efficient capital structure and a satisfactory level of financial flexibility can be achieved
while maintaining capital discipline in relation to investing activities by the current net
debt/EBITDA ratio along with existing shares in issuance29. More than two-thirds of the capital
structure of A. G. Barr is constituted with equity and reserves. The remaining part is constituted
with loans, borrowings, trade and other payables and provisions.
6.4.1. Shareholding
The Group has 116,768,778 issued and fully paid shares worth of £4,865,366, 000. A. G. Barr
contains shareholding as major part of its capital structure. The equity part consists of share
premium, share options reserve, retained earnings in addition to the share capital30.
6.4.2. Leverage
The leverage of A. G. Barr is very low when compared to its equity. As per WACC calculation
which is done in the appendix, the company’s capital is made up of with 99.9% equity and
29 A.G. Barr Plc. Annual Report and Accounts 2014, p. 123 30 A.G. Barr Plc. Annual Report and Accounts 2014, p. 88
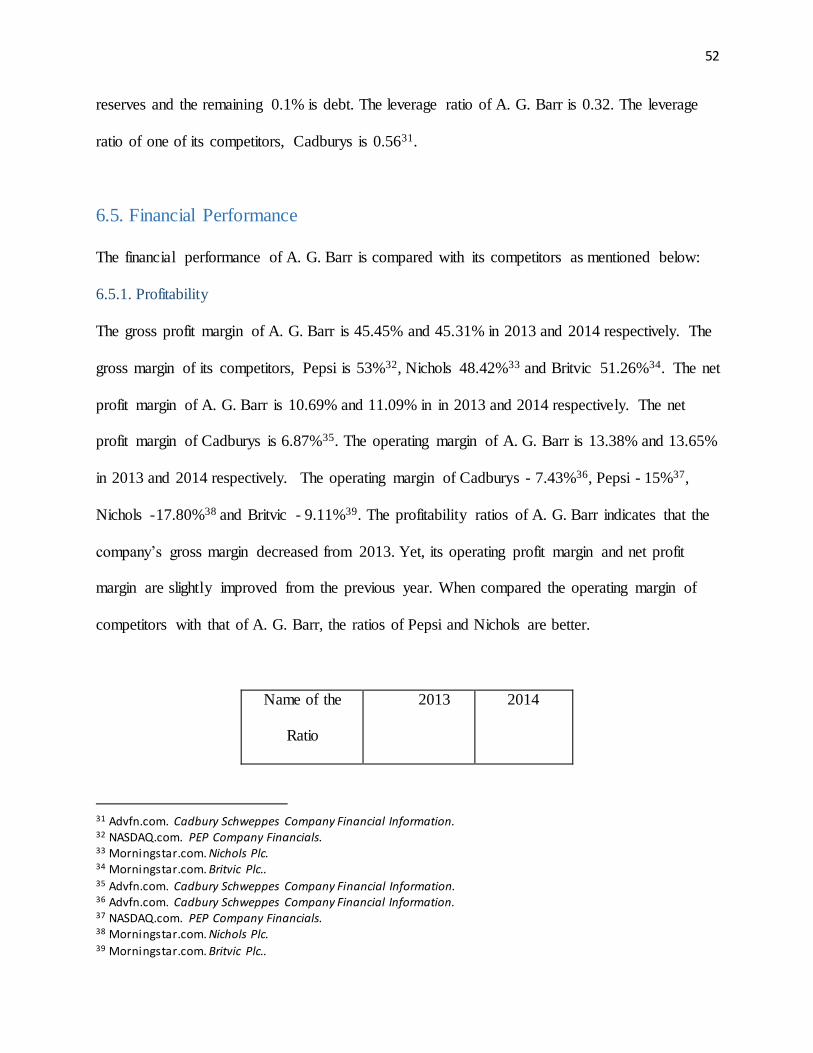
52
reserves and the remaining 0.1% is debt. The leverage ratio of A. G. Barr is 0.32. The leverage
ratio of one of its competitors, Cadburys is 0.5631.
6.5. Financial Performance
The financial performance of A. G. Barr is compared with its competitors as mentioned below:
6.5.1. Profitability
The gross profit margin of A. G. Barr is 45.45% and 45.31% in 2013 and 2014 respectively. The
gross margin of its competitors, Pepsi is 53%32, Nichols 48.42%33 and Britvic 51.26%34. The net
profit margin of A. G. Barr is 10.69% and 11.09% in in 2013 and 2014 respectively. The net
profit margin of Cadburys is 6.87%35. The operating margin of A. G. Barr is 13.38% and 13.65%
in 2013 and 2014 respectively. The operating margin of Cadburys - 7.43%36, Pepsi - 15%37,
Nichols -17.80%38 and Britvic - 9.11%39. The profitability ratios of A. G. Barr indicates that the
company’s gross margin decreased from 2013. Yet, its operating profit margin and net profit
margin are slightly improved from the previous year. When compared the operating margin of
competitors with that of A. G. Barr, the ratios of Pepsi and Nichols are better.
Name of the
Ratio
2013 2014
31 Advfn.com. Cadbury Schweppes Company Financial Information. 32 NASDAQ.com. PEP Company Financials. 33 Morningstar.com. Nichols Plc. 34 Morningstar.com. Britvic Plc.. 35 Advfn.com. Cadbury Schweppes Company Financial Information. 36 Advfn.com. Cadbury Schweppes Company Financial Information. 37 NASDAQ.com. PEP Company Financials. 38 Morningstar.com. Nichols Plc. 39 Morningstar.com. Britvic Plc..
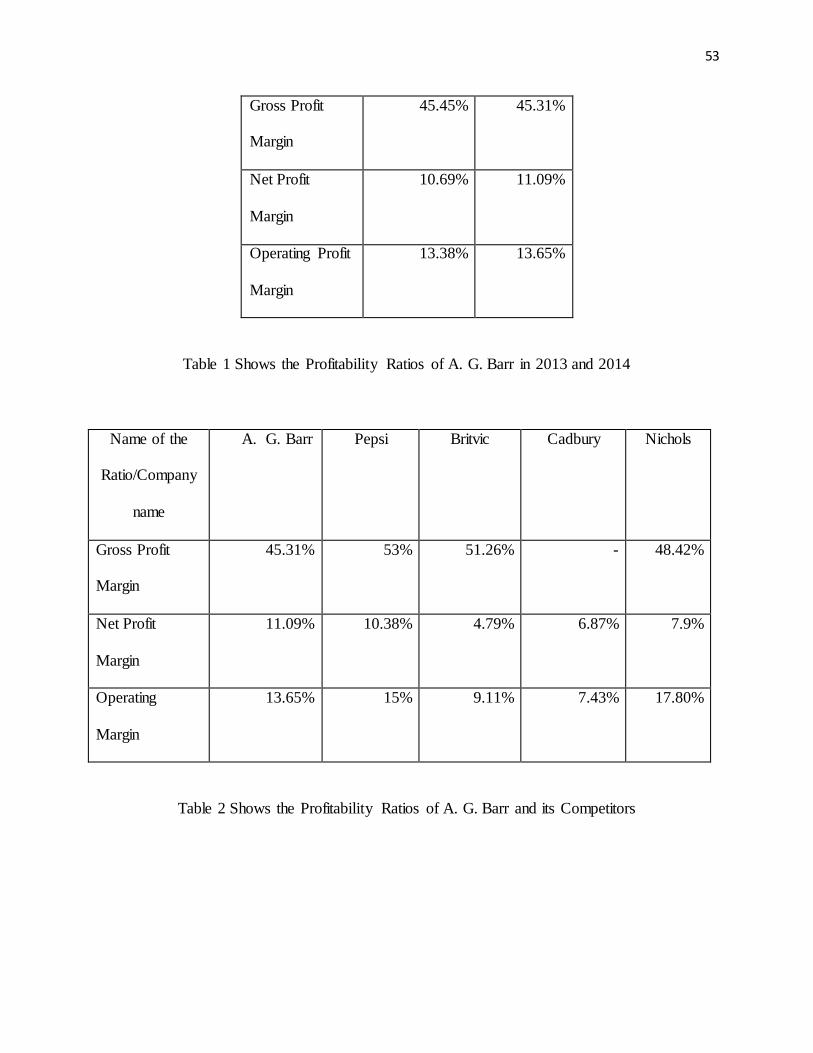
53
Gross Profit
Margin
45.45% 45.31%
Net Profit
Margin
10.69% 11.09%
Operating Profit
Margin
13.38% 13.65%
Table 1 Shows the Profitability Ratios of A. G. Barr in 2013 and 2014
Name of the
Ratio/Company
name
A. G. Barr Pepsi Britvic Cadbury Nichols
Gross Profit
Margin
45.31% 53% 51.26% - 48.42%
Net Profit
Margin
11.09% 10.38% 4.79% 6.87% 7.9%
Operating
Margin
13.65% 15% 9.11% 7.43% 17.80%
Table 2 Shows the Profitability Ratios of A. G. Barr and its Competitors
54
6.5.2. Liquidity
The current ratio of A. G. Barr is 0.82 and 1.69 in 2013 and 2014. The quick ratio is 1.34 and
0.61 in 2014 and 2013. The current ratio and quick ratio of Cadburys are 0.86 and 0.6340 and
Pepsi are 1.24 and 0.9341 respectively. The cash ratio of A. G. Barr is 0.29 and 0.01 in 2014 and
2013. The cash ratio of Pepsi is 0.5642. The liquidity ratios indicate that A. G. Barr has slightly
improved its ratios from 2013. Yet, the ratios of Nichols are far ahead of it. Competitors such as
Cadburys and Pepsi have poorer ratios than A. G. Barr.
Name of the
Ratio
2013 2014
Current Ratio 0.82 1.69
Quick Ratio 0.61 1.34
Cash Ratio 0.01 0.29
Table 3 Shows the Liquidity Ratios of A. G. Barr in 2013 and 2014
Name of the
Ratio/Company
name
A. G. Barr Pepsi Britvic Cadbury Nichols
Current Ratio 1.69 1.24 1.09 0.86 2.77
Quick Ratio 1.34 0.93 0.74 0.63 2.61
Table 4 Shows the Liquidity Ratios of A. G. Barr and its Competitors 40 Advfn.com. Cadbury Schweppes Company Financial Information. 41 Pepisco.com. PEP Company Financials. 42 NASDAQ.com. PEP Company Financials.
55
6.5.3. Cash Flow Analysis
The cash flow analysis of the company reveals the following information: £41,788,000 of cash is
generated from the operating activities of the company. Whereas the cash used in investing is
£13,237,000 and cash used in financing activities is £15,016,000. Hence, it can be concluded that
the company has enough cash to meet its operating activities without depending on investing or
financing activities. The cash flow analysis states that A. G. Barr does not depend heavily on
debt since its interest payment is £461,000 whereas the dividends it paid is worth £3,304,000.
6.6. SWOT Analysis
According to Nielsen, UK soft-drinks market increased by 3.3% in last half year till November,
2012. Even in the robust soft-drink market, A. G. Barr performed well with its renowned brands
including Irn-Bru, Rubicon and the Barr brand. The company’s revenues increased by 6.5% in
that financial year than the previous year. A revenue growth of 4.6% was achieved in that year.
The share prices rose by 0.44% which improves its stock worth of about £560m (McConnell,
2012).
A. G. Barr focuses on increasing its revenue by selling its popular brands like Irn-Bru, Tizer and
Rubicon rather than on acquisitions. The company’s revenues increased by 5.2pc till second
week of May 2014 which shows a constant performance. The company is spending heavily to
achieve huge revenue thereby the profit. A. G. Barr efficiently tries to reduce its debt and plans
to use some portion of the built-up cash to improve its bottling facilities. This reveals that the
company’s capital expenditure will be increased to around £19m from the previous year. The
56
company still has enough free cash flow to cover dividend payments of about £13m for the full
year. This is 11.8p per share, nearly 2 times. This indicates that the company’s dividends are
increasing at a rate higher than the rate of infla tion. The company’s long-term investors can have
sound benefits due to its double digit sales growth (Ficenec, 2014).
The company reported a growth of 5.6 percent in its revenue of first half year 2014. According to
Nielsen, A. G. Barr is ahead of total soft drink market in the UK in the first half of the year 2014.
The value of market has increased by 1.6% yet the volume has decreased by 0.3%. It is
anticipated that high competition will be continued in the next half of year 2014 among the top
rivals of the UK soft drink market mainly between A. G. Barr and Britvic. The shares of the firm
increased 18% than the previous year making the company’s business value at £737m (Little,
2014).
The strengths of A. G. Barr are good brand reputation with many customers in various
geographical areas. It has skillful employees and board of directors. The weaknesses include the
following; it mainly focuses on selling its popular brands. It should also focus on creating some
more new brands and tastes. As the customers can easily change their tastes in this sector, the
company should update according to their emerging needs. The company takes some hasty
decisions. One such example is the proposed merger with one of its competitors, Britvic. But,
later it changed its mind and aborted the decision. It has some inefficient brands such as KA that
do not contribute to a major portion of the company’s revenue. So, A. G. Barr should either
improve the brand to get more revenues or create a new brand with more taste according to the
preferences of customers. The opportunities include the franchises and partnerships to improve
57
its revenue and brand. The threats are severe competition from the major competitors like Coca-
Cola and Pepsi.
6.7. Conclusion
A. G. Barr has various capabilities to meet its business objectives. The company also tries to
improve its capabilities. The board of directors and employees of the company helps it to meet
its strategic objectives. The capital structure of A. G. Barr mainly consists of equity capital,
retained earnings and reserves. Only 0.1 of its capital structure is debt. The company’s
profitability and liquidity are improved from the previous year. Yet, compared to their
competitors, it has to improve further. The company’s production expenses are increased in the
current year due to which the gross margin of A. G. Barr has decreased. Hence, it should also
focus on controlling these expenses. The cash flow analysis reveals the better performance of A.
G. Barr in the current year as it could meet its current and operating obligations with ease. The
company should focus on more efficient strategies to compete with its competitors. Using its
strengths such as brand reputations and more customers, the company should overcome its
weaknesses.
58
7. Company Share Valuation
7.1. Introduction
This chapter examines the models for share price evaluation and their limitations. Sensitivity
analysis and technical analysis are also performed in this chapter. Based on the previous year
figures, this chapter focuses on assuming the figures for the next five years.
7.2. Dividend Discount Model
Dividend discount model is used to evaluate the share price of the firms using the projected
dividends by discounting them to the present value. Dividend Discount Model is used to find
evaluate discounted cash flow method and discounted abnormal earnings.
Calculation of Projected Dividend for the next 5 years
The projected dividend = D0 x 1+ g = 8.1943(1.1935) = 9.77p
D1 = 9.77 (1.0621) = 10.37p
D2 = 10.37 (1.0621) = 10.59p
D3 = 10.59 (1.0621) = 11.25p
D4 = 11.25 (1.0621) = 11.95p
D5 = 11.95 (1.0621) = 12.69p
7.2.1. Discount Rate
Discount rate is essential to perform valuation and to find out weighted average cost of capital
(WACC). The financial reports of A. G. Barr indicate that the firm has meagre amount of debt.
Hence, it is assumed there will be no changes in its capital structure in the near future. In this
case, it is decided to use discount rate as the cost of capital rather than using WACC. The cost of
equity is determined in the following way:
43 A.G. Barr Plc. Annual Report and Accounts 2014, p. 1
59
re= rf + β [E(rm) – rf]
where re is the return on equity, is risk free rate, is used to measure the systematic risk of A. G.
Barr and [E(rm) – rf] is the risk the premium. The risk free rate is 2.80 44% which is yield on 10
year gilt. The β for A. G. Barr is 0.6645. The equity risk premium for UK is 5.17 46%. Inserting the
figures in the formula, the cost of equity equal to 6.2122%.
7.2.2. Discount Cash Flow Method
Cash flows and discount rates should never be mixed and matched. One of the most important
errors is to avoid the mismatching cash flows and discount rates. This is due to the fact that
discounting cash flows to equity at the weighted average cost of capital will lead to an upwardly
biased estimate of the value of the firm.
The discount rate can either be a cost of equity or a cost of capital. If equity valuation is being
done, then it is a cost of equity or if the firm is being valued, then it is considered a cost of
capital. It should be noted that discount rate can be in either nominal terms or real terms. It
depends on whether the cash flows are nominal or real (Damodaran, 2012).
The discounted cash flow method assumes that the dividends paid by the company are equal to
the free cash flows to equity. This section helps to forecast the free cash flows to equity.
The predicted income statement and balance sheet are constructed based on the assumptions in
Appendix 1 and showed in Appendix 2. The change in both the net operating working capital
and net long-term assets were subtracted from NOPAT from 2015 to 2019. Discount rate of
44 Bloomberg. (2014). http://www.bloomberg.com/markets/rates -bonds/government-bonds/uk/ 45 Digital Look. (2014). http://www.digitallook.com/companyresearch/10937/Barr_A_G/company_res earch.html 46 Pages.stern.nyu.edu. (2014). http://pages.stern.nyu.edu/~adamodar/New_Home_Page/datafile/ctryprem.html
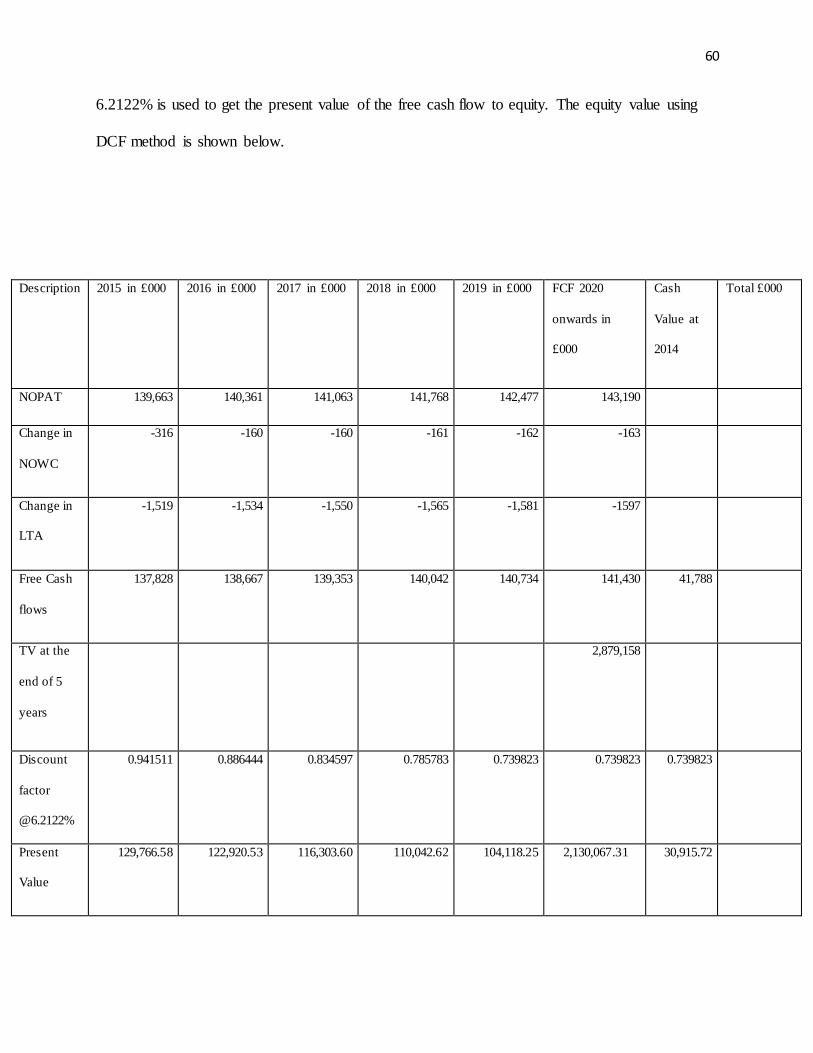
60
6.2122% is used to get the present value of the free cash flow to equity. The equity value using
DCF method is shown below.
Description 2015 in £000 2016 in £000 2017 in £000 2018 in £000 2019 in £000 FCF 2020
onwards in
£000
Cash
Value at
2014
Total £000
NOPAT 139,663 140,361 141,063 141,768 142,477 143,190
Change in
NOWC
-316 -160 -160 -161 -162 -163
Change in
LTA
-1,519 -1,534 -1,550 -1,565 -1,581 -1597
Free Cash
flows
137,828 138,667 139,353 140,042 140,734 141,430
41,788
TV at the
end of 5
years
2,879,158
Discount
factor
@6.2122%
0.941511 0.886444 0.834597 0.785783 0.739823 0.739823 0.739823
Present
Value
129,766.58 122,920.53 116,303.60 110,042.62 104,118.25 2,130,067.31
30,915.72
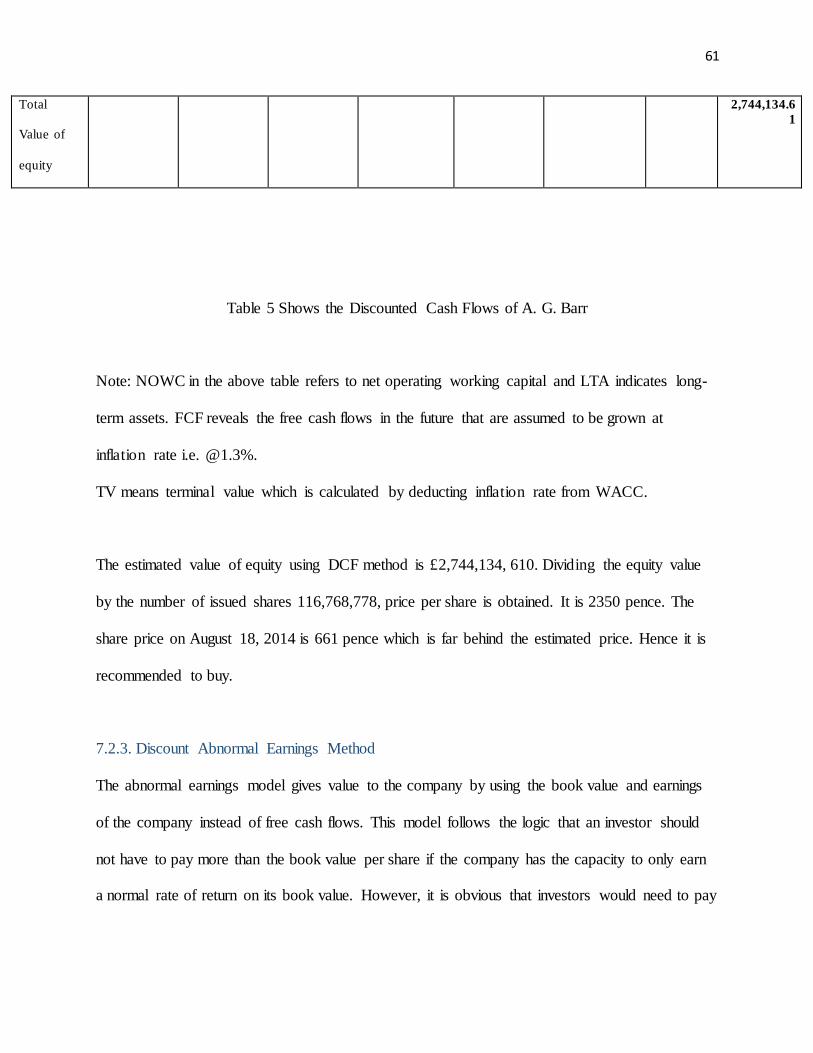
61
Table 5 Shows the Discounted Cash Flows of A. G. Barr
Note: NOWC in the above table refers to net operating working capital and LTA indicates long-
term assets. FCF reveals the free cash flows in the future that are assumed to be grown at
inflation rate i.e. @1.3%.
TV means terminal value which is calculated by deducting inflation rate from WACC.
The estimated value of equity using DCF method is £2,744,134, 610. Dividing the equity value
by the number of issued shares 116,768,778, price per share is obtained. It is 2350 pence. The
share price on August 18, 2014 is 661 pence which is far behind the estimated price. Hence it is
recommended to buy.
7.2.3. Discount Abnormal Earnings Method
The abnormal earnings model gives value to the company by using the book value and earnings
of the company instead of free cash flows. This model follows the logic that an investor should
not have to pay more than the book value per share if the company has the capacity to only earn
a normal rate of return on its book value. However, it is obvious that investors would need to pay
Total
Value of
equity
2,744,134.6
1
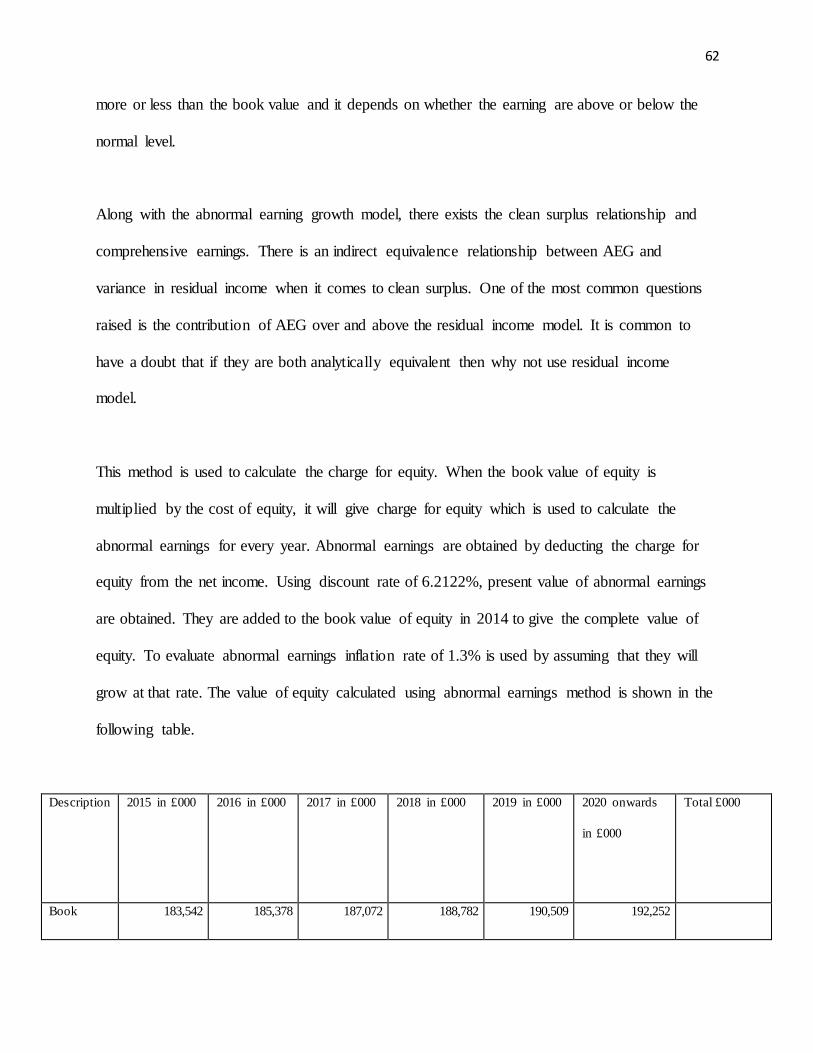
62
more or less than the book value and it depends on whether the earning are above or below the
normal level.
Along with the abnormal earning growth model, there exists the clean surplus relationship and
comprehensive earnings. There is an indirect equivalence relationship between AEG and
variance in residual income when it comes to clean surplus. One of the most common questions
raised is the contribution of AEG over and above the residual income model. It is common to
have a doubt that if they are both analytically equivalent then why not use residual income
model.
This method is used to calculate the charge for equity. When the book value of equity is
multiplied by the cost of equity, it will give charge for equity which is used to calculate the
abnormal earnings for every year. Abnormal earnings are obtained by deducting the charge for
equity from the net income. Using discount rate of 6.2122%, present value of abnormal earnings
are obtained. They are added to the book value of equity in 2014 to give the complete value of
equity. To evaluate abnormal earnings inflation rate of 1.3% is used by assuming that they will
grow at that rate. The value of equity calculated using abnormal earnings method is shown in the
following table.
Description 2015 in £000 2016 in £000 2017 in £000 2018 in £000 2019 in £000 2020 onwards
in £000
Total £000
Book 183,542 185,378 187,072 188,782 190,509 192,252

63
Table 6 Shows the Discounted Abnormal Earnings of A. G. Barr
Value of
Equity
Net Income 139,663 140,361 141,063 141,768 142,477 143,190
Charge for
Equity
-11,402.0 -11,516.1 -11,621.3 -11,727.5 -11,834.8 -11,943.1
Abnormal
Earnings
128,261.00 128,844.95 129,441.71 130,040.48 130,642.20 131,246.92
TV of
Abnormal
Earnings
2,671,856.19
Discount
factor
@6.2122%
0.941511 0.886444 0.834597 0.785783 0.739823 0.739823
Present
Value
120,759.15 114,213.83 108,031.67 102,183.60 96,652.10 1,976,700.67
2,518,541
Book
Value of
Equity at
start
183,542
Total
Value of
equity
2,702,083.01
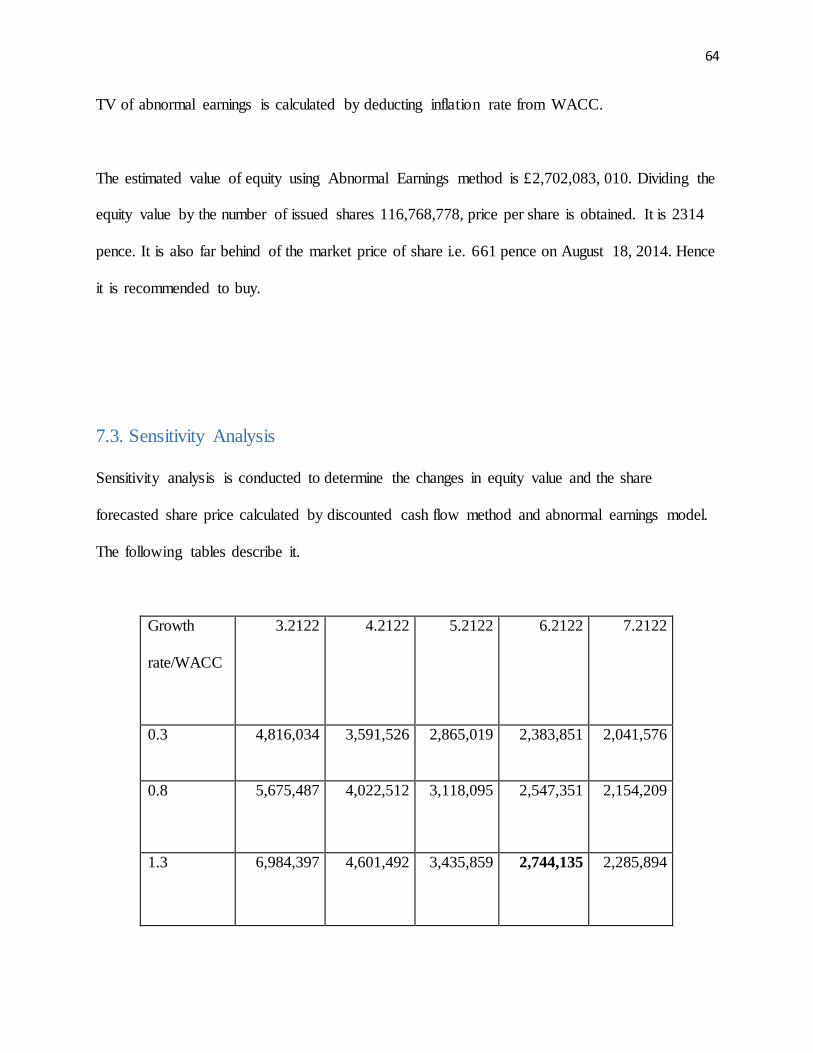
64
TV of abnormal earnings is calculated by deducting inflation rate from WACC.
The estimated value of equity using Abnormal Earnings method is £2,702,083, 010. Dividing the
equity value by the number of issued shares 116,768,778, price per share is obtained. It is 2314
pence. It is also far behind of the market price of share i.e. 661 pence on August 18, 2014. Hence
it is recommended to buy.
7.3. Sensitivity Analysis
Sensitivity analysis is conducted to determine the changes in equity value and the share
forecasted share price calculated by discounted cash flow method and abnormal earnings model.
The following tables describe it.
Growth
rate/WACC
3.2122 4.2122 5.2122 6.2122 7.2122
0.3 4,816,034
3,591,526
2,865,019
2,383,851
2,041,576
0.8 5,675,487
4,022,512
3,118,095
2,547,351
2,154,209
1.3 6,984,397
4,601,492
3,435,859
2,744,135 2,285,894
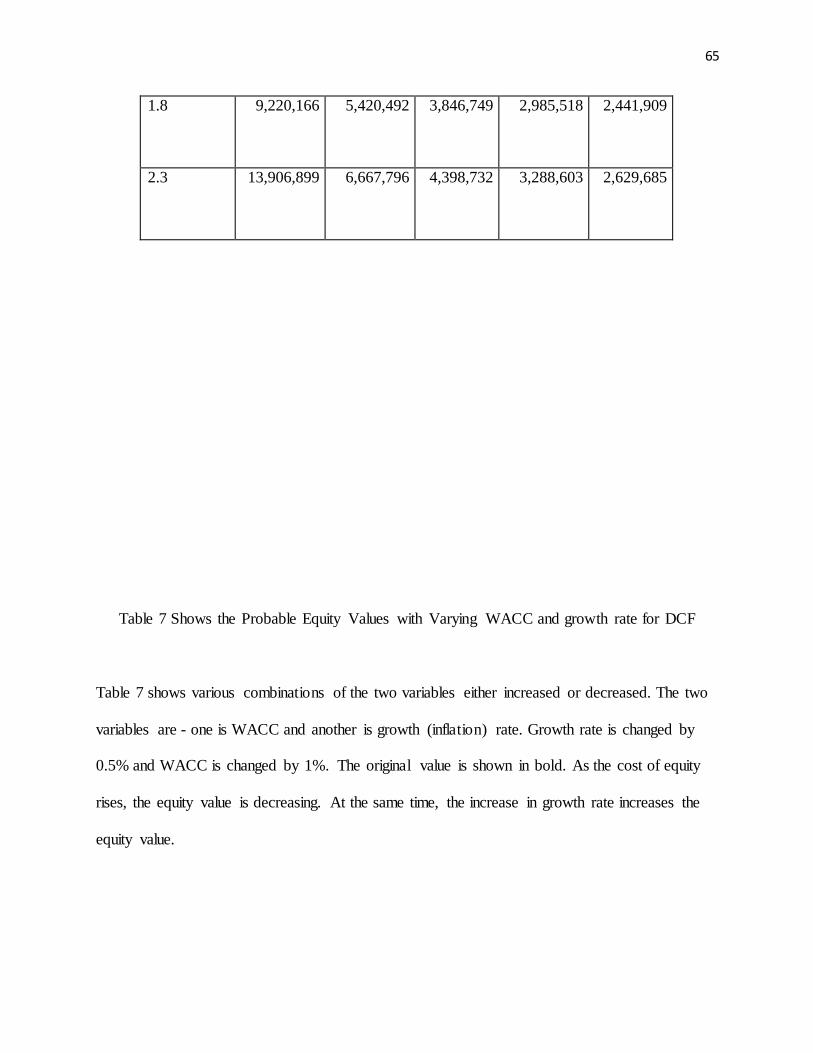
65
Table 7 Shows the Probable Equity Values with Varying WACC and growth rate for DCF
Table 7 shows various combinations of the two variables either increased or decreased. The two
variables are - one is WACC and another is growth (inflation) rate. Growth rate is changed by
0.5% and WACC is changed by 1%. The original value is shown in bold. As the cost of equity
rises, the equity value is decreasing. At the same time, the increase in growth rate increases the
equity value.
1.8 9,220,166
5,420,492
3,846,749
2,985,518
2,441,909
2.3 13,906,899
6,667,796
4,398,732
3,288,603
2,629,685
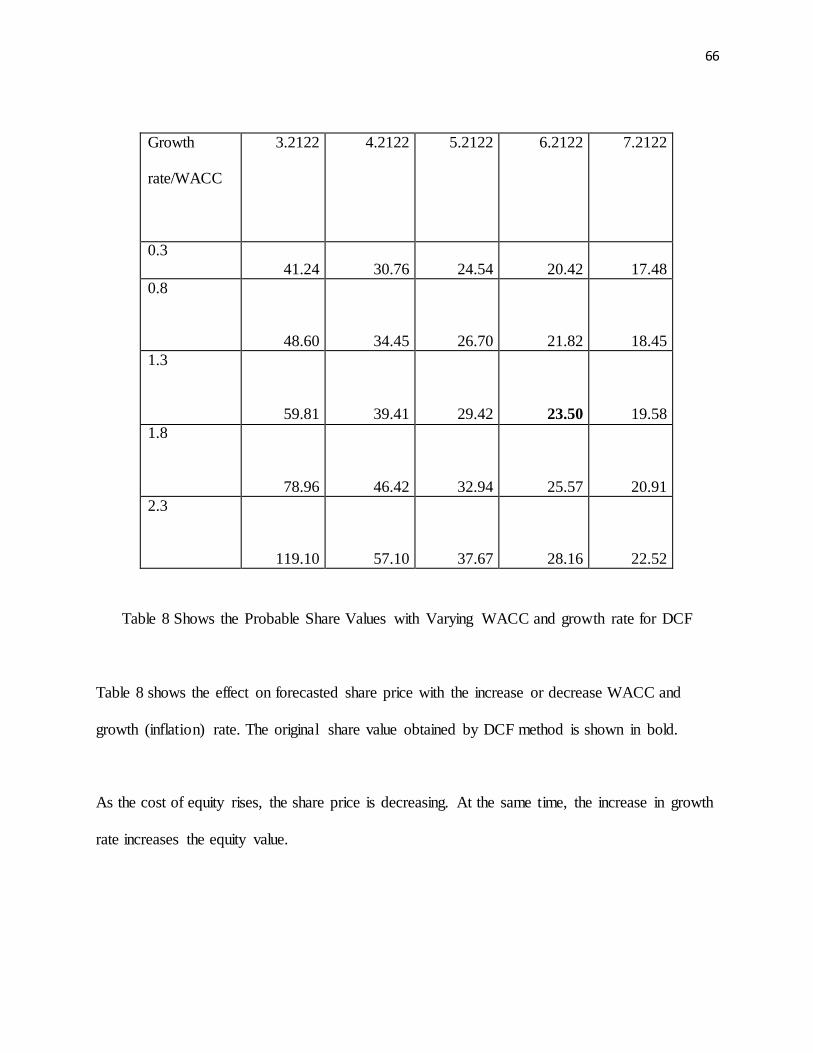
66
Table 8 Shows the Probable Share Values with Varying WACC and growth rate for DCF
Table 8 shows the effect on forecasted share price with the increase or decrease WACC and
growth (inflation) rate. The original share value obtained by DCF method is shown in bold.
As the cost of equity rises, the share price is decreasing. At the same time, the increase in growth
rate increases the equity value.
Growth
rate/WACC
3.2122 4.2122 5.2122 6.2122 7.2122
0.3
41.24 30.76 24.54 20.42 17.48
0.8
48.60 34.45 26.70 21.82 18.45
1.3
59.81 39.41 29.42 23.50 19.58
1.8
78.96 46.42 32.94 25.57 20.91
2.3
119.10 57.10 37.67 28.16 22.52
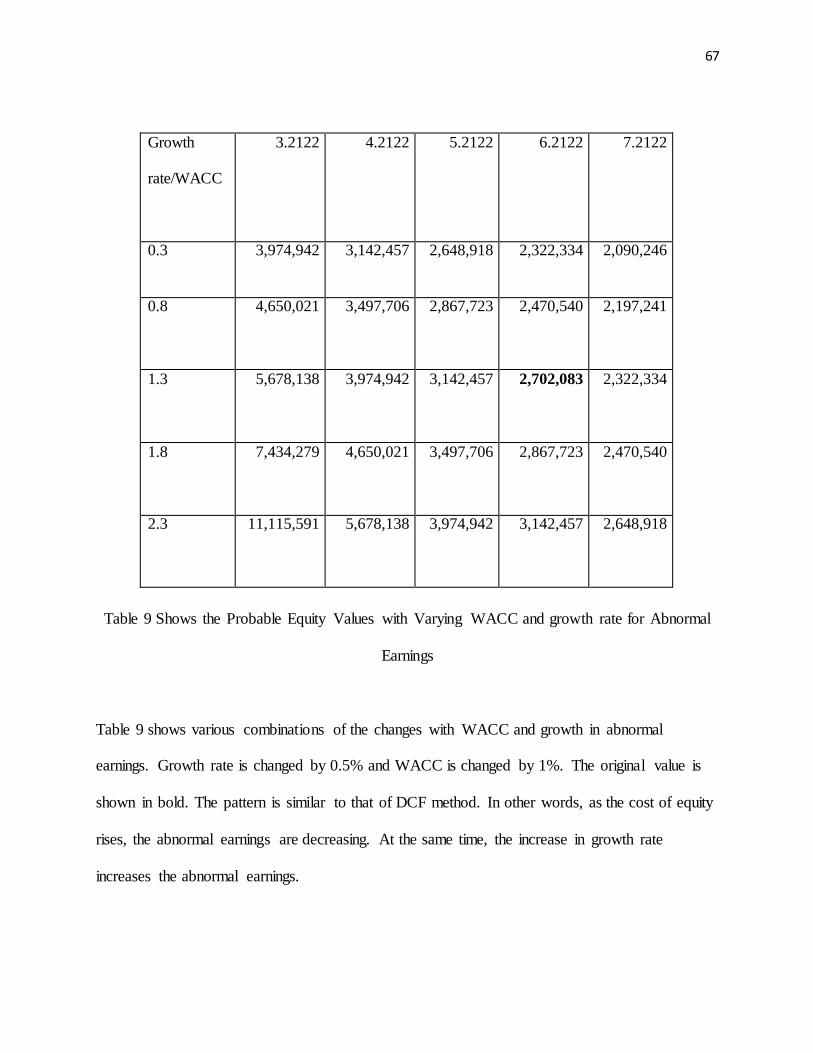
67
Table 9 Shows the Probable Equity Values with Varying WACC and growth rate for Abnormal
Earnings
Table 9 shows various combinations of the changes with WACC and growth in abnormal
earnings. Growth rate is changed by 0.5% and WACC is changed by 1%. The original value is
shown in bold. The pattern is similar to that of DCF method. In other words, as the cost of equity
rises, the abnormal earnings are decreasing. At the same time, the increase in growth rate
increases the abnormal earnings.
Growth
rate/WACC
3.2122 4.2122 5.2122 6.2122 7.2122
0.3 3,974,942
3,142,457
2,648,918
2,322,334
2,090,246
0.8 4,650,021
3,497,706
2,867,723
2,470,540
2,197,241
1.3 5,678,138
3,974,942
3,142,457
2,702,083
2,322,334
1.8 7,434,279
4,650,021
3,497,706
2,867,723
2,470,540
2.3 11,115,591
5,678,138
3,974,942
3,142,457
2,648,918
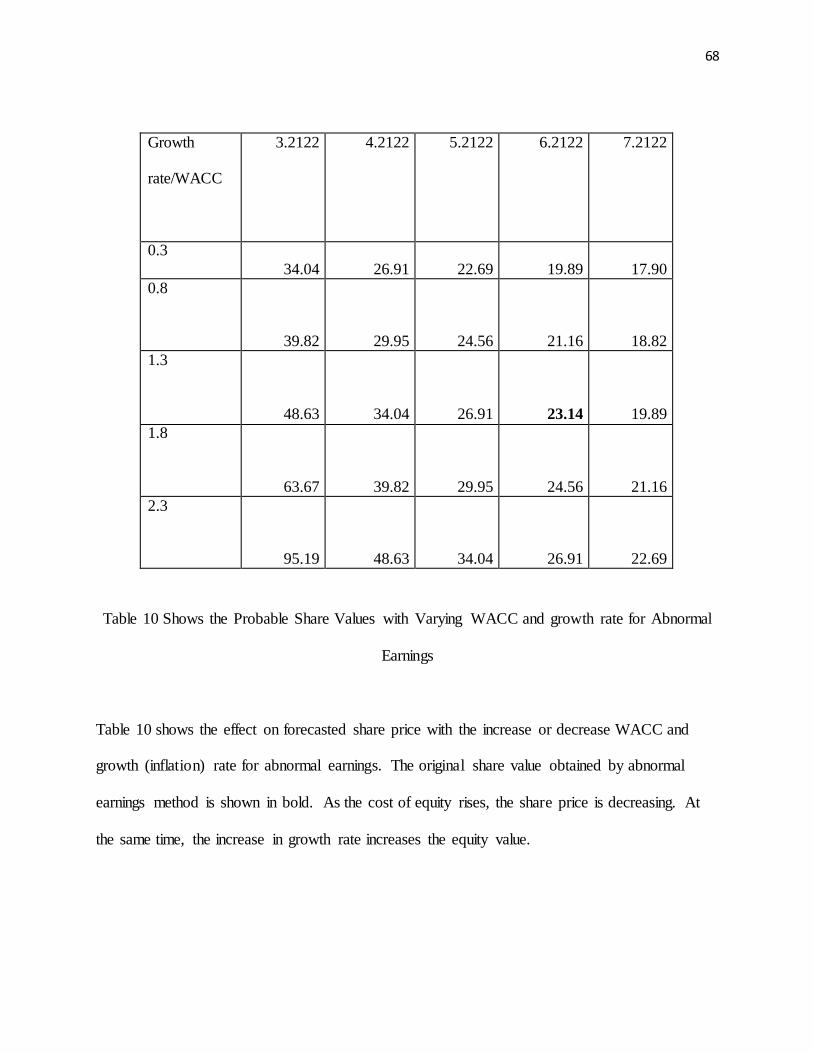
68
Table 10 Shows the Probable Share Values with Varying WACC and growth rate for Abnormal
Earnings
Table 10 shows the effect on forecasted share price with the increase or decrease WACC and
growth (inflation) rate for abnormal earnings. The original share value obtained by abnormal
earnings method is shown in bold. As the cost of equity rises, the share price is decreasing. At
the same time, the increase in growth rate increases the equity value.
Growth
rate/WACC
3.2122 4.2122 5.2122 6.2122 7.2122
0.3
34.04 26.91 22.69 19.89 17.90
0.8
39.82 29.95 24.56 21.16 18.82
1.3
48.63 34.04 26.91 23.14 19.89
1.8
63.67 39.82 29.95 24.56 21.16
2.3
95.19 48.63 34.04 26.91 22.69
69
7.4. Limitations of Share Valuation Methods
Dividend Discount Model is used to evaluate the share price. It is simple and very useful for
companies that pay dividends. However, it is not useful for the companies that do not pay
dividend. It mainly depends upon the dividends and assumed projected dividends in future too
based on the past data (CFA Tutor, 2014). But, in reality the dividends may not grow as
predicted. The dividend policy is also not constant. The board of directors monitor the dividend
policies according to the profits they obtain. Another drawback is that it is useful for limited
number of companies only as most of the companies do not pay regular dividends in these days.
Both discounted cash flow method and abnormal method have some differences as mentioned in
the corresponding sections. Discounted cash flows method focuses on cash flows and abnormal
earnings method focuses on earnings.
Though the results of both the methods are almost similar to the estimated WACC with
forecasted growth rate, they are different with changes in WACC and growth rate. This is due to
the differences of procedures in constructing them. Abnormal earnings are taken mainly from
predicted income statement whereas the discounted cash flow method needs changes in operating
working capital and changes in long-term assets as well. And another major difference is
terminal value in both the methods.
7.5. Technical Analysis
Technical analysis refers to the study of collective forces that affect the stock prices in the
market. This analysis is vital to assess the technical conditions of the market; these conditions
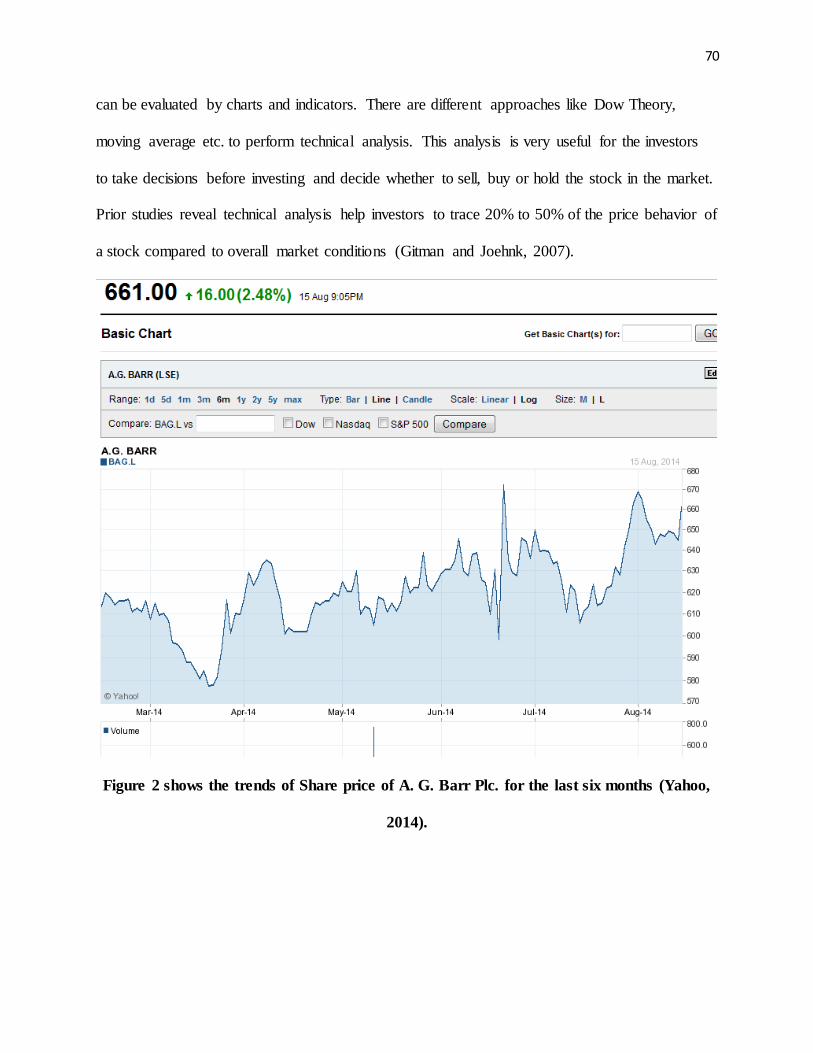
70
can be evaluated by charts and indicators. There are different approaches like Dow Theory,
moving average etc. to perform technical analysis. This analysis is very useful for the investors
to take decisions before investing and decide whether to sell, buy or hold the stock in the market.
Prior studies reveal technical analysis help investors to trace 20% to 50% of the price behavior of
a stock compared to overall market conditions (Gitman and Joehnk, 2007).
Figure 2 shows the trends of Share price of A. G. Barr Plc. for the last six months (Yahoo,
2014).
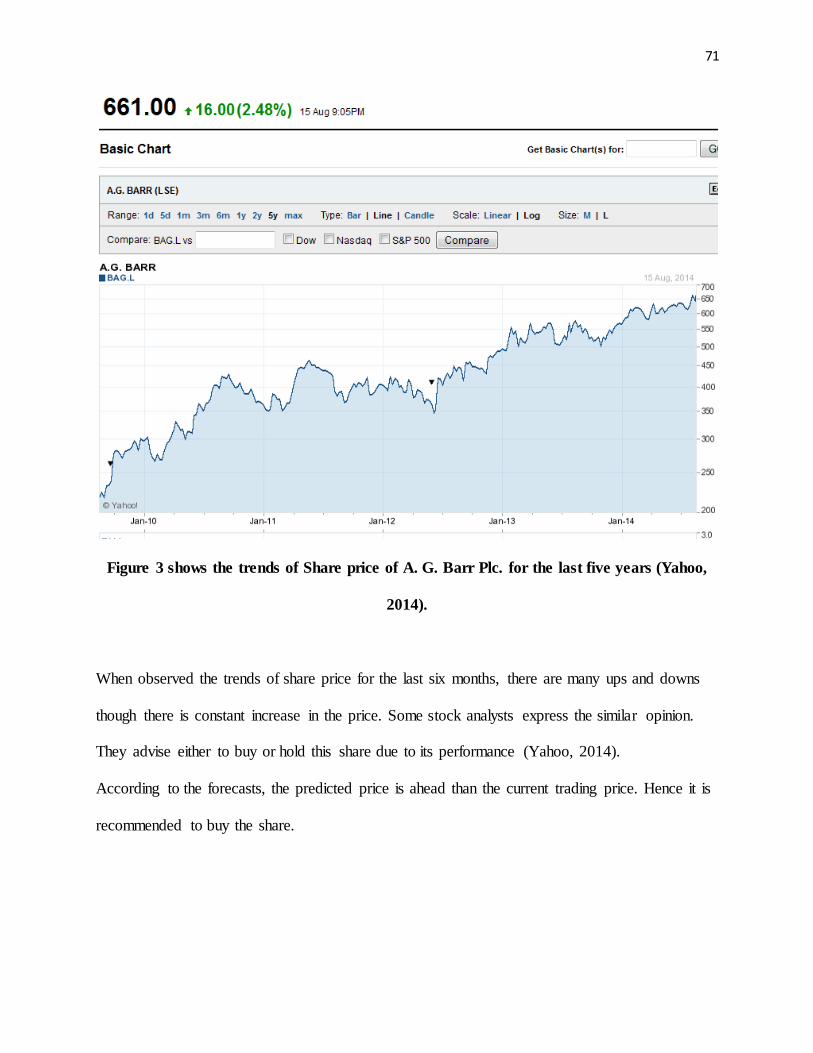
71
Figure 3 shows the trends of Share price of A. G. Barr Plc. for the last five years (Yahoo,
2014).
When observed the trends of share price for the last six months, there are many ups and downs
though there is constant increase in the price. Some stock analysts express the similar opinion.
They advise either to buy or hold this share due to its performance (Yahoo, 2014).
According to the forecasts, the predicted price is ahead than the current trading price. Hence it is
recommended to buy the share.

72
7.6. Conclusion
This chapter analyzes the share value of A. G. Barr Plc. using Dividend Discount Model,
discounted cash flows and abnormal earnings method. Using these model, the share price is
evaluated. The calculated share price is lower than the actual market price at which it is currently
trading. Based on the calculation, it is analyzed that the share price of A. G. Barr is overvalued in
the market. The trends in the share price of A. G. Barr also reveals this hence it is advised to buy
the share.
73
8. Conclusion and Recommendations
8.1. Summary
A. G. Barr is one of the UK’s renowned soft drink selling companies. It is popular for its IRN -
BRU brand. KA, Rubicon, Barr, Simply, St Clements, Findlays, Abbot’s, Sun exotic, Strathmore
Water, D‘N’B and Tizer are some other brands of the company. The company has partnership
brands such as Orangina, Rockstar and Snapple to enhance its brand recognition in many
geographical areas. The company has good brand reputation for its soft drinks and beverages.
The turnover and profit margins, and liquidity ratios of the company increased in 2014 from
2013. The aim of this dissertation is to evaluate the share price of A. G. Barr Plc. and
recommend investors whether to buy, hold or sell. In this context, the capital structure theories
are reviewed based on earlier researches. The capital structure is a mix of debt and equity of the
firms. Normally companies issue shares when the share price has been increasing to improve
their funds. When observed the capital structure of A. G. Barr, the main constituent of its capital
is its equity capital and reserves. On the other hand, debt is a very meagre component of its
capital structure. There are many reasons for companies depending on issuing equity rather than
debt. The first and foremost thing is the cost of debt is expensive than the cost of equity since
interest has to be paid on the debt. But, if the company issues shares there is no need to pay any
such expenses. Even the payment of dividends is not mandatory. Hence, the issuance of shares
does not cost much to the company.
Here, A.G. Barr’s share price has been rising over the years. So the issuance of shares assists the
company to get more funds and to prevent from the cost of debt which is expensive. Though the
dividend payment is not mandatory, the company has been paying them without any interruption
74
which attracts investors to buy them. All these factors help the company to grow its share price
constantly. The share price is evaluated using Dividend Discount Model, discounted cash flow
method and abnormal earnings method. The first model is used because it is simple to use and
the company has been paying dividends for many years. The other two models are used to
forecast the share price. The calculated share price using all these models is higher than the
current trading market price indicating the overvaluation of stock. Yet, the trends reveal that the
investors are interested to buy this share. Hence, it is ideal to buy the share.
8.2. Share Price Performance
The trends of the share price reveal that it has been growing since November 2013. Though
slight downfalls have been seen in the trends in this period, majorly it has been rising. When
observed the trends for the last five years from January 2010 to January 2014 from figure 3 in the
earlier chapter, it has been increasing constantly. Except the major downfall in the mid-2012,
remaining downfalls are minor.
8.3. Recommendations
The better financial performance of the company with constant dividend payment policy attracts
the investors and encourages them to invest in that company shares. Based on the trends of the
share price and analyst opinion, the shareholders of A. G. Barr Plc. are advised to buy.
75
Appendices
Appendix 1 Assumptions for Valuation Models
Sales
Sales in 2014 increased by 6.94% in 2014. It is 18.69%%, 10.41%, 6.58%, 6.59% in 2010, 2011,
2012 and 2013 respectively. It is constant by 6.6% on average in the last years. Hence the sales
are expected to grow by 7% in 2015, 7% in 2016, 7.5% in 2017, 7.5% in 2018 8% in 2019 and
beyond that.
NOPAT
NOPAT refers to Net Operating Profit After Tax. It is calculated as follows:
Operating profit before tax x (1 – tax rate)
The tax rate for 2010, 2011, 2012, 2013 and 2014 is 26.59%, 25.59%, 23.64%, 18.18, 18.18%
respectively. The average tax rate for the five years is 22.44%. The NOPAT/Sales margin is
8.91%, 10.57%, 10.81%, 12.05% and 12.17% for the last five years. This indicates that the
margin has been increasing since 2010. Hence, it is assumed that the margin will increase at
0.5% constantly.
Net Income
The projected net income is simply taken the forecasted NOPAT which is the income received
after tax.
Net Operating Working Capital
The net operating working capital is taken as current assets minus current liabilities. The net
operating working capital to sales ratio increased in 2011 form 2010, but decreased in the next
two years. Again it increased to 12.32% in 2014. The fluctuations are major. Hence, it is
assumed that this ratio will rise by 1% each year in the next two years and 0.5% there onwards.
76
Net Long Term Assets
The net long term assets/sales ratio decreased from 2010 to 2012. The ratio increased in 2013
and again decreased in 59.20%. Hence it is assumed that this ratio will increase by 1% each year
in the coming years.
Net Debt
The weight of debt in the capital structure of A.G. Barr is only 0.1%. Hence, the debt value is
ignored and taken as 0.
Shareholders Equity and Total Net Capital
As A. G. Barr is considered with no debt, both the equity of shareholders and total net capital are
equal.
WACC
As the cost of debt is only 0.1%, it is ignored. This reveals that the WACC is equal to the cost of
equity that is 6.2122% which was calculated in section 6.2.1.
Free Cash Flow and Abnormal Earnings
The free cash flow in the discounted cash flow method assumed to be increased at the current
inflation rate1.3%47. Similarly, the abnormal earnings in the abnormal earnings method are also
assumed to be increased at the same rate.
Number of Shares
The number of shares in issue is 116,768,778.
47 BBC. (2014). http://www.bbc.com/news/10612209.
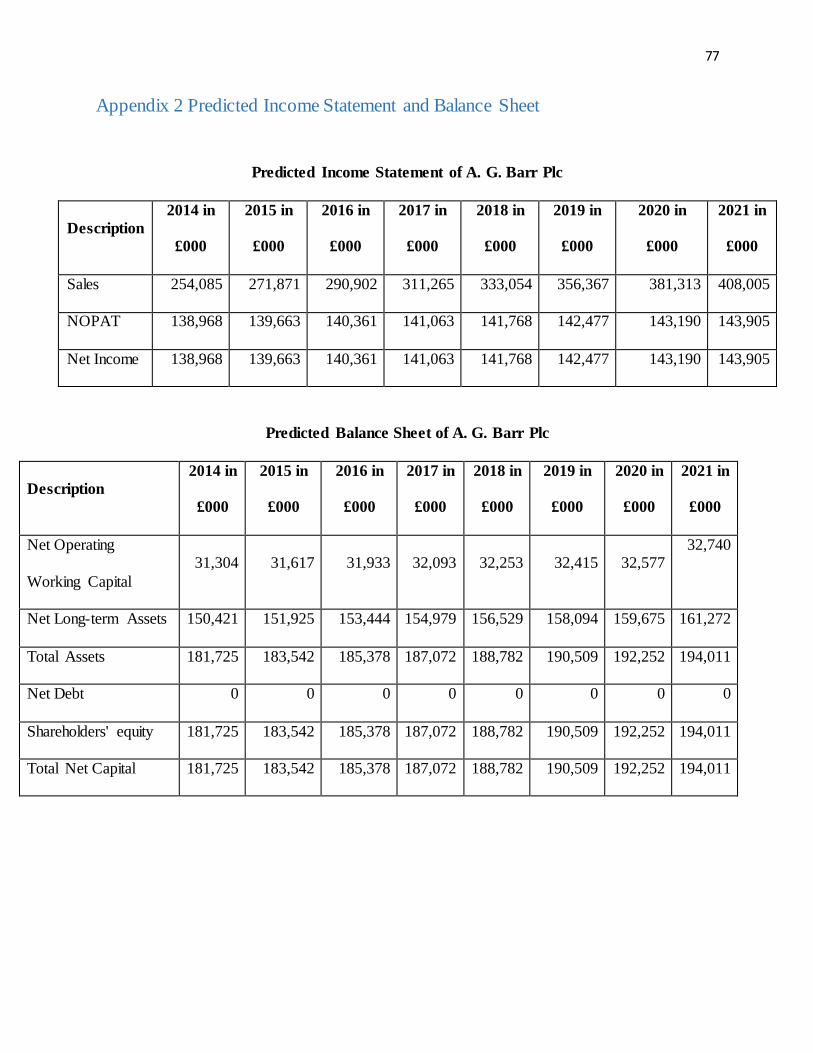
77
Appendix 2 Predicted Income Statement and Balance Sheet
Predicted Income Statement of A. G. Barr Plc
Description
2014 in
£000
2015 in
£000
2016 in
£000
2017 in
£000
2018 in
£000
2019 in
£000
2020 in
£000
2021 in
£000
Sales 254,085 271,871 290,902 311,265 333,054 356,367 381,313 408,005
NOPAT 138,968 139,663 140,361 141,063 141,768 142,477 143,190 143,905
Net Income 138,968 139,663 140,361 141,063 141,768 142,477 143,190 143,905
Predicted Balance Sheet of A. G. Barr Plc
Description
2014 in
£000
2015 in
£000
2016 in
£000
2017 in
£000
2018 in
£000
2019 in
£000
2020 in
£000
2021 in
£000
Net Operating
Working Capital
31,304 31,617 31,933 32,093 32,253 32,415 32,577 32,740
Net Long-term Assets 150,421 151,925 153,444 154,979 156,529 158,094 159,675 161,272
Total Assets 181,725 183,542 185,378 187,072 188,782 190,509 192,252 194,011
Net Debt 0 0 0 0 0 0 0 0
Shareholders' equity 181,725 183,542 185,378 187,072 188,782 190,509 192,252 194,011
Total Net Capital 181,725 183,542 185,378 187,072 188,782 190,509 192,252 194,011
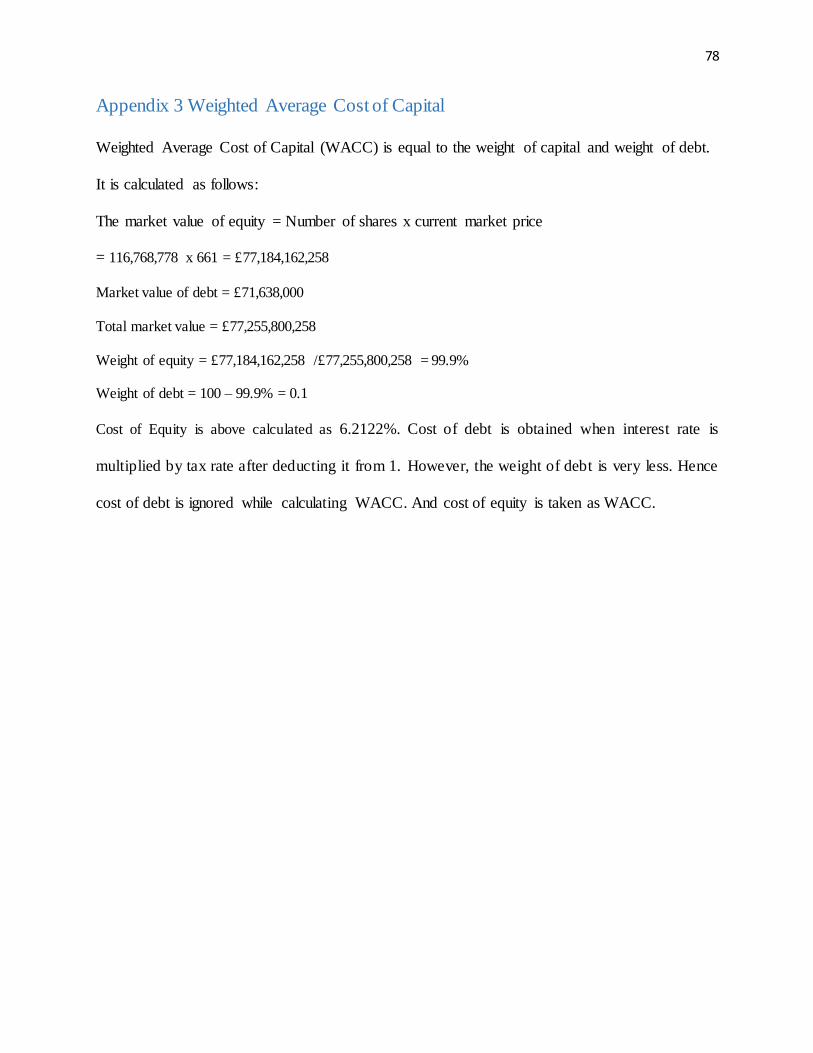
78
Appendix 3 Weighted Average Cost of Capital
Weighted Average Cost of Capital (WACC) is equal to the weight of capital and weight of debt.
It is calculated as follows:
The market value of equity = Number of shares x current market price
= 116,768,778 x 661 = £77,184,162,258
Market value of debt = £71,638,000
Total market value = £77,255,800,258
Weight of equity = £77,184,162,258 /£77,255,800,258 = 99.9%
Weight of debt = 100 – 99.9% = 0.1
Cost of Equity is above calculated as 6.2122%. Cost of debt is obtained when interest rate is
multiplied by tax rate after deducting it from 1. However, the weight of debt is very less. Hence
cost of debt is ignored while calculating WACC. And cost of equity is taken as WACC.
79
References
Altman, E. (1984). A Further Empirical Investigation of the Bankruptcy Cost Question. Journal
of Finance, 39, 1067-1089.
A.G. Barr Plc. (a) (2014). Company Overview. Retrieved August 7, 2014, from
http://www.agbarr.co.uk/ces_general.nsf/wpg/about_us-company_overview.html
A.G. Barr Plc. (b) (2014). Our Strategy. Retrieved August 7, 2014, from
http://www.agbarr.co.uk/ces_general.nsf/wpg/about_us-our_strategy.html
A.G. Barr Plc. Annual Report. (2014). Annual Report and Accounts 2014. Retrieved August 7,
2014, from
http://www.agbarr.co.uk/pdf/Annual%20Report%20and%20Accounts%20January%2020
14.pdf
Alchian, A. and Demsetz, H. (1972). Production, Information Costs and Economic Organization.
American Economic Review, 62, 777-795.
Auerbach, A. J. (2005). Taxation and Capital Spending. Academic Consultants Meeting of the
Board of Governors of the Federal Reserve System, 1-17.
Bainbridge, J. (2012). Sector Insight: carbonated soft drinks. Retrieved August 12, 2014, from
http://www.marketingmagazine.co.uk/article/1145167/sector- insight-carbonated-soft-
drinks
BBC News. (2013). Britvic and AG Barr merger provisionally cleared. Retrieved August 7,
2014, from http://www.bbc.com/news/business-22852442
Bhattacharya, S. (1979). Imperfect Information, Dividend Policy, and the ‘Bird in the Hand’
Fallacy,” Bell Journal of Economics, 10, 259-270.

80
Bradley, M., Jarrell, G., and Kim, E. H. (1984). On the existence of an Optimal Capital
Structure: Theory and Evidence. Journal of Finance, 39, 857-878.
CFA Tutor. (2014). Dividend Discount Model – DDM. Retrieved August 17, 2014, from
http://cfatutor.me/2013/07/08/dividend-discount-model-ddm/
Cshco.com. (2012). How capital structure affects business valuation. Retrieved November 4,
2014, from http://www.cshco.com/articles/how-capital-structure-affects-business-
valuation/
Coase, R. (1972). Durability and Monopoly. Journal of Law and Economics, 15, 142-149.
Conference-board.org. (2014). Global Economic Outlook 2014. Retrieved August 7, 2014, from
https://www.conference-board.org/data/globaloutlook/
Damodaran, A. (2012). Basics of Discounted Cash Flow Valuation. Retrieved August 17, 2014,
from http://people.stern.nyu.edu/adamodar/pdfiles/basics.pdf
Delcoure, N. (2007). The Determinants of Capital Structure in Transitional Economies.
International Review of Economics and Finance, 16, 400-415.
Eldiomaty, T. (2007). Determinants of Corporate Capital Structure: Evidence from an Emerging
Economy. International Journal of Commerce and Management, 17, 25-43.
Eisfeldt, A. and Rampini, A. (2005). Leasing, Ability to Repossess and Debt Capacity. Kellogg
School of Management, Northwestern University.
Ficenec, J. (2014). Questor share tip: AG Barr still a core holding. Retrieved November 1, 2014,
from http://www.telegraph.co.uk/finance/markets/questor/10858793/Questor-share-tip-
AG-Barr-still-a-core-holding.html
Graham, J.R. (1996). Debt and the Marginal Tax Rate. Journal of Financial Economics, 41, 41-
73.
81
Gitman, L., J. and Joehnk, M., D. (2007). Fundamentals of Investing (10th ed). Boston: Pearson
Addison-Wesley Longman.
Hendel, I. and Lizzari, A. (1999). Interfering with Secondary Markets. RAND Journal of
Economics, 30, 1-21.
Hendel, I and Lizzari, A. (2002). The Role of Leasing Under Adverse Selection. Journal of
Political Economy, 110, 113-143.
Investopedia. (n.d.). Dividend Discount Model. Retrieved August 11, 2014, from
http://www.investopedia.com/terms/d/ddm.asp
Jensen, M.C. (1986). Agency Costs of Free Cash Flow, Corporate Finance, and Takeovers.
American Economic Review, 76, 323-329.
Jensen, M.C. and Meckling, W.H. (1976). Theory of the Firm: Managerial Behavior, Agency
Costs, and Ownership Structure. Journal of Financial Economics, 3, 305-360.
Johnson, S. (1997). The Effect of Bank Debt on Optimal Capital Structure. Financial
Management, 26, 47-56.
Kaviani, M., Fahim, S. R. S., Batebi, M. and Keshavarz, M. K. (2014). Explaining Analysis of
the Relationship between Capital Structure, Cost of Capital and Yield Base Value.
International SAMANM Journal of Finance and Accounting, 2(1), 1-17.
Schauten, M. B. J. (2008). Valuation, Capital Structure Decisions and the Cost of Capital.
Thesis, Erasmus Research Institute of Management, Rotterdam.
Leland, H. (1994). Corporate Debt Value, Bond Covenants, and Optimal Capital Structure.
Journal of Finance, 49, 1213-1252.
82
Little, T. (2014). Irn-Bru maker AG Barr outperforming tough UK soft drinks market . Retrieved
November 1, 2014, from http://www.reuters.com/article/2014/07/25/ag-barr-sales-
idUSL6N0Q024020140725
Mackie-Mason, J. (1990). Do Taxes Affect Corporate Financing Decisions? Journal of Finance,
45, 1471-1493.
Masulis, R. and Korwar, A. (1986). Seasoned Equity Offerings: An Empirical Investigation.
Journal of Financial Economics, 13, 91-118.
McConnell, I. (2012). AG Barr posts sales leap and grabs market share. Retrieved November 1,
2014, from http://www.heraldscotland.com/business/company-news/ag-barr-posts-sales-
leap-and-grabs-market-share.19645168
McCulloch, S. (2011). AG Barr reports 3.5% rise in first half sales. Retrieved November 1,
2014, from http://www.dailyrecord.co.uk/business/company-results- forecasts/ag-barr-
reports-35-rise-3075524
Mikkelson, W. and Partch, W. (1986). Valuation Effects of Security Offerings and the Issuance
Process. Journal of Financial Economics, 13, 31-60.
Modigliani, F. and Miller, M. (1958). The Cost of Capital, Corporate Finance, and the Theory of
Investment. American Economic Review, 48, 261-297.
Modigliani, F. and Miller, M. (1963). Corporate Income Taxes and the Cost of Capital: A
Correction. American Economic Review, 53, 433-443.
Miller, M. H. (1977). Debt and Taxes. Journal of Finance, 32, 261-275.
Miller, M. H. and Upton, C. (1976). Leasing, Buying and the Cost of Capital Services. Journal of
Finance, 31, 761-786.
83
Myers, S., Dill, D. and Bautista, A. (1976). Valuation of Financial Lease Contracts. Journal of
Finance, 31, 799-819.
Nguyen, T. and Ramachandran, N. (2006). Capital Structure in Small and Medium-Sized
Enterprises: The Case of Vietnam. ASEAN Economic Bulletin, 23, 192-211.
Nxtbook.com. (2008). Director’s Report. Retrieved November 1, 2014, from
http://www.nxtbook.com/nxteu/AGBarr/annualreport08/index.php?startid=21
Opler, T. and Titman, S. (1994). Financial Distress and Corporate Performance. Journal of
Finance, 49, 1015-1040.
Pwc. (2014). UK Economic Outlook July 2014: Prospects. Retrieved August 11, 2014, from
http://www.pwc.co.uk/the-economy/publications/uk-economic-outlook/ukeo-july2014-
prospects.jhtml
Rajagopal, S. (2010). The portability of capital structure theory: Do traditional models fit in an
emerging economy. Journal of Finance and Accountancy, 5, 1-17.
Scott, J.H. (1976). A Theory of Optimal Capital Structure. Bell Journal of Economics, 7, 33-54.
Stiglitz, J. (1969). A Re-Examination of the Modigliani-Miller Theorem. American Economic
Review, 59, 784-793.
Stylianou, N. (2014). UK economy upgraded by IMF forecast. Here's what else the World
Economic Outlook expects. Retrieved August 11, 2014, from
http://www.cityam.com/1406226604/uk-economy-upgraded- imf-forecast-world-
economic-outlook-predicted
Supanvanij, J. (2006). Capital Structure: Asian Firms Vs Multinational Firms in Asia. Journal of
the American Academy of Business, 10, 324-330.
84
The World Bank. (2014). Global Economic Prospects. Retrieved August 11, 2014, from
http://www.worldbank.org/en/publication/global-economic-prospects
Titman, S. and Wessels, R. (1988). The Determinants of Capital Structure Choice. Journal of
Finance, 43, 1-19.
Villamil, A. P. (2008). The Modigliani-Miller Theorem: The New Palgrave Dictionary of
Economics. Retrieved August 16, 2014, from
http://www.econ.uiuc.edu/~avillami/course-
files/PalgraveRev_ModiglianiMiller_Villamil.pdf
Vulpala, L. G. (2007). Cola Wars: Five Force Analysis. Retrieved August 11, 2014, from
http://goutham.wordpress.com/2007/10/18/cola-wars-five-forces-analysis/
Yahoo Finance. (2014). A. G. Barr Plc. Retrieved August 17, 2014, from
https://in.finance.yahoo.com/q/ae?s=BAG.L
Ackert, L. Smith, B. (1993). Stock Price Volatility, Ordinary Dividends, and Other Cash Flows
to Shareholders. The Journal of Finance, 4:1147–1160.
Adams, P.D., Wyatt, S.B. and Walker, M.C. (1994). Dividends, Dividend Policy and Option
Valuation: A New Perspective. Journal of Business Finance and Accounting, 21,No
7, September.
Diamond, J. (2007). Earnings Distribution and the Valuation of Shares: Some Recent Evidence
Journal of Financial and Quantitative Analysis, 2(2): 15-30.
Eades, L. and Kenneth M. (1984). On Interpreting Security Returns During the Ex-Dividend
Period, Journal of Financial Economics, 13: 3-34.
85
Easterbrook, H. (1984). “Two Agency Costs Explanations of Dividends”, American Economic
Review, 74: 650-659.
Frankfurter, K. George M. and Bob, G. (2002). Dividend Policy Theories and Their Empirical
Tests, International Review of Financial Analysis,11: 111-138.
Friend, I. and Marshall, P. (1964). Dividend and Stock Prices, American Economic Review, 54:
656-682.
Gaver, J., and Kenneth M. (1993). Additional Evidence on the Association Between the
Investment Opportunity Set and Corporate Financing, Dividend, and Compensation
Policies, Journal of Accounting and Economics,16:125-160.
Holder, E. Frederick, W. Langrehr, and Lawrence H. (1998). Dividend Policy Determinants: An
Investigation of the Influences of Stakeholder Theory, Financial Management, 27:
73-82.
Howe, L. and Keith, M. (1992). One-Time Cash Flow Announcements and Free Cash-Flow
Theory: Share Repurchases and Special Dividends, Journal of Finance, 47: 1963- 1975.
Gerald R. and Thomas S. (1992). Simultaneous Determination of Insider Ownership, Debt, and
Dividend Policies, Journal of Financial and Quantitative Analysis, 27: 274-263.


![Job analysis and Job Design[1]](https://img.pdfslide.us/doc/110x75/5529644a4a795972158b46f7/job-analysis-and-job-design1.jpg)