Embed Size (px)
Citation preview

Black, Brown, Red & Green:
Transition to a low emissions energy environment

Alinta Energy Footprint
2
Contents
Coal generation and the barriers to exit
Who pays the bill and why?
Market dynamics and a soft landing
Life in a low emissions future
1
2
3
4
3

Coal generation and the barriers to exit
Pressure is mounting on coal-fired power stations to close…
…but the reality of shutting down is much more complicated
4
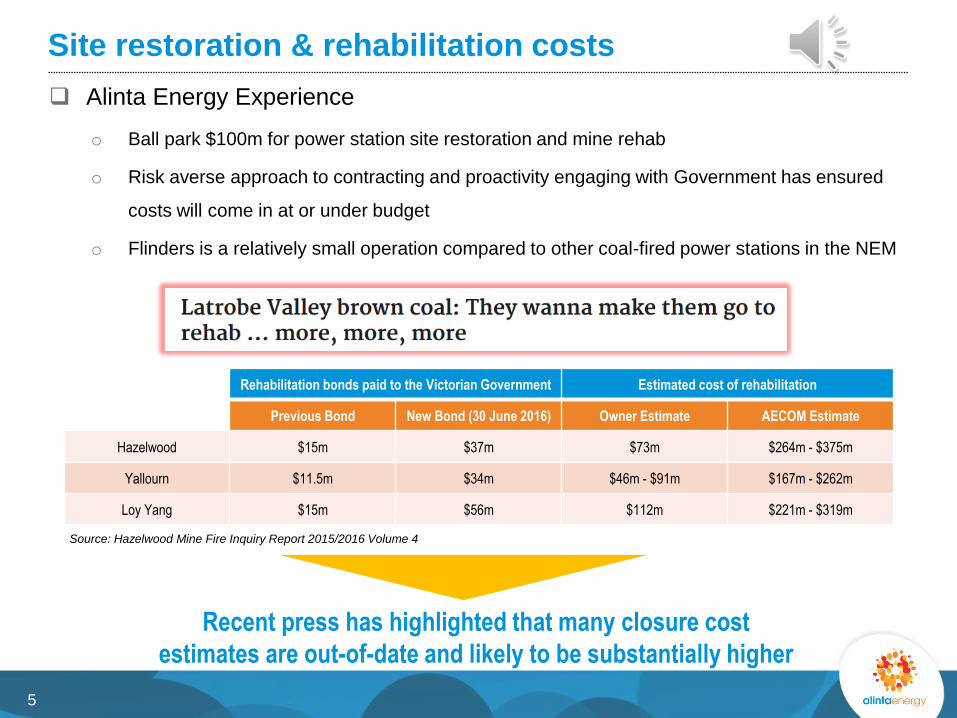
Site restoration & rehabilitation costs
Alinta Energy Experience
o Ball park $100m for power station site restoration and mine rehab
o Risk averse approach to contracting and proactivity engaging with Government has ensured
costs will come in at or under budget
o Flinders is a relatively small operation compared to other coal-fired power stations in the NEM
Recent press has highlighted that many closure cost
estimates are out-of-date and likely to be substantially higher
Rehabilitation bonds paid to the Victorian Government Estimated cost of rehabilitation
Previous Bond New Bond (30 June 2016) Owner Estimate AECOM Estimate
Hazelwood $15m $37m $73m $264m - $375m
Yallourn $11.5m $34m $46m - $91m $167m - $262m
Loy Yang $15m $56m $112m $221m - $319m
Source: Hazelwood Mine Fire Inquiry Report 2015/2016 Volume 4
5
The (ageing) workforce dilemma
Employee reskilling & vocational transitioning
o Numerous programs developed and implemented (eg. transition centre, wellbeing services)
o Several million dollars of costs incurred
Redundancy entitlements
o More than a quarter of Flinders total closure costs
Labour union resistance
o Alinta had unprecedented levels of engagement for a blue collar work force, which fostered an
open and respectful working relationship during closure
An ageing workforce creates challenges and
significantly adds to overall closure costs
6
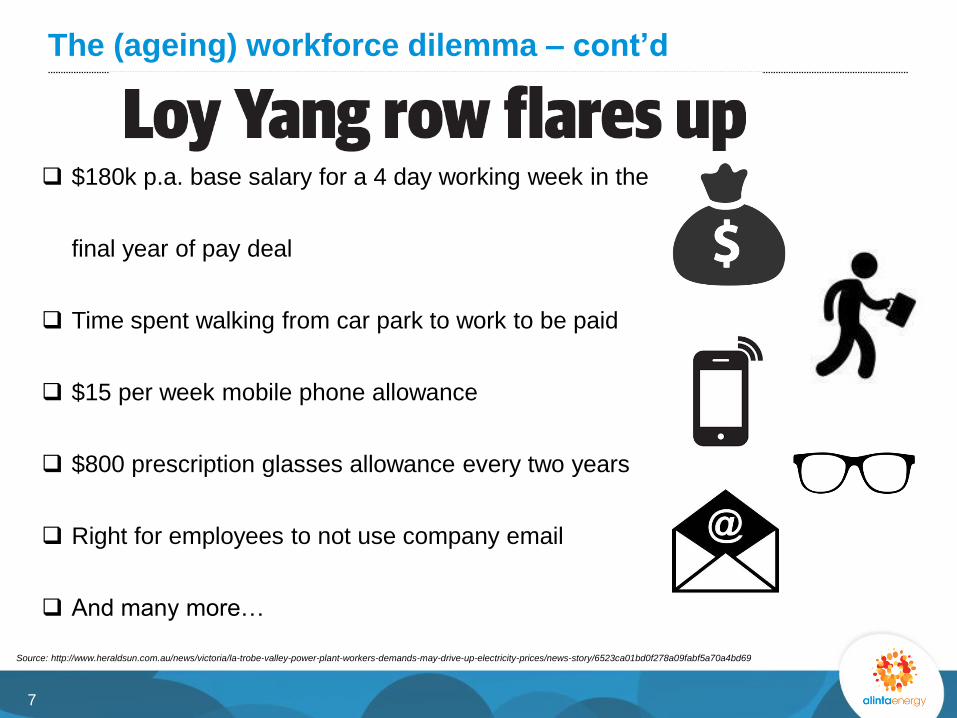
The (ageing) workforce dilemma – cont’d
7
$180k p.a. base salary for a 4 day working week in the
final year of pay deal
Time spent walking from car park to work to be paid
$15 per week mobile phone allowance
$800 prescription glasses allowance every two years
Right for employees to not use company email
And many more…
Source: http://www.heraldsun.com.au/news/victoria/la-trobe-valley-power-plant-workers-demands-may-drive-up-electricity-prices/news-story/6523ca01bd0f278a09fabf5a70a4bd69
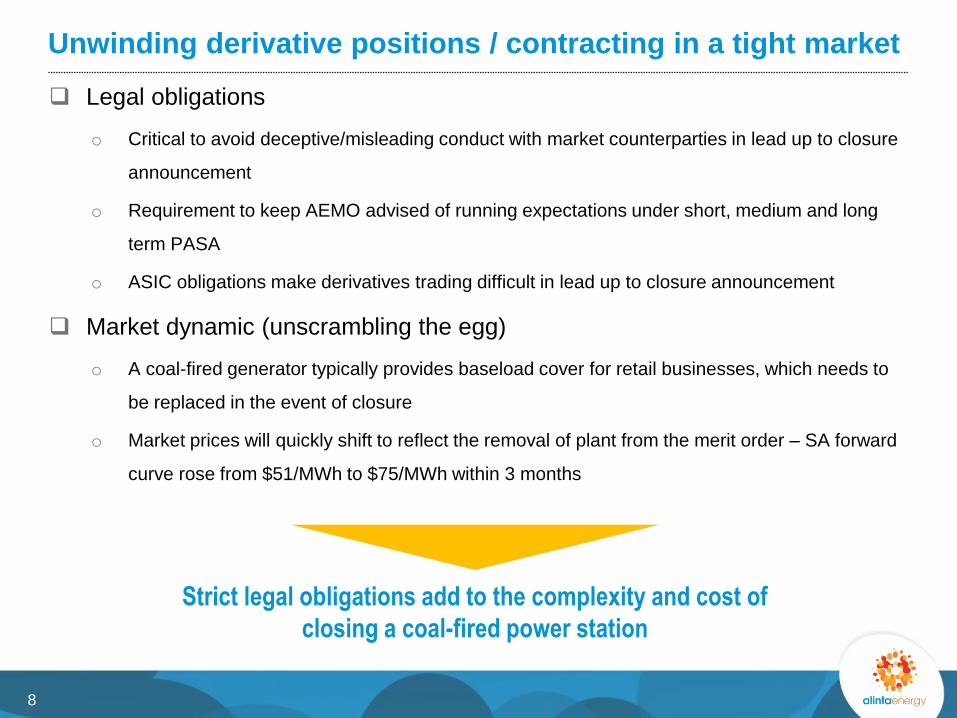
Unwinding derivative positions / contracting in a tight market
Legal obligations
o Critical to avoid deceptive/misleading conduct with market counterparties in lead up to closure
announcement
o Requirement to keep AEMO advised of running expectations under short, medium and long
term PASA
o ASIC obligations make derivatives trading difficult in lead up to closure announcement
Market dynamic (unscrambling the egg)
o A coal-fired generator typically provides baseload cover for retail businesses, which needs to
be replaced in the event of closure
o Market prices will quickly shift to reflect the removal of plant from the merit order – SA forward
curve rose from $51/MWh to $75/MWh within 3 months
Strict legal obligations add to the complexity and cost of
closing a coal-fired power station
8
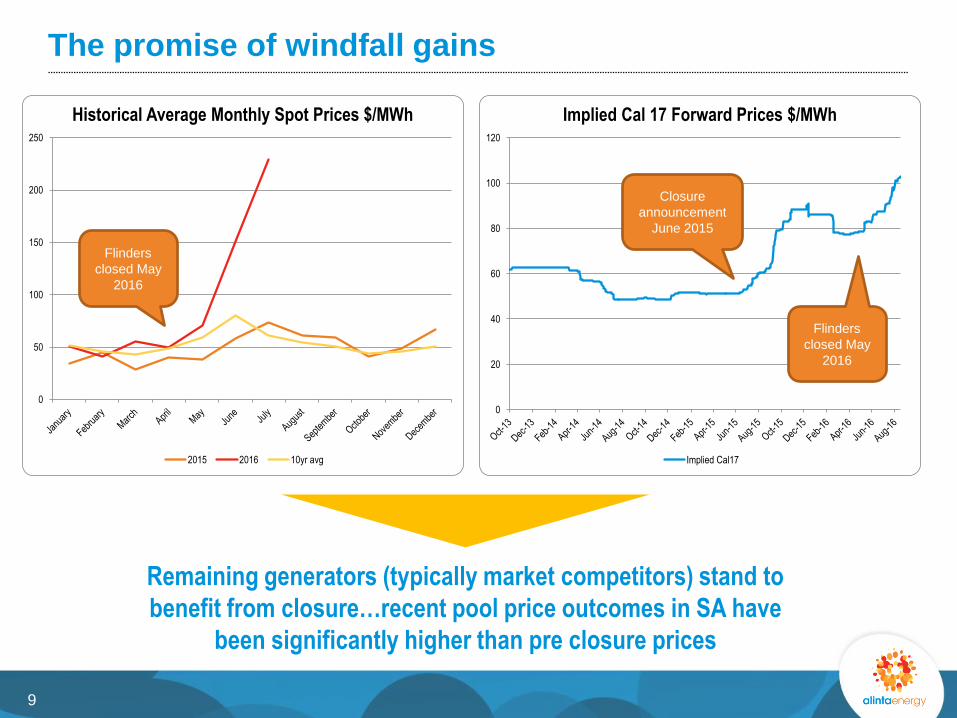
The promise of windfall gains
Remaining generators (typically market competitors) stand to
benefit from closure…recent pool price outcomes in SA have
been significantly higher than pre closure prices
9
0
50
100
150
200
250
Historical Average Monthly Spot Prices $/MWh
2015 2016 10yr avg
0
20
40
60
80
100
120
Implied Cal 17 Forward Prices $/MWh
Implied Cal17
Flinders
closed May
2016
Flinders
closed May
2016
Closure
announcement
June 2015

Contents
Coal generation and the barriers to exit
Who pays the bill and why?
Market Dynamics and a soft landing
Life in a low emissions future
1
2
3
4
10

Who pays the bill and why?
? Customer
? Shareholder
? Employees
? Government
The answer is all of the above!!!
11

The SA experience
Customer
o Rising wholesale prices leads to higher retail prices
Shareholder
o Alinta shareholders to incur total closure costs of c$200m
Government
o Governments wear the backlash from higher electricity prices and job losses
o Pressure to have a policy response
Most energy market stakeholders in SA have been forced to
cop a level of pain in relation to the Flinders closure process
12
Alternative solutions
Contract for closure
Cap & trade emissions scheme
Market redesign / capacity market
Several alternative solutions could change the allocation of
costs across different market sectors
13

Contents
Coal generation and the barriers to exit
Who pays the bill and why?
Market dynamics and a soft landing
Life in a low emissions future
1
2
3
4
14
Market dynamics and a soft landing
A national market framework is a necessity
o State-based goals & solutions can lead to outcomes that don’t contemplate the “bigger picture”
Medium to long term forward planning is the key
o Large energy infrastructure projects require significant leadtime
o Predicting future regulatory test outcomes can be problematic
o New power projects require at least 1-2 years of planning and a similar amount of time to
construct
A national framework with a focus on long-term planning can help to
mitigate risks, reduce costs and pave the way for a “soft landing”
15

Contents
Coal generation and the barriers to exit
Who pays the bill and why?
Market Dynamics and a soft landing
Life in a low emissions future
1
2
3
4
16
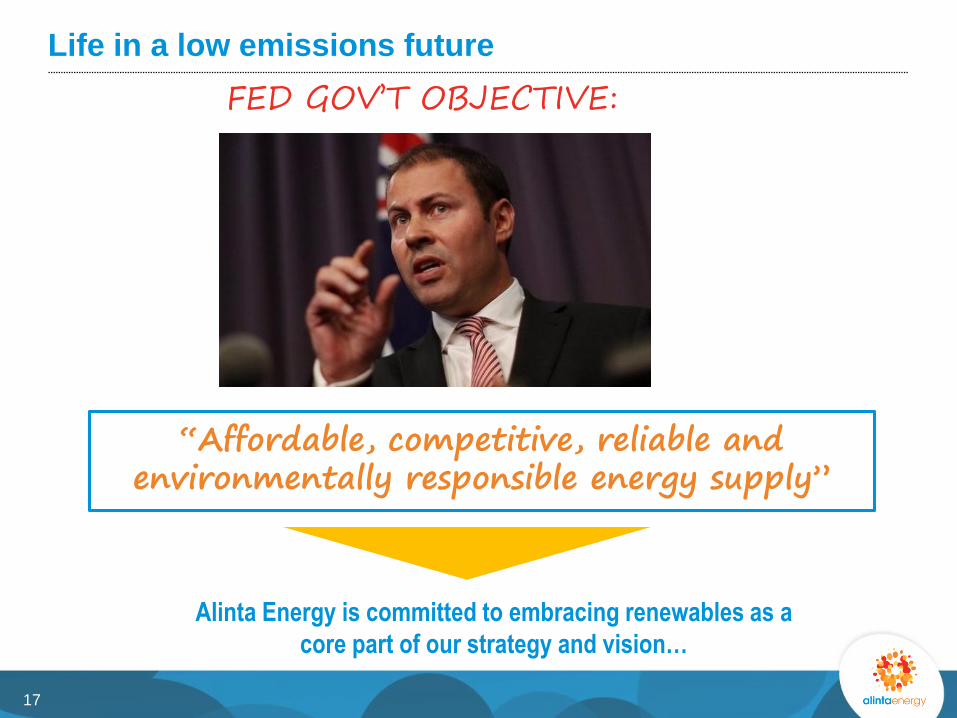
Life in a low emissions future
“Affordable, competitive, reliable and environmentally responsible energy supply”
Alinta Energy is committed to embracing renewables as a
core part of our strategy and vision…
FED GOV’T OBJECTIVE:
17

Low emission energy mix challenges
Transmission connectivity – what is needed and why?
o Planning is challenging when uncertainty around future energy mix
o However new transmission projects should be supported where economically feasible
Renewables - too much wind and not enough solar?
o Is “banding” sensible?
What is thermal generation’s role during the transition?
o Rising east coast gas prices make baseload/intermediate generation a challenge?
o Will closure of coal together with new renewables require more gas-fired peaking generation?
What should the role of storage be?
o Battery capex on a rapid downwards trajectory and can heighten grid stability
o Other alternatives exist (eg. pump storage, solar thermal)
…but finding the most optimal answers is going to represent a major
challenge over the coming years
18

Storage has significant potential to aid the transition
19
-
10
20
30
40
50
60
70
80
90
100
2007
Q1
2007
Q2
2007
Q3
2007
Q4
2008
Q1
2008
Q2
2008
Q3
2008
Q4
2009
Q1
2009
Q2
2009
Q3
2009
Q4
2010
Q1
2010
Q2
2010
Q3
2010
Q4
2011
Q1
2011
Q2
2011
Q3
2011
Q4
2012
Q1
2012
Q2
2012
Q3
2012
Q4
2013
Q1
2013
Q2
2013
Q3
2013
Q4
2014
Q1
2014
Q2
2014
Q3
2014
Q4
2015
Q1
2015
Q2
2015
Q3
2015
Q4
2016
Q1
2016
Q2
2016
Q3
Queensland - Electricity Spot Prices $/MWh
Bottom Quartile Median Price Top Quartile
-
20
40
60
80
100
120
140
160
2007
Q1
2007
Q2
2007
Q3
2007
Q4
2008
Q1
2008
Q2
2008
Q3
2008
Q4
2009
Q1
2009
Q2
2009
Q3
2009
Q4
2010
Q1
2010
Q2
2010
Q3
2010
Q4
2011
Q1
2011
Q2
2011
Q3
2011
Q4
2012
Q1
2012
Q2
2012
Q3
2012
Q4
2013
Q1
2013
Q2
2013
Q3
2013
Q4
2014
Q1
2014
Q2
2014
Q3
2014
Q4
2015
Q1
2015
Q2
2015
Q3
2015
Q4
2016
Q1
2016
Q2
2016
Q3
South Australia - Electricity Spot Prices $/MWh
Bottom Quartile Median Price Top Quartile
Significant
spread
between
high and low
price periods