Embed Size (px)
Citation preview

© 2015 NEXON Co., Ltd. All Rights Reserved.
NEXON Co., Ltd.
Investor Presentation
Q4 2014
February 12, 2015

© 2015 NEXON Co., Ltd. All Rights Reserved.
Owen MahoneyPresident and Chief Executive Officer
2

© 2015 NEXON Co., Ltd. All Rights Reserved.
2014 Financial Results
3
Operating Income1 Net Income2Revenue
(Unit: ¥ billions)
1 2014 and 2013 Operating Income includes impairment loss of ¥14.7 billion (including impairment loss of gloops’ goodwill of ¥11 billion) and ¥11.6 billion respectively on goodwill and
tangible/intangible assets related to game IP and publishing rights.2 Net Income refers to net income attributable to owners of the parent company, as stated in Nexon’s consolidated financial results.
155.3
172.9
50.7 45.5
30.1 29.3
2013 2014 2013 2014 2013 2014

© 2015 NEXON Co., Ltd. All Rights Reserved.4
2014 Highlights
Two-year strategy of focusing on game quality and longevity is underway
China: Introduced series of high-quality content updates for Dungeon&Fighter throughout 2014; Q4 China revenues were up 36% year-over-year
Korea: Very strong performance resulting from execution of quality-first strategy
‒ 52% year-over-year revenue growth
‒ Mobile: revenue up more than 8x year-over-year with launches of high quality titles
‒ PC Online: strong due to high quality live operations
‒ Boosted the already successful title EA SPORTSTM FIFA Online 3
‒ All other titles collectively grew year-over-year
Japan: Games did not consistently meet high standards for quality as we worked in rapidly changing mobile browser and native game market dynamics
North America: Green shoots of growth. Revenue returned to growth in 2H 2014 with improving operations and marketing under new management team
Pipeline: Best in years – and getting stronger
‒ DomiNations (mobile), MapleStory2 (PC), Ghost in the Shell Online (PC), and many more
‒ Recently announced licensing agreement with Warner Brothers Group for mobile game based on successful LEGO® franchise

© 2015 NEXON Co., Ltd. All Rights Reserved.5
2015 and Beyond
Focus on quality demonstrated some early successes in 2014, validating our
strategy
Continue to prioritize game quality as best way to create long-term financial growth
and shareholder value
Focusing development resources only on games that matter
‒ Fun and highly differentiated
‒ Long life cycles
Focusing live game operations on long-term growth and player retention
Richest pipeline in Nexon’s history
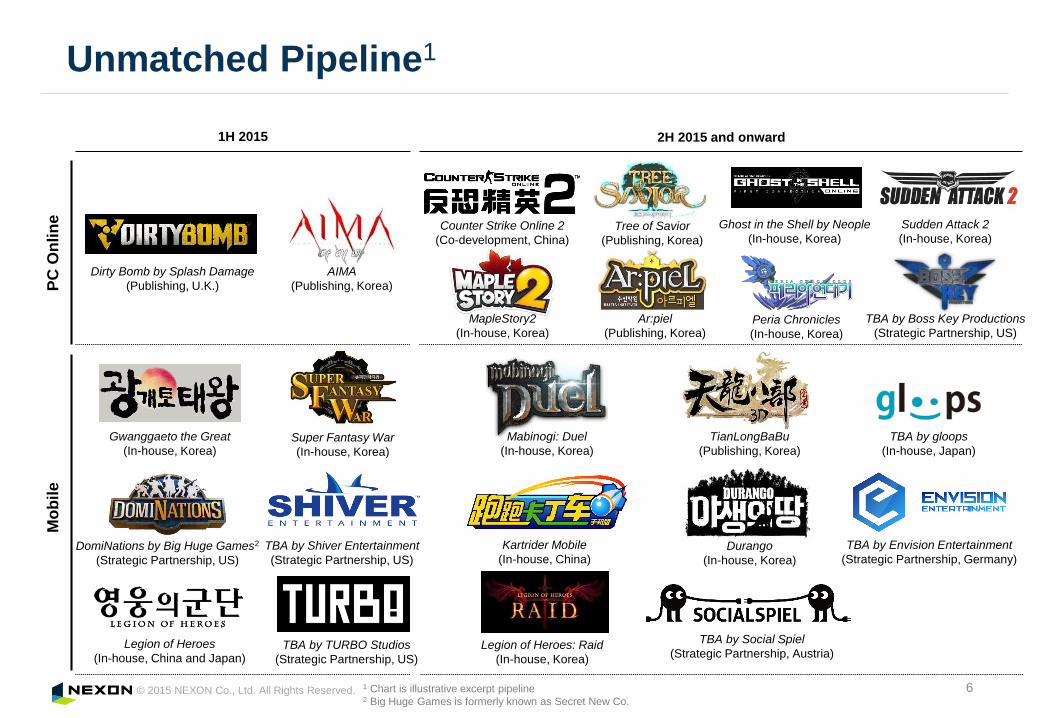
© 2015 NEXON Co., Ltd. All Rights Reserved.
Unmatched Pipeline1
6
PC
On
lin
eM
ob
ile
2H 2015 and onward
DomiNations by Big Huge Games2
(Strategic Partnership, US)
Legion of Heroes
(In-house, China and Japan)
MapleStory2
(In-house, Korea)
Ghost in the Shell by Neople
(In-house, Korea)
1 Chart is illustrative excerpt pipeline2 Big Huge Games is formerly known as Secret New Co.
Peria Chronicles
(In-house, Korea)
Super Fantasy War
(In-house, Korea)
TBA by TURBO Studios
(Strategic Partnership, US)
TBA by Shiver Entertainment
(Strategic Partnership, US)
Durango
(In-house, Korea)
1H 2015
Tree of Savior
(Publishing, Korea)
Ar:piel
(Publishing, Korea)
AIMA
(Publishing, Korea)
TBA by Boss Key Productions
(Strategic Partnership, US)
Gwanggaeto the Great
(In-house, Korea)
Mabinogi: Duel
(In-house, Korea)
Legion of Heroes: Raid
(In-house, Korea)
TianLongBaBu
(Publishing, Korea)
TBA by Social Spiel
(Strategic Partnership, Austria)
TBA by gloops
(In-house, Japan)
TBA by Envision Entertainment
(Strategic Partnership, Germany)
Dirty Bomb by Splash Damage
(Publishing, U.K.)
Counter Strike Online 2
(Co-development, China)
Kartrider Mobile
(In-house, China)
Sudden Attack 2
(In-house, Korea)

© 2015 NEXON Co., Ltd. All Rights Reserved.
DomiNations (Mobile): Trailer
7

© 2015 NEXON Co., Ltd. All Rights Reserved.
MapleStory 2 (PC Online): Trailer
8

© 2015 NEXON Co., Ltd. All Rights Reserved.
Ghost in the Shell Online (PC Online): Trailer
9

© 2015 NEXON Co., Ltd. All Rights Reserved.10
Japan Focus
2014 Recap
gloops
‒ Developed several new mobile native games; launched four1 during Q4 2014
‒ Games did not consistently meet high standards for quality as we worked in rapidly changing mobile browser and native game market dynamics
Right strategy, but not executed well enough
Recorded ¥11 billion impairment loss of gloops’ goodwill
Focus for 2015
gloops
‒ Development:
‒ Mobile native games: pare down pipeline to focus on quality
‒ Mobile browser games: selective focus on high quality games
‒ Live operations: focus on game longevity
Leverage our global pipeline, including high quality titles developed in Korea / U.S.
Secure publishing rights of high quality games
1 4 native titles launched during 2014 are: Skylock, Summon Soul Battle, Crimson Wars, and Toys Drive

© 2015 NEXON Co., Ltd. All Rights Reserved.
Quality matters – best way to create shareholder value
– New games: fun and highly differentiated
– Live game operations: focus on game longevity
Requires focus. Performance based on strong execution of core strategy
Focus on game quality and longevity drives long-term success – shareholder value
Key Strategic Themes
11

© 2015 NEXON Co., Ltd. All Rights Reserved.
Long-term Strategy and Vision1
12
Long-term Growth Vision
M&A
2014
Re
ve
nu
e
Year
Existing New PC / mobile West
M&A
Asia
West
1 Above graph is illustrative and not to scale
2014 Revenue by Region

© 2015 NEXON Co., Ltd. All Rights Reserved.
Nexon management is strongly committed to driving growth and shareholder value
Continue to focus on shareholder returns through growing earnings as well as returning
capital through dividends and share repurchases
Scheduled to pay ¥5 per share dividend for the year-end despite gloops impairment
charge
Committed to Building Shareholder Value
13

© 2015 NEXON Co., Ltd. All Rights Reserved.
Shiro UemuraChief Financial Officer
14

© 2015 NEXON Co., Ltd. All Rights Reserved.15
Q4 2014 Results

© 2015 NEXON Co., Ltd. All Rights Reserved.16
Q4 Highlights
Revenues were ¥42.9 billion, up 25% year-over-year on an as-reported basis, up 14% on
a constant currency basis
– Exceeded high end of our outlook
– Outperformance was primarily driven strong results from China
Operating loss was ¥0.7 billion and net loss1 was ¥4.5 billion, both below the low end of
our outlook
– Operating income underperformance was primarily due to impairment loss on gloops’ goodwill of
¥11 billion
– Net income underperformance was primarily due to the impairment loss in addition to higher-than-
expected tax expenses (one-time factor), while having FX gains in foreign currency-denominated
cash deposits and account receivables
1 Net loss refers to net loss attributable to owners of the parent, as stated in Nexon’s consolidated financial results

© 2015 NEXON Co., Ltd. All Rights Reserved.17
Impairment Loss / Year-end Dividend
Recorded ¥11 billion impairment loss of gloops’ goodwill
– Due to the continued slowdown of mobile browser games and lack of hits in new mobile
native games, recorded the impairment loss of gloops’ goodwill
– The balance of gloops’ goodwill as of December 31st 2014 is ¥20.3 billion
Scheduled to pay ¥5 per share dividend for the year-end despite gloops
impairment charge

© 2015 NEXON Co., Ltd. All Rights Reserved.18
Q4 Financial Results
1 PC revenue includes revenues other than PC / mobile revenues2 Net income / (loss) refers to net income / (loss) attributable to owners of the parent, as stated in Nexon’s consolidated financial results.
(Unit: ¥ millions, except per share data)

© 2015 NEXON Co., Ltd. All Rights Reserved.
1 Based on the regions in which revenues originate; not a representation of revenues according to Nexon entities.2 Europe and Others includes other Asian countries and South American countries.3 PC revenue includes revenues other than PC / mobile revenues.4 For the KPIs (MAU, Pay Rate and ARPPU) of PC online games, please refer to appendix of this presentation.
(Unit: ¥ millions)
Regional Revenues
19
Q4 2014 Revenue by Platform
Q4 2014 Revenue by Region1
PC79%
Mobile21%
China38%
Korea 39%
Japan 16%
North America
4%
Europe and
Others 3%
(As-
Reported)
(Constant
Currency)
(As-
Reported)
(Constant
Currency)
Revenue by Region1
China ¥12,065 ¥16,441 ¥14,761 36% 22%
Korea 11,654 16,749 15,051 44% 29%
Japan 8,274 6,929 6,929 (16%) (16%)
North America 1,201 1,623 1,424 35% 19%
Europe and Others2 1,273 1,190 1,102 (7%) (13%)
Nexon Total 34,467 42,932 39,267 25% 14%
Revenue by Platform
PC3 27,750 34,041 30,737 23% 11%
Mobile 6,717 8,891 8,530 32% 27%
Japan 6,260 5,384 5,384 (14%) (14%)
ex-Japan 457 3,507 3,146 667% 588%
Nexon Total 34,467 42,932 39,267 25% 14%
FX Rate
100 KRW/JPY 9.48 10.55 9.48
CNY/JPY 16.40 18.59 16.40
USD/JPY 100.46 114.54 100.46
YoY % Change
Q4 2013
Q4 2014
© 2015 NEXON Co., Ltd. All Rights Reserved.
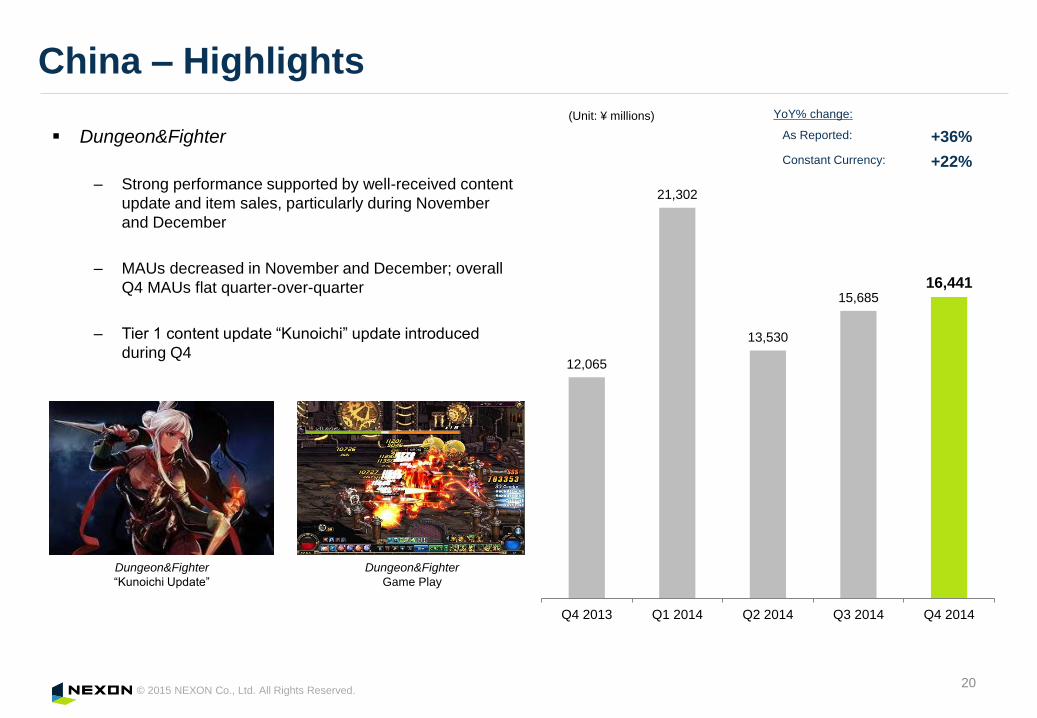
12,065
21,302
13,530
15,685 16,441
Q4 2013 Q1 2014 Q2 2014 Q3 2014 Q4 2014
Dungeon&Fighter
– Strong performance supported by well-received content
update and item sales, particularly during November
and December
– MAUs decreased in November and December; overall
Q4 MAUs flat quarter-over-quarter
– Tier 1 content update “Kunoichi” update introduced
during Q4
China – Highlights
(Unit: ¥ millions)
20
YoY% change:
As Reported: +36%
Constant Currency: +22%
Dungeon&Fighter
Game Play
Dungeon&Fighter
“Kunoichi Update”
© 2015 NEXON Co., Ltd. All Rights Reserved.
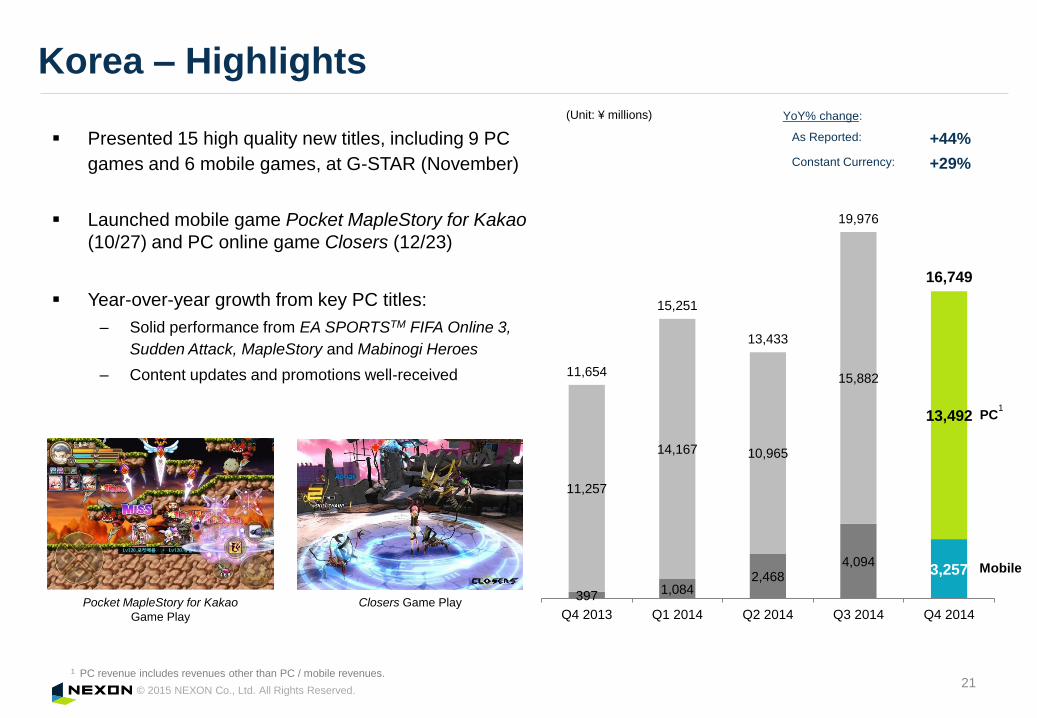
397 1,084
2,468 4,094
3,257
11,257
14,167 10,965
15,882
13,492
11,654
15,251
13,433
19,976
16,749
Q4 2013 Q1 2014 Q2 2014 Q3 2014 Q4 2014
Presented 15 high quality new titles, including 9 PC
games and 6 mobile games, at G-STAR (November)
Launched mobile game Pocket MapleStory for Kakao
(10/27) and PC online game Closers (12/23)
Year-over-year growth from key PC titles:
– Solid performance from EA SPORTSTM FIFA Online 3,
Sudden Attack, MapleStory and Mabinogi Heroes
– Content updates and promotions well-received
Korea – Highlights
(Unit: ¥ millions)
21
YoY% change:
As Reported: +44%
Constant Currency: +29%
Mobile
PC
Pocket MapleStory for Kakao
Game Play
Closers Game Play
1
1 PC revenue includes revenues other than PC / mobile revenues.

© 2015 NEXON Co., Ltd. All Rights Reserved.
Mobile revenue was ¥5.4 billion, down 3% quarter-
over-quarter primarily due to declining browser
game revenues
PC revenue was down 7% quarter-over-quarter
gloops launched 4 native games in Q4
Japan – Highlights
22
YoY% change:
As Reported: -16%
Constant Currency: -16%
(Unit: ¥ millions)
Mobile
PC
Skylock Skylock TV mass promotion
1
1
1 PC revenue includes revenues other than PC / mobile revenues.
6,260 6,100 5,959 5,570 5,384
2,014 2,021
1,697
1,662 1,545
8,274 8,121
7,656
7,232 6,929
Q4 2013 Q1 2014 Q2 2014 Q3 2014 Q4 2014

© 2015 NEXON Co., Ltd. All Rights Reserved.
North America
– Achieved year-over-year revenue growth from key PC titles, MapleStory, Mabinogi, and Vindictus, supported by
improved operations and marketing
– Launched Legion of Heroes on Android (10/23)
North America, Europe and Others – Highlights
23
(Unit: ¥ millions)(Unit: ¥ millions) YoY% change:
As Reported: +35%
Constant Currency: +19%
YoY% change:
As Reported: -7%
Constant Currency: -13%
1,201 1,345
1,131
1,420
1,623
Q4 2013 Q1 2014 Q2 2014 Q3 2014 Q4 2014
North America
1,273
1,472
1,144 1,300
1,190
Q4 2013 Q1 2014 Q2 2014 Q3 2014 Q4 2014
Europe and Others

© 2015 NEXON Co., Ltd. All Rights Reserved.
Q1 2015 Outlook

© 2015 NEXON Co., Ltd. All Rights Reserved.25
Q1 2015 Business Outlook
(Unit: ¥ millions, except per share data)
1 PC revenue includes revenues other than PC / mobile revenues.2 Net income refers to net income attributable to owners of the parent, as stated in Nexon’s consolidated financial results.3 In most situations, the exchange rates of both the South Korean won and the Chinese yuan are linked to the U.S. dollar.
Expect revenues to be down 7% to up 1% year-over-year on an as-reported basis
Forex sensitivity: every one Japanese yen move against the U.S. dollar would have the following impact on our
financials for the first quarter of 20153
Revenue 0.28 billion yen
Operating Income 0.14 billion yen
Q1 2014
Revenues ¥47,491 ¥44,259 ~ ¥47,728 (7%) ~ 1%
PC1 40,297 36,859 ~ 39,641 (9%) ~ (2%)
Mobile 7,194 7,400 ~ 8,087 3% ~ 12%
Operating income 21,171 14,715 ~ 18,138 (31%) ~ (14%)
Net income2 16,144 12,793 ~ 15,669 (21%) ~ (3%)
Earnings per share 36.74 29.66 ~ 36.33 n/a ~ n/a
FX Rate Assumptions
100 KRW/JPY 9.63 10.55 10.55
CNY/JPY 16.83 18.59 18.59
USD/JPY 102.78 114.54 114.54
Q1 2015 Outlook YoY

© 2015 NEXON Co., Ltd. All Rights Reserved.
Q1
Expect 20+% YoY decrease on an as-reported basis
gloops launched Gururin Quest (native) on 1/27
Nexon Japan to publish Kemono Friends (native) on 3/12
Full-Year
Scheduled to launch LINE Legion of Heroes
gloops to launch 5+ mobile titles in 2015
2015 Q1 and Full-Year Regional Outlook
26
China
Q1
Expect high teens to high single digit % YoY decrease on an as-
reported basis
Dungeon&Fighter: introduced a high quality tier 1 content update
(Lunar New Year update) on February 10th
Full-Year
Mobile
Preparing for Legion of Heroes launch (publisher: Chukong)
Scheduled to launch Kartrider Mobile (publisher: Tiancity)
PC
Counter Strike Online 2 scheduled for CBT in 1H 2015
Q1
Expect high teens to 20+% YoY increase on an as-reported basis
Tier 1 content update scheduled for major PC titles
Full-Year
Multiple PC / mobile titles to be launched in 2015 across genres
Global launches scheduled for several mobile titles
Q1
North America
Expect high teens to 20+% YoY increase on an as-reported basis
Dirty Bomb (PC): CBT in progress on STEAM
Europe and Others
Expect 20+ to high teens % YoY decrease on as-reported basis
Full-Year
Scheduled to launch DomiNations / Legion of Heroes on iOS
(mobile) in North America
Korea
Japan North America, Europe and Others

© 2015 NEXON Co., Ltd. All Rights Reserved.
45%
38%
2%
4%
1%
OI MarginQ1 2014
Royalty HR Cost Marketing OI MarginQ1 2015
(High-end)
Q1 2015 Operating Income Margin Outlook
YoY Operating Income Margin Comparison
27
Expect Q1 2015 operating margin of 33% to 38%
due to:
Variable costs, including royalty costs
associated with third-party licensed games,
such as FIFA Online 3 and FIFA Online 3 M
HR costs associated with increase in salary
and headcount primarily in Korea
Marketing costs related to new title releases
in Korea and North America
Revenue mix and Others
– Revenue mix change with increased revenue
contribution from Korea, which has lower
margin than China, as well as mobile

© 2015 NEXON Co., Ltd. All Rights Reserved.
2015 Tier 1 Content Update Schedule
28
Ch
ina
Game Title Q1 2015 Q2 2015 2H 2015
Ko
rea
Dungeon&Fighter
Counter-Strike Online
EA SPORTSTM FIFA Online 3
MapleStory
Dungeon&Fighter
Sudden Attack
7th Anniversary Update
Lunar New Year Update
MapleStory Ice & Burn Update
Lunar New Year Update
Lunar New Year Update
Winter Update (continued from Q4
2014)
Summer Update
National Holiday Update
Summer Update
10th Anniversary Update
Chuseok Package
Rare Avatar & Christmas Package
12th Anniversary Update
Children’s day Package
Summer Update
Roster Update
Winter Content Update
Lunar New Year Update
TBD TBD
TBD
TBD TBD

© 2015 NEXON Co., Ltd. All Rights Reserved.29
Appendix

© 2015 NEXON Co., Ltd. All Rights Reserved.30
Summary of Results and Key Operational Metrics
(Unit: ¥ millions except per share data)
1 PC revenue includes revenues other than PC / mobile revenues2 Net income/(loss) refers to net income / (loss) attributable to owners of the parent, as stated in Nexon’s consolidated financial results.3 Using the currency rates of Q4 2013.
Q1 2013 Q2 2013 Q3 2013 Q4 2013 Q1 2014 Q2 2014 Q3 2014 Q4 2014 YoY%
(By Region)
China ¥20,409 ¥15,477 ¥15,962 ¥12,065 ¥21,302 ¥13,530 ¥15,685 ¥16,441 36%
Korea 10,589 8,605 12,151 11,654 15,251 13,433 19,976 16,749 44%
Japan 9,927 9,398 8,755 8,274 8,121 7,656 7,232 6,929 (16%)
North America 1,418 1,446 1,364 1,201 1,345 1,131 1,420 1,623 35%
Europe and Others 2,021 1,698 1,651 1,273 1,472 1,144 1,300 1,190 (7%)
(By Business)
PC online1 36,877 29,333 32,995 27,750 40,297 28,459 35,931 34,041 23%
Mobile 7,487 7,291 6,887 6,717 7,194 8,435 9,682 8,891 32%
Japan 7,217 7,054 6,482 6,260 6,100 5,959 5,570 5,384 (14%)
ex-Japan 270 237 405 457 1,094 2,476 4,112 3,507 667%
Revenue 44,364 36,624 39,883 34,467 47,491 36,894 45,613 42,932 25%
Operating income/(loss) 20,716 13,425 16,237 327 21,171 9,962 15,124 (748) n/a
Net income/(loss)2 15,150 11,365 8,054 (4,437) 16,144 4,085 13,585 (4,498) n/a
Earnings/(loss) per share 34.77 25.98 18.35 (10.10) 36.74 9.33 31.49 (10.45) n/a
Cash and deposits 110,510 112,235 103,820 138,843 149,040 140,157 114,155 117,729
FX rate
100 KRW/JPY 8.53 8.81 8.94 9.48 9.63 9.95 10.15 10.55
CNY/JPY 14.73 15.94 16.06 16.40 16.83 16.54 16.87 18.59
USD/JPY 92.42 98.76 98.95 100.46 102.78 102.16 103.92 114.54
Key Performance (Excluding Mobile)
MAU (millions) 71.5 71.0 62.6 53.9 55.9 51.9 52.7 50.5
Pay Rate 11.5% 10.2% 10.4% 10.0% 11.0% 10.2% 9.7% 9.3%
ARPPU (as-reported) 2,532 2,181 2,447 2,617 3,639 2,781 3,476 3,776
ARPPU (constant currency) 3 n/a n/a n/a 2,492 n/a n/a n/a 3,379

© 2015 NEXON Co., Ltd. All Rights Reserved.31
COGS and SG&A
(Unit: ¥ millions)
1 Breakdown of COGS and SG&As are unaudited.2 Royalty costs include royalties paid to third-party developers for the right to publish their games.3 HR cost includes salaries, bonuses and benefits for our live game developers, who support post launch servicing, updating and support for our games.4 Other (COGS) primarily consists of depreciation and amortization of assets related to existing games, connection fees (mainly comprised of co-location and datacenter fees, Internet
bandwidth and access fees), and the costs of purchasing and maintaining our servers and computer equipment. 5 PG Fees in SG&A include commissions made to external payment gateway companies when users purchase in-game items in PC Online games that we service. It also includes
mobile carrier-related commissions we pay regarding our Japanese browser games and commissions we pay to Apple / Google regarding our native games globally.6 Other in SG&A includes platform commission fees related to mobile browser games.7 Other Income includes other non-operating income, reversal of deferred revenue, gain on sale of properties, and gain on change in equity. 8 Other Expense includes other non-operating expenses, loss on sale/disposal of properties, loss on impairment of tangible fixed assets, loss on impairment of intangible assets, loss
on impairment of other fixed assets, loss on change in equity, and loss on liquidation of subsidiaries. Q2 2013, Q4 2013, Q1 2014, Q2 2014, Q3 2014 and Q4 2014 Other Expense
includes impairment of game IP and impairment of goodwill.
Q1 Q2 Q3 Q4 Q1 Q2 Q3 Q4
Total Cost of Revenue 1 ¥7,831 ¥7,734 ¥9,229 ¥9,358 ¥10,249 ¥9,839 ¥12,731 ¥11,516
Royalty 2 2,673 2,180 3,539 3,046 4,055 3,317 6,606 4,448
HR cost (COGS) 3 2,875 3,193 3,014 3,219 3,461 3,580 3,372 3,811
Other(COGS) 4 2,283 2,361 2,676 3,093 2,733 2,942 2,753 3,257
Total SG&A 1 15,343 13,945 14,313 15,973 14,855 16,788 17,401 19,556
HR cost 3,004 3,241 2,814 3,063 3,602 4,758 4,025 4,202
PG fee 5 2,259 2,037 2,322 2,202 2,661 2,649 3,645 3,542
R&D 659 860 1,035 1,263 1,120 1,533 1,645 1,533
Marketing / advertising expenses 1,878 3,202 2,211 2,409 1,382 2,069 2,051 3,468
Depreciation and amortization 2,488 2,552 2,556 2,753 2,802 2,792 2,914 2,958
Other 6 5,055 2,052 3,375 4,283 3,288 2,987 3,121 3,853
Other Income 7 164 102 225 1,147 208 209 180 613
Other Expense 8 638 1,622 329 9,956 1,424 514 537 13,221
FY2013 FY2014

© 2015 NEXON Co., Ltd. All Rights Reserved.32
P&L Below Operating Income
1 2013 Q1, Q2 and 2014 Q3, Q4 Finance Income are mainly caused by FX. 2014 Q4 Finance Income is primarily due to the US dollar and Chinese yuan to Korean won FX conversion
gain related to foreign currency deposits & A/R in Korea.2 2013 Q2 Finance Costs are primarily due to a loss recorded from the disposal of JCE shares. 2013 Q3 Finance Costs are primarily due to the U.S. dollar to Korean won exchange
rate impact chiefly associated with Dungeon&Fighter royalties from China. Finance cost for Q4 2013 includes impairment loss of equity method affiliates, mainly from 6waves.
Impairment losses in equity method affiliates are recorded in finance costs under IFRS. 2014 Q2 Finance Costs are primarily due to the US dollar to Korean won FX conversion loss
related to foreign currency deposits & A/R in Korea.3 Net income/(loss) refers to net income attributable to owners of the parent, as stated in Nexon’s consolidated financial results.
(Unit: ¥ millions)
Q1 Q2 Q3 Q4 Q1 Q2 Q3 Q4
Operating Income/(Loss) ¥20,716 ¥13,425 ¥16,237 ¥327 ¥21,171 ¥9,962 ¥15,124 (748)
Finance Income 1 2,336 2,342 739 1,244 1,014 1,024 5,122 5,381
Finance Costs 2 196 1,471 3,138 3,819 385 3,655 360 781
Equity income/(losses) of affiliates,
equity method companies(268) (99) 15 258 (32) (73) (93) 0
Income/(Loss) before Income Tax 22,588 14,197 13,853 (1,990) 21,768 7,258 19,793 3,852
Tax expense (7,238) (2,875) (5,712) (2,519) (5,446) (3,089) (6,132) (8,583)
Net Income/(loss) 3 15,150 11,365 8,054 (4,437) 16,144 4,085 13,585 (4,498)
FY2013 FY2014

© 2015 NEXON Co., Ltd. All Rights Reserved.33
Key Cash Flow Statement
(Unit: ¥ millions)
12 months ended
December 31, 2013
12 months ended
December 31, 2014
Cash flows from operating activities ¥60,208 ¥58,118
Cash flows from investing activities (6,345) (61,820)
Cash flows from financing activities (13,033) (27,050)
Net increase / (decrease) in cash and cash equivalents 40,830 (30,752)
Cash and cash equivalents at beginning of fiscal year 84,736 138,843
Effect of exchange rate change on cash and cash equivalents 13,277 9,638
Cash and cash equivalents at end of fiscal year 138,843 117,729

© 2015 NEXON Co., Ltd. All Rights Reserved.34
Balance Sheet
Update
5/7
(Unit: ¥ millions)
December 31,
2013
December 31,
2014
Asset
Current Assets
Cash and cash equivalents ¥138,843 ¥117,729
Other current assets 78,956 140,396
Total current assets 217,799 258,125
Noncurrent assets
Tangible assets 22,080 24,039
Goodwill 45,802 35,426
Intangible assets 26,653 16,574
Others 106,517 102,858
Total noncurrent assets 201,052 178,897
Total assets 418,851 437,022
Liability
Current liabilities
Current tax liabilities, current 8,502 12,836
Current borrowings 13,408 13,180
Others 28,543 31,007
Total current liabilities 50,453 57,023
Noncurrent liabilities
Non-current borrowings 34,605 23,244
Others 20,734 11,278
Total noncurrent liabilities 55,339 34,522
Total liabilities 105,792 91,545
Equity
Issued capital 51,952 52,481
Share premium 50,688 40,830
Treasury shares (0) -
Other equity interest 74,468 92,044
Retained earnings 131,374 155,025
Non-controlling interests 4,577 5,097
Total equity 313,059 345,477
Total liabilities and total equity 418,851 437,022

© 2015 NEXON Co., Ltd. All Rights Reserved.
Glossary of Terms
35
Update
5/7
Term / Abbreviation Meaning
AOSAOS is a sub-genre of the real-time strategy genre, in which two teams of players compete with each other in discrete
games, with each player controlling a single character through an RTS-style interface.
FPS
(first person shooter)A game in which the player plays from the point of view of the game character in three-dimensional graphics.
RTS
(real-time strategy)
A game that is usually played from a third-person perspective, in which the player controls vast numbers of in-game
characters in a tactical scenario.
MMORPG
(massively multiplayer online role playing game)
An online role-playing game that has a “massive” number (usually several hundred or more) of players who play
concurrently.
MAU
(monthly active user)The total number of accounts of users who log in and play a particular game in a given month.
ARPPU
(average revenue per paying user)
Online game net revenues for any given period divided by the average number of paying players of such games during the
period.
Pay Rate The number of paying users divided by monthly active users for any given period of time.
MCCU
(maximum concurrent users)
The maximum number of users concurrently accessing a game at a particular moment. MCCU is generally used to
measure the popularity of a game.
Closed Beta A trial period during which a trial model (beta version) of a game is tested by a limited number of users or groups.
Open Beta A trial period during which a trial model (beta version) of a game is tested without restrictions on participation.
Tier One Update Large scale updates to existing PC games typically launched in Q1 or Q3 around peak season.
Tier Two Update Smaller updates to existing PC games released throughout the year.
Immersive Games
Games that are designed to be played continuously for hours and enable thousands of concurrent users to interact with
each other in real time. Our games are architected to evolve over years, in contrast to packaged goods games, which
often have finite story lines and comparatively less open-ended player engagement.

© 2015 NEXON Co., Ltd. All Rights Reserved.
This presentation is prepared to offer reference information about NEXON group to the investors and is intended to generally provide investors and analysts with financial and operational information about Nexon, but not to solicit or recommend any sale or purchase of stock or other securities of Nexon. NEXON Co., Ltd. (“Nexon”) has not verified and would assume no responsibility for the accuracy, appropriation, or completeness thereof. This presentation does not contain all relevant information relating to Nexon or the sale of its shares, including, without limitation, the information that would be stated under the captions “Risk Factors”, “Management’s Discussion and Analysis of Financial Condition and Results of Operations” and “Business” in an annual report. Any investment decision with respect to any shares of Nexon should be made solely upon the basis of the information contained in the disclosure documents and is qualified in its entirety by reference to the detailed information appearing in the disclosure documents.
This presentation includes non-GAAP and non-IFRS financial measures, including but not limited to key performance indicators, as well as ratios calculated on the basis thereof. These non-GAAP and non-IFRS financial measures should not be considered in isolation or as a substitute for the most directly comparable financial measures included in our consolidated financial statements and presented in accordance with IFRS.
This presentation includes forward-looking statements. In some cases, you can identify forward-looking statements by terms such as “anticipate”, “assume”, “believe”, “estimate”, “expect”, “forecast”, “may”, “plan”, “potential”, “predict”, “seek”, “should”, or “will”, or by other similar terminology. These statements discuss expectations, identify strategies, contain projections of Nexon’s financial condition or results of operations or state other forward-looking information. The forward-looking statements in this presentation are subject to various risks, uncertainties and assumptions about Nexon’s business and results of operations. The expectations expressed in these forward-looking statements may not be achieved, and actual results could differ materially from and be worse than expectations. Potential risks and uncertainties that could cause actual results to differ materially from expectations include, without limitation:
Continued growth and popularity of Nexon’s key titles;
Nexon’s ability to maintain favorable relationships with key licensing partners;
Nexon’s continued ability to offer games in China, through local partners or otherwise;
Nexon’s ability to compete effectively in the online games industry;
Nexon’s ability to address hacking, viruses, security breaches and other technical challenges;
Fluctuations in currency exchange rates;
Nexon’s ability to maintain and further develop its brand name;
Effective acquisition of new companies, businesses, technologies and games from third parties and the possibility of recognizing impairment losses;
Continued growth of the online games market, including the underlying infrastructure, and free-to-play/item-based revenue generation model;
Nexon’s ability to adapt to new technologies;
Nexon’s ability to enter into licensing arrangements for third-party titles on terms favorable to it;
Effective defense of Nexon’s intellectual property; and
Legislative, regulatory, accounting and taxation changes in the countries in which Nexon operates.
Nexon does not intend, and disclaims any duty, to update or revise any forward-looking statements contained in this presentation to reflect new
information, future events or otherwise. We caution you not to place undue reliance on the forward-looking statements contained in this presentation.
36
Disclaimer