Embed Size (px)
Citation preview
©iStockphoto.com/Raymond Gregory
p2pi.org
As seen in
he ability to truly compare the results of in-store and out-of-store marketing ef-
forts – apples to apples – has been the Holy Grail for a generation of marketers. Such leveling of measure-ment would transform the accuracy of ROI analysis, as well as improve the effectiveness of marketing strat-egies themselves. Yet establishing universal measures remains the big-gest challenge in assessing perfor-mance across marketing platforms.
Past efforts to equalize measure-ment serve as ominous reminders of the difficulty and expense in trying to achieve this goal. Probably the most notable of these was the “Pioneer-
Underwritten by:
Part 4:Integrating Metrics
1
© Copyright 2012. Path to Purchase Institute, Inc., Skokie, Illinois U.S.A. All rights reserved under both international and Pan-American copyright conventions. No reproduction of any part of this material may be made without the prior written consent of the copyright holder. Any copyright infringement will be prosecuted to the fullest extent of the law.
Best Practices in
SHOPPER MARKETING MEASUREMENTBest Practices in
SHOPPER MARKETING MEASUREMENT
T
n The ability to truly compare in-store and out-of-store efforts could transform the accuracy of ROI analysis, as well as the effectiveness of marketing strategies themselves. But estab-lishing true comparison metrics remains the single biggest challenge in measuring performance across platforms.
n Marketing mix modeling uses multivariate regression analysis to understand the relative impact of various marketing efforts (in-store and out-of-store) on sales. It has been an invaluable tool but has never been used to make shopper-level observations.
n As a practical matter, one of the hardest aspects of running marketing mix models is getting accurate inputs upfront.
n Using a statistical method to examine ROI can be deceptive if data is interpreted incorrectly. ROI is not an absolute.
n One obvious drawback to a typical marketing mix model is that it does not reveal buyer profiles. Decomposing volume to understand shopper profiles is imperative.
n The usefulness of a model can dramatically improve if the analysis is run frequently.
n Aligning the objectives of above- and below-the-line efforts doesn’t need to be overly complicated. Using shopper card data as a parallel to national panel data is one way to gauge success on the retailer and national level.
n Adding single source data into marketing mix models provides more real-world tracking and fewer forensics. Marketers will begin to see relationships between shoppers and programs like never before.
Executive Summary
ing Research for an In-Store Metric” (P.R.I.S.M.) project, which sought to establish a common industry metric for gauging in-store audiences (“op-portunities to see”) that could be compared with classic media adver-tising measures. While the project ultimately foundered on costs and business issues, its potential initially attracted the biggest players in the industry, including Procter & Gamble and Walmart.
Only a year before P.R.I.S.M. was shuttered, a similar fate befell “Proj-ect Apollo,” the name of Arbitron’s effort to track a wide range of me-dia exposure on a per-person basis using “Portable People Meters.”
By Liz Crawford, Senior Industry Analyst
The following is the fourth installment in a six-part series examin-ing best practices for the measurement of shopper marketing. This article looks at effective ways to integrate metrics. Subsequent articles will cover retail collaboration and directions for the future. To read the first three articles in the series, visit www.p2pi.org.
SPECIAL REPORT
Select members of Nielsen’s household panel scanned all of their purchases and wore the meter, which attempted to record a wide range of media exposure, from radio spots, to outdoor billboards, to in-store communica-tions. However, the cost for a national rollout of the methodology was far too steep, even for the project’s seven prominent backers (one of which was P&G).
Good Enough: Marketing Mix ModelsAlthough such efforts to monitor and mea-sure the shopper’s exposure to marketing on a 360-degree basis stumbled during the first decade of the new millennium, marketers were not without tools: marketing mix mod-eling had been a well-established practice for most CPGs for more than 20 years, and one still used widely today.
Marketing mix modeling (MMM) is a sta-tistical tool that uses multivariate regression analysis to understand the relationship of var-ious marketing efforts (in- and out-of-store) to sales. Regression analysis uses an indepen-dent variable to help predict a “response vari-able” (in this case, sales). The “multivariate” part refers to the presence of several “predic-tor” variables – media advertising, temporary price reductions, and so forth – that can influ-ence sales.
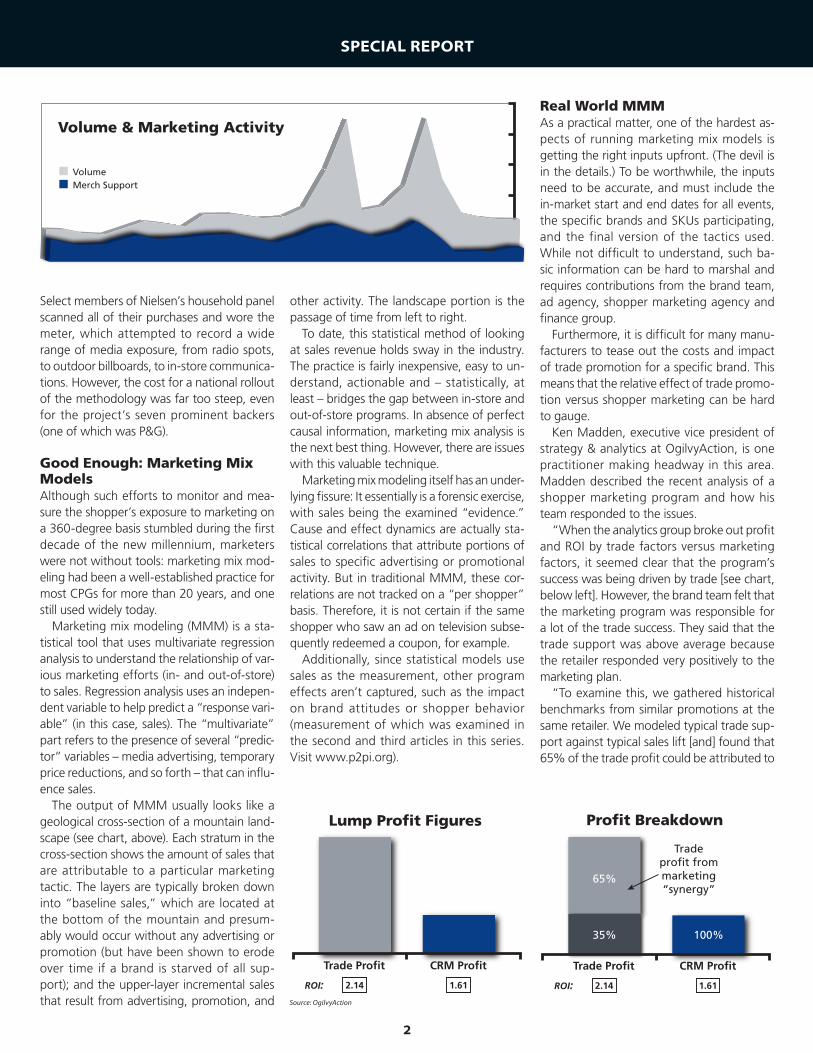
The output of MMM usually looks like a geological cross-section of a mountain land-scape (see chart, above). Each stratum in the cross-section shows the amount of sales that are attributable to a particular marketing tactic. The layers are typically broken down into “baseline sales,” which are located at the bottom of the mountain and presum-ably would occur without any advertising or promotion (but have been shown to erode over time if a brand is starved of all sup-port); and the upper-layer incremental sales that result from advertising, promotion, and
other activity. The landscape portion is the passage of time from left to right.
To date, this statistical method of looking at sales revenue holds sway in the industry. The practice is fairly inexpensive, easy to un-derstand, actionable and – statistically, at least – bridges the gap between in-store and out-of-store programs. In absence of perfect causal information, marketing mix analysis is the next best thing. However, there are issues with this valuable technique.
Marketing mix modeling itself has an under-lying fissure: It essentially is a forensic exercise, with sales being the examined “evidence.” Cause and effect dynamics are actually sta-tistical correlations that attribute portions of sales to specific advertising or promotional activity. But in traditional MMM, these cor-relations are not tracked on a “per shopper” basis. Therefore, it is not certain if the same shopper who saw an ad on television subse-quently redeemed a coupon, for example.
Additionally, since statistical models use sales as the measurement, other program effects aren’t captured, such as the impact on brand attitudes or shopper behavior (measurement of which was examined in the second and third articles in this series. Visit www.p2pi.org).
Real World MMMAs a practical matter, one of the hardest as-pects of running marketing mix models is getting the right inputs upfront. (The devil is in the details.) To be worthwhile, the inputs need to be accurate, and must include the in-market start and end dates for all events, the specific brands and SKUs participating, and the final version of the tactics used. While not difficult to understand, such ba-sic information can be hard to marshal and requires contributions from the brand team, ad agency, shopper marketing agency and finance group.
Furthermore, it is difficult for many manu-facturers to tease out the costs and impact of trade promotion for a specific brand. This means that the relative effect of trade promo-tion versus shopper marketing can be hard to gauge.
Ken Madden, executive vice president of strategy & analytics at OgilvyAction, is one practitioner making headway in this area. Madden described the recent analysis of a shopper marketing program and how his team responded to the issues.
“When the analytics group broke out profit and ROI by trade factors versus marketing factors, it seemed clear that the program’s success was being driven by trade [see chart, below left]. However, the brand team felt that the marketing program was responsible for a lot of the trade success. They said that the trade support was above average because the retailer responded very positively to the marketing plan.
“To examine this, we gathered historical benchmarks from similar promotions at the same retailer. We modeled typical trade sup-port against typical sales lift [and] found that 65% of the trade profit could be attributed to
2
Volume & Marketing Activity
VolumeMerch Support
Lump Pro�t Figures
Trade Pro�t
ROI: 2.14 1.61
CRM Pro�t
Pro�t Breakdown
Tradepro�t frommarketing“synergy”
Trade Pro�t
ROI: 2.14 1.61
CRM Pro�t
100%35%
65%
Lump Pro�t Figures
Trade Pro�t
ROI: 2.14 1.61
CRM Pro�t
Pro�t Breakdown
Tradepro�t frommarketing“synergy”
Trade Pro�t
ROI: 2.14 1.61
CRM Pro�t
100%35%
65%
Source: OgilvyAction
the above-average trade support [see chart, bottom right of page 2]. We call this the ‘Mar-keting Synergy Effect,’ when the retailer’s enthusiasm for a particular program drives extra trade support and thereby boosts per-formance.”
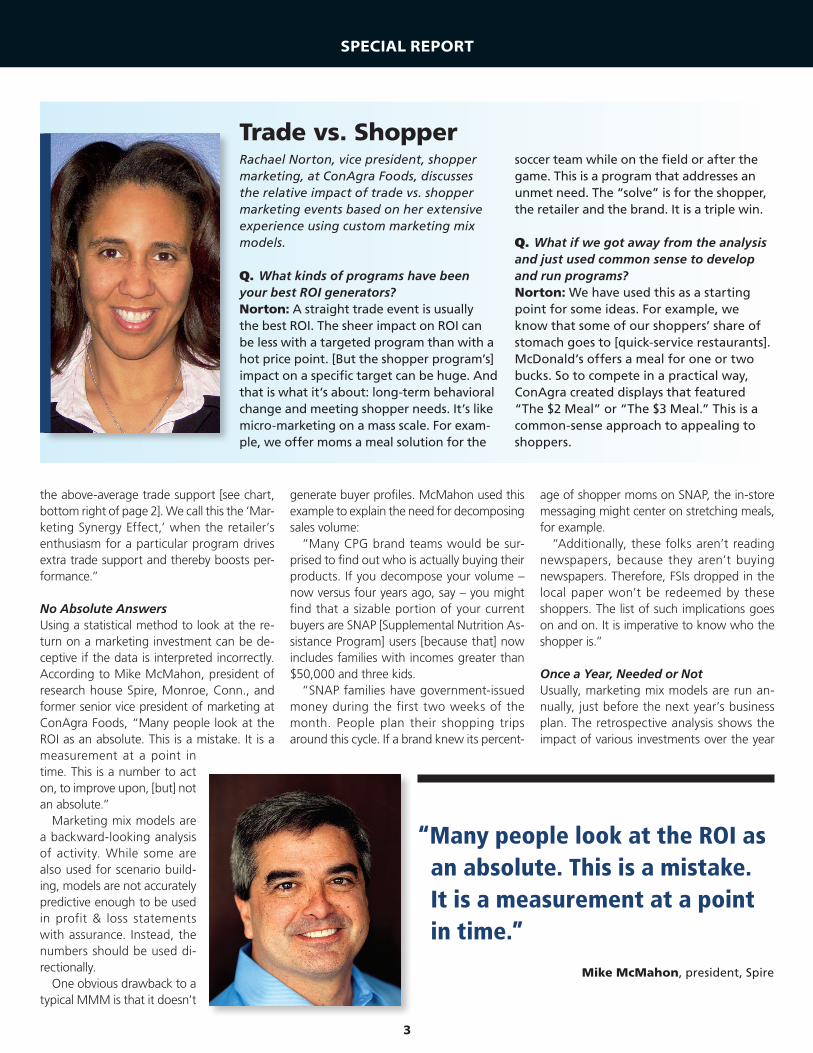
No Absolute AnswersUsing a statistical method to look at the re-turn on a marketing investment can be de-ceptive if the data is interpreted incorrectly. According to Mike McMahon, president of research house Spire, Monroe, Conn., and former senior vice president of marketing at ConAgra Foods, “Many people look at the ROI as an absolute. This is a mistake. It is a measurement at a point in time. This is a number to act on, to improve upon, [but] not an absolute.”
Marketing mix models are a backward-looking analysis of activity. While some are also used for scenario build-ing, models are not accurately predictive enough to be used in profit & loss statements with assurance. Instead, the numbers should be used di-rectionally.
One obvious drawback to a typical MMM is that it doesn’t
generate buyer profiles. McMahon used this example to explain the need for decomposing sales volume:
“Many CPG brand teams would be sur-prised to find out who is actually buying their products. If you decompose your volume – now versus four years ago, say – you might find that a sizable portion of your current buyers are SNAP [Supplemental Nutrition As-sistance Program] users [because that] now includes families with incomes greater than $50,000 and three kids.
“SNAP families have government-issued money during the first two weeks of the month. People plan their shopping trips around this cycle. If a brand knew its percent-
age of shopper moms on SNAP, the in-store messaging might center on stretching meals, for example.
“Additionally, these folks aren’t reading newspapers, because they aren’t buying newspapers. Therefore, FSIs dropped in the local paper won’t be redeemed by these shoppers. The list of such implications goes on and on. It is imperative to know who the shopper is.”
Once a Year, Needed or NotUsually, marketing mix models are run an-nually, just before the next year’s business plan. The retrospective analysis shows the impact of various investments over the year
SPECIAL REPORT
Rachael Norton, vice president, shopper marketing, at ConAgra Foods, discusses the relative impact of trade vs. shopper marketing events based on her extensive experience using custom marketing mix models.
Q. What kinds of programs have been your best ROI generators?Norton: A straight trade event is usually the best ROI. The sheer impact on ROI can be less with a targeted program than with a hot price point. [But the shopper program’s] impact on a specific target can be huge. And that is what it’s about: long-term behavioral change and meeting shopper needs. It’s like micro-marketing on a mass scale. For exam-ple, we offer moms a meal solution for the
soccer team while on the field or after the game. This is a program that addresses an unmet need. The “solve” is for the shopper, the retailer and the brand. It is a triple win.
Q. What if we got away from the analysis and just used common sense to develop and run programs?Norton: We have used this as a starting point for some ideas. For example, we know that some of our shoppers’ share of stomach goes to [quick-service restaurants]. McDonald’s offers a meal for one or two bucks. So to compete in a practical way, ConAgra created displays that featured “The $2 Meal” or “The $3 Meal.” This is a common-sense approach to appealing to shoppers.
Trade vs. Shopper
3
“Many people look at the ROI as an absolute. This is a mistake. It is a measurement at a point in time.”
Mike McMahon, president, Spire
on a national basis. However, a typical large national model doesn’t capture most shopper marketing efforts, such as regional programs or short-term, single-retailer programs.
But, brands that have developed propri-etary, custom models at the retailer level are able to measure ROI against specific programs to fill in knowledge gaps. Developing a model that uses historical brand and retailer-level data is the best way to unlock the power of this technique, according to Agustin De Dios, director-global analytics at Kimberly-Clark. (To hear more of De Dios’ views on adapting MMM for shopper marketing, visit www.p2pi.org.)
As importantly, the usefulness of the model can dramatically improve if the analysis is run more often than annually and at a retailer-specific level. Obtaining quick and accurate
information can help marketers change direc-tion mid-year to increase the effectiveness of programming.
To develop a retailer-based, custom mar-keting mix model, a brand and its agencies sometimes pool their resources of talent and data. At least two years of scan data are needed, along with the dates and details of advertising and retail-level promotions. Solid quantitative skill and experience is needed as well. Just as often, development is out-sourced to a service provider – who still needs data inputs from the client. In whatever way the smaller model is built, the granular ap-proach is the best way to ensure effective use of MMM for shopper marketing programs.
McMahon, who developed custom MMMs for ConAgra, believes that best practices take a “measure, learn, change” approach. He
recommends conducting a quarterly or even monthly analysis, so that ROI results can be shared with teams on a regular basis and pro-grams can be improved “on the fly.” If that’s a bit too ambitious, gathering the information at least can help marketers make adjustments that affect the current year instead of waiting until the next to make improvements. Brands that use a measure, learn, change approach in a disciplined way also can keep pace with retailers, which continually optimize their pro-gramming, he suggests.
What’s more, this approach can help jus-tify spending on shopper marketing fairly quickly. According to Rachael Norton, vice president of shopper marketing at ConAgra Foods, the company shifted marketing dol-lars from above-the-line activities to shopper programs because the transparency provided
SPECIAL REPORT
4
Alignment of Shopper and Brand Measures
GoalsStrategic Brand
ObjectivesRetailer-Level
Shopper Measures Brand-Level Measures
TRIAL
Penetration
Shopper card data National panel dataSwitching
New category users
REPEAT
Frequency
Shopper card data National panel dataUnits per purchase
Usage rate
Loyalty percentage
UNIVERSAL
Awareness
Pre/post-shop interviews;store traffic counts;
distribution/execution audits, eye-tracking
Longitudinal studies; pre/post advertising studies
ConsiderationShopalongs; mobile panel studies;
pre/post interviewsAnnual, longitudinal brand studies
NavigationIn-store video;
shopping cart trackingNA
Brand Imagery Interviews Longitudinal brand studies

by frequent ROI reporting brought credibility to the discipline across the organization.
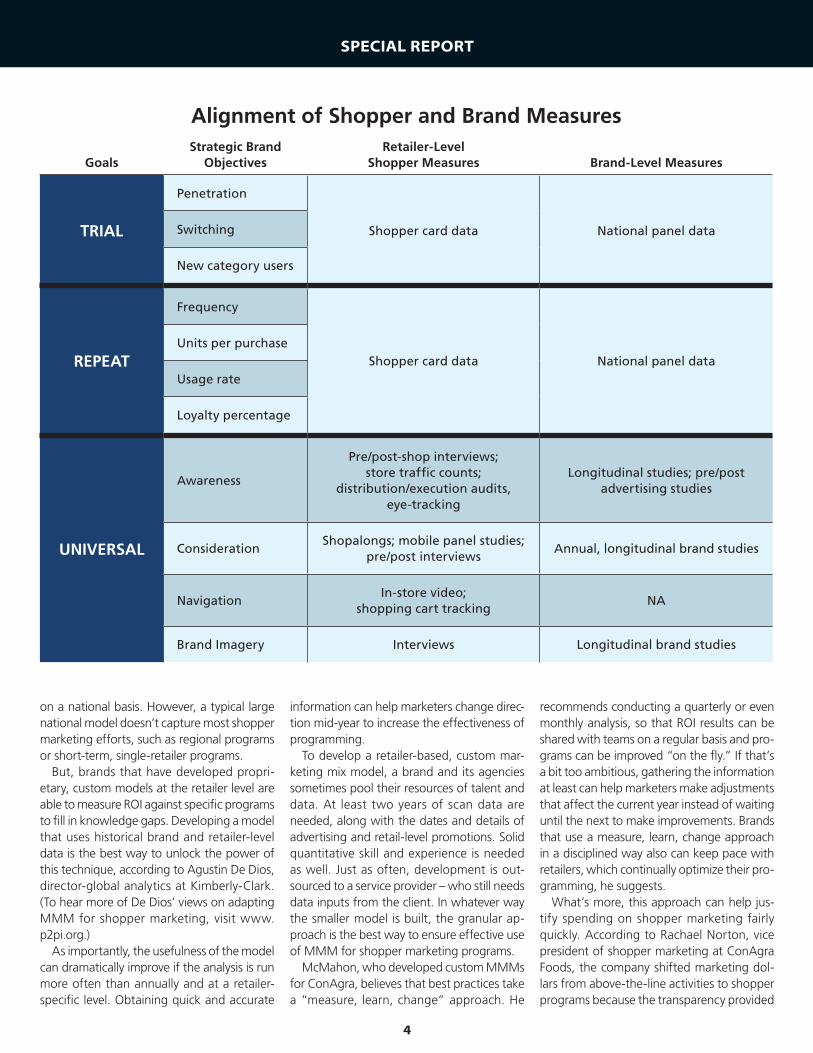
Aligning Brand and Shopper GoalsAs has been stressed throughout this series, sales aren’t the only measure of success for shopper marketing programs. Achievement of other objectives is often at least as impor-tant. In shopper marketing, most objectives can be expressed in terms of shifts in shopper behavior. This can include brand switching, alterations in purchase or occasion frequency, or changes in list making.
But marketers are challenged when they attempt to measure shopper performance against overall brand objectives. Perhaps the biggest stumbling block is the temptation to use tactical measurements and thereby miss
the impact on the larger marketing objective. One simple example is to report the number of coupons redeemed without understanding whether the effort rewarded current users, induced trial among new users, or converted switchers. Another is to track the number of “shares” online without knowing whether they drove conversions or awareness. Savvy marketers keep critical brand objectives front and center when evaluating program perfor-mance.
Aligning the objectives of above- and be-low-the-line efforts doesn’t need to be overly complicated. The chart on page 40 is a simpli-fied model identifying how they might line up and where the data could be sourced.
The shopper card data acts like a kind of mini-panel of shoppers for a particular retail-er. This smaller panel might generate data us-ing swiped frequent-shopper cards or mobile devices – handheld devices or smartphones with apps, or even retailer apps.
While this sort of alignment isn’t perfect, it can at least help keep the brand on track to attain success benchmarks (assuming they’ve been clearly articulated at the outset).
Next: Single Source InputThe next step should be a big boost to mar-keting mix modeling: single source data and cross-media tracking. As discussed in the sec-ond article of this series, single source data refers to tagging a specific shopper’s activities across media platforms and retailers. Adding this data to MMM delivers more real-world tracking and fewer forensics. Marketers will begin to see relationships between shoppers and programs like never before. This concept will be discussed in detail in the final article of the series.
SPECIAL REPORT
Series Schedule
Part 1: Rationalizing the Investment
Part 2: Measurement of Shopper Behavior
Part 3: Measurement of Brand Impact
Part 4: Effective Integration Practices
Part 5: Retail Collaboration
Part 6: Directions for the Future
Liz Crawford has more than 20 years of brand management and consulting experience with a concentration in strategic innovation. Over the last few years, Crawford has focused on developing integrated shopper marketing strategies for Fortune 500 clients. Currently, Crawford is an analyst and contributing writer for the Path to Purchase Institute. McGraw-Hill released her book, “The Shopper Economy,” in March.
About the Author
JWT/OgilvyAction Inc., conducting business under the OgilvyAction and JWT Action brands, is a fully integrated, end-to-end shopper marketing and ex-periential marketing agency with main offices in New York, Chicago and Akron, Ohio. It is part of the WPP Group.
5