Embed Size (px)
Citation preview

1
Integrating IBM SPSS Predictive Modeling and Forecasting with IBM CognosTM1 at Safelite
Mike Lyons – Director FP&A Safelite
Dallas Crawford – Sr. Account Executive QueBIT

2
Agenda
� Introductions and Company Overview
� Value of Predictive Demand Planning
� Safelite’s Business Needs
� Safelite’s Forecasting Solution
� Safelite’s Budget Solution
� Results Achieved

3
Safelite at a Glance� Safelite was founded in 1947 from a single store in Wichita, Kansas
and has grown to a multi-faceted vehicle glass and claims
management services organization called Safelite Group
� In 2007, Safelite was acquired by Belron®, the world’s largest
company dedicated to vehicle glass repair and replacement.
� Today, Safelite AutoGlass is the largest vehicle glass repair and
replacement service provider in the U.S.
� Serving more than 5.4 million customers annually
� Earning more than $1.5 billion in sales annually
� Safelite AutoGlass has 6,500 MobileGlassShops™ and retail locations
and offers mobile service to 97 percent of the United States
� Safelite employs roughly 13,000 people

4
About QueBIT – Who are we?
� Trusted Experts in Analytics
� 15+ years in business with managers on the team who have been
working in area of Analytics for 20+ years
� Full Offerings - Advisory & Implementation Services, Reseller of IBM
Software and Developer of Solutions
� 900+ successful Analytics Projects
� 400+ analytics customers in all types of industries
� 115+ employees with HQ in New York
� Building an experienced team from the ground up
� Deep Expertise in Financial Analytics, Advanced Analytics, Business
Intelligence, and DHW
� Many Migrations to Planning Analytics
� Multi-Year Award Winner

5
Value of Predictive Demand Planning� Anticipate changes in demand curve� Reduce lost conversions and Improve customer satisfaction� Decrease excess inventory and its carrying costs� Improve demand and supply forecast accuracy� Improve insight driving staffing/FTE requirements� Reduce manual intervention & guesswork� Provide actionable insight to field

6
Predictive Forecasting for Demand Planning
Accurately Forecast
� High Velocity Items
� Low Velocity Items
� New Items
Predictive Factors
� Seasonality
� Lifecycle
� Causal Data
� Pricing
� Promotions
� Advertising
� Economic Factors
Special Considerations
� Product Lifecycle
� Halo & Cannibalization

7
Difference Between Simple and Sophisticated Forecasting

8
Why did Safelite need new tools for Budgeting and Forecasting?- Our previous budgeting/ forecasting tool set could be characterized as having:
- Too much reliance on a network of free standing, corporate created spreadsheets
- Too much reliance on historical performance distribution across geographies, customer/client accounts, and time periods
- A lack of flexibility… and no capability of quickly accommodating multiple scenarios
- No ability to keep pace with increasing complexity of our business… its challenging to incorporate new business drivers/metrics
- Too much room for error
- No opening for direct input by Field Leaders
- Based on feedback from business leaders, the organization needed an improved budget process. Suggested improvements
included:
- Faster turnaround time for budgeting and forecasting outputs, and direct input from Field Leaders
- Greater level of collaboration… Incorporate local market level knowledge into budgets/forecasts
- Greater transparency of budget methodology… assumptions, inputs, and outputs
- Provide the capability to help Field Leaders develop local market plans

9
How does the new process differ from the old process?
- This tool enables the FP&A team to create and distribute 18 month rolling forecasts on a
monthly basis. These consistent long term forecasts help bring greater visibility to the long
term implications of the decisions that we make today
- The rolling forecast will become the starting point of the annual budget each year
Characteristics of Old Budget/Forecast Process
� Labor intensive
� Manual, creating opportunity for errors
� Slow process
� Top-down process
� High level of accuracy
Characteristics of New Budget/Forecast Process
� Increased level of automation
� 40% reduction in timeline
� Direct input from Field Leaders
� Top-down process
� Historically high level of accuracy

10
Goals for Predictive Demand Planning
� Improve and automate existing forecasting process
� Create 18 month rolling revenue & P&L forecast� Leverage statistical modeling to develop “data
driven” forecasts� Incorporate additional data sets and variables � Measure forecasting effectiveness� Provide field employees with “actionable”
information� Integrate disparate processes� Integrate results into existing TM1 model

11
Implementation of Predictive Demand Planning
- Overview:- How the forecast is produced:
- Our process will predict monthly customers served by store, customer type and
product group levels for 18 months into the future
- SPSS performs two unique steps prior to producing the forecast detail- Step 1:
- Introduction of various data points into SPSS
- Step 2:
- Additional detail is used to increase accuracy and the data is prepared for the model
- Once steps 1 and 2 have be completed the forecast model will run
automatically

12
Predictive Demand Planning Model
- Step 1 of 2
- Causal variables can be used to
fine tune the predictive ability of the
model
- We are using the following:
- Advertisement spend
- Historical Sales
- Calendar to identify seasonality
trends
- Future store information

13
Predictive Demand Planning Model
- Step 2 of 2
- Additional inputs to improve SPSS’
accuracy can be included as well
- We have found additional value in
the following:
- Weather (monthly and seasonal
details are used)
- Headcount
14
Predictive Demand Planning Accuracy
- Accuracy/Error Checking
- SPSS can use various methods to ensure predicted details are accurate
- Our model has two steps built into it to ensure precision
- Thru 9 months the model shows a variation of .2% to actuals

15
Predictive Demand Planning Output
- Model output
- One job can be established to run
Step 1, Step 2 and the final model
- Results can be displayed at various
levels of your organization
- Our results are predicted down to the
store level (our lowest level)
- The final predicted customers
served can be made available to the
end user in excel or TM1

16
Integrating Predictive Demand Planning with TM1
- SPSS predictive model results are stored in the SPSS Datamart until imported into TM1
- This is all performed in Collaboration and Deployment Server (C&DS)
- Created a Turbo Integrator (TI) script to feed from SPSS
- TI feeds data at the store, customer type and product group levels into TM1
- Integrate forecast functionality into existing TM1 budget model
- Ability to run ad-hoc “what if” scenarios in TM1
- SPSS data feed to TM1 can be 100% automated or run on demand

17
Predictive Demand Planning Accomplishments
Objectives
� Improve and automate existing forecasting process� Increased forecasting accuracy at the store level
� Create 18 month rolling revenue & P&L forecast� Developed integrated SPSS/TM1 model
� Incorporate additional data sets and variables � Incorporated weather data and anticipated advertising investments
Accomplished?
18
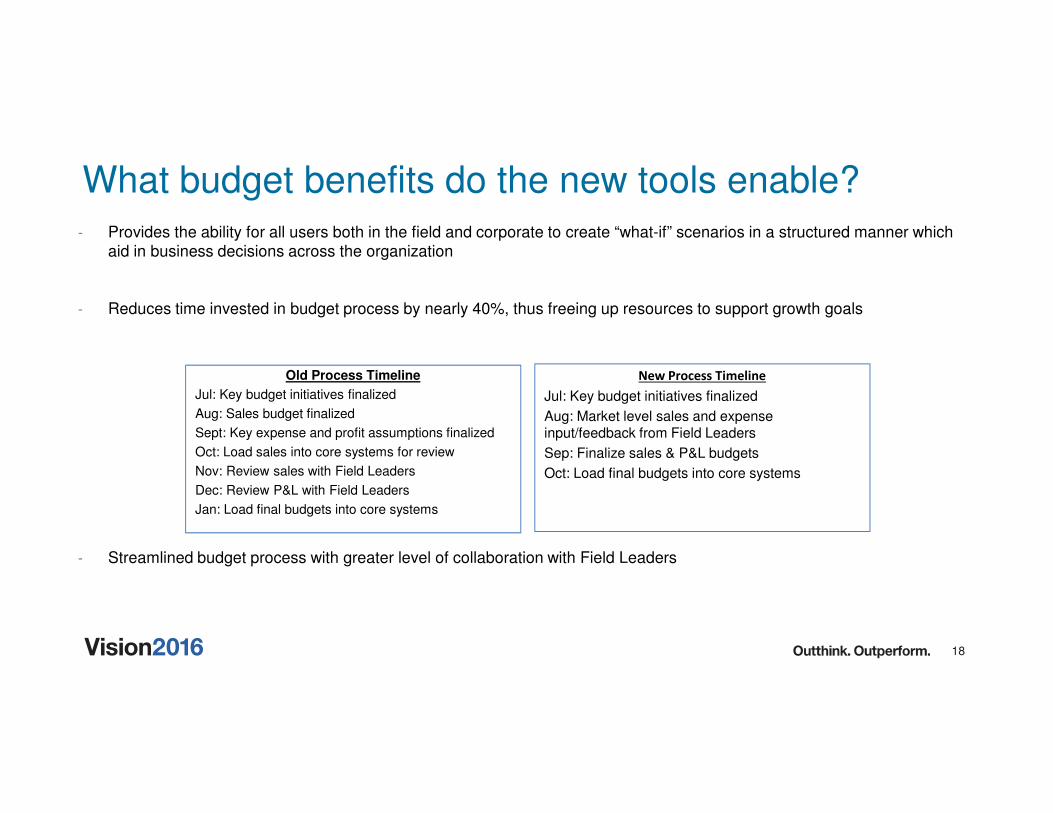
What budget benefits do the new tools enable?- Provides the ability for all users both in the field and corporate to create “what-if” scenarios in a structured manner which
aid in business decisions across the organization
- Reduces time invested in budget process by nearly 40%, thus freeing up resources to support growth goals
- Streamlined budget process with greater level of collaboration with Field Leaders
Old Process Timeline
Jul: Key budget initiatives finalized
Aug: Sales budget finalized
Sept: Key expense and profit assumptions finalized
Oct: Load sales into core systems for review
Nov: Review sales with Field Leaders
Dec: Review P&L with Field Leaders
Jan: Load final budgets into core systems
New Process Timeline
Jul: Key budget initiatives finalized
Aug: Market level sales and expense input/feedback from Field Leaders
Sep: Finalize sales & P&L budgets
Oct: Load final budgets into core systems

19
Sales Review/Adjustments

20
P&L Review/Adjustments

21
Budget Process Accomplishments
Objectives
� More timely Budgeting & Forecasting� Reduced time invested in budget process by nearly 40%, thus
freeing up 450 man hours to support growth goals
� Greater level of collaboration with our Field Leaders� Field Leader input was received earlier in the process creating
more ownership in their budgets
� Enhancements to the current Budget Methodology� Sales Budget was built at the part/sku level allowing us to budget
part cost in complete alignment with sales
Accomplished?

22
Feedback from our Users was positive
� We conducted a satisfaction survey on the budget process in May 2014 in order to determine a pre-TM1 benchmark. This survey averaged a 6.0 on a 10 point scale
� The follow up survey which was conducted in April 2015 showed improvement in 6 of 7 questions with an average satisfaction of 7.0
� We experienced a full point of improvement in areas such as the total experience, the collaboration in the process and the accuracy of the process. We saw smaller increases in the ease of the process, the alignment with company strategies and the fairness
� Surveys on the 2015 process are currently being conducted and we expect a greater level of customer satisfaction

23
Predictive Demand Planning Progression
Phase I
• 100% automated process
• Analytically driven with predictors limited to data currently available
• Forecasts at Store/Location Level
• Includes causal variables (weather and promotions)
Phase II
• Forecasts at SKU Level
• Consideration of Other Causal Data Variables
• Integration with Order Management and other Supply Chain Systems
Phase III
• Store/Location Level Assortment and Replenishment Planning

24
Why QueBIT?
�Accurate forecasts
�Flexible workflow and approval process
�Increased visibility
�Software solution extends to other high-value applications and use cases
�Best of both worlds
� IBM Analytics Software Platform
�QueBIT and IBM industry expertise
�QueBIT implementation experience in deploying predictive demand planning applications
�Flexible solution to meet all of your existing needs
�Increase time spent on analysis vs not data manipulation

25
Extending the Analytics Platforms
Multiple systems and touch points for planning and reporting
• What drives over or under performance of products?• What are sales expected to be
Product Demand Planning
• What is the optimal price for each SKU, by customer? • How will our pricing strategy impact gross margin?• How are my competitors pricing comparable products?
Price Optimization
• How should inventory be distributed to maximize availability & minimize carrying costs?
• What is the optimal location(s) for distribution plants?• Should orders be allocated to specific distribution plants based on capacity, demand, geography, etc.?
Supply Chain Optimization
• What is driving churn?• What strategies will be most effective in minimizing churn?
Retailer/Customer Retention
• How and when should labor hours be allocated?Labor
•What is causing defective products?•What causes production line shutdowns?
Quality Control
• What is the correct marketing mix to maximize profit/retention, etc.?• Which retailers are mostly likely to most benefit from promotions?
Marketing

26

27
Thank You.
Your Feedback is Important!
Access the Vision 2016 Conference Attendee Portal to complete your session surveys from
your smartphone,
laptop or conference kiosk.