Embed Size (px)
Citation preview

Indian Sugar Industry Page 1
COMPREHENSIVE PROJECT REPORT
On
Indian Sugar Industry
Submitted for the Partial fulfilment of the requirement
towards the award of Degree of
Master of International Business (MIB)
Session 2010-2012
Submitted by:
SOOBIAN AHMED
10-MIB-40
10-6537
Under the Supervision of:
Prof. M.S. Lakshmi
CENTRE FOR MANAGEMENT STUDIES
JAMIA MILLIA ISLAMIA
New Delhi-110025

Indian Sugar Industry Page 2
CERTIFICATE OF COMPLETION
This is to certify that Soobian Ahmed has completed his Comprehensive Project under my
direct supervision. This research project was to study “Indian Sugar Industry”, which he has
successfully completed and the same is presented in the form of the present report.
It is further certified that the project report submitted by him reflects his original work and
based on the work assigned to him for the Comprehensive Project and that the present project
report has not been submitted elsewhere for the award of any degree, diploma or fellowship.
Project Guide:
Prof. M.S. Lakshmi Centre for Management Studies,
Jamia Millia Islamia

Indian Sugar Industry Page 3
DECLARATION
I, Soobian Ahmed, a bonafide student of MIB (Full Time) Programme at the Centre for
Management Studies, Jamia Millia Islamia, New Delhi, hereby declare that I have undergone
the comprehensive project under the supervision of Prof. M.S. Lakshmi
I also declare that the present project report is based on my comprehensive project and is my
original work. The content of this project report has not been submitted to any other
university or institute either in part or in full for the award of any degree, diploma or
fellowship.
Further, I assign the right to the university, subject to the permission from the organization
concerned, use the information and contents of this project to develop cases, caselets, case
leads, and papers for publication and/or for use in teaching.
Place: New Delhi ……………….
Date Soobian Ahmed
10-MIB-40

Indian Sugar Industry Page 4
ACKNOWLEDGEMENT
It is with immense satisfaction and pride that, I am completing my project under Prof M.S.
Lakshmi and would like to thank for her extensive support, timely guidance and regular
monitoring my progress and providing valuable inputs from time to time.
I also express my overriding debts and thanks to my parents and my brother, without their
help it would have been impossible to complete my project.
Last but not the least; I shall fail in my duty, if I don’t thank all those concerned friends who
have directly or indirectly contributed in the completion of this entire Comprehensive project.
Soobian Ahmed

Indian Sugar Industry Page 5
EXECUTIVE SUMMARY
In an era where there is a need for inclusive growth, the sugar industry is amongst the few
industries that have successfully contributed to the rural economy. It has done so by
commercially utilizing the rural resources to meet the large domestic demand for sugar and
by generating surplus energy to meet the increasing energy needs of India. In addition to this,
the industry has become the mainstay of the alcohol industry. The sector supports over 50
million farmers and their families, and delivers value addition at the farm side. In general,
sugarcane price accounts for approximately 70 percent of the ex-mill sugar price .The sector
also have a significant standing in the global sugar space.
The Indian domestic sugar market is one of the largest markets in the world, in volume
terms. India is also the second largest sugar producing geography. India remains a key growth
driver for world sugar, growing above the Asian and world consumption growth average.
Globally, in most of the key geographies like Brazil and Thailand, regulations have a
significant influence on the sugar sector. Perishable nature of cane, small farm landholdings
and the need to influence domestic prices; all have been the drivers for regulations. In India,
too, sugar is highly regulated. Since 1993, the regulatory environment has considerably
eased, but sugar still continues to be an essential commodity under the Essential Commodity
Act. There are regulations across the entire value chain land demarcation, sugarcane price,
sugarcane procurement, sugar production and sale of sugar by mills in domestic and
international markets.
This research is an endeavour to study the International and domestic sugar industry along
with India’s ethanol production feasibility and its regulatory framework. This research is
based on assumptions about general economic conditions, agricultural policies, population
growth, weather conditions, and technological changes.
The world sugar market continues to experience considerable price volatility. The world
indicator price for raw sugar witnessed a succession of peaks and downward corrections in
2010 before soaring to a 30-year high of USD 795.4/t in February 2011. Market fundamentals
driving volatile prices were large global sugar deficits in the previous two seasons and
adverse weather in a number of countries that reduced the size of the expected rebound in
production to higher prices. World sugar stocks, which had already been drawn down, fell to
their lowest level in 20 years in 2010-11, supporting higher as well as more volatile market
prices. International sugar prices are expected to ease back over in latter 2012 and into 2012-
13, as production responds around the world to recent high prices and the global balance
moves into a larger surplus that allows the start of stock rebuilding.
Brazil’s sugar production, as one of the lowest cost sugar producers with considerable
capacity to expand sugar cane area on a large scale, along with the projected growth in
ethanol production, will be key determinants of global sugar production, which is projected to
reach over 209 Mt in 2020-21. Government policies that intervene in sugar markets, and
production cycles in some major cane producing countries of Asia, will continue to influence
world sugar production and price volatility over the longer term. World sugar consumption is

Indian Sugar Industry Page 6
expected to grow at a lower average rate over the longer term in response to higher prices to
reach 207 Mt in 2020-21.
A cyclical decline in sugar production is shifting India, the world’s second largest producer,
from net exporter to net importer during 2009-10 (October/September) and contributing to
the current run up in global sugar prices. The downturn in production is primarily due to a
policy- induced cycle that has become increasingly pronounced. India is forecast to shift from
net sugar exports of 5.8 million tons in 2007-08 to net imports of 2.8 million tons in 2008-09
and a record 6.0 million tons in 2009-10. Sugar production rebounded in 2010-11, as higher
government price supports and open-market prices stimulated plantings and improves
incentives to deliver sugarcane to sugar mills. In the longer term, India has the capacity to
boost sugarcane output, and the government and the sugar industry are considering policy
measures to moderate the increasingly sharp cycles in sugar production and trade.
The Government of India launched National Bio fuel Mission in 2003, primarily with a view
to explore the potential of bio fuels as a cleaner source of energy and to partially offset the
growing burden of crude oil import bills. This paper analyzed the economic viability and long
term sustainability of bio ethanol production from sugarcane molasses and commercial
feasibility of biodiesel produced from tree-borne oilseeds like Jatropha. Based on the analysis
the paper observed that, given the slow growth in area and yield of sugarcane on the one hand
and rising demand for sugar, potable and industrial demand of ethanol on the other, it is
highly unlikely that the blending targets of ethanol with petrol would be met as planned by
the government. To ensure long-term sustainability and economic viability of bio ethanol
Production, it is imperative to diversify the feed stock basket by including more crops like
sweet sorghum and tropical sugar beet and encourage research on industrial production of
second generation bio fuels. The commercial feasibility of Jatropha based biodiesel largely
depends on development of a proper supply chain by augmenting marketing of Jatropha
seeds, upgrading processing infrastructure and up-scaling biodiesel distribution.
This research also studies the ethanol blended petroleum pricing mechanism in India in
comparison with the globally accepted price mechanism. The research finds that the cost of
producing ethanol varies with molasses prices and hence cyclical variations in sugarcane
production largely determine the cost of ethanol production. However, given the cyclical
nature of sugarcane, a periodic review of ethanol prices becomes critical. The pricing issue is
also complicated by the decontrol of petrol prices and administered pricing of sugarcane.

Indian Sugar Industry Page 7
CONTENTS
Declaration by the Trainee
Acknowledgement
Certificate
Executive Summary
RESEARCH METHODOLOGY Page Number
0.1 RESREARCH TECHNIQUES 9
0.2 DESK RESEARCH/SECONDARY DATA 9
0.3 FIELD RESEARCH OR PRIMARY RESEARCH 9
0.4 OBJECTIVE OF THE RESEARCH 10
0.5 DATA COLLECTION 10
0.6 SCOPE OF REASERCH 11
0.7 LIMITATION OF RESEARCH 11
PART A (World Sugar Industry Scenario)
1.1 World current market situation 13
1.2 Present market trends and prospects 14
1.3 Global sugar production 16
1.4 Global sugar Trade 17
1.5 World 15 largest sugar producing and importing nations 2010 20
1.6 Global emerging trends 22
1.7 Brazil’s Deregulation and cost leadership 23
1.8 Chinese sugar scenario 24
1.9 Current issues with global scenario 26
PART B (INDIAN SUGAR INDUSTRY SCENARIO)
2.1Introduction to Indian sugar industry 28
2.2 Sugar year 2010-11 30
2.3 Recent supply and demand developments 32
Indian Sugar Industry Page 8
2.4 Policies drive sugarcane production cycle 33
2.5 Central and state government price support policies for sugarcane 34
2.6 Indian sugar demand trends 35
2.7 Sugar Export Import of India 36
2.8 International Trade opportunity 38
2.9 Sugar cane production potential in India 39
2.10 Domestic Sugar policies 40
2.11 Sugar year 2012 42
PART C (ETHANOL AND ITS IMPLICATIONS)
3.1 Introduction to Bio fuel 44
3.2 Ethanol policy of Government of India 45
3.3 Expanding ethanol supply 46
3.4 Trade of Ethanol 48
3.5 Benefits from Bio fuel to India 48
3.6 Policy toward blending of ethanol 50
Conclusion 53
Bibliography 54
Indian Sugar Industry Page 9
0.1 RESREARCH TECHNIQUES
There are number of research techniques which can be employed for market research.
Different methodology is employed according to the objective and scope defined for
research.
Methods: Basically there are two methods
A. Desk Research or secondary research
B. Field Research or primary research
0.2 DESK RESEARCH/SECONDARY DATA
Desk or secondary research is the search for information from relevant data already available.
The data could take the form of information from censuses or information readily available
from industry and trade directories.
A. Desk Research uses secondary data from:
B. Internal sources i.e. company itself
C. External sources using libraries of industry and trade associations, chambers of
commerce, export promotion organizations, international bodies such as International
Trade Centre, Geneva, CBI, Holland etc
D. Internet sites of various agencies/organizations such as ITPO,WTO,IMF,ITC etc
E. Publications(books, magazines, journals, newspapers)
F. Market study/survey reports
G. Trade delegation reports
H. Catalogues of MNC’s or leading world manufacturers
I. FOA’s reports
J. Market intelligence reports
0.3 FIELD RESEARCH OR PRIMARY RESEARCH
Field research is employed to collect primary data by:
A. Observation method
B. Survey method
Field Research focuses on consumer or buyers motives (e.g. Why they will buy your product
instead of your competitors product), which forms the basis of the positioning strategy.
The process of conducting field research on India sugar industry:
1. visiting the researcher own country
2. Visiting markets which involves
Indian Sugar Industry Page 10
A. Planning of visits
B. Seeking /making appointments with target companies/organizations
C. Field research in exhibitions/trade fairs which involves “Right Timing”
D. Open ended questionnaire
0.4 OBJECTIVE OF THE STUDY:
Objective of the research is to study the global and domestic scenario for pricing and supply
and demand of sugar, globally emerging trends in sugar trade and to study the policy of
government on ethanol and to study the trends of sugar market in India deriving a pattern.
,use of sugar based fuel(ethanol) and analyzing its impact on prices
0.5 DATA COLLECTION:
The data for determining the “Indian sugar Industry” was based on secondary research and
was entirely a desk based research. The data was collected in combination of literature search
and analysis. Data from secondary sources such as research papers, internet and magazines
was collected. The raw data were tabulated, processed and analyzed using the appropriate
statistical techniques such as percentage averages, values and units presented in the form of
Bar Chart in the light of clarity obtained in the course of the type of data encountered. The
successful analysis of taken data is done and the interpretation is also done.
As stated before, the secondary data means data that are already available. Secondary data
may either be published or unpublished.
The present study has made the use of the following sources of secondary study:
1. Agricultural products bulletin.
2. Relevant books, Magazines, newspapers such as Hindu, Economic Times, Krushetra,
Yojana(A monthly publication of Ministry of Information and Broadcast)
3. Relevant public records and statistics, historical documents and other sources of public
information related with sugar industry.
4. Relevant websites of international organizations such as APEDA, IRRI, FAO.
5. Government websites such as APEDA, DGFT India, DGCI&S, FAO.
6. Data collected by my conversation with CMD of Lokmangal Group Maharahstra.
The sources for unpublished data are many, for example relevant data may be available with
scholars and research workers. However, these sources are not easy to access and need a lot
of persuasion and lot of time. The researcher has not used such resources given the limitation
of time available. The researcher has made used secondary data in formulation of research
problem and identification of research objectives. Due care was taken to assess such data for
its suitability for the study, because many such secondary data was found to be irrelevant to
the research problem as also inadequate in the context of the problem which researcher want
to study.

Indian Sugar Industry Page 11
0.6 SCOPE OF STUDY
The research study covers the study of Indian sugar industry. The study also looks into the
ethanol potential and production by India. The study looks into the competition patterns of
both the products globally as well as regionally. The study also covers the duty structure of
both the products in prospective markets.
The research study puts special emphasis on the pricing pattern and seasonal cycles of sugar
production and pricing.
0.7 LIMITATION OF STUDY
The limitation of my study is due to the lack of time. This research is based on secondary
data and already published and unpublished reports. Questionnaire was not taken for the field
research and my research constitute fully desk based research. Instead an open ended
questionnaire was prepared and discussed with the CMD of Lokmangal group Maharashtra.

Indian Sugar Industry Page 12
Part-A
WORLD SUGAR INDUSTRY
SCENARIO

Indian Sugar Industry Page 13
WORLD SUGAR INDUSTRY SCENARIO
1.1) World Current market situation
The world sugar market has experienced and continues to experience considerable price
volatility. The world indicator price for raw sugar has witnessed a succession of peaks and
downward corrections in 2010 before reaching to a 30-year high of USD 795/tonne in
February 2011.The reason for this global price volatility was global sugar deficit in previous
two seasons due to failure of crops because of adverse seasonal condition which resulted in
low production of sugar and due to high demand the prices has risen. World sugar stocks,
which had already been drawn down, fell to their lowest level in 20 years in 2010-11,
supporting higher as well as more volatile market prices. International sugar prices have
eased in year 2012, as there was a bumper crop around the world which has resulted in fall of
prices around the globe and the global balance moves into a larger surplus that allows the
start of stock rebuilding.
2008 and 2009 world sugar balances were into negatives as the production was less than consumption.
2008 and 2009 were bad crop years due to seasonal adversities, and it has pushed the global sugar prices up.
2010 was a crop year as compared to a couple of previous year.
2011 has been a good year and sugar stock has risen considerably after 3 years.
Indian Sugar Industry Page 14
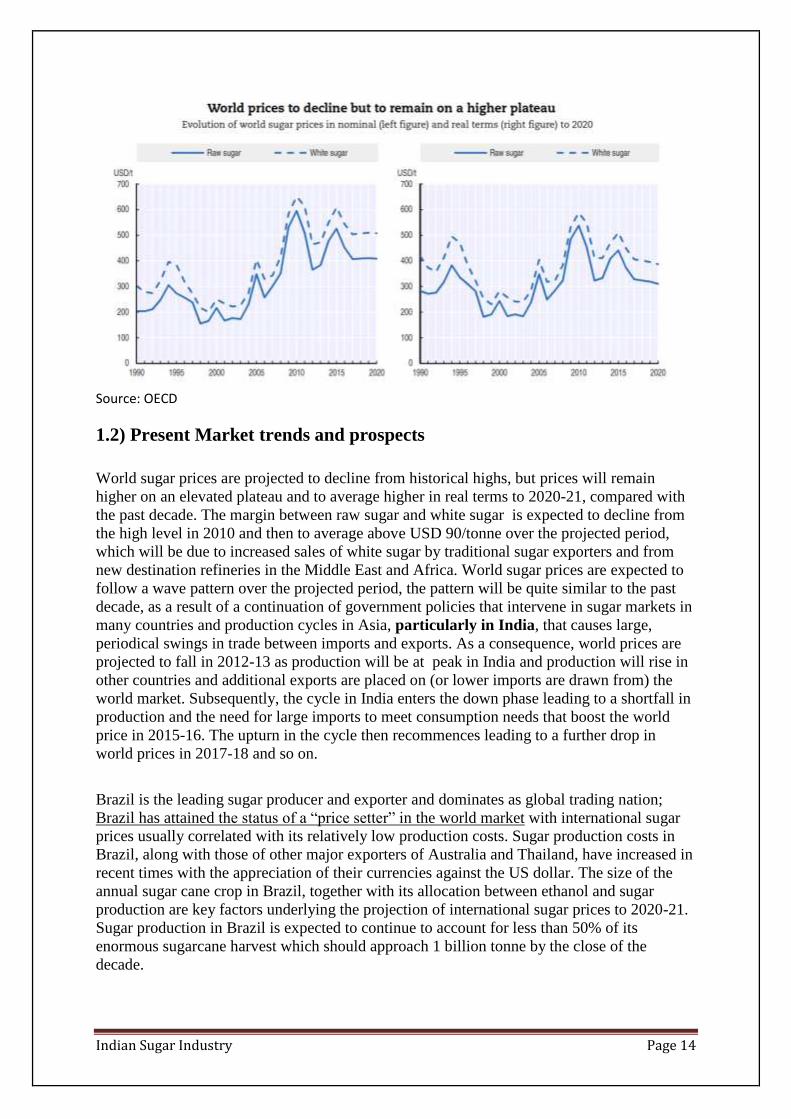
Source: OECD
1.2) Present Market trends and prospects
World sugar prices are projected to decline from historical highs, but prices will remain
higher on an elevated plateau and to average higher in real terms to 2020-21, compared with
the past decade. The margin between raw sugar and white sugar is expected to decline from
the high level in 2010 and then to average above USD 90/tonne over the projected period,
which will be due to increased sales of white sugar by traditional sugar exporters and from
new destination refineries in the Middle East and Africa. World sugar prices are expected to
follow a wave pattern over the projected period, the pattern will be quite similar to the past
decade, as a result of a continuation of government policies that intervene in sugar markets in
many countries and production cycles in Asia, particularly in India, that causes large,
periodical swings in trade between imports and exports. As a consequence, world prices are
projected to fall in 2012-13 as production will be at peak in India and production will rise in
other countries and additional exports are placed on (or lower imports are drawn from) the
world market. Subsequently, the cycle in India enters the down phase leading to a shortfall in
production and the need for large imports to meet consumption needs that boost the world
price in 2015-16. The upturn in the cycle then recommences leading to a further drop in
world prices in 2017-18 and so on.
Brazil is the leading sugar producer and exporter and dominates as global trading nation;
Brazil has attained the status of a “price setter” in the world market with international sugar
prices usually correlated with its relatively low production costs. Sugar production costs in
Brazil, along with those of other major exporters of Australia and Thailand, have increased in
recent times with the appreciation of their currencies against the US dollar. The size of the
annual sugar cane crop in Brazil, together with its allocation between ethanol and sugar
production are key factors underlying the projection of international sugar prices to 2020-21.
Sugar production in Brazil is expected to continue to account for less than 50% of its
enormous sugarcane harvest which should approach 1 billion tonne by the close of the
decade.

Indian Sugar Industry Page 15
Stock has risen in 2007, in anticipation of production being less than consumption in coming year as it will be a cyclical years of downfall in production, which ultimately pushes the prices up.
As production is low in year 2008 and 2009, the prices has increased, the stock has fallen.
Current world Sugar Market at a Glance
Source: FOA Secretariat

Indian Sugar Industry Page 16
1.3) Global Production of sugar
Sugar crops in many parts of the world are projected to expand in response to rising demand
for sugar and other uses and relatively high market prices. World sugar production is
expected to increase by 50 Mt to reach over 209 Mt in 2020-21. The bulk of the additional
sugar production will come from the developing countries and the main burden of growth
will continue to fall on Brazil. Brazil has expanded production rapidly in the past two
decades, but a slowdown in investment in new mills occurred after the financial crisis of
2008, slowing overall growth in following years. The recent surge in sugar prices has
improved profitability and should trigger additional investment to come on stream within the
decade, with output rising by around 11 Mt to nearly 50 Mt by 2020-21.
India, the second largest global producer and the world’s leading consumer, is expected to
boost production substantially to 32 Mt of sugar per year, on average, in the coming decade,
or some 50% higher than in 2008-10, when production fell sharply. Annual sugar output will
continue to be subject to periodic large swings in response to the longstanding production
cycle. Some other countries of Asia, such as China and Pakistan, are also expected to
continue to experience milder forms of production cycles, which contribute to fluctuations in
production and their import volumes. Outside this group, an expansion drive underway in
Thailand is expected to continue as investment projects currently in the pipeline come on
stream, lifting production to around 8.7 Mt by 2020-21, and maintaining its position as the
world’s third largest producer.
In contrast, to the expansion trends in the developing world, the traditional sugar industries in
a number of developed countries are expected to witness static or lower production over the
coming decade. For instance, in the European Union quota based sugar production has
declined with policy reform and is expected to stabilise around 13.4 Mt , with a continuation
of existing production quotas, to equilibrate the domestic market in a context of stable
consumption, a fixed volume of subsidised exports and projected higher imports. Some
additional out-of-quota sugar beet production is expected to arise over the projection period
for use in ethanol production and the chemical industry.
Production of sugar in the United States is expected to show little growth and to remain well
below the 85% minimum allotment level of the 2008 FCE Act. US producers are expected to
focus on improving their sugar margins by cutting costs and essentially leaving Mexico to fill
the expanding gap between stable production and higher US consumption requirements.
Assured access to higher prices in the slowly growing US market is expected to encourage
some further investment and growth in Mexico’s sugar production to 2020-21.
The sugar industry in Australia, although devastated by flooding and a cyclone in 2010, is
expected to recover in coming years. However, with continuing pressure on land available
for sugarcane production, sugar producers will likely focus on higher productivity, based on
farm consolidation and improved cane varieties and higher sugar yields, rather than cane area
expansion, in lifting output to around 5 Mt in 2020-21.
The sugar industry in the Russian Federation has undergone a transformation in recent years
and is projected to continue to expand production, under the stimulus of high domestic
support measures, to reach nearly 5 Mt by 2020-21.

Indian Sugar Industry Page 17
Global sugar consumption has continued to increase despite the continuing economic
difficulties in many developed countries, compounded by the period of high sugar prices and
increased volatility. This has slowed sugar use at the start of the Outlook period and slower
consumption growth is expected to continue over the longer term as world sugar prices
average higher in real terms. Global consumption is projected to grow at 2.2% p.a. to 2020-
21, and down from 2.6% p.a. in the previous ten years.
The developing countries will continue to experience the strongest growth in sugar
consumption, fuelled by rising incomes and populations, although with considerable variation
between countries. The sugar deficit regions of Asia and the Far East as well as Africa, will
be responsible for most of the expansion in use. In contrast, sugar consumption in many
developed countries, with their mature sugar markets, are expected to show little or no
growth. Total consumption in these countries is expected to increase from 48Mt to nearly 52
Mt over the projection period. This reflects, among other things, slowing population growth
and dietary shifts that are underway as a result of increasing health awareness and concerns
with obesity and related health issues.
1.4) Global Sugar Trade
Over the last decade, there have been a number of structural changes affecting the evolution
of trade patterns which will continue to influence international sugar transactions in the
coming period. These include increased concentration in sugar export trade, with a smaller
number of global exporters, and a decline in the volume of white sugar traded internationally.
The reform of the sugar regime in the European Union led to an abrupt decline in white sugar
exports, of the order of 6-7 Mt, as production quotas were progressively reduced below
consumption requirements. As a consequence, the EU has switched from a large net exporter
of white sugar to a large importer of mainly raw sugar for further refining and sale in the
domestic market. The white sugar trade is expected to recover over the coming years. This
will occur as more refined sugar is exported by traditional exporters in response to the high
white sugar premium at the start of the Outlook and as new destination refineries in a number
of countries in Africa and the Middle East progressively come on stream and begin to export
increasing quantities of white sugar to neighbouring countries and regional markets.
Source: OECD and FOA Secretariat

Indian Sugar Industry Page 18
Brazil will be the global leader in Sugar export industry because of its huge investment in
setting of new sugar mills and low cost production.
Brazil is expected to consolidate its position as the leading global exporter and will account
for over 55% of global trade and over 63% of all additional sugar exports by the close of the
projection period. While the bulk of Brazil’s exports will continue to comprise high quality
raw sugar, which will increase to 21 Mt in 2020-21. The growing concentration of global
sugar exports is not without risks for sugar users as world export supplies depend
increasingly on the growing conditions of a single country. This may be another factor, in
addition to production cycles in Asia, which contributes to future market volatility. A
possibility is that majority of Brazil’s sugar cane will continue to be used in ethanol
production and many mills have the capacity to produce both sugar and ethanol. Brazil also
remains the only exporter that can switch 5-10% of milling capacity between sugar and
ethanol production within a year in response to changes in relative profitability between the
two end uses. This flexibility should help assure sugar production and export availabilities,
when relative prices periodically favour sugar over ethanol production.
In terms of other leading exporters, Thailand plays a unique role in Asia as the only
consistent producer of a large sugar surplus and with a natural trade advantage, along with
Australia, to service the large sugar deficit in that region. Exports from Thailand, which is
ranked number two in the world, are projected to grow to around 5.8 Mt by 2020-21,
exceeding the 2003 record.
In Australia, increased production over the projection period should support exports of
around 3.8 Mt by 2020-21. Strong demand for Sugar in Mexico, which is expected to grow to
75% of total sweetener consumption and similar to the situation in the US, will substitute for
sugar used in beverage manufactures, releasing surplus sugar for export to the US market.
Mexican exporters prefer US market which is projected to exceed 1.8 Mt by 2020-21. Sugar
importers make up a broader, more diversified group of countries. A significant development
in 2010-11 was that China exceeded for the first time the TRQ of 1.95 Mt established on
sugar imports at the time of its entry to the WTO in 1998. Rapid economic growth and
urbanisation trends are promoting the industrial use of sugar in food manufacture and
preparations. Along with low per capita sugar consumption levels of only 11 kg per person in
the population at large and tightening government controls on the production and use of
artificial sweeteners, these are expected to lead collectively to strong growth in sugar use in
China in coming years. Sugar disappearance is projected to grow by over 3% p.a., exceeding
the growth of production which is increasingly limited by tightening water availability, and
boosting sugar imports to over 5 Mt by 2020-21. This will make China the largest importer
exceeding that of the EU, US and the Russian Federation.

Indian Sugar Industry Page 19
Brazil can switch only 5-10% milling capacity between sugar and ethanol production,
with response to price volatility. This flexibility assures sugar’s producers and
exporters of availability, when relative prices periodically favour sugar over ethanol
production.
In China, tightening government controls on the production and use of artificial
sweeteners, and limited water availability for cane irrigation, moreover increasing
consumption demand along with fast urbanization the China is set to displace EU and
US as largest importer by 2020.
Increased focus on productivity in Russia and India will relieve them from imports.

Indian Sugar Industry Page 20
1.4) World 15 largest sugar producing countries 2010
Source: FOA Secretariat
World 15 Largest Sugar importing Countries 2010
Source: FOA Secretariat

Indian Sugar Industry Page 21
Current world Sugar Production (Continent Wise)
Source: FOA Secretariat

Indian Sugar Industry Page 22
1.5) Global emerging trends
Global sugar demand will increase to 198 mn tonnes in 2021 compared with 168mn
tonnes in 2010.
Asia will remain the biggest consumer of sugar, increasing its share of total consumpti
on from around 45% in 2010, to 50% in 2021. In Asia also China will be the biggest
importer by 2020.
India’s consumption will nearly double over the next 20 years and Chinese consumpti
on will overtake EU consumption in around 2014.
By 2030, it is forecast that India and China will respectively constitute 17.6% and
14.7% of the total global consumption.
Totalconsumption in Europe is expected to remain stable over the next 20 years,
with declining per capita consumption in several of the largest EU economies being of
fset by increasing consumption in less developed countries. Africa will begin to emerge as a major consumer, increasing its contribution in global
consumption from 9% to 13% in 2030, with strong growth in several countries as a re-
sult of high rates of population and GDP growth.
Asia is set to become the largest consumer of sugar by 2020 and it will be consuming
half of the world sugar, china and India will be the largest consumers in Asia.
Consumption for Sugar will fall in North America and EU but the fall will be offset
by rise in consumption by Africa.

Indian Sugar Industry Page 23
World sugar consumption to increase, but still below long-term trend
The post-crisis recovery of the world economy is expected to sustain growth in sugar
demand, mostly in emerging and developing countries. However, in 2010-11, world sugar
consumption is forecast to expand by only 1.5 percent, barely in line with population, to
165.1 million tonnes, resulting in an average sugar per capita consumption virtually
unchanged at 23.9 kg per annum. The 1.5 percent forecasted consumption growth is
significantly slower than the long-term trend, reflecting the impact of high domestic and
international sugar prices. The developing countries, which account for 71 percent of world
total, are anticipated to increase sugar consumption by 1.4 percent, equivalent to about
1.6 million tonnes. In the generally more mature markets of the developed countries,
consumption is to increase by 2%, or 0.9 million tonnes. Positive prospects for the global
economy are expected to support sugar demand in 2011-12 and with a large production
surplus expected for the next season, consumption should return on trend.
1.7) Brazil's Deregulation & Cost leadership
Sugar price controls in Brazil were eliminated in 1999-2000, which encouraged higher sugar
production. Private participation was encouraged for exports and the government mandated
sugarcane prices were eliminated. Brazil is the cost leader in sugar production, due to high
mill and farm scale. Brazil has also adopted a dynamic management of product mix
between sugar and ethanol, which enables it to respond to global shifts in demand and
supply. The rapid modernization of its ports and investments in transport infrastructure has
also been key drivers for low cost.

Indian Sugar Industry Page 24
1.8) CHINESE SUGAR SCENARIO
SOURCE: ISO, NOVEMBER 2010

Indian Sugar Industry Page 25
Doubling of Consumption and increasing further
China is one of the 10 largest consuming countries of sugar in the world.
During the past 10 years, Chinese sugar consumption has doubled, though Chinese
per capita consumption levels are low at 12kg per person compared to western
standards of around 40kg per person.
Industrial Demand Growing
The biggest driver is the growth in industrial demand for sugar in processed foods
which reflects the transformation of the economy and increasing urbanization.
Artificial Sweetener Growth Falling
Though artificial sweeteners still account for a relatively large share of the market and
China also has a large starch based sweetener industry.
There has been a growing emphasis on the use of sugar as a natural alternative and
artificial sweetener consumption has been falling (domestic sales amount to around
2.5m tonnes of white sugar equivalent in 2010.)
Incremental Supply Demand
China’s domestic prices have risen by almost 50% since May 2010 to reach a record
of over CNY 7,000/tonne or over USD 1,000/tonne in early November2010.
In 2010-11 the gap between consumption and production is expected to rise to 3mn
tonnes , being the third season in the row where production is short of consumption by
at least 1.5mn tonnes

Indian Sugar Industry Page 26
1.9) Current issues with Global Scenario
Supply Mismatch
Over last 20 years sugar production has risen by 44% to 157mn tonnes.
Global consumption expected to rise to about 260mn tonnes by 2030.
Production gap of the additional 90mn tonnes requires to be met over the next 20
years.
Europe – A net importer from exporter
Past decade has seen EU production reduce by around 15% due to reforms of sugar
regime turning the region into a net importer from a net exporter.
Brazil Key to fill Demand
World still dependent on Brazil, which currently accounts for 45% of global exports,
to meet the remaining 45mn tonnes requirement.
Improvement in productivity and regulatory changes in sugar producing regions
outside Brazil expected to help meet the remaining 45mn tonnes requirement.
Weather – a key Determinant
Asian sugar production is expected to increase by 23 percent in 2010-11, world sugar
production still heavily dependent on weather and continued cyclical production
patterns.
Supply Diversion to Ethanol
High oil prices are another external risk to contend with as it makes on acreage
sugarcane for fuel ethanol more lucrative.

Indian Sugar Industry Page 27
Part-B
INDIAN SUGAR INDUSTRY
SCENARIO

Indian Sugar Industry Page 28
2.1) Introduction to Indian Sugar Industry
Sugar is one of the oldest commodities in the world and traces its origin in 4th
century
AD in India and China. In those days sugar was manufactured only from sugar cane. But both
countries lost their initiatives to the European,American andOceanic countries, as the 18th
century witnessed the development of newtechnology to manufacture sugar from sugar beet.
However, India is presently adominant player in the global sugar industry along with Brazil
in terms of production. Given the growing sugar production and the structural changes
witnessed in Indian sugar industry, India is all set continue its domination at the global level.
Indian sugar industry is highly fragmented with organized and unorganized players. The
unorganized players mainly produce Gur and Khandari, the less refined forms of sugar. Sugar
industry, one of the major agro-based industrial in India, has been instrumental in resource
mobilization, employment generation, income generation and creating social infrastructure in
rural areas. Indeed, sugar industry has facilitated and accelerated pace of rural
industrialization. The government had a controlling grip over the industry, which has slowly
yet steadily given way to liberalization. The production of sugarcane is cyclical in nature.
Hence the sugar production is also cyclical as it depends on the sugarcane production in
India. As the industry is a fragmented one, even leading players do not control more than 4
percent market in India. However, the situation is changing and players off late are striving to
increase their market share either by acquiring smaller mills or by going for green field
capacity additions.
Indian sugar industry can be broadly classified in to two sub sectors, the organized sector i.e.
sugar factories and the unorganized sector i.e. manufacturers of traditional sweeteners like
gur and khandsari. The latter is considered to be a rural industry and enjoys much greater
freedom than sugar mills. The production of traditional sweeteners gur and khandsari is quite
substantial.
Though the trends indicate a progressive shift from traditional sweeteners to white sugar over
the years, they still account for about 37% of total sweetener consumption in India. Since the
sugar industry in the country uses only sugarcane as an in input, sugar companies have been
established in large cane growing states like Uttar Pradesh, Maharashtra, Tamil Nadu,
Karnataka, Punjab and Gujarat. Uttar Pradesh leads the tally by contributing 24% of the
countries total sugar production and Maharashtra stands next with 20% contribution. The
farmer’s co-operatives own and operate the largest chunk of the industry's total capacity.
They are concentrated primarily in Maharashtra and eastern Uttar Pradesh. The largest
number of sugar companies in the private sector is located in southern India, in the states of
Tamil Nadu, Andhra Pradesh and Karnataka.
At present, there are 553 registered sugar factories having capital investment of Rs. 50,000
crores and annual production capacity of 210 lakhs metric tonnes (ISMA Report, 2008). The
annual turnover of industry is to the tune of Rs. 30,000 crores. The central and state
governments receive annually Rs. 5000 crores as excise duty, purchase tax, and cess. The
sugar industry in the country uses only sugarcane as input, hence sugar Companies have been
established in large sugarcane growing states like Uttar Pradesh, Maharashtra, Karnataka,
Gujarat, Tamil Nadu, and Andhra Pradesh. These six states contribute more than 85% of total
sugar production in the country; Uttar Pradesh and Maharashtra together contribute more than
57% of total production. Indian sugar industry has grown horizontally with large number of

Indian Sugar Industry Page 29
small sized sugar plants set up throughout the country as opposed to the consolidation of
capacity in the rest of the important sugar producing countries, where greater emphasis has
been laid on larger capacity of sugar plants. Sugar industry has brought socioeconomic
changes in rural India by way of facilitating entrepreneurial activities such as dairies,
poultries, fruits and vegetable processing, and providing educational, health and credit
facilities.
Source: FOA
Source: ISMA

Indian Sugar Industry Page 30
Source: ISMA 2008
2.2) Sugar year 2010-11
In 2010-11, the sugar consumption reached about 22.5 mmt, a similar level to that of the
previous season. Production at around 24.5 mmt allowed end-of-season stocks to rise to about
15 days of consumption. Exports were at 2.5 mmt within the highly regulated policy structure
of the Government of India. The OGL (Open general license) scheme benefitted the mills to
export at the time when world sugar prices were at a premium over domestic sugar prices. In
2010-11, the government had allowed 2.6 mmt of sugar exports, of which 1.5 mmt were
under OGL in three equal tranches. The GOI decisions on exports timings and quantities in
future shall depend upon the likely domestic demand pattern and the crop assessment.
(In mmt, Source: Indian Mills Association)

Indian Sugar Industry Page 31
The sugar prices, M-30, have been in the range of Rs 2400 to 3200 per qtl and is expected to be in the same range due to delayed crushing in Maharashtra and UP, expected export announcement, lower pipeline stocks, increase in acreage compared to last year. The cane crop should rise again in 2011-12 to reach to cross 25 mmt due to both an increase in the cane areas and regular rainfall and satisfying agricultural cane yields similar to those of the previous season. In Maharashtra, sugar production forecasts are up and the area under cane has increased.
Sugar industry is the second-largest agro based industry after textile, employing 0.5 million
people in the sugar mills and 50 million farmers engaged in sugarcane cultivation. India is the
largest consumer and the second largest producer of sugar across the globe. Sugar industry is
largely driven by domestic consumption. Indian sugar industry is again entering the supply
glut situation after witnessing a production shortfall in the previous two sugar season -
SS2008-09 and SS2009-10. However, allowing exports would help maintain the sugar prices
which peaked in SS2009-10. In SS2009-10, sugar production registered a growth of 31 per
cent to reach 24.5 mn tonnes on YOY basis. However, the consumption declined in the
SS2009-10. Sharp increase in production coupled with the decline in consumption led to
increased levels of closing stock, thereby driving sugar prices downwards. The production of
sugar is spread across the country. Maharashtra, Uttar Pradesh, Karnataka, Tamil Nadu,
Gujarat and Andhra Pradesh are the major sugar producing states in the country. In SS2009-
10, these six states together accounted for almost 94% of the total sugar produced in India. In
SS2009-10, the State of Maharashtra produced the highest sugar at 7.0 mn tonnes followed
by UP with 5.1 mn tonnes. These two states together account for almost 64.5% of the total
sugar produced in India.
Sugarcane is the primary raw material for the sugar industry. It accounts for almost 80-85%
of the total operating cost of the sugar industry. UP is the largest sugarcane-producing state in
the country and accounted for about 36.2% of the total sugarcane output in SS 2010-11
followed by Maharashtra with 23.6%. Even though, UP is the largest sugarcane-producing
state in the country it is the second largest sugar producer in India as recovery rates in UP are
one of the lowest in India.
A cyclical decline in sugar production is shifting India, the world’s second largest producer,
from net exporter to net importer during 2009-10 (October/September) and contributing to
the current run up in global sugar prices. The downturn in production is primarily due to a
policy-induced cycle that has become increasingly pronounced. India is forecast to shift from
net sugar exports of 5.8 million tons in 2007-08 to net imports of 2.8 million tons in 2008-09
and a record 6.0 million tons in 2009-10.
Sugar production is poised to rebound in 2010-11, as higher government price supports and
open-market prices are likely to stimulate plantings and improve incentives to deliver
sugarcane to sugar mills. In the longer term, India has the capacity to boost sugarcane output,
and the government and the sugar industry are considering policy measures to moderate the
increasingly sharp cycles in sugar production and trade.

Indian Sugar Industry Page 32
2.3) Recent Supply and Demand Developments
Indian sugarcane and sugar production are historically cyclical, and the cycle appears to have
become increasingly pronounced in the 2000s. After soaring to 30.8 million tons in 2006-07,
39% more than previous record set in 2002-03. Sugar production dropped to an estimated
16.1 million tons in 2008-09 and is forecast at 17.3 million tons in the current 2009-10 year.
All of India’s sugar is produced from sugarcane, and the swings in production have been
driven primarily by similarly large swings in harvested area of sugarcane. Estimated area of
4.25 million hectares in 2009-10 is about 17 percent below the record amount in 2006-07.
Although more than 90 percent of sugarcane area in India is irrigated, yields are affected by
the share of area that is relatively high-yielding first-year growth and, to a lesser extent, by
variation in rainfall. Relatively small shares of first-year growth in 2008-09 and 2009-10, as
well as below-normal monsoon rainfall in 2009, likely contributed to reduced average
sugarcane yields in 2008-09 and estimated yields for 2009-10.
In contrast to the volatility of production, Indian sugar consumption has continued to expand
relatively steadily due to rising per capita incomes and government interventions to adjust
stocks, facilitate trade, and assure adequate monthly availability. Despite the sharp drop in
sugar production in 2008-09 and continued low output in 2009-10, sugar consumption has
remained relatively stable and on trend due to monthly releases of “free-sale” sugar into the
open market and allocations of subsidized “levy” sugar. However, despite net imports of 2.8
million tons in 2008-09 and an anticipated 6.0 million tons in 2009-10, Indian sugar stocks
are forecast to fall to 3.5 million tons by October 2010, the lowest level since 1993-94.
Domestic open-market prices of sugar and gur, the primary substitute sweetener, remain
under pressure. For the 2008-09 marketing year, wholesale sugar prices averaged 43 percent
higher in real terms than prices a year earlier, while gur prices averaged 53 percent higher.

Indian Sugar Industry Page 33
2.4) Policies Drive Sugarcane Production Cycles
India’s sugar area and production cycles are driven largely by policy interventions, including
sugarcane support price policies set by the central and state governments as well as sugar
storage and trade policies set by the central government. Biological factors also play a role,
sugarcane remains in the field for 3 years once it is planted, and area and production adjust
downward slowly as price incentives fall, thus prolonging periods of oversupply, weak
market prices, and financial distress for sugar mills. The key policy interventions are:
• Central and state government price support policies for sugarcane.
• Central government regulation of releases of levy and free-sale sugar and buffer stocks.
• Central government regulation of sugar trade.
• Other domestic marketing restrictions (e.g., private storage limits).
Domestic Cycle: turning Shorter & Viscous

Indian Sugar Industry Page 34
The average period for a sugar cycle has been decreasing over the last 15 years. The primary
reason for shorter sugar cycles emanates from the short term cropping pattern of farmers with
respect to the widely fluctuating sugarcane prices vis-à-vis steadily rising prices for other
crops.
Source: ISMA
2.5) Central and state government price support policies for sugarcane
In marketing year 2008-09, the Commission on Agricultural Costs and Prices (CACP) under
the Ministry of Agriculture recommended annual Statutory Minimum Prices (SMP) based
primarily on estimated costs of production. State governments in some of the major
producing states then set higher State Advised Prices (SAP) that mills in the state are required
to pay sugarcane growers. The substantially higher SAPs set by some state governments
account for regional variations in the productivity and profitability of sugarcane, as well as
pressures from local sugarcane growers. The central government financed the cost of
supporting the SMP, but sugar mills were required to pay the difference between the SMP
and the higher SAPs and incur any resulting financial losses.

Indian Sugar Industry Page 35
There is strong but lagged relationship between changes in the SAPs for sugarcane and
changes in area harvested. Drops in area harvested in 2003-04 and 2004-05 were preceded by
declines in real SAPs, and higher SAPs in 2004-05 and 2005-06 corresponded with increased
area in 2005-06 and 2006-07. Most recently, the drop in area in 2008-09 was preceded by
sharply lower real SAPs in 2007-08. The fall in sugarcane area in 2008-09 was likely also
influenced by the unusually large increases in Minimum Support Prices (MSPs) for wheat
and rice, which compete with sugarcane for irrigated land, in 2006-07 and 2007-08. Unlike
the SMPs for sugarcane, the MSPs set by the central government for wheat and rice are good
indicators of prices received by growers because a large share of the marketed surplus of
wheat and rice is purchased at the MSPs. The SAP policy also affects the volatility of
sugarcane area when it imposes financial losses on sugar mills that prevent them from
honouring the SAP. During periods of surplus, SAPs can continue to rise without any specific
link to sugar market conditions. These price hikes catch the mills between the fixed SAPs
they are required to pay and weakening market prices they receive for their refined sugar. The
resulting financial losses lead to deferral or default by mills on payments to growers that
undermine incentives and contribute to volatility in sugarcane planting and production.
With higher open-market sugar prices in 2009, as well as central and state government
measures to assist the mills, the financial health of the mills has been largely restored and is
not expected to affect processing or grower payments for the 2009-10 sugarcane crop.
Government regulated releases of levy, free-sale, and buffer stock sugar. The central
government regulates all releases of refined centrifugal mill sugar into the market by sugar
mills. Marketing of khandsari and gur, which are produced by farmers and small-scale
enterprises, is unregulated. Mills are now required to sell 10 percent of their production at a
fixed, below-market levy price to the Public Distribution System for sale to consumers
determined to have incomes below the poverty line. The remaining 90 percent of mill
production is sold at market prices, but the amounts that can be sold are determined by
quarterly quotas set by the central government.
2.6) Indian Sugar Demand Trends
In contrast to the volatility of sugar production and prices, sugar consumption in India has
grown relatively steadily, increasing about 3.7 percent annually (2.0 percent per capita) since
1990-91.While Policies have been associated with considerable volatility in sugar production,
trade, stocks, and prices, government distribution programs have led to relatively stable
growth in per capita sugar availability. The stable growth in consumption is also reflective of
both the robust growth in aggregate demand and the price inelasticity, or unresponsiveness to
changes in prices, of sugar demand. These factors stem from sugar’s importance as an
ingredient in tea, coffee, soft drinks, and traditional sweets that play a central role in Indian
diets.
Refined centrifugal sugar from sugarcane is the dominant sweetener in India, with the two
traditional sugarcane-based sweeteners, gur and khandsari, accounting for smaller shares of
overall use. Khandsari has been declining in terms of production and consumption, and it
now accounts for only about 3 percent of the market, but gur maintains a significant, albeit
variable, 25-percent share of the market. Gur production and consumption are unregulated
and tend to rise in years when higher gur prices or payment arrears by sugar mills create
incentives for farmers to divert sugarcane to production of gur. During 2008-09 and 2009-10,
gur’s share of the market rose to about 35 percent when growers diverted sugarcane from the
financially distressed mills, magnifying the drop in centrifugal sugar production caused by

Indian Sugar Industry Page 36
reduced sugarcane plantings. Although India does have an ethanol-petrol blending program
using ethanol produced from sugarcane, the program does not, so far, affect the supply of
sugarcane for the production of sweeteners. Unlike Brazil, India produces all of its ethanol
from molasses, which is a normal by product of India’s centrifugal sugar milling process. As
a result, there is no trade off between sugar and ethanol production.
India’s current goal is to require a 10-percent blend of ethanol with petrol in 20 states and 4
union territories, subject to its commercial viability. The drop in sugar production in 2007-08
and 2008-09 has led to reduced supplies and higher prices for molasses and mills have been
unable to deliver ethanol at the currently negotiated price of Rs21.5/litre.
2.7) Sugar Export-Import of India

Indian Sugar Industry Page 37
Like sugar production, sugar trade in India is cyclical, with exports of primarily refined sugar
during periods of surplus and imports of mostly raw sugar during periods of deficit.
Consistent with the increased volatility of sugar production since the early 2000s, swings in
sugar trade have also become more volatile. Since 2000, India’s sugar trade has fluctuated
between average net exports of 1.3 million tons during 2000-01 and 2002-03, net imports of
1.2 million tons during 2003-04 and 2004-05, net exports of 3.3 million tons during 2005-06
and 2007-08, and forecast net imports of 4.3 million tons during 2008-09 and 2009-10.
The shifts in India’s sugar trade are increasingly significant for world markets, contributing to
periods of both under supply and over supply. India’s record 2007-08 exports accounted for
about 11 percent of global exports, and record imports in 2009-10 are forecast to account for
12 percent of world imports. India’s current shift to large net importer is further tightening a
world sugar market that continues to adjust to European Union (EU) sugar policy reforms
begun in 2006. The EU reforms, including reduced price supports, are due to be completed in
2009-10 and have led to sharp declines in sugar production and exports by member nations.
During 2006-07 and 2007-08, the EU-25 averaged net sugar exports of 4.6 million tons, but
by 2008-09, the EU-27 became a net importer of 2.1 million tons of sugar. The major sugar
import markets affected by the instability of Indian supplies are mostly nearby countries in
South and Southeast Asia and the Middle East, including Bangladesh, Sri Lanka, the United
Arab Emirates, Pakistan, Malaysia, Indonesia, and Yemen. India is a small supplier of sugar
to the U.S. market, with annual exports averaging 8,082 tons during 2000-01 to 2007-08.
Brazil, the world’s largest sugar exporter, is India’s major supplier during years of deficit.

Indian Sugar Industry Page 38
2.8) International trade opportunity
International trade is of strategic importance to India as it can help maintain stability in the
domestic market, despite the cyclicality in production. If there is a sugar surplus either due to
excess production or due to greater economic attractiveness of cane for ethanol and cogen in
the future, exports could be used if the surplus cannot be managed in the domestic market.
Acceptability as a credible exporter will provide the Indian sector an alternate set of markets
for diverting surplus production. Similarly, in case of deficits, raw sugar imports could help
bridge the supply gap.
India has the potential to export to major Indian Ocean markets, due to freight
competitiveness with respect to key competitors, Brazil and Thailand. With EU exports
reducing by 4.5 million MT, world prices per MT of sugar are expected to increase in the
range of USD 50 to USD 100. This could potentially make exports more viable for India.
However, due to the increasing emergence of destination refineries, key markets are
importing greater share of raw sugar, and India's competitiveness for raw exports is relatively
lower as of today. Currently, India's competitiveness is higher in markets, where share of
white sugar imports as percentage of cumulative imports is higher. Going forward, India
would need to build the capability to produce raw sugar and refined sugar of international
quality standards, in order to leverage the export opportunity.
The target markets are estimated to import 10 million MT of sugar by 2017. India would be
able to leverage this opportunity through productivity improvements and alignment of cane
and sugar prices in the domestic market. India's competitiveness can also be increased by
enhancing export infrastructure like loading rates and draft in Indian ports. Since the current
cost structure of the Indian industry is uncompetitive for exports, in case of a large sugar
surplus, the government could consider using WTO compliant subsidies to enable exports
while creating stability in the domestic market. The industry could also explore ways of
collectively sharing losses due to exports, if any, since exports would enable lower stocks in
the domestic market, thus benefiting both mills and farmers through higher sugar realization.

Indian Sugar Industry Page 39
2.9) Sugarcane Production Potential in India
India likely has significant potential to expand sugarcane production by increasing both
planted area and yield. While India’s area planted to sugarcane, averaging about 4.5 million
hectares per year of primarily irrigated land, is the second largest in the world after Brazil, it
accounts for a relatively small Share of India’s cropped area (about 142 million hectares) and
net irrigated area (about 60 million hectares). Sugarcane, however, is a year-round crop that
typically remains in the field for 3 years, and returns to sugarcane production must be
competitive for irrigated land on which two and in some areas three, crops are taken in one
year.
Above figure provides gross returns from sugarcane, wheat- paddy double crops common in
irrigated areas of north India, and paddy-paddy double crops common in irrigated areas of
south India over a 10-year period. A comparison shows generally higher returns to sugarcane,
based on both average SAPs and the lower SMPs, although there has been a convergence in
recent years due to the relatively large increases in wheat and paddy MSPs. However, cost of
cultivation data indicate that labour costs for sugarcane are roughly double those for wheat
and paddy, suggesting that labour availability and costs may be constraints to growth in
sugarcane area.
India also appears to have the potential to improve sugarcane yields, and the average sugar
content of harvested sugarcane, through a continued shift of planted area from northern
states, where the climate is subtropical, to southern states, where the climate is tropical and
conducive to higher sugarcane yields and sugar recovery rates. Sugarcane yields in India
average about 68 tons per hectare, about the same as China but below other major producers,
such as Australia, Brazil, and Mexico. But, an increasing share of India’s sugarcane is being
planted in southern states, where yields average about 83 tons/hectare, rather than in north

Indian Sugar Industry Page 40
India, where yields average about 58 tons/hectare. Although the northern state of Uttar
Pradesh the historical center of the Indian sugar industry still accounted for about 46 percent
of sugarcane area and 39 percent of output during 2005-06 and 2007-08, the southern state of
Maharashtra, where both average yields and the sugar content of sugarcane are higher, is now
the largest producer of sugar. Most Indian sugarcane is grown under irrigation in all major
producing states, providing favourable conditions for improving average yields.
2.10) Domestic Sugar Policies
Sugar industry has two stages of policies
Sugar cane price policy
Sugar price policy
Sugar cane pricing policy
Sugar cane pricing is politically sensitive in India. Every year central government announces
Statutory Minimum Price (SMP) for sugarcane. The sugar cane producing states also
announce their own State Advised Price (SAP), which is many times much higher than SMP.
The difference in SMP and SAP has resulted in market distortions and huge pile of arrears
with sugar mills to be paid to farmers.

Indian Sugar Industry Page 41
As per Sugarcane (Control) Order, 1966, sugar mills have to pay cane price to farmers within
14 days of delivery of sugarcane and any failure in this regard could attract penal interest rate
of 15% per annum.
Government has been increasing SMP over the years except for 2008-09. Sugarcane
production remained stable for three years after record output in 2006-07. Stable SMP from
2006 to 2008-09 and stagnant rainfall kept production lower. The sugar prices started rallying
from 2008 followed by fall in output in 2008-09. It is observed that in 2009-10, production
showed marginal rise, despite huge increase in SMP (32.7%), because of fall in rainfall
(down by 20.5 percent from normal). The sugar cane output estimated to increase by over 15
percent in 2010-11, favoured by higher SMP and better rainfall. So, SMP and rainfall has
direct impact on production, but rainfall seems to be more influential factor.
Apart from following price intervening policy in sugar cane, Government also has price
policy on consumption side. Government has been following dual and partial sugar pricing
system for decades. Despite efforts from various industry to do away with price intervention,
Government continue to follow dual price model to balance this highly sensitive market.
• Levy sugar
• Non-levy (free sale)
Levy Sugar-Under this policy, certain percentage of sugar produced by mills has to be given
to government as compulsory levy at a price fixed by Government in every sugar season for
distribution in Public Distribution System (PDS).
Non-levy sugar (free sale)- Under this policy, sugar is allowed to be sold in the market as per
the quantity fixed by the government. The free sale quota is mostly fixed on monthly basis
and also quarterly. In order to decontrol the sugar industry in phased manner, Government
reduced levy obligation of sugar factories from 40% to 30% from January 1 2000. It further
reduced compulsory levy sugar to 15 percent from February 1 2000.

Indian Sugar Industry Page 42
2.11) Sugar year 2012
Excessive availability of sugar this year is unlikely to deter Indian exporters to intensify
supplies to global markets and increase realisation this year. Reeling under severe financial
stress, Indian sugar companies are looking for opportunities for higher realisation from
overseas markets with permission from the local government.
A report released by the Rabo bank forecast the global sugar production to outpace demand
for the second consecutive year by six to eight million tonnes (mt) for 2012-13. Another
report by Barclays Bank also estimates global markets to remain in surplus to the tune of 5.4
mt, despite lower production in Brazil. Barclays estimates global 2011-12 sugar production
will grow 4.2 per cent year-on-year, due to higher-than-expected output in Europe, as well as
in key producing countries, like Australia, India and Thailand, as favourable weather and
prices have led farmers to boost plantings and help offset the decline in Brazil. The global
sugar output in 2011-12 is projected at a record 173 mt. This will surely restrict India’s
opportunity to access global markets at high prices. But, much would depend on sugar output
and quantum of direct conversion of ethanol from cane.
Brazil’s sugarcane production is expected to rise to 520 mt in 2012-13. The country crushed
around 492 mt in 2011-12. Barclays forecast Brazilian sugar production to reach only 35.8 mt
in 2011-12, a decline of 5.8 per cent y-o-y. Presently, the price of sugar remains fairly well
supported, largely owing to perceived shortage of export availability against the import
demand. The total global cane production is estimated at 522 mt. According to India’s sugar
companies, output is expected to be more than 26 mt and consumption 22 mt.
The government of India had allowed one mt of exports under open general licence so far.
An increase in India’s exportable surplus and strong production prospects in key Northern
Hemisphere producers will limit the upside on prices. The important questions for the sugar
market in 2012 will be whether cane output in Brazil recovers after a production setback,
when and how much Brazilian cane will be converted into ethanol instead of sugar, and the
outlook for Indian sugar exports.
According to Barclays, a key influence of the market outlook in 2012 will be the manner in
which the price of ethanol will influence the decision of Brazilian mills to allocate cane to
produce sugar or ethanol. The end of US government subsidies and trade barriers to Brazilian
ethanol bodes well for Brazilian ethanol producers in the long term and could prompt
renewed investment. But exports are unlikely to increase in the near term due to Brazil
struggling to meet its domestic demand.

Indian Sugar Industry Page 43
Part-C
ETHANOL AND ITS
IMPLICATIONS

Indian Sugar Industry Page 44
3.1) Introduction to Bio fuels
Bio fuels are going to play an extremely important role in meeting India’s energy needs. The
Country’s energy demand is expected to grow at an annual rate of 4.8 per cent over the next
Couple of decades. Most of the energy requirements are currently satisfied by fossil fuels –
coal, petroleum-based products and natural gas. Domestic production of crude oil can only
fulfil 25-30 per cent of national consumption. In fact, the crude oil imports are expected to
total 147 million tons (Mt) in 2006-2007.
With the ever-escalating crude oil prices, if one assumes a price of $57/barrel ($420/ton), the
estimated crude oil import bill for 2010-2011 would be $106 billion, about 12 per cent of the
country's Gross Domestic Product.
Import of Crude Oil and Value of Petroleum Products
The average consumption of petroleum products in India is estimated as (petroleum
consumption):
Transport (Petrol, Diesel, CNG, and Aviation Fuel): 51 percent
Industry (Petrol, Diesel, Fuel Oil, Naphtha, Natural Gas): 14 percent
Commercial and Others: 13 percent
Domestic (LPG and Kerosene): 18 percent
Agriculture (Diesel): 4 percent
Ethanol, currently produced in India by the fermentation of sugarcane molasses, is an
excellent bio fuel and can be blended with petrol. Likewise, biodiesel which can be
manufactured by the transesterification of vegetable oil can be blended with diesel to reduce
the consumption of diesel from petroleum. Ethanol and biodiesel are gaining acceptance

Indian Sugar Industry Page 45
worldwide as good substitutes for oil in the transportation sector. Brazil uses pure ethanol in
about 20 per cent of their vehicles and a 22 to 26 per cent ethanol-petrol blend in the rest of
their vehicles. The United States and Australia use a 10 per cent ethanol blend. With a
normal production rate of 1,900 million litres a year, India is the world’s fourth largest
producer of ethanol after Brazil, the United States and China. Beginning 1 January 2003, the
Government of India mandated the use of a 5 per cent ethanol blend in petrol sold in nine
sugarcane producing states. The Government has expanded the 5 per cent ethanol mandate to
the rest of country in a phased manner.
Biodiesel production is rapidly growing in Europe and the United States. Current estimates
show production of 2.2 Mt/year in Europe, with Germany (1.1Mt/year), France (0.5Mt/year)
and Italy (0.4Mt/year) being the leading producers. The European Union mandated that its
members derive at least 2 per cent of their fuel consumption from bio fuels in 2005 and 5.75
per cent by 2010.
3.2) ETHANOL POLICY of GOI
Ethanol is produced in India from sugarcane molasses for blending with petrol. Beginning
January, 2003, GOI mandated the use of 5 percent ethanol blend in petrol through its
ambitious Ethanol Blending Program (EBP).
Developments in EBP
The Government of India has developed an ambitious National Biodiesel Mission to meet 20
per cent of the country’s diesel requirements by 2011-2012. Since the demand for edible
vegetable oil exceeds supply, the Government decided to use non-edible oil from Jatropha
Curcas oilseeds as biodiesel feedstock.
Extensive research has shown that Jatropha Curcas offers the following advantages: it
requires low water and fertilizer for cultivation, not browsed by cattle or sheep, pest resistant,
easy propagation, high seed yield and ability to produce high protein manure. The National
Biodiesel Mission will be implemented in two stages:

Indian Sugar Industry Page 46
1) A demonstration project carried out between 2003-2007, which has cultivated 400,000
hectares of land and yielded about 3.75 tons oilseed per hectare annually. The expected
annual biodiesel production from the project is 1.2 t/ha/year for a total of 480,000 tons per
annum. The Government will build a transesterification plant with a biodiesel production
capacity of 80,000 t/year as part of the demonstration project.
2) A commercialization period from 2007-2012 has continued Jatropha cultivation and
installed more transesterification plants which has positioned India to meet 20 per cent of its
diesel needs through biodiesel.
3.3) Expanding ethanol supply
Currently, the government does not allow the use of imported ethanol for the EBP program,
as the focus is on developing domestic capacities.
Ethanol is manufactured directly from sugar molasses but given the projection for
higher sugarcane production in India for 2011-12 (upswing in production cycle), the
use of sugarcane juice for ethanol production seems to be a viable option especially
under conditions of sugarcane glut in the country.
The GOI is offering subsidized loans (through sugarcane development funds) to
sugar mills for the creation of an ethanol production unit. The loan would cover a
maximum of 40 percent of the project cost.
Given the limited scope of bringing additional area under water intensive sugarcane
cultivation, fluctuations in supply and pricing of ethanol could be stabilized through
the use of alternate crops. Public and private institutions can promote the use of
alternate crops such as sweet sorghum, sugar beets or sweet potatoes, to supplement
domestic ethanol production, though the efforts to produce ethanol from these feed
stocks are at experimental stage.
India has 330 distilleries which produce over 4 billion litres of rectified spirit (alcohol) per
year. Of the total distilleries, about 120 distilleries have the capacity to distillate 1.8 billion
litres (an additional annual ethanol production capacity of 365 million litres was built up in
last three years after government provided funds to sugar mills) of conventional ethanol per
year and meet the demand for 5 percent blending with petrol. Currently, India produces
conventional bio-ethanol from sugar molasses and production of advanced bio-ethanol is in
its nascent phase (research and development).

Indian Sugar Industry Page 47
Production With an outlook of bumper sugarcane and sugar production in 2011-12, the government is
likely to renew its focus and strongly implement the mandatory 5 percent ethanol blending in
petrol provided the Union Cabinet takes a decision on the purchase price of ethanol for EBP.
Further, sugar mills may divert their stocks for ethanol production to offset falling prices of
sweetener, which in turn would provide supplementary income to the distilleries and would
ensure farmers a better price for sugarcane.
Short supplies of sugar molasses in preceding years constrained ethanol production and
consequent higher prices made it unviable to supply ethanol to petroleum companies at the
negotiated prices. Higher sugarcane and sugar production in 2010-11 has raised ethanol
production and improved total ethanol supply to offset short (opening) stocks.
Consumption
The strong growth in consumption of ethanol across the chemical industry, the potable liquor
industry and EBP is expected to raise the total ethanol consumption over 2 billion litres in
2011-12. Ethanol supply for EBP is unlikely to be constrained given the improved supply
situation. According to industry and trade sources, ethanol availability during 2011-12 is
forecast at 300 million litres, against the target of 1 billion litres set by the industry. Ethanol
consumption for EBP in 2010-11 has been raised by 200 million litres from 50 million litres
in 2009-10 mostly due to improved supply of molasses and steady demand of ethanol from
competing industries. During 2009-10, higher market prices of ethanol were attractive for the
suppliers to divert their supplies from EBP.

Indian Sugar Industry Page 48
3.4) Trade of ethanol India imports ethanol only to meet shortfalls in demand during years of low sugar production.
The demand is mostly for consumption across potable liquor and chemical industries and not
for fuel purpose. Exports of ethanol are negligible, however, a small volume of ethanol
exports (approx 41,000 litres during first three quarters of Calendar Year 2010) were noted
for Ghana, Netherland, Tanzania, Saudi Arabia, Nepal, Liberia, Sri Lanka, U.A.E, Bhutan,
Malaysia and other African countries.
Although there are no quantitative restrictions on the import of bio fuels, high duties on tariff
lines make imports economically unviable. The GOI does not provide any financial
assistance for exports of bio fuels (biodiesel and ethanol). However, current trade regulations
allow duty free imports of feed stocks for re-export by certified export oriented units.
Bio fuels offer a number of environmental, social, and economic advantages, including lower
emissions of harmful pollutants; decreased greenhouse gas emissions; increased employment;
increased energy security, especially in rural areas; decreased dependence on oil imports; and
good fuel properties for vehicles.
Various analyses indicates that while India has an ethanol distillation capacity of 2,900
million litres/year, sufficient to meet 5 per cent ethanol blending requirements, domestic
sugarcane molasses might not represent a reliable feedstock, given the vagaries of the sugar
industry and the dependence of sugarcane cultivation on monsoons. For instance in 2003-
2004, the sugar output dropped to 15 Mt, molasses production sunk to 6.75 Mt, and the
ethanol manufacturing level decreased to 1,518 million litres.
This caused India to import ethanol and molasses in 2003-2004. In addition to more
efficient agricultural practices for improved sugarcane yield, crops like sweet sorghum and
tropical sugar beet represent attractive alternate feedstock for ethanol. New exciting
technologies like enzymatic fermentation of cellulose will, in the near future, enable ethanol
to be manufactured at competitive prices from cheap, easily available material like wood and
crop residue. In the meantime, ethanol imports can be used to satisfy some of India’s ethanol
demand, especially for 10 and 20 per cent ethanol blending. Brazil exported about 2 billion
litres in 2004-2005, and other countries like Thailand, Mexico and Cuba are increasing
production. Molasses imports from agro-industries in Asia can also augment India’s ethanol
production.
3.5) Benefits from the use of bio fuels in India
Reduced emission of harmful pollutants
Ethanol and biodiesel are both oxygenated compounds containing no sulphur. These fuels do
not produce sulphur oxides, which lead to acid rain formation. Sulphur is removed from
petrol and diesel by a process called hydro-desulphurisation. The hydro-desulphurisation of
diesel causes a loss in lubricity, which has to be rectified by introducing an additive.
Biodiesel has natural lubricity, and thus no lubricity-enhancing additive is required.
Since ethanol and biodiesel contain oxygen, the amount of carbon monoxide (CO) and un
burnt hydrocarbons in the exhaust is reduced. With the introduction of ethanol in Brazil,

Indian Sugar Industry Page 49
CO emission from automobiles decreased from 50 g/km in 1980 to 5.8 g/km in 1995. The
emission of nitrogen oxides (No) from bio fuels is slightly greater when compared to
petroleum, but this problem can be ameliorated by using de-Nox catalysts which work well
with bio fuels due to the absence of sulphur.
One of the disadvantages in using pure ethanol is that aldehyde emissions are higher than
those of gasoline, but it must be observed that these aldehyde emissions are predominantly
acetaldehydes. Acetaldehydes emissions generate less adverse health effects when compared
to formaldehydes emitted from gasoline engines.
Increase in nutrients to soil, decrease in soil erosion and land degradation
In ethanol production from sugarcane, the by-products like vinasse (solid residue left after
distillation) and filter cake contain valuable nutrients. Using these organic fertilizers instead
of chemical fertilizers reduces the need for chemicals, which could be hazardous and avoids
pollution of ground water and rivers. International Crop Research Institute for Semi-Arid
Tropics (ICRISAT) has compared the nutrient content of filter cake obtained from various
oilseeds in biodiesel manufacture with that of commonly used fertilizers like Di-Ammonium
Phosphate (DAP) and Urea. Also the cultivation of land for sugarcane and oilseed-bearing
crops contributes to a decrease in soil erosion and land degradation
Current ethanol industry in India
Ethanol is produced in India by the fermentation of molasses, a by-product in sugar
manufacture. The yield of sugarcane in India varies from an average of 77 tons/ha in tropical
states to about 52 tons /ha in subtropical states. The yield of sugar on average is
approximately 105 kg per ton of cane. About 40 kg of molasses is produced per ton of cane
from which about 10 litres of ethanol can be obtained. If the sugarcane is directly and fully
used in ethanol manufacture, the yield of ethanol is 70 litres per ton.
Table below shows the projected demand and supply of ethanol for blending in petrol (5 per
cent ethanol – 95 per cent petrol).
Economics of ethanol production from sugarcane
The present price of sugarcane, as fixed by the central government under the minimum
statutory price, is Rs. 695/ton ($15.45/ton) based on a sugar recovery of 8.5 per cent. At a
10.5 per cent recovery rate, the price of sugarcane, after state excise taxes, is Rs 900/ton
($20/ton). Assuming an ethanol yield of 70 litres/ton of cane, the raw material cost of ethanol
is Rs 900/70 = Rs. 13/litre ($0.29/litre). After adding salary and wages of operational staff,

Indian Sugar Industry Page 50
capital related charges of investment, energy cost of producing anhydrous alcohol, cost of
transport and marketing, the cost of producing ethanol directly from sugarcane is Rs 20/litre
($0.45/litre). This compares favourably with the current world price of petrol, $1.75/gallon
($0.46/litre).
The ethanol cost price can be brought down further through the following options:
Allowing a market-based sugarcane price.
Combining ethanol manufacture with sugar manufacture, which would permit a major
part of the cane cost to be off-loaded to sugar. For instance, a ton of sugarcane
produces 105 kg sugar, and even if the sugar is sold at Rs 10/kg, this will be sufficient
to pay for the cost of the sugarcane.
Using the bagasse by-product and spent wash more efficiently. The spent wash, which
is produced in large quantity (about 15 litres per litre of ethanol produced), can be
subjected to anaerobic digestion that not only removes its BOD and COD but also
provides valuable biogas (60 per cent methane). This biogas can be used to offset 67
per cent of the energy cost of making anhydrous alcohol through distillation. Plants
can further use bagasse, which is left after crushing the cane, as boiler fuel for
electricity generation at 97 kWh/ton of cane crushed.
3.6) Policy towards Ethanol Blending
The Indian approach to bio fuels is based on non-food feedstock to deliberately avoid a
possible conflict between food and fuel. The National Bio fuel Coordination Committee
(NBCC), headed by the prime minister was set up in 2010. The policy also proposed that the
minimum purchase price (MPP) for bio ethanol should be based on the actual cost of
production and import price of bio ethanol. The price of ethanol would be determined by the
Bio fuel Steering Committee and decided by the NBCC, and in the event of diesel or petrol
prices falling below, the MPP for biodiesel and bio ethanol, OMCs would be duly
compensated by the government. Bio fuel imports would be permitted to the Extent necessary
and decided by the NBCC under the policy. Additionally, it was mentioned that commentary
bio ethanol already enjoys a concessional excise duty of 16% and biodiesel is exempt from
excise duty.
Duties and taxes would be levied on imports to ensure that indigenously produced bio fuels
are not more expensive than the imported bio fuels. Thus, the objective of the National Policy
on Bio fuels has been to encourage domestic production of ethanol and further the ethanol
blending programme (EBP) in the country. Demand and Supply In India, ethanol production
is mainly done using sugar cane as feedstock. For successful implementation of EBP in India,
a steady supply of sugar cane (or sugar cane juice) is required as a feedstock. The sugar cane
production in 2008-09 was 271.2 million tonnes as per the statistics of Indian Sugar Mills
Association (ISMA). In India’s case, industry sources reveal that ethanol production in India
has been taking place almost entirely through the final “C” grade molasses (i e, a litre
ethanol can be extracted from 0.004 tonnes of molasses). The ethanol production in 2008-09
as reported by ISMA is 1,560 million tonnes. However, considering the different uses of
ethanol in India (potable, alcohol based chemical industry) and making assumptions about
industry growth rates, a grand total of approximately 545 million tonnes sugar cane would be
required for consumption in India with the mandated 5% blending for transport by 2011-12.
This is much more than the total sugar cane production of approximately 355 and 340 million

Indian Sugar Industry Page 51
tonnes during the 2006-07 and 2007-08, which were bumper crop years. The per capita
consumption of sugar in 2010 stood at 23-24 kg a year, implying that sugar production is
around 24.3 million tonnes. To achieve this level of production, sugar cane needs to be
cultivated on an area of about 5.5 million hectares with an average
Yield of 65 tonnes per hectare to yield 357.5 million tonnes. Three factors determine sugar
cane production in India: the
Area under sugar cane production, the sugar cane yield per hectare and the proportion of
sugar cane output that is crushed by sugar factories. Thus, to meet the expected increase in
demand for ethanol, the area under sugar cane cultivation has to be increased or the yield per
hectare has to be increased or ethanol has to be produced from alternative feedstock such as
sweet sorghum, 24 sugar beet or cellulosic raw materials. However, cost-effective saccharine
fication, fermentation and commercialisation of the readily available cellulosic material are
currently very costly.
The area under sugar cane production in India has increased nearly 2.5 times since 1950-51
touching about 5.04 million hectares in 2007-08.However, it has tended to stagnate in the
recent past. The area under sugar cane production is subject to yearly variation, partly
because the crop tends to follow a cyclical pattern in terms of output (with three-four years of
bumper harvests followed by relatively poor crops over a similar period) and also
competition from other crops that can be grown more profitably or within a shorter time than
sugar cane. It is also important to note that India has limited arable land and sugar cane
production requires a long time and large amounts of water and fertilisers. Hence increasing
the area under cultivation may not be possible and alternative crops may not suit the climatic
and other conditions. Sugar production in India is also characterised by a low average sugar
recovery rate of about 9-10% compared to a much higher 12-13% in some other sugar
exporting countries such as Brazil. A substantial part of the sugar cane produce (at least 20%)
is used for manufacturing traditional sweeteners (like gur) and other uses, leaving only the
remaining for making sugar (and molasses).
A major problem is that in India, sugar production in general follows a five to seven year
cycle, i e, production increases over a three to four-year period, reaches a high, which in
turn, results in lower sugar prices. As a result of lower sugar price realisations of sugar mills,
the sugar cane arrears to farmers increase. This results in lower sugar cane production for the
next Two to three years. Due to lower sugar production, the prices shoot up resulting in
increased area under sugar cane cultivation during the next season, following which there is
usually a glut again. It is a systemic problem which needs to be resolved through targeted
policy regulations. Some argue that given so many constraints, India can only meet its needs
through imports from surplus countries such as Brazil as has been done in the past by the
industrial sector in times of shortage of ethanol. This is a viable way out as long as it remains
cost effective to do so.
Pricing of Ethanol- The cost of producing ethanol varies with molasses prices and hence
cyclical variations in sugar cane production largely determine the cost of ethanol production.
At present, the government controls the price of cane but directs the sugar mills to sell up to
20% of output under the public distribution system (PDS). Sugar cane prices are fixed on the
basis of the statutory minimum price (SMP), in lieu of the minimum support price announced
by the central government, and the state advised price (SAP), which is usually fixed by state
governments above the SMP. However, sugar prices are determined on the basis of market
prices. In October 2009, the Ministry of Consumer Affairs, Food and Public Distribution
issued an ordinance in which the Sugar cane (Control) Amendment Order, 2009 changed the

Indian Sugar Industry Page 52
pricing regime for sugar cane dictated by the Sugar cane (Control) Order, 1966. Under the
new order, the support price for sugar cane is now called the fair and remunerative price
(FRP), instead of the earlier SMP, to be fixed by the central government from time to time.
Sugar prices, on the other hand, do not increase in the same proportion every year. The
empowered group of ministers (EGoM) has fixed the interim refinery gate price of ethanol at
Rs 27 per litre. Working backwards, a price of Rs 27 per litre implies that the cost of
molasses to the distillery is around Rs 4,800 per tonne. The price of molasses in recent times
has increased to Rs 5,000 per tonne in some parts of the country. The pricing issue is also
complicated by the decontrol of petrol prices and administered pricing of sugar cane. The
price of crude petroleum forms an upper-limit to the cost of ethanol that the OMCs can
profitably use. At the 2008 level of crude oil prices, OMCs were making a profit with the
blending of 5% ethanol with petrol. The situation may, however, change with a possible fall
in crude prices. A comparison of the value of petrol (assuming that blending occurs at the
storage point), i e, Rs 33-34 per litre as against the ethanol cost of Rs 26-37 per litre
(assuming different distillery gate prices) – shows that of the three prices Rs 18 (from the
earlier estimates of the Planning Commission (2003) and Gonsalves (2006), Rs 21.5 (from
the earlier determined contract price of ethanol supply to OMCs), and Rs 27 (interim price
fixed by the EGoM), ethanol blending will result in losses for OMCs at the ethanol price of
Rs 27 per litre.
It should be noted that the comparison of the costs of ethanol-blended petrol and fossil fuel-
based petrol has been done at the crude oil prices prevailing in April 2009. Changes in crude
oil prices would result in a change in the financial aspects of the issue. With the hardening of
crude prices in recent times (since late 2010) it can be expected that ethanol blending would
again be a profitable proposition. Conclusions since the availability of ethanol becomes
critical in the implementation of the BP ways to augment the supply are important. In May
2009, the Planning Commission advised the government to consider providing incentives to
encourage companies to acquire sugar cane plantations abroad, especially in countries such as
Brazil, to bring ethanol into the country. Other options include collaboration with Brazil and
other prospective international suppliers of ethanol in areas of research and development and
cross-border investment. These measures along with other steps to augment the domestic
availability of ethanol, like the integration of the production and milling of sugar cane to the
ethanol production stage can alleviate some bottlenecks.
On the issue of pricing, since sugar cane supply follows a cyclical pattern, ethanol prices
would need to be revised periodically to reflect market conditions. Additionally, changes in
crude oil prices would have a direct bearing on the financial viability of the EBP. There
should, therefore, be some thought given to the distributive shares in the situation of
High crude prices, and therefore, greater profitability of the programme, i e, what part should
be given to OMCs, consumers and through higher MSP to sugar cane farmers. On the flip
side, in the situation of losses, the government needs to set targets for the subsidy burden that
it is willing to shoulder for an environmental cause.
The vehicular fleet of the country is mostly compatible with 5% ethanol blended petrol. With
the implementation of the lending programme from the current 5% to the higher levels of
EBP (as envisaged in the National Policy for Bio fuels, sufficient lead time would be needed
for the automobile industry to make the suitable change to the engines.

Indian Sugar Industry Page 53
CONCLUSION
Asia will be the leading in sugar consumption and Africa will rise as a new potential market.
Sugar industry goes through a cycle of 3-4 years due to government regulation. China will be
the largest sugar consumer in years to come. Sugar cane pricing is politically sensitive in
India. Every year central government announces Statutory Minimum Price (SMP) for
sugarcane. The sugar cane producing states also announce their own State Advised Price
(SAP), which is many times much higher than SMP. The difference in SMP and SAP has
resulted in market distortions and huge pile of arrears with sugar mills to be paid to farmers.
Higher sugarcane production results in a fall in sugar prices and non-payment of dues to
farmers. This compels the farmers to switch to other crops, causing a shortage of sugarcane
and consequently an increase in sugarcane prices and extraordinary profits. Taking into
account the prevalent higher prices for cane, farmers then switch back to sugarcane.
Asia is set to become the largest consumer of sugar by 2020 and it will be consuming half of
the world sugar, china and India will be the largest consumers in Asia. Consumption for
Sugar will fall in North America and EU but the fall will be offset by rise in consumption by
Africa.
Private participation was encouraged for exports and the government mandated sugarcane
prices were eliminated. Brazil is the cost leader in sugar production, due to high mill and
farm scale. Brazil has also adopted a dynamic management of product mix between sugar and
ethanol, which enables it to respond to global shifts in demand and supply. The rapid
modernization of its ports and investments in transport infrastructure has also been key
drivers for low cost.
India’s bio-fuel policy is comprehensive and gives a broad outline to all the major
areas that need attention. These guidelines have to be translated into a bio-
fuel program and a series of projects to reap the potential benefits. Given the vast
differences in the economic performances and cross-sectoral implications of ethanol
and biodiesel, the bio-fuel policy can serve better if these two sectors are dealt
separately.
Simple natural resource accounting shows that 20% blending of ethanol with petrol
can be achieved by 2017, only if sugar cane juice is converted to ethanol to
supplement molasses ethanol.Sweet sorghum (SS) and tropical sugar beets (TSB) are still
at the initial stage of development and face major technological and financial constraints.
About out 32 million hectares of wasteland are required for biodiesel production
together with yield improvements to meet a 20% blending target with petroleum
diesel. However, it is unlikely that India can achieve the 20% blending target by 2017 given t
he current infant stage of the biodiesel industry in the country

Indian Sugar Industry Page 54
BIBLIOGRAPHY
Food and Agriculture Organization of the United Nations. FAOSTAT.
http://faostat.fao.org/default.aspx
Government of India, Ministry of Agriculture and Cooperation, Directorate of Economics and
Statistics. Agricultural Statistics at a Glance, various annual issues.
http://agricoop.nic.in/Agristatistics.htm
Government of India, Ministry of Agriculture and Cooperation, Directorate of Economics and
Statistics. Cost of Cultivation of Principal Crops in India, 2007.
http://dacnet.nic.in/eands/costofcultivation.pdf
Government of India, Ministry of Agriculture and Cooperation, Commission for Agricultural
Costs and Prices. Reports of the Commission for Agricultural Costs and Prices for the Crops
Sown During 2003-04 Season.
Government of India, Ministry of Commerce and Industry, Office of the Economic Adviser.
Wholesale Price Index Data. http://eaindustry.nic.in/
Government of India, Ministry of Consumer Affairs, Food, and Public Distribution. Sugar
policy announcements. http://fcamin.nic.in/dfpd/
Government of India, Ministry of Consumer Affairs, Food, and Public Distribution,
Department of Food and Public Distribution. Order S.O. 2665(E)/ EssCom./Sugarcane, New
Delhi, October 22, 2009. http://fcamin.nic.in/ sugar/spf0001.pdf
Indian Sugar Mills Association. 2006. Indian Sugar Yearbook, 2005-06.
U.S. Department of Agriculture, Foreign Agricultural Service. Attache Reports.
U.S. Department of Agriculture, Foreign Agricultural Service. Production, Supply, and
Distribution Data Online.