Embed Size (px)
Citation preview
Indian Automotive and Industrial Lubricants Market: Trends & Opportunities (2014-2019)
View Report Details
June 2014

Scope of the Report
The report titled “Indian Automotive and Industrial Lubricants Market: Trends & Opportunities
(2014-2019)” provides an insight into the lubricants sector in India with a special focus on sub-
segments like automotive and industrial lubricants. The report also includes the production
and consumption trend, market value, segmentation on various parameters and distribution
structure of the Indian lubricants sector. It also discusses key growth drivers and major
challenges faced by lubricants industry in India. Further, key manufacturers of lubricants like
Castrol India, HPCL, Gulf Oil and Indian Oil are profiled in the report.
Segments Coverage
Automotive Lubricants
Industrial Lubricants
Company Coverage
Castrol India Limited
Hindustan Petroleum Corporation Limited (HPCL)
Gulf Oil Corporation Limited (GOCL)
Indian Oil Corporation Limited (IOCL)
View Report Details

Executive Summary
India is the fifth largest lubricant market globally in volume terms behind the US, China, Russia and Japan. India
is a net base oil deficit market and many additives used in lubricants are mostly imported. Volume consumption
of lubricants in India has consistently declined over past few years as a result of improving lubricant and engine
quality. In addition the year 2013 was accompanied by slower GDP growth rate and subdued industrial activity
that also affected the industry margins.
The lubricants usage can be divided in two key segments – Automotive and Industrial. The demand for
automotive lubricants in India is driven by growth in vehicle population and the consumption of industrial
lubricants is highly correlated with Index of Industrial Production (IIP). Automotive lubricants typically are higher
margin products compared to industrial lubricants. Majority of automotive lubricants demand is derived from
commercial vehicles (CVs) and tractors, largely dominated by diesel engines. Process oils are the biggest
contributor within industrial lubes.
In the Indian market, lubricants are sold broadly through three channels- Original Equipment Manufacturers
(OEMs), petrol pumps and bazaar/retail trade. Bazaar trade is the most profitable amongst the distribution
channels and consists of spare part shops, dedicated lubricant dealers, mechanic workshops and service
centers.
The lubricants industry in India is dominated by national oil companies namely IOC, BPCL and HPCL that account
for almost half of market share. Rest of the market includes private multinationals like Shell, Exxon Mobil, Total
and numerous smaller and loyal players.

Indian Lubricants Market: Overview
India is a net base oil deficit market and many additives used in lubricants are sourced from
outside India. India is the fifth largest lubricant market globally in volume terms behind the US,
China, Russia and Japan. The declining consumption volume was as a result of improving
lubricant and engine quality.
Production and Consumption of Lubricants in India (‘000 MT)
• Demand for automotive lubricants is driven by growth in vehicle population.
• Consumption of industrial lubricants is highly correlated with Index of Industrial Production
(IIP).
Indian Lubricants Market Segmentation by End Use in %, FY13
2008-09 2009-10 2010-11 2011-12 2012-13 2013-14Production ('000 MT) Consumption ('000 MT)
Volume Value
Industrial/Marine Automotive

Automotive and Industrial LubricantsAutomotive lubricants typically are higher margin products compared to industrial lubricants. For
commercial vehicle lubes, bazaar trade accounts for ….%, while OEM service centers account for
…..% of sales. Direct bulk sales are conducted for the rest of the CV segment. Engine oil is the
largest category within automotive lubricants .
Automotive Lubricants by Product Categories in %, 2013
• The industrial lube volumes are primarily driven by the industrial activity levels. Process oils
are the biggest contributor within industrial lubes at nearly ….% in 2013.
• Volatility in commodity prices is one of the most material risks to business stability.
Distribution Channel Break-up for Commercial Vehicle Lubricant Segment, 2013
Engine Oils
Gear Oils
Greases
Transmission Fluids
Bazaar Trade
Bulk Sales
OEMS
Fuel Stations/Others

Table of Contents
1. Executive Summary
2. Lubricants and Greases
2.1 Overview
2.2 Types of Lubricants
2.3 Base Oil
3. Indian Lubricants Sector
3.1 Evolvement of Lubricants Industry
3.2 Production and Consumption Trend
3.3 Market Size by Value
3.4 Import and Export Trends
3.4.1 By Quantity
3.4.2 By Value
3.5 Segmentation by End-Use
3.6 Market Share by Players
4. Automotive Lubricants Market
4.1 Market Size
4.2 Product- Wise Segmentation
4.3 Vehicle-Wise Segmentation
4.4 Usage of Lube Oils across Vehicles
4.5 Distribution Channels
4.6 Pricing of Automotive Lubricants
4.7 Automobile and Auto Component Industry
4.8 Market Drivers & Trends
4.8.1 Preference for Premium Quality Lubes
4.8.2 Demand for Synthetic and Semi-Synthetic Lubes
4.8.3 Stricter Emission Standards
4.8.4 Automobile Volume Growth
4.8.5 Demand from Rural Markets
5. Industrial Lubricants Market
5.1 Market Size
5.2 Category Wise Segmentation
5.3 End Markets Segmentation
5.4 Industrial Sector in India
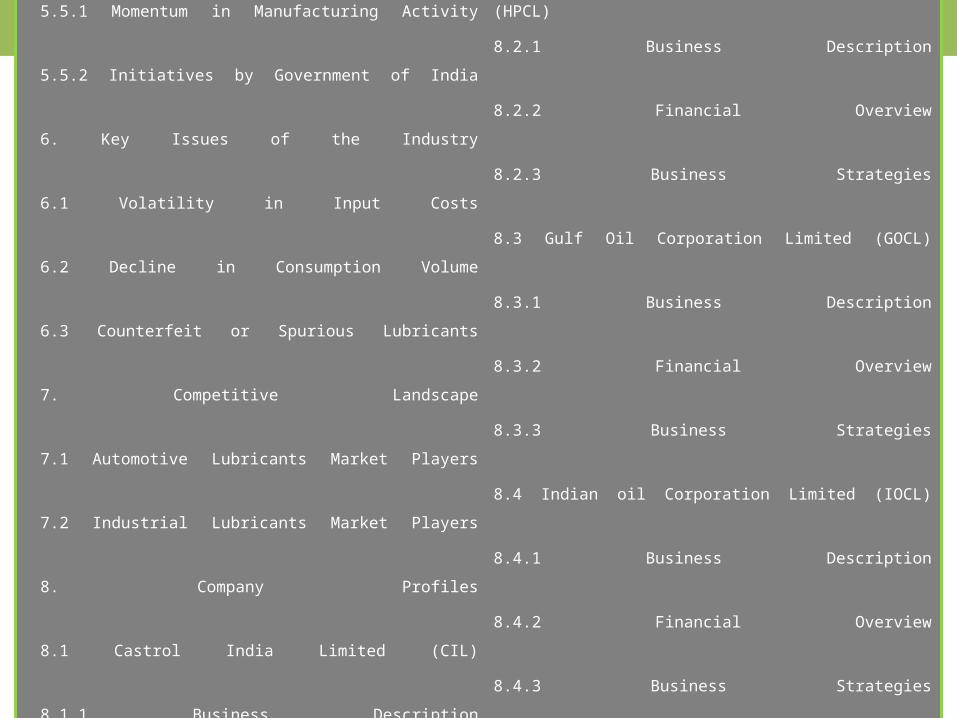
Table of Contents
5.5 Market Trends and Drivers
5.5.1 Momentum in Manufacturing Activity
5.5.2 Initiatives by Government of India
6. Key Issues of the Industry
6.1 Volatility in Input Costs
6.2 Decline in Consumption Volume
6.3 Counterfeit or Spurious Lubricants
7. Competitive Landscape
7.1 Automotive Lubricants Market Players
7.2 Industrial Lubricants Market Players
8. Company Profiles
8.1 Castrol India Limited (CIL)
8.1.1 Business Description
8.1.2 Financial Overview
8.1.3 Business Strategies
8.2 Hindustan Petroleum Corporation Limited (HPCL)
8.2.1 Business Description
8.2.2 Financial Overview
8.2.3 Business Strategies
8.3 Gulf Oil Corporation Limited (GOCL)
8.3.1 Business Description
8.3.2 Financial Overview
8.3.3 Business Strategies
8.4 Indian oil Corporation Limited (IOCL)
8.4.1 Business Description
8.4.2 Financial Overview
8.4.3 Business Strategies
9. About Us
List of Charts
Figure 1: Representation of Process from Base Stock to Finished Lubricant
Figure 2: Global Base Oil Production Capacity by Types, 2009 vs 2012
Figure 3: Evolvement of Indian Lubricants Sector
Figure 4: Production and Consumption Volume of Lubricants in India, 2008-09 to 2013-14, (Thousand MT)
Figure 5: Consumption Share of Lubricants & Greases Out of Total Petroleum Products, 2013-14
Figure 6: Forecast – Demand of Lubricants by Volume in India, 2014-15 to 2018-19 (Thousand MT)
Figure 7: Indian Lubricants Market Size by Value in US$ Billion: 2009-10 to 2012-13
Figure 8: Yearly Wholesale Price Index of Lubricants – India, 2007-08 to 2012-13 (Base Year 2004-05=100)
Figure 9: Import and Exports of Lubricants in India by Volume, 2008-2009 to 2013-14 (Thousands MT)
Figure 10: Import and Exports of Lubricants in India by Value, 2008-2009 to 2013-14 (US$ Million)
Figure 11: Indian Lubricants Market Segmentation by End Use, FY13
Figure 12: Indian Lubricants Sector - Market Shares by Players, FY13
Figure 13: Automotive Lubricants Market Size, 2007-2013 (Million Liters)
Figure 14: Gross Margins for Sub-Categories Within Automotive Segment, 2013 (US$/Liter)
Figure 15: Automotive Lubricants by Product Categories, 2013
Figure 16: Vehicle-Wise Segmentation of Automotive Lubricants Market, 2013
Figure 17: Share of Lubricants within Commercial Vehicle Segment, 2013
Figure 18: Distribution Channel Break-up for Commercial Vehicle Lubricant Segment, 2013
Figure 19: Distribution Break-up for Passenger Cars and 2-Wheelers, 2013
Figure 20: Pricing Comparison of Passenger Car Oil 15W40, 2013 (US$/Liter)

Figure 21: Pricing Comparison for Brake Oils, 2013 (US$/Liter)
Figure 22: Pricing Comparison of 2 Wheeler Engine Oil 20W40, 2013 (US$/Liter)
Figure 23: Pricing Comparison of Commercial & Heavy Duty Vehicle Oil 20W40, 2013 (US$/Liter)
Figure 24: Pricing Comparison for Commercial and Heavy Duty Vehicle Oil 15W40, 2013 (US$/Liter)
Figure 25: Pricing Comparison for Gear Oils, 2013 (US$/Liter)
Figure 26: Production of Passenger and Commercial Vehicles in Thousand Units (2011-2012 vs 2012-2013)
Figure 27: Sales of Passenger and Commercial Vehicles in Thousand Units (2011-2012 vs 2012-2013)
Figure 28: Turnover of Auto Component Industry in India in US$ Billion (2008-2009 to 2020-2021F)
Figure 29: Breakup of Auto Components Industry by Product Category (2012-2013)
Figure 30: Export and Import Value of Auto Components in US$ Billion (2008-09 to 2012-13)
Figure 31: Share of Engine Oils in Passenger/2Wheeler category, 2007-2013 (%)
Figure 32: Share of Engine Oils in Commercial Vehicles category, 2007-2013 (%)
Figure 33: Forecast - Production of Passenger and Commercial Vehicles, 2012-13 to 2020-21 (In number of Units)
Figure 34: Consumption of Industrial Lubricants by Volume, 2008-09 to 2013-14
(In Thousand MT)
Figure 35: Industry Lubricants - Category Wise Split (2013)
Figure 36: End Markets Segmentation of Industrial Lubricants, 2013
Figure 37: Growth Rate of GDP at Factor Cost (at 2004-2005) Prices in % (2007-08 to 2013-14)
Figure 38: Sectoral Share in GDP at Constant (2004-2005) Prices in % (2013-14)
List of Charts

Figure 39: Yearly Inflation and Wholesale Price Index (Base Year: 2004-2005=100)
Figure 40: Brent Crude Oil Prices in US$ per Barrel (2007-2013)
Figure 41: Lubricant Use per vehicle in India in Liters/vehicle/annum (FY07-FY14)
Figure 42: Shares of Indian Automotive Lubricants Market Players, 2013
Figure 43: Market Shares of Industrial Lubricants by Players, 2013
Figure 44: Castrol India Business Segmentation by Revenue, 2013
Figure 45: Castrol India Net Revenues by Value and Volume, 2007-2013
Figure 46: HPCL – Business Segmentation by Sales Volume, 2012-13
Figure 47: HPCL – Lubes and Greases Sales by Volume, 2008-09 to 2012-13 (Thousand Tonnes)
Figure 48: GOCL- Business Segmentation by Value, 2013-14
Figure 49: GOCL- Revenue from Lubricants Business Division, 2008-09 to 2013-14
(US$ Million)
Figure 50: IOCL- Domestic Production Volume of Business Segments, 2008-09 to 2012-13 (Million Tonnes)
List of Charts
Table 1: Upcoming Group II and III Capacity Additions in 2014
Table 2: Lube Usage across Vehicles in Urban and Semi Urban Areas, 2013
Table 3: Distribution Channels by Type of Vehicles
Table 4: Margin Profile of Synthetic Lubricants
Table 5: Emission Standard Implementation in India
Table 6: Growth Rate of GDP at Factor Cost (at 2004-2005) Prices by Sector in %
Table 7: Monthly Growth Rates of Index of Industrial Production- Broad Sectors (Base: 2004-2005=100) (Year-on-
year %)
Table 8: Growth Rate of Core Industries in % - (2008-09 to 2013-14)
Table 9: Performance of Manufacturing Sector by Categories March 2014 (in %)
List of Tables
View Report Details

Daedal ResearchDaedal Research is a research and consulting firm specialized in providing research reports and customized business research and analysis. The research firm offers a blend of the best strategic consulting and market research solutions, which promise data rich, cost effective, and highly insightful analysis to help its clients with perfect answers to their important business queries.
For more details please contact Mr. Rajeev Kumar:
Tel: +91-120-4553017 (9.30 am - 6.30 pm) ISTMobile: +91-8743975789 (24 X7)Enquiries: [email protected]
Title: Indian Automotive and Industrial Lubricants Market: Trends & Opportunities (2014-19)
Published: June 2014Pages: 82Price: US$ 800 (Single-User License) : US$ 1600 (Corporate License)
For placing an order of the Report, please press the following link:http://www.daedal-research.com/indian-automotive-and-industrial-lubricants-market-trends-opportunities-2014-19