Embed Size (px)
Citation preview
IOSR Journal of Business and Management (IOSR-JBM)
e-ISSN: 2278-487X, p-ISSN: 2319-7668. Volume 12, Issue 5 (Jul. - Aug. 2013), PP 86-99 www.iosrjournals.org
www.iosrjournals.org 86 | Page
“Identifying Key Engagement Drivers and level of Employee
Engagement at Technology Outsourcing firm @ Hyderabad,
India ”
Dr. D. N. Venkatesh Faculty – OB & HR Area Institute of Management Technology, Hyderabad Survey No. 38, Cherlaguda Village
Shamshabad Mandal, RR DistrictHyderabad- 501218
Abstract: An employee is said to be engaged when that employee uses discretionary effort. This means the
employee works that extra mile without being asked. The engaged employee leads to better customer service, which
leads to better customer satisfaction, which leads to increase in Revenue. This shows that to win the customer, we
need to win the employee first. The key challenge lies in linking employee morale and bottom line, which means
organizations not only have to retain employees but also engage them.
The study attempts to identify the Engagement drivers in a Technology Outsourcing firm at Hyderabad. The
objective of the research is to identify key factors that contribute to Employee Engagement and analyze the level of Employee Engagement.
The Secondary Research was carried out by studying several research papers. A Questionnaire was
designed with 25 Questions based on a revised model. A pilot study was conducted and findings were analyzed. The
trends of the responses have been plotted and five factors that contribute to employee engagement have been
derived. The categories of disagreement among the employees have been noted and recommendations have been
made.
Key Words: Engagement, Engagement Drivers, Discretionary Effort, Employee Motivation
I. Introduction To Employee Engagement The envisioned future defines the futurity of your vision and consequent action. In this context, an oriental
saying is as follows:
Where the vision is one year, cultivate flowers.
Where the vision is ten years, cultivate trees.
Where the vision is eternity, cultivate people.
An Employee is hired to deliver specific duties which are packaged into a job and contributes expertise to
an endeavor of an employer. Employers, in order to achieve a profitable and enduring relationship with an employee,
they need to balance the interests of the employee with his or her productivity. All employees are individual human
beings and they have their needs, aspirations, drives and capabilities at varying degrees of intensity. Most of these
remain unexpressed and the employer is left with no other option but to understand these needs, aspirations,
capabilities and develop a system that creates an environment which is beneficial to all the stakeholders. Employees add value and form an integral part of the business .Their personal values drive decisions and
these decisions ultimately drive the results. Taking time to understand and cultivate these personal values or the
people is crucial for a productive workplace, happy customers and perpetual business. Employee Engagement
initiatives at an organization help in understanding and cultivating these values of people and which further aim at
enhancing their loyalty . Employee engagement is the highest form of dedication where the employee is looking
forward to contribute whatever he or she can for the benefit of the organization. In engagement, employees are
involved in every aspect of their role performance. They would be committed to the strategic objectives, vision,
mission and values of the company.
II. Literature Review Employee engagement essentially is a combination of two well-known concepts – Organizational
commitment and Job involvement.
Organizational Commitment:
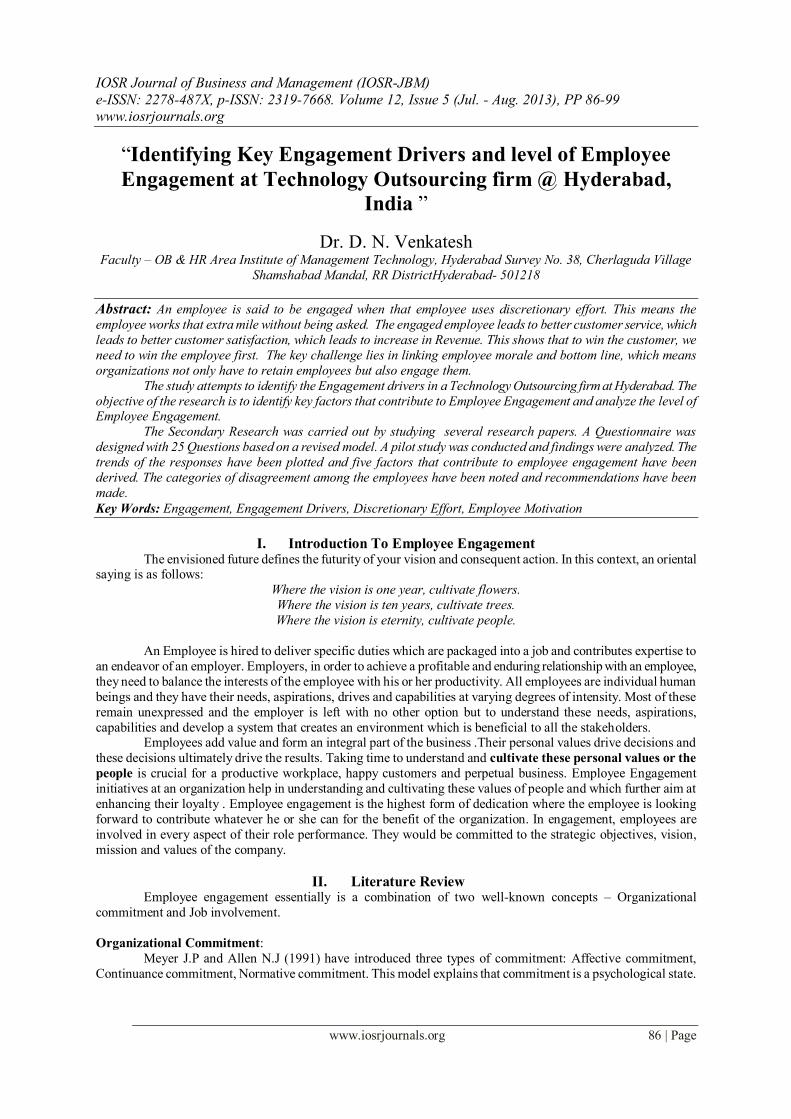
Meyer J.P and Allen N.J (1991) have introduced three types of commitment: Affective commitment,
Continuance commitment, Normative commitment. This model explains that commitment is a psychological state.
“Identifying Key Engagement Drivers and level of Employee Engagement at Technology Outsourcing
www.iosrjournals.org 87 | Page
Affective component: Affection to the work one does and to the organization comes from a strong
emotional attachment. One would identify closely with the organization, with the values, vision, mission of the
organization and would want to be part of it. The more involvement in the work, the happy experiences at work
would increase the job satisfaction, which in turn would add to the affective component.
Continuance commitment: The continuance commitment comes into picture when one weighs the pros and cons of
the current job. One would want to stay in the current job because he or she might assess it to be beneficial in staying
there, rather than moving into another role anywhere else. These perceived benefits or losses can be categorized into
Role Related, Monetary or Social.
Normative commitment: When factors such as organizational investments or Socialization are observed, this type of commitment occurs. Normative commitment creates a sense of obligation. Employee might feel obliged to the
company as the company has invested its time and money on the employee or the employee‟s culture has taught him
or her to be loyal to the company.
Job Involvement:
Paullay, Alliger and Stone- Romero (1994) defined the job involvement as “The degree to which one is
cognitively preoccupied with, engaged in, and concerned with one’s present job”. Lodahl and Kejner (1965)
elaborated that “Job Involvement is the engagement regarding the internalization of values about the righteousness
of work or significance of the work in the value of an individual”.
Job involvement is the key to employee motivation. It is about how people see their job, how enthusiastic
they are about their work and how they maintain the work life balance. It contributes to organizational effectiveness and employee morale by engaging them and by providing an enriching experience.
Reitz and Jewell (1979) state that “Job involvement is linked to the importance of work in individual’s
routine or daily life.” This means that if the employee is treating work as a significant aspect in his or her daily life
then he would be loyal to the work as well as the organization and would then enhance their performance
accordingly.
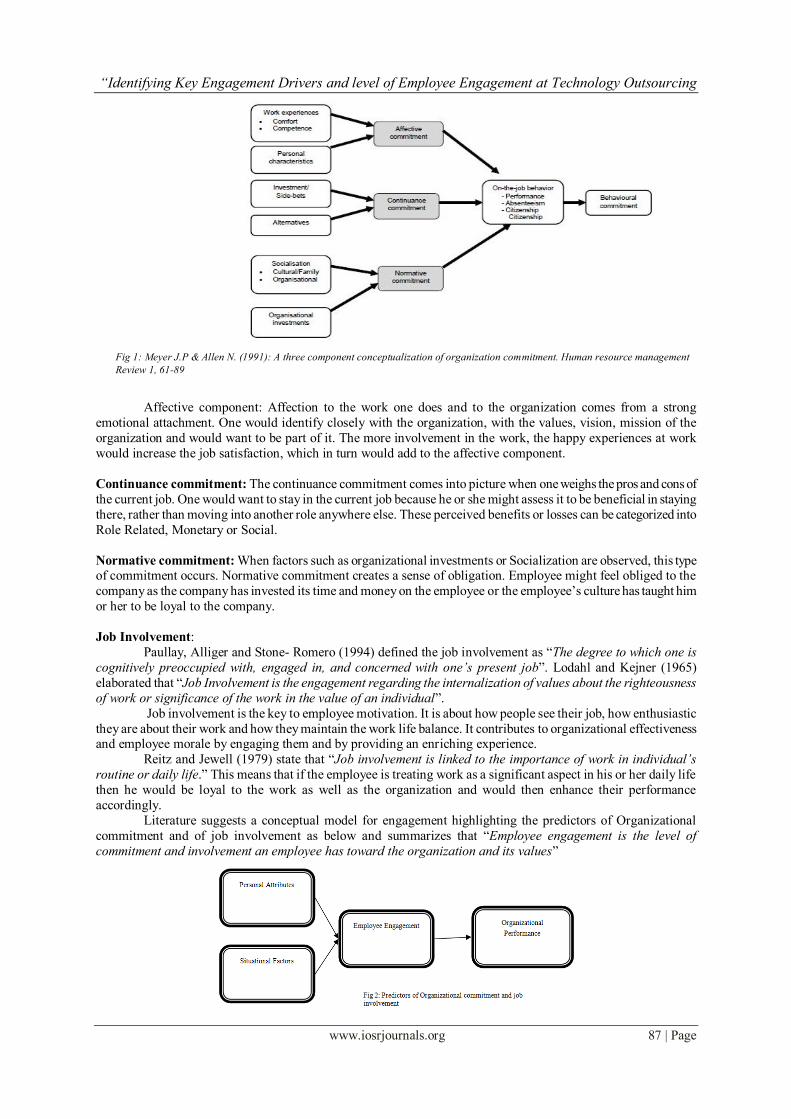
Literature suggests a conceptual model for engagement highlighting the predictors of Organizational
commitment and of job involvement as below and summarizes that “Employee engagement is the level of
commitment and involvement an employee has toward the organization and its values”
Fig 1: Meyer J.P & Allen N. (1991): A three component conceptualization of organization commitment. Human resource management
Review 1, 61-89
“Identifying Key Engagement Drivers and level of Employee Engagement at Technology Outsourcing
www.iosrjournals.org 88 | Page
According to Kahn (1990), Engagement at work is stated as “harnessing of organizational members’
selves to their work roles; in engagement, people employ and express themselves physically, cognitively and
emotionally during role performance.” In summary , his view states a psychological presence at work where in
employees involve and express themselves physically , cognitively and emotionally during their performance at
work.
Maslach et al (2001) proposed six determinable areas in the work-life dichotomy: Work load, Control,
Rewards and recognition, Community and Social support, Perceived fairness and values. Maslach then established a relation between job engagement and the six areas that “Engagement is facilitated by, a sustainable workload which
challenges the individual without negatively impacting them mentally and/or physically. Feelings of choice and
control, suitable reward and recognition, the presence of a supportive work community, fairness and integrity and
meaningful and appreciated work will foster personal engagement.”
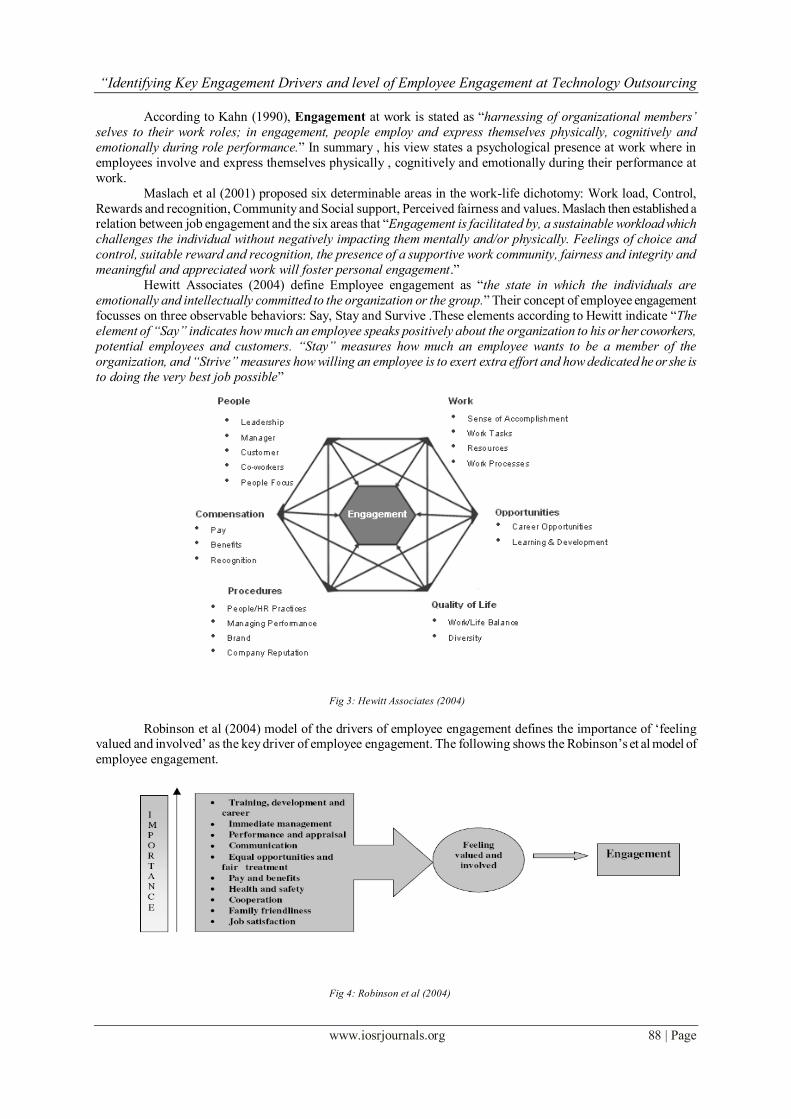
Hewitt Associates (2004) define Employee engagement as “the state in which the individuals are
emotionally and intellectually committed to the organization or the group.” Their concept of employee engagement
focusses on three observable behaviors: Say, Stay and Survive .These elements according to Hewitt indicate “The
element of “Say” indicates how much an employee speaks positively about the organization to his or her coworkers,
potential employees and customers. “Stay” measures how much an employee wants to be a member of the
organization, and “Strive” measures how willing an employee is to exert extra effort and how dedicated he or she is
to doing the very best job possible”
Robinson et al (2004) model of the drivers of employee engagement defines the importance of „feeling valued and involved‟ as the key driver of employee engagement. The following shows the Robinson‟s et al model of
employee engagement.
Fig 3: Hewitt Associates (2004)
Fig 4: Robinson et al (2004)
“Identifying Key Engagement Drivers and level of Employee Engagement at Technology Outsourcing
www.iosrjournals.org 89 | Page
Robinson et al defined employee engagement as “a two way relationship between employer and employee”.
The model shows job satisfaction , family friendliness , cooperation , health and safety , pay and benefits , equal
opportunities and fair treatment ,Communication, Performance and appraisal, Immediate management and Training ,
development and career as the employee engagement drivers that make the employee feel that he or she is valued
and involved which enhances the level of engagement.
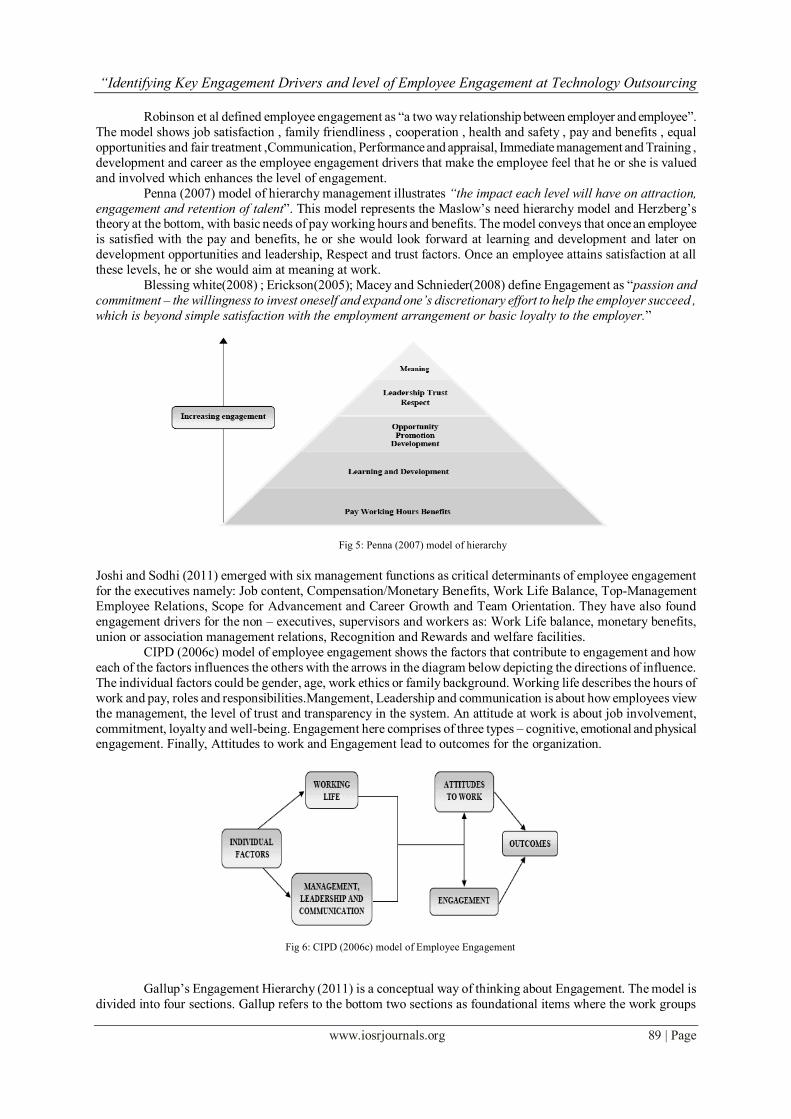
Penna (2007) model of hierarchy management illustrates “the impact each level will have on attraction,
engagement and retention of talent”. This model represents the Maslow‟s need hierarchy model and Herzberg‟s theory at the bottom, with basic needs of pay working hours and benefits. The model conveys that once an employee
is satisfied with the pay and benefits, he or she would look forward at learning and development and later on
development opportunities and leadership, Respect and trust factors. Once an employee attains satisfaction at all
these levels, he or she would aim at meaning at work.
Blessing white(2008) ; Erickson(2005); Macey and Schnieder(2008) define Engagement as “passion and
commitment – the willingness to invest oneself and expand one’s discretionary effort to help the employer succeed ,
which is beyond simple satisfaction with the employment arrangement or basic loyalty to the employer.”
Joshi and Sodhi (2011) emerged with six management functions as critical determinants of employee engagement
for the executives namely: Job content, Compensation/Monetary Benefits, Work Life Balance, Top-Management
Employee Relations, Scope for Advancement and Career Growth and Team Orientation. They have also found
engagement drivers for the non – executives, supervisors and workers as: Work Life balance, monetary benefits,
union or association management relations, Recognition and Rewards and welfare facilities.
CIPD (2006c) model of employee engagement shows the factors that contribute to engagement and how
each of the factors influences the others with the arrows in the diagram below depicting the directions of influence.
The individual factors could be gender, age, work ethics or family background. Working life describes the hours of
work and pay, roles and responsibilities.Mangement, Leadership and communication is about how employees view
the management, the level of trust and transparency in the system. An attitude at work is about job involvement,
commitment, loyalty and well-being. Engagement here comprises of three types – cognitive, emotional and physical engagement. Finally, Attitudes to work and Engagement lead to outcomes for the organization.
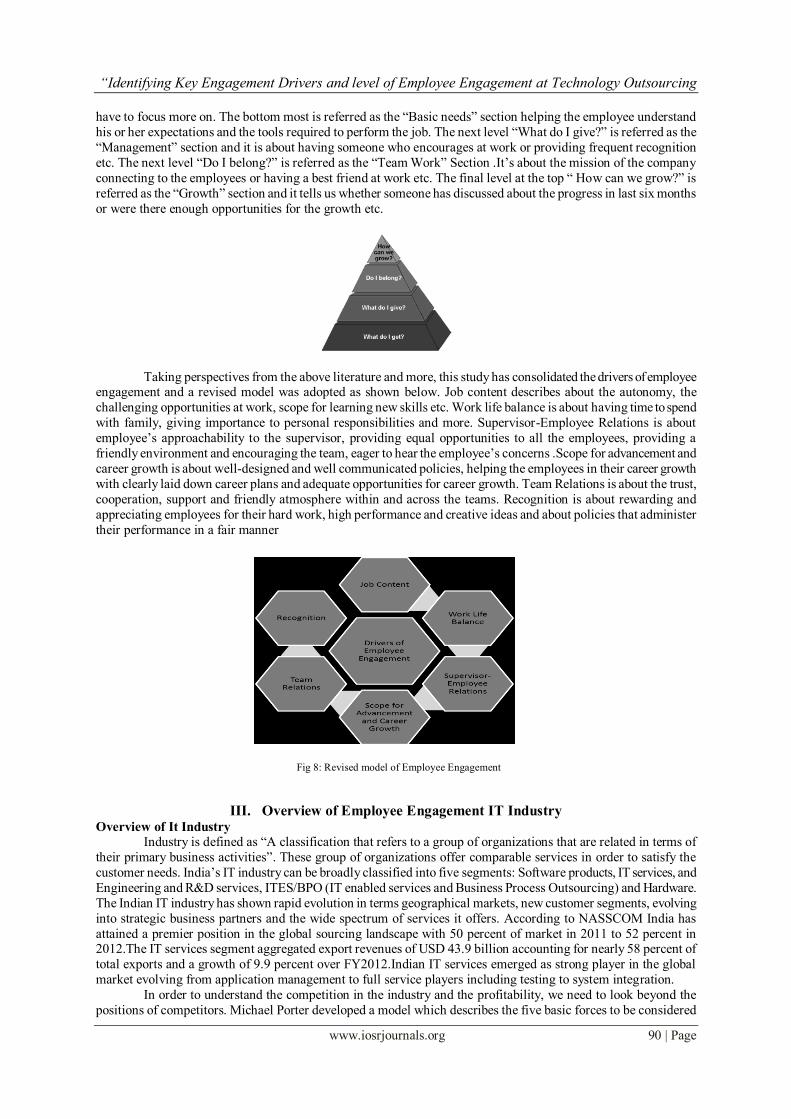
Gallup‟s Engagement Hierarchy (2011) is a conceptual way of thinking about Engagement. The model is
divided into four sections. Gallup refers to the bottom two sections as foundational items where the work groups
Fig 5: Penna (2007) model of hierarchy
Fig 6: CIPD (2006c) model of Employee Engagement
“Identifying Key Engagement Drivers and level of Employee Engagement at Technology Outsourcing
www.iosrjournals.org 90 | Page
have to focus more on. The bottom most is referred as the “Basic needs” section helping the employee understand
his or her expectations and the tools required to perform the job. The next level “What do I give?” is referred as the
“Management” section and it is about having someone who encourages at work or providing frequent recognition
etc. The next level “Do I belong?” is referred as the “Team Work” Section .It‟s about the mission of the company
connecting to the employees or having a best friend at work etc. The final level at the top “ How can we grow?” is
referred as the “Growth” section and it tells us whether someone has discussed about the progress in last six months
or were there enough opportunities for the growth etc.
Taking perspectives from the above literature and more, this study has consolidated the drivers of employee engagement and a revised model was adopted as shown below. Job content describes about the autonomy, the
challenging opportunities at work, scope for learning new skills etc. Work life balance is about having time to spend
with family, giving importance to personal responsibilities and more. Supervisor-Employee Relations is about
employee‟s approachability to the supervisor, providing equal opportunities to all the employees, providing a
friendly environment and encouraging the team, eager to hear the employee‟s concerns .Scope for advancement and
career growth is about well-designed and well communicated policies, helping the employees in their career growth
with clearly laid down career plans and adequate opportunities for career growth. Team Relations is about the trust,
cooperation, support and friendly atmosphere within and across the teams. Recognition is about rewarding and
appreciating employees for their hard work, high performance and creative ideas and about policies that administer
their performance in a fair manner
III. Overview of Employee Engagement IT Industry Overview of It Industry
Industry is defined as “A classification that refers to a group of organizations that are related in terms of
their primary business activities”. These group of organizations offer comparable services in order to satisfy the
customer needs. India‟s IT industry can be broadly classified into five segments: Software products, IT services, and
Engineering and R&D services, ITES/BPO (IT enabled services and Business Process Outsourcing) and Hardware.
The Indian IT industry has shown rapid evolution in terms geographical markets, new customer segments, evolving
into strategic business partners and the wide spectrum of services it offers. According to NASSCOM India has
attained a premier position in the global sourcing landscape with 50 percent of market in 2011 to 52 percent in 2012.The IT services segment aggregated export revenues of USD 43.9 billion accounting for nearly 58 percent of
total exports and a growth of 9.9 percent over FY2012.Indian IT services emerged as strong player in the global
market evolving from application management to full service players including testing to system integration.
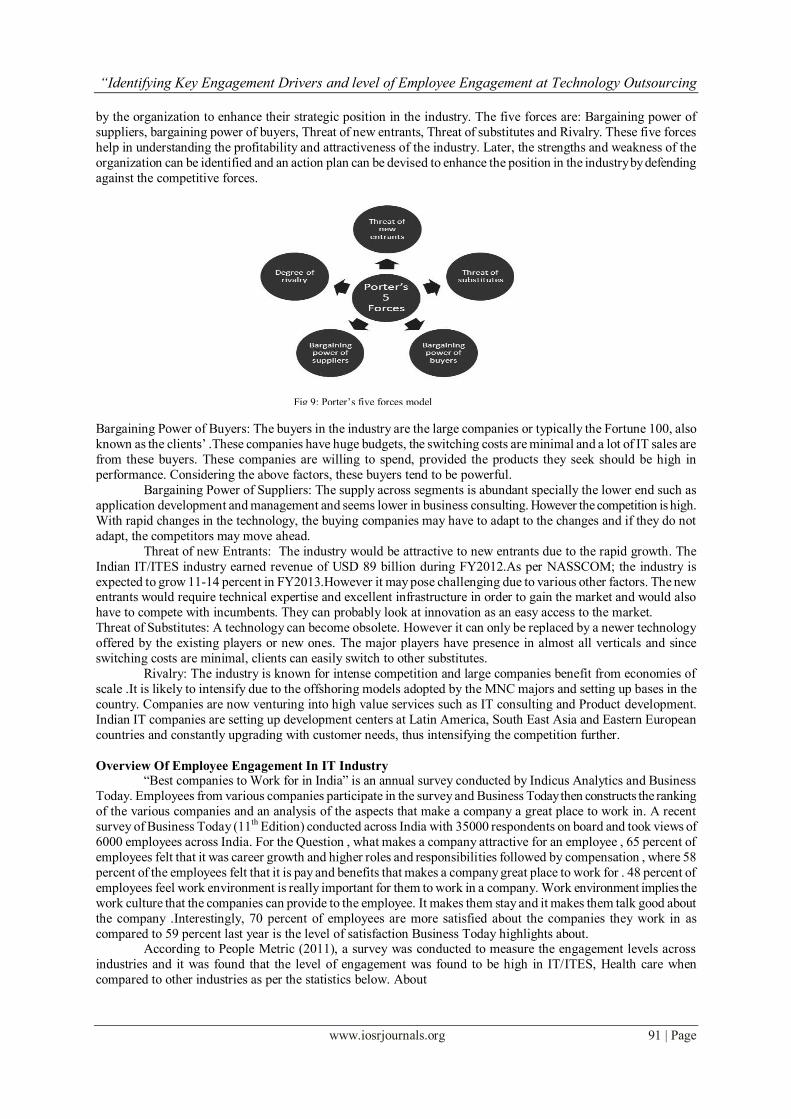
In order to understand the competition in the industry and the profitability, we need to look beyond the
positions of competitors. Michael Porter developed a model which describes the five basic forces to be considered
Fig 8: Revised model of Employee Engagement
“Identifying Key Engagement Drivers and level of Employee Engagement at Technology Outsourcing
www.iosrjournals.org 91 | Page
by the organization to enhance their strategic position in the industry. The five forces are: Bargaining power of
suppliers, bargaining power of buyers, Threat of new entrants, Threat of substitutes and Rivalry. These five forces
help in understanding the profitability and attractiveness of the industry. Later, the strengths and weakness of the
organization can be identified and an action plan can be devised to enhance the position in the industry by defending
against the competitive forces.
Bargaining Power of Buyers: The buyers in the industry are the large companies or typically the Fortune 100, also
known as the clients‟ .These companies have huge budgets, the switching costs are minimal and a lot of IT sales are
from these buyers. These companies are willing to spend, provided the products they seek should be high in
performance. Considering the above factors, these buyers tend to be powerful.
Bargaining Power of Suppliers: The supply across segments is abundant specially the lower end such as
application development and management and seems lower in business consulting. However the competition is high.
With rapid changes in the technology, the buying companies may have to adapt to the changes and if they do not
adapt, the competitors may move ahead.
Threat of new Entrants: The industry would be attractive to new entrants due to the rapid growth. The
Indian IT/ITES industry earned revenue of USD 89 billion during FY2012.As per NASSCOM; the industry is
expected to grow 11-14 percent in FY2013.However it may pose challenging due to various other factors. The new entrants would require technical expertise and excellent infrastructure in order to gain the market and would also
have to compete with incumbents. They can probably look at innovation as an easy access to the market.
Threat of Substitutes: A technology can become obsolete. However it can only be replaced by a newer technology
offered by the existing players or new ones. The major players have presence in almost all verticals and since
switching costs are minimal, clients can easily switch to other substitutes.
Rivalry: The industry is known for intense competition and large companies benefit from economies of
scale .It is likely to intensify due to the offshoring models adopted by the MNC majors and setting up bases in the
country. Companies are now venturing into high value services such as IT consulting and Product development.
Indian IT companies are setting up development centers at Latin America, South East Asia and Eastern European
countries and constantly upgrading with customer needs, thus intensifying the competition further.
Overview Of Employee Engagement In IT Industry “Best companies to Work for in India” is an annual survey conducted by Indicus Analytics and Business
Today. Employees from various companies participate in the survey and Business Today then constructs the ranking
of the various companies and an analysis of the aspects that make a company a great place to work in. A recent
survey of Business Today (11th Edition) conducted across India with 35000 respondents on board and took views of
6000 employees across India. For the Question , what makes a company attractive for an employee , 65 percent of
employees felt that it was career growth and higher roles and responsibilities followed by compensation , where 58
percent of the employees felt that it is pay and benefits that makes a company great place to work for . 48 percent of
employees feel work environment is really important for them to work in a company. Work environment implies the
work culture that the companies can provide to the employee. It makes them stay and it makes them talk good about
the company .Interestingly, 70 percent of employees are more satisfied about the companies they work in as
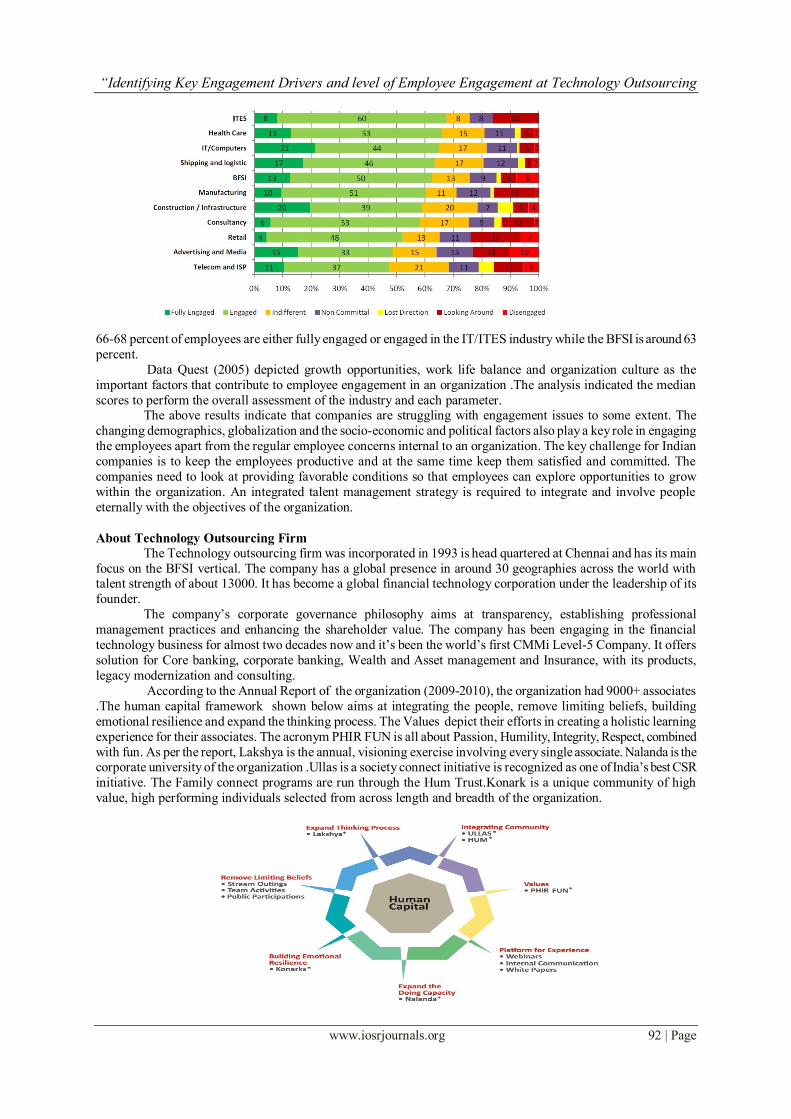
compared to 59 percent last year is the level of satisfaction Business Today highlights about. According to People Metric (2011), a survey was conducted to measure the engagement levels across
industries and it was found that the level of engagement was found to be high in IT/ITES, Health care when
compared to other industries as per the statistics below. About
Fig 9: Porter‟s five forces model
“Identifying Key Engagement Drivers and level of Employee Engagement at Technology Outsourcing
www.iosrjournals.org 92 | Page
66-68 percent of employees are either fully engaged or engaged in the IT/ITES industry while the BFSI is around 63
percent.
Data Quest (2005) depicted growth opportunities, work life balance and organization culture as the
important factors that contribute to employee engagement in an organization .The analysis indicated the median
scores to perform the overall assessment of the industry and each parameter. The above results indicate that companies are struggling with engagement issues to some extent. The
changing demographics, globalization and the socio-economic and political factors also play a key role in engaging
the employees apart from the regular employee concerns internal to an organization. The key challenge for Indian
companies is to keep the employees productive and at the same time keep them satisfied and committed. The
companies need to look at providing favorable conditions so that employees can explore opportunities to grow
within the organization. An integrated talent management strategy is required to integrate and involve people
eternally with the objectives of the organization.
About Technology Outsourcing Firm
The Technology outsourcing firm was incorporated in 1993 is head quartered at Chennai and has its main
focus on the BFSI vertical. The company has a global presence in around 30 geographies across the world with talent strength of about 13000. It has become a global financial technology corporation under the leadership of its
founder.
The company‟s corporate governance philosophy aims at transparency, establishing professional
management practices and enhancing the shareholder value. The company has been engaging in the financial
technology business for almost two decades now and it‟s been the world‟s first CMMi Level-5 Company. It offers
solution for Core banking, corporate banking, Wealth and Asset management and Insurance, with its products,
legacy modernization and consulting.
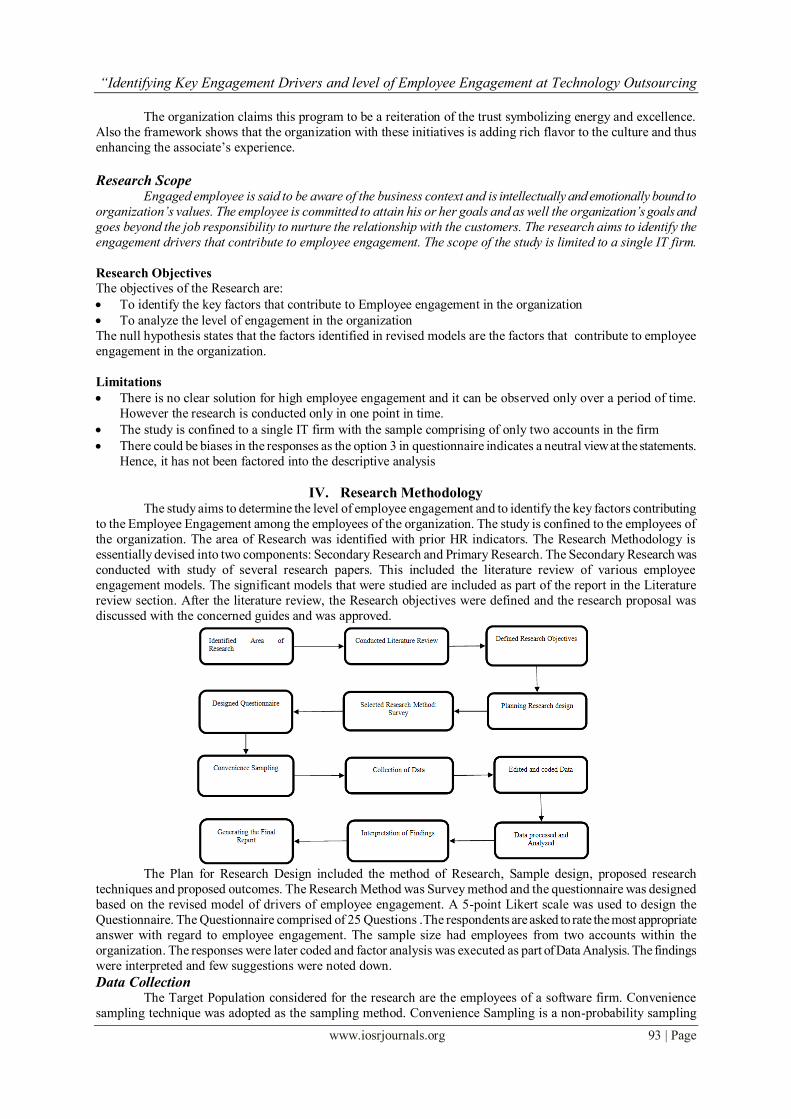
According to the Annual Report of the organization (2009-2010), the organization had 9000+ associates
.The human capital framework shown below aims at integrating the people, remove limiting beliefs, building
emotional resilience and expand the thinking process. The Values depict their efforts in creating a holistic learning
experience for their associates. The acronym PHIR FUN is all about Passion, Humility, Integrity, Respect, combined
with fun. As per the report, Lakshya is the annual, visioning exercise involving every single associate. Nalanda is the corporate university of the organization .Ullas is a society connect initiative is recognized as one of India‟s best CSR
initiative. The Family connect programs are run through the Hum Trust.Konark is a unique community of high
value, high performing individuals selected from across length and breadth of the organization.
“Identifying Key Engagement Drivers and level of Employee Engagement at Technology Outsourcing
www.iosrjournals.org 93 | Page
The organization claims this program to be a reiteration of the trust symbolizing energy and excellence.
Also the framework shows that the organization with these initiatives is adding rich flavor to the culture and thus
enhancing the associate‟s experience.
Research Scope Engaged employee is said to be aware of the business context and is intellectually and emotionally bound to
organization’s values. The employee is committed to attain his or her goals and as well the organization’s goals and
goes beyond the job responsibility to nurture the relationship with the customers. The research aims to identify the
engagement drivers that contribute to employee engagement. The scope of the study is limited to a single IT firm.
Research Objectives
The objectives of the Research are:
To identify the key factors that contribute to Employee engagement in the organization
To analyze the level of engagement in the organization
The null hypothesis states that the factors identified in revised models are the factors that contribute to employee
engagement in the organization.
Limitations
There is no clear solution for high employee engagement and it can be observed only over a period of time.
However the research is conducted only in one point in time.
The study is confined to a single IT firm with the sample comprising of only two accounts in the firm
There could be biases in the responses as the option 3 in questionnaire indicates a neutral view at the statements.
Hence, it has not been factored into the descriptive analysis
IV. Research Methodology The study aims to determine the level of employee engagement and to identify the key factors contributing
to the Employee Engagement among the employees of the organization. The study is confined to the employees of
the organization. The area of Research was identified with prior HR indicators. The Research Methodology is
essentially devised into two components: Secondary Research and Primary Research. The Secondary Research was
conducted with study of several research papers. This included the literature review of various employee
engagement models. The significant models that were studied are included as part of the report in the Literature
review section. After the literature review, the Research objectives were defined and the research proposal was
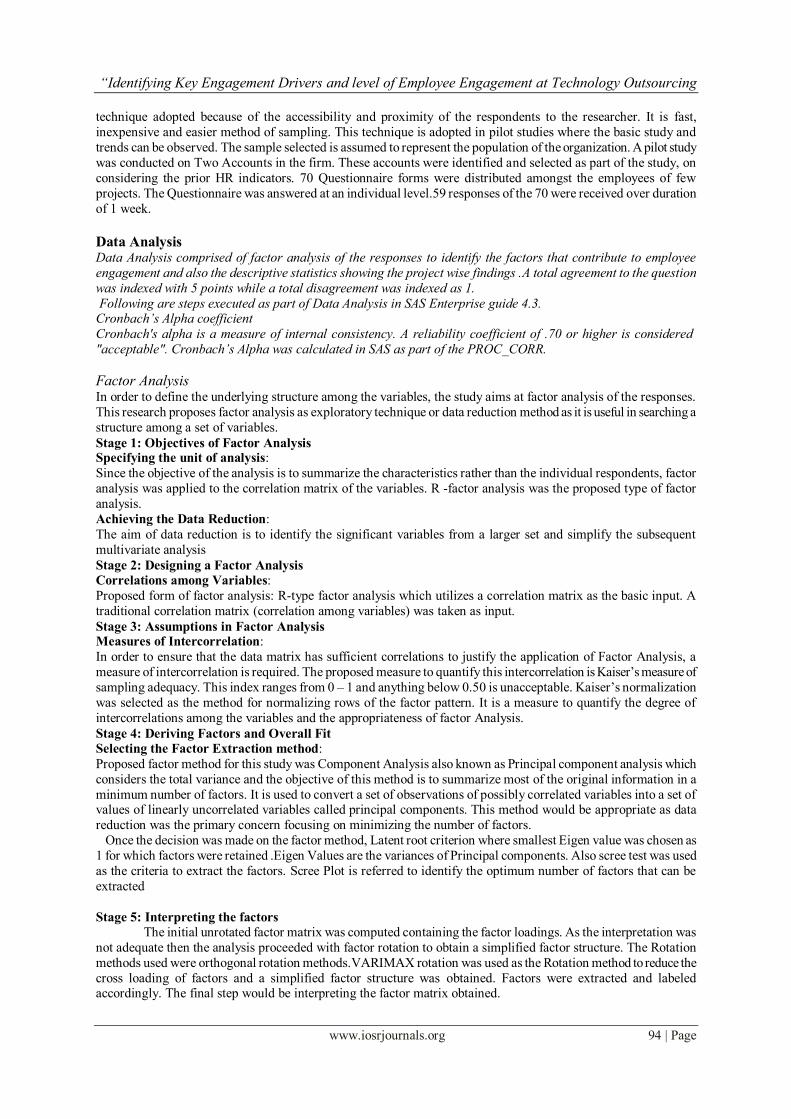
discussed with the concerned guides and was approved.
The Plan for Research Design included the method of Research, Sample design, proposed research
techniques and proposed outcomes. The Research Method was Survey method and the questionnaire was designed
based on the revised model of drivers of employee engagement. A 5-point Likert scale was used to design the
Questionnaire. The Questionnaire comprised of 25 Questions .The respondents are asked to rate the most appropriate
answer with regard to employee engagement. The sample size had employees from two accounts within the
organization. The responses were later coded and factor analysis was executed as part of Data Analysis. The findings
were interpreted and few suggestions were noted down.
Data Collection The Target Population considered for the research are the employees of a software firm. Convenience
sampling technique was adopted as the sampling method. Convenience Sampling is a non-probability sampling
“Identifying Key Engagement Drivers and level of Employee Engagement at Technology Outsourcing
www.iosrjournals.org 94 | Page
technique adopted because of the accessibility and proximity of the respondents to the researcher. It is fast,
inexpensive and easier method of sampling. This technique is adopted in pilot studies where the basic study and
trends can be observed. The sample selected is assumed to represent the population of the organization. A pilot study
was conducted on Two Accounts in the firm. These accounts were identified and selected as part of the study, on
considering the prior HR indicators. 70 Questionnaire forms were distributed amongst the employees of few
projects. The Questionnaire was answered at an individual level.59 responses of the 70 were received over duration
of 1 week.
Data Analysis Data Analysis comprised of factor analysis of the responses to identify the factors that contribute to employee
engagement and also the descriptive statistics showing the project wise findings .A total agreement to the question
was indexed with 5 points while a total disagreement was indexed as 1.
Following are steps executed as part of Data Analysis in SAS Enterprise guide 4.3. Cronbach’s Alpha coefficient
Cronbach's alpha is a measure of internal consistency. A reliability coefficient of .70 or higher is considered
"acceptable". Cronbach’s Alpha was calculated in SAS as part of the PROC_CORR.
Factor Analysis In order to define the underlying structure among the variables, the study aims at factor analysis of the responses.
This research proposes factor analysis as exploratory technique or data reduction method as it is useful in searching a
structure among a set of variables.
Stage 1: Objectives of Factor Analysis Specifying the unit of analysis:
Since the objective of the analysis is to summarize the characteristics rather than the individual respondents, factor
analysis was applied to the correlation matrix of the variables. R -factor analysis was the proposed type of factor
analysis.
Achieving the Data Reduction:
The aim of data reduction is to identify the significant variables from a larger set and simplify the subsequent
multivariate analysis
Stage 2: Designing a Factor Analysis
Correlations among Variables:
Proposed form of factor analysis: R-type factor analysis which utilizes a correlation matrix as the basic input. A
traditional correlation matrix (correlation among variables) was taken as input.
Stage 3: Assumptions in Factor Analysis Measures of Intercorrelation:
In order to ensure that the data matrix has sufficient correlations to justify the application of Factor Analysis, a
measure of intercorrelation is required. The proposed measure to quantify this intercorrelation is Kaiser‟s measure of
sampling adequacy. This index ranges from 0 – 1 and anything below 0.50 is unacceptable. Kaiser‟s normalization
was selected as the method for normalizing rows of the factor pattern. It is a measure to quantify the degree of
intercorrelations among the variables and the appropriateness of factor Analysis.
Stage 4: Deriving Factors and Overall Fit
Selecting the Factor Extraction method:
Proposed factor method for this study was Component Analysis also known as Principal component analysis which
considers the total variance and the objective of this method is to summarize most of the original information in a
minimum number of factors. It is used to convert a set of observations of possibly correlated variables into a set of values of linearly uncorrelated variables called principal components. This method would be appropriate as data
reduction was the primary concern focusing on minimizing the number of factors.
Once the decision was made on the factor method, Latent root criterion where smallest Eigen value was chosen as
1 for which factors were retained .Eigen Values are the variances of Principal components. Also scree test was used
as the criteria to extract the factors. Scree Plot is referred to identify the optimum number of factors that can be
extracted
Stage 5: Interpreting the factors
The initial unrotated factor matrix was computed containing the factor loadings. As the interpretation was
not adequate then the analysis proceeded with factor rotation to obtain a simplified factor structure. The Rotation
methods used were orthogonal rotation methods.VARIMAX rotation was used as the Rotation method to reduce the
cross loading of factors and a simplified factor structure was obtained. Factors were extracted and labeled accordingly. The final step would be interpreting the factor matrix obtained.
“Identifying Key Engagement Drivers and level of Employee Engagement at Technology Outsourcing
www.iosrjournals.org 95 | Page
FINDINGS AND RECOMMENDATIONS FINDINGS
The average work experience of the sample is 3.07 years. Five Iterations were run as part of Factor Analysis.The
sample consists of 62 percent of employees as graduates and rest being post-graduates.
FACTOR ANALYSIS
ITERATION 1
Factor Analysis was run for all the 25 variables and the KMO values for variables X7 and X20 were below 0.5
which was unacceptable.
ITERATION 2
X7 was removed and factor analysis was executed again. X20 still had KMO less than 0.5.
ITERATION 3
X20 was removed and Factor analysis was executed again. KMO values were in acceptable range. However the
communality value for X16 was below 0.5 which was unacceptable. The communality value, describes the
proportion of each variable's variance that can be explained by the components.
ITERATION 4 X16 was removed and Factor analysis was executed again. KMO and Communality values were in place. However
some of the variables were cross loading.
ITERATION 5
The variables which were cross loading (X2,X3,X4,X11) were removed and data was analyzed further.X6 and X8
were included as they were found to be important as part of research. The Factors with Eigen values - 1 and above
were retained as factors, contributing a total variance of 69.13 %
Summary of Factors
The five factors are:
F1: Opportunities at Work and Team Relations
F2: Goal Clarity and Work Commitment
F3: Freedom in Decision Making
F4: Organization Policies and Work Life Balance
F5: Supervisor- Employee Relations and Employee Welfare
The following shows factors in detail:
F1: {X6, X8, X14, X21, X22, X23, X25}
F2: {X12, X15, X17, X18}
F3: {X1, X5, X13}
F4: {X9, X10}
F5: {X19, X24}
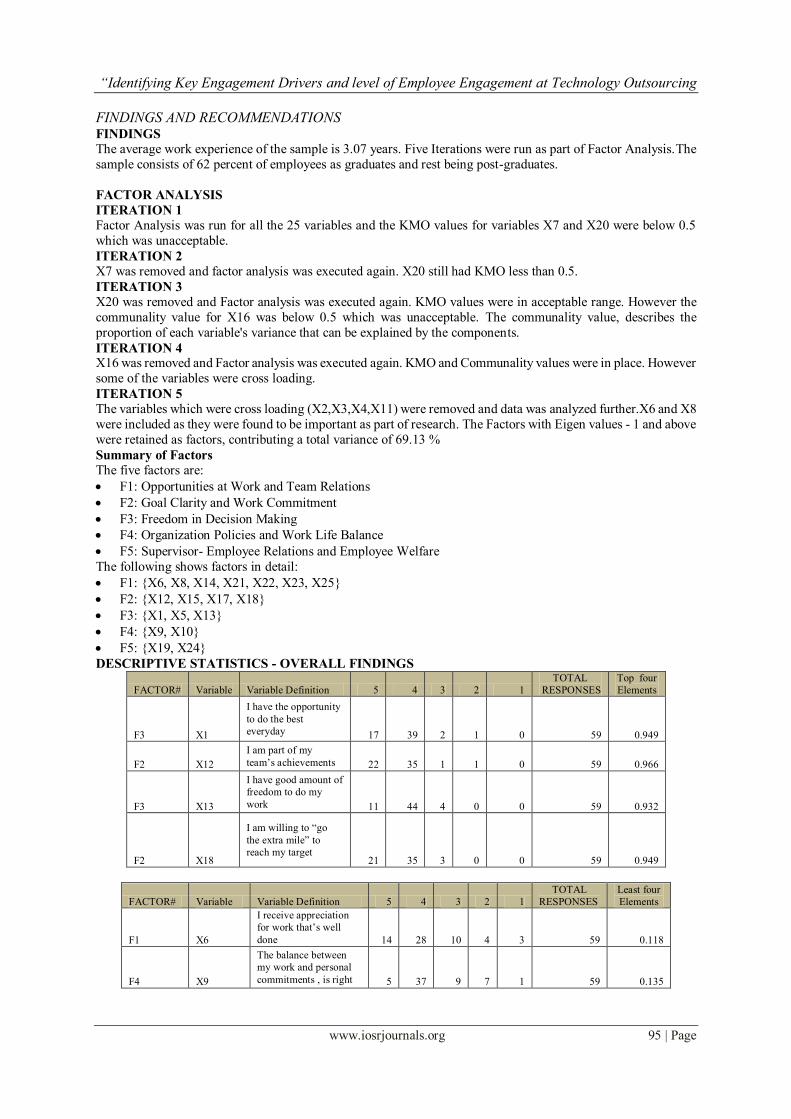
DESCRIPTIVE STATISTICS - OVERALL FINDINGS
FACTOR# Variable Variable Definition 5 4 3 2 1
TOTAL
RESPONSES
Top four
Elements
F3 X1
I have the opportunity
to do the best
everyday 17 39 2 1 0 59 0.949
F2 X12
I am part of my
team‟s achievements 22 35 1 1 0 59 0.966
F3 X13
I have good amount of
freedom to do my
work 11 44 4 0 0 59 0.932
F2 X18
I am willing to “go
the extra mile” to
reach my target 21 35 3 0 0 59 0.949
FACTOR# Variable Variable Definition 5 4 3 2 1
TOTAL
RESPONSES
Least four
Elements
F1 X6
I receive appreciation
for work that‟s well
done 14 28 10 4 3 59 0.118
F4 X9
The balance between
my work and personal
commitments , is right 5 37 9 7 1 59 0.135
“Identifying Key Engagement Drivers and level of Employee Engagement at Technology Outsourcing
www.iosrjournals.org 96 | Page
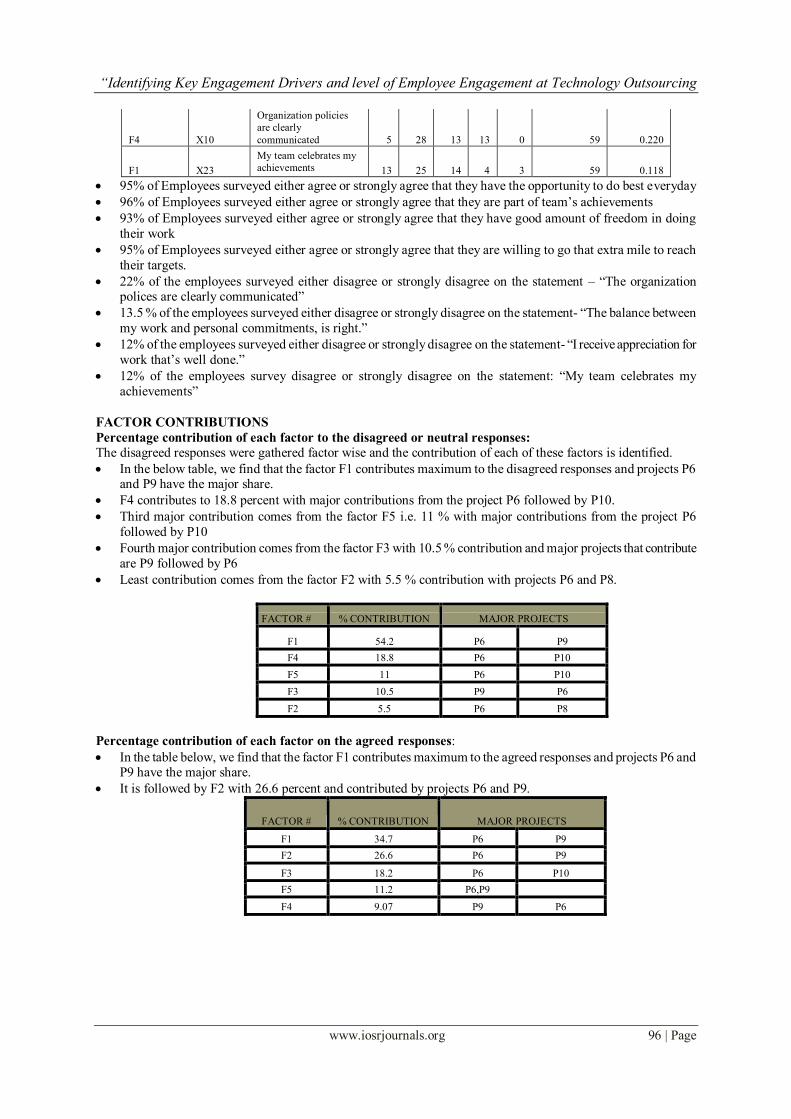
F4 X10
Organization policies
are clearly
communicated 5 28 13 13 0 59 0.220
F1 X23
My team celebrates my
achievements 13 25 14 4 3 59 0.118
95% of Employees surveyed either agree or strongly agree that they have the opportunity to do best everyday
96% of Employees surveyed either agree or strongly agree that they are part of team‟s achievements
93% of Employees surveyed either agree or strongly agree that they have good amount of freedom in doing
their work
95% of Employees surveyed either agree or strongly agree that they are willing to go that extra mile to reach
their targets.
22% of the employees surveyed either disagree or strongly disagree on the statement – “The organization polices are clearly communicated”
13.5 % of the employees surveyed either disagree or strongly disagree on the statement- “The balance between
my work and personal commitments, is right.”
12% of the employees surveyed either disagree or strongly disagree on the statement- “I receive appreciation for
work that‟s well done.”
12% of the employees survey disagree or strongly disagree on the statement: “My team celebrates my
achievements”
FACTOR CONTRIBUTIONS
Percentage contribution of each factor to the disagreed or neutral responses:
The disagreed responses were gathered factor wise and the contribution of each of these factors is identified.
In the below table, we find that the factor F1 contributes maximum to the disagreed responses and projects P6 and P9 have the major share.
F4 contributes to 18.8 percent with major contributions from the project P6 followed by P10.
Third major contribution comes from the factor F5 i.e. 11 % with major contributions from the project P6
followed by P10
Fourth major contribution comes from the factor F3 with 10.5 % contribution and major projects that contribute
are P9 followed by P6
Least contribution comes from the factor F2 with 5.5 % contribution with projects P6 and P8.
FACTOR # % CONTRIBUTION MAJOR PROJECTS
F1 54.2 P6 P9
F4 18.8 P6 P10
F5 11 P6 P10
F3 10.5 P9 P6
F2 5.5 P6 P8
Percentage contribution of each factor on the agreed responses:
In the table below, we find that the factor F1 contributes maximum to the agreed responses and projects P6 and P9 have the major share.
It is followed by F2 with 26.6 percent and contributed by projects P6 and P9.
FACTOR # % CONTRIBUTION MAJOR PROJECTS
F1 34.7 P6 P9
F2 26.6 P6 P9
F3 18.2 P6 P10
F5 11.2 P6,P9
F4 9.07 P9 P6
“Identifying Key Engagement Drivers and level of Employee Engagement at Technology Outsourcing
www.iosrjournals.org 97 | Page
PROJECT WISE FINDINGS
There are a total of 10 projects, of which the following are findings of Project P6:
36.8% of P6 employees either disagree or strongly disagree on the statement - “Organization policies are clearly
communicated.”
26.3% of P6 employees either disagree or strongly disagree on the statement – “The balance between my work
and personal commitments, is right.”
15.7 % of P6 employees either disagree or strongly disagree on the following statements:
o My future career opportunities here, look good
o My team celebrates my achievements
o I am encouraged to take part in fun activities
The following are findings of Project P9:
27.2% of P9 employees either strongly disagree or disagree on the following statements:
o I receive appreciation for work that‟s well done
o My supervisor cares about me
o My future career opportunities look good
o I have the opportunity to showcase my talent
The following are findings of Project P10:
22% of P10 employees either disagree or strongly disagree on the statement -“Organization policies are clearly communicated.”
11.11 % of P10 employees either disagree or strongly disagree on the statement-
“The balance between my work and personal commitments is right.”
ROLE BASED FINDINGS
The following are findings for the roles D1:
26.47% of surveyed state that the organization policies are not clearly communicated
23.52% of surveyed state that there is no work life balance
The following are findings for SD1 –SP1-T1:
21.42% state that the organization policies are not clearly communicated
14.2% indicate that they do not take initiative to interact with the supervisor on their concerns
WORK EXPERIENCE BASED FINDINGS
The following are findings for surveyed employees who have less than 2 years of work experience:
17.647% convey that the organization policies are not clearly communicated
The following are findings for surveyed employee with 2-4 years of work experience:
22.58% of employees feel:
o The organization policies are not clearly communicated
o There is no work life balance
16.29% convey that:
o They do not receive appreciation for the work that‟s well done
o Their future career opportunities are not good o Their team doesn‟t celebrate their achievements
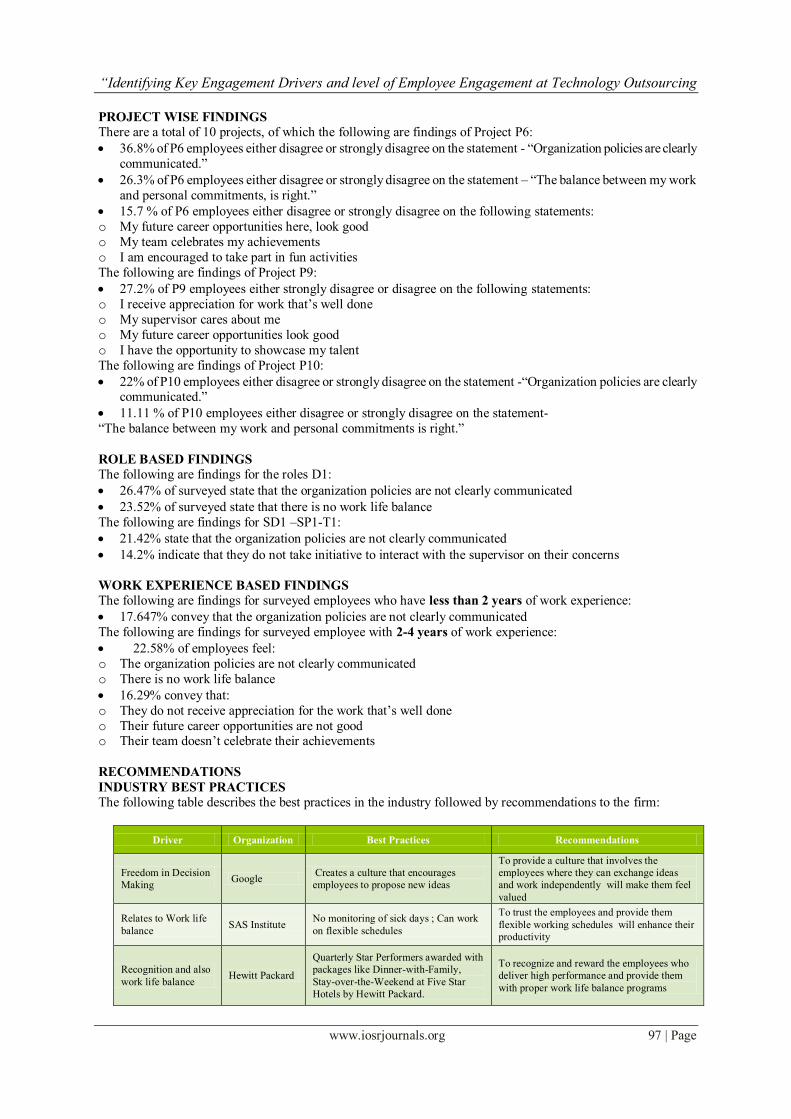
RECOMMENDATIONS
INDUSTRY BEST PRACTICES
The following table describes the best practices in the industry followed by recommendations to the firm:
Driver Organization Best Practices Recommendations
Freedom in Decision
Making Google
Creates a culture that encourages
employees to propose new ideas
To provide a culture that involves the
employees where they can exchange ideas
and work independently will make them feel
valued
Relates to Work life
balance SAS Institute
No monitoring of sick days ; Can work
on flexible schedules
To trust the employees and provide them
flexible working schedules will enhance their
productivity
Recognition and also
work life balance Hewitt Packard
Quarterly Star Performers awarded with
packages like Dinner-with-Family,
Stay-over-the-Weekend at Five Star
Hotels by Hewitt Packard.
To recognize and reward the employees who
deliver high performance and provide them
with proper work life balance programs
“Identifying Key Engagement Drivers and level of Employee Engagement at Technology Outsourcing
www.iosrjournals.org 98 | Page
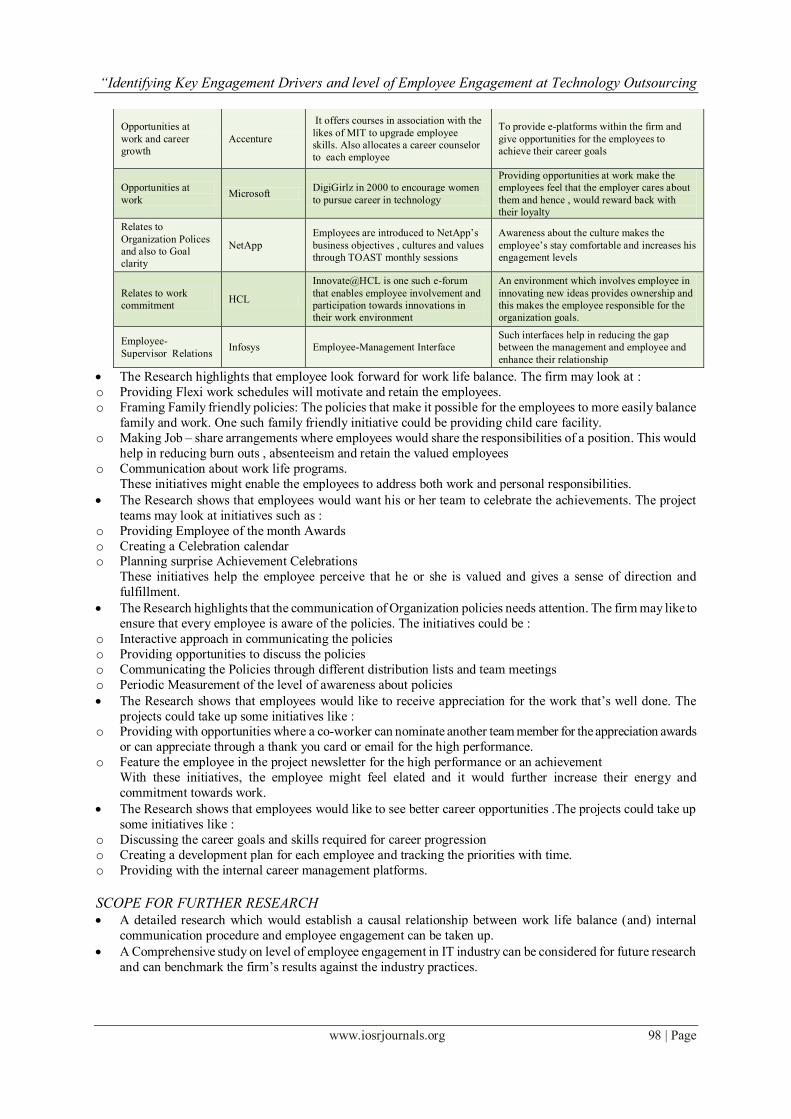
Opportunities at
work and career
growth
Accenture
It offers courses in association with the
likes of MIT to upgrade employee
skills. Also allocates a career counselor
to each employee
To provide e-platforms within the firm and
give opportunities for the employees to
achieve their career goals
Opportunities at
work Microsoft
DigiGirlz in 2000 to encourage women
to pursue career in technology
Providing opportunities at work make the
employees feel that the employer cares about
them and hence , would reward back with
their loyalty
Relates to
Organization Polices
and also to Goal
clarity
NetApp
Employees are introduced to NetApp‟s
business objectives , cultures and values
through TOAST monthly sessions
Awareness about the culture makes the
employee‟s stay comfortable and increases his
engagement levels
Relates to work
commitment HCL
Innovate@HCL is one such e-forum
that enables employee involvement and
participation towards innovations in
their work environment
An environment which involves employee in
innovating new ideas provides ownership and
this makes the employee responsible for the
organization goals.
Employee-
Supervisor Relations Infosys Employee-Management Interface
Such interfaces help in reducing the gap
between the management and employee and
enhance their relationship
The Research highlights that employee look forward for work life balance. The firm may look at :
o Providing Flexi work schedules will motivate and retain the employees.
o Framing Family friendly policies: The policies that make it possible for the employees to more easily balance
family and work. One such family friendly initiative could be providing child care facility.
o Making Job – share arrangements where employees would share the responsibilities of a position. This would
help in reducing burn outs , absenteeism and retain the valued employees
o Communication about work life programs.
These initiatives might enable the employees to address both work and personal responsibilities.
The Research shows that employees would want his or her team to celebrate the achievements. The project
teams may look at initiatives such as :
o Providing Employee of the month Awards
o Creating a Celebration calendar o Planning surprise Achievement Celebrations
These initiatives help the employee perceive that he or she is valued and gives a sense of direction and
fulfillment.
The Research highlights that the communication of Organization policies needs attention. The firm may like to
ensure that every employee is aware of the policies. The initiatives could be :
o Interactive approach in communicating the policies
o Providing opportunities to discuss the policies
o Communicating the Policies through different distribution lists and team meetings
o Periodic Measurement of the level of awareness about policies
The Research shows that employees would like to receive appreciation for the work that‟s well done. The
projects could take up some initiatives like : o Providing with opportunities where a co-worker can nominate another team member for the appreciation awards
or can appreciate through a thank you card or email for the high performance.
o Feature the employee in the project newsletter for the high performance or an achievement
With these initiatives, the employee might feel elated and it would further increase their energy and
commitment towards work.
The Research shows that employees would like to see better career opportunities .The projects could take up
some initiatives like :
o Discussing the career goals and skills required for career progression
o Creating a development plan for each employee and tracking the priorities with time.
o Providing with the internal career management platforms.
SCOPE FOR FURTHER RESEARCH A detailed research which would establish a causal relationship between work life balance (and) internal
communication procedure and employee engagement can be taken up.
A Comprehensive study on level of employee engagement in IT industry can be considered for future research
and can benchmark the firm‟s results against the industry practices.
“Identifying Key Engagement Drivers and level of Employee Engagement at Technology Outsourcing
www.iosrjournals.org 99 | Page
References [1]. Accord Management Systems(2004).Employee Engagement Strategy: A Strategy of Analysis to move from Employee Satisfaction to
Engagement.Retrieved on 5 April , 2013 from http://accordmanagementsystems.com/amsfiles/engagement_white_paper.pdf
[2]. Blessing White Research(2013). Employee Engagement Report. Retrieved on 8 April , 2013 from
http://www.blessingwhite.com/eee__report.asp
[3]. D Robbinson , S PerryMan , S Hayday(2004). The Drivers of Employee Engagement. Retrieved on 5 April,2013 from
http://www.wellbeing4business.co.uk/docs/Article%20-%20Engagement%20research.pdf
[4]. Gallup (2011).Driving Engagement everyday: 2011 Engagement Survey. Retrieved on 8 April , 2013 from
http://home.ncifcrf.gov/SAICFTraining/gallupresources/SAIC-Best-Practicies-Q12.pptx
[5]. Hair , Black , Babin , Anderson , Tatham(2011).Multivariate Data Analysis(6E); Pearson Publication
[6]. J. Anitha .Antecedents of Employee Engagement and Their Impact on Employee Performance. Retrieved on 25 April, 2013 from
http://www.grgsms.com/wps/wp1.pdf
[7]. Saradha and Dr. Harold Andrew Patrick (2011).Employee engagement in relation to OCB in IT organizations. Retrieved on 17 April,
2013 from http://web.ebscohost.com/ehost/pdfviewer/pdfviewer?sid=17d68823-294d-40f4-8ace-
4546c30aeeb8%40sessionmgr13&vid=2&hid=23
[8]. The Scottish Government(2007). Employee Engagement : A review of Literature.Retrieved on 1 May , 2013 from
http://www.scotland.gov.uk/Publications/2007/05/09111348/3
[9]. Sharma Baladev and Raina Anupama (2010).Determinants of Employee Engagement in Private Sector Organization : An exploratory
study Retrieved on 25 April , 2013 from http://web.ebscohost.com/ehost/pdfviewer/pdfviewer?sid=7470e372-e0ee-4ac5-9d50-
1757dad02b5a%40sessionmgr4&vid=2&hid=23
[10]. Solomon Markos , Sandhya Sridevi (2010).Employee Engagement : The Key to improving performance. Retrieved on 6 May , 2013
from http://www.ccsenet.org/journal/index.php/ijbm/article/download/6745/6332
[11]. Sumi Jha(2013).Analysis of Factors affecting Employee Engagement and Job satisfaction : a case of Indian IT Organization. Retrieved
on 6 May 2013 from http://www.icmis.net/ictbm/ictbm13/proceedings/pdf/D3209-done.pdf
[12]. Tamara J. Erickson and Lynda Gratton(2007). What It Means to Work Here. Retrieved on April 20 ,2013 from
http://executivesource.com/wp-content/uploads/2011/05/What-it-Means-to-Work-Here.pdf
[13]. Towers Perrin HR services(2003).Working Today : Understanding what drives Employee Engagement. Retrieved on 8 April , 2013 from
http://www.towersperrin.com/tp/getwebcachedoc?webc=hrs/usa/2003/200309/talent_2003.pdf
[14]. Vijaya Mani(2011).Analysis of Employee Engagement and its Predictors. Retrieved on 5 May , 2013 from
http://www.macrothink.org/journal/index.php/ijhrs/article/download/955/791
[15]. Zikmund.Business Research Methods(8E).Retrieved on 20 May, 2013 from
http://www.cengage.com/marketing/book_content/1439080674_zikmund/book/
[16]. NASSCOM (2013). The IT-BPM Sector in India, Strategic Review 2013. Retrieved on 25 May , 2013 from
http://www.nasscom.in/sites/default/files/uploads/temp/Strategic_Review_2013.pdf
[17]. Govind Negi (2013). How to make an ideal Joining kit. Retrieved on 19 May , 2013 from http://hrsuccesstalk.blogspot.in/2013/03/how-
to-make-ideal-joining-kit.html
[18]. Talya N Bauer (2010). Onboarding New Employees: Maximizing Success. Retrieved on 24 May , 2013 from
http://www.shrm.org/about/foundation/products/documents/onboarding%20epg-%20final.pdf
[19]. Polaris Financial Technology Limited(2010). Annual Report (2009-2010). Retrieved on 1 June , 2013 from
[20]. http://www.polarisft.com/media/investors/reports/annual_report_corporate_2010.pdf
[21]. People Metric(2011).Employee Engagement Report : Strategic tool for leaders . Retrieved on 1 June , 2013 from http://www.people-
metrics.net/downloads/Employee_Engagement_Report_PEOPLE_METRICS.pdf
[22]. Data Quest(2005).What makes a best employer .Retrieved on 3 June , 2013 from http://www.dqindia.com/dataquest/news/144223/in-
graphics-what-makes-best-employer