Embed Size (px)
Citation preview
Icelandic environment for innovation and entrepreneurship
- at a glance -
: Team Iceland

0 20,000 40,000 60,000 80,000 100,000 120,000
GermanyFinland
Hong Kong SAR, ChinaCanadaAustria
United KingdomNetherlands
IcelandSweden
DenmarkSingapore
North AmericaUnited States
AustraliaIreland
QatarNorway
Macao SAR, ChinaSwitzerland
Luxembourg
Iceland is among the world's most prosperous countries…
2
GDP per capita 2015 (top 20 countries)
USD
Source: World Bank

0 50 100 150 200 250 300 350 400 450 500
Everything else
Exports of marine products
Exports of manufacturing products
Revenues from foreign travelers
...but the economy lacks in diversity
3
Exports of goods and services (Q4 2015 - Q3 2016)
Source: Statistics Iceland
billion ISK
Aluminum Other

0
2
4
6
8
10
2007 2008 2009 2010 2011 2012 2013 2014 2015 2016
Iceland has recovered remarkably well from the economic crash in 2008
4
Unemployment (seasonally adjusted)
Source: Statistics Iceland
%
Real wages index (2000 annual average = 100)
100
110
120
130
140
2007 2008 2009 2010 2011 2012 2013 2014 2015 2016

Inflation has been unprecedentedly low and stable in local currency terms…
5
Inflation (annualized, 12 month trailing)
Source: Statistics Iceland
0
5
10
15
20
2007 2008 2009 2010 2011 2012 2013 2014 2015 2016

-40
-30
-20
-10
0
10
20
30
2007 2008 2009 2010 2011 2012 2013 2014 2015 2016
...but currency fluctuations make planning in foreign currency wildly unpredictable
6
Consumer price change in USD (since jan 2007)
Sources: Statistics Iceland, Central Bank of Iceland and own calculations
%

Iceland's population is small and younger than most western countries’, …
7
Population by sex and age group 2015
Source: United Nations Department of Economic and Social Affairs
-15 -10 -5 0 5 10 15
-40 -30 -20 -10 0 10 20 30 -15 -10 -5 0 5 10 15
thousand females thousand males
0-5 y/o
10-15 y/o
20-25 y/o
30-35 y/o
40-45 y/o
50-55 y/o
60-65 y/o
70-75 y/o
80-85 y/o
90-95 y/o
Europe USA
Total population: 329 thousand

...fairly well educated, …
8
Educational attainment 2015 (16-75 year olds)
Source: Statistics Iceland
0 5 10 15 20 25 30 35 40
Basic education
Upper secondary education
Tertiary education
%
ISCED 5, 6, 7, 8
ISCED 3, 4
ISCED 1, 2

0 10 20 30 40 50 60 70 80 90 100
Turkey
Macedonia
Malta
Italy
Romania
Denmark
Norway
Switzerland
Sweden
Iceland
…with the highest work force activity rates in Europe for both sexes.
9
Workforce activity rates in Europe 2015 (16-65 year olds, top 5 and bottom 5 for female)
Source: Eurostat
%
MaleFemale
…
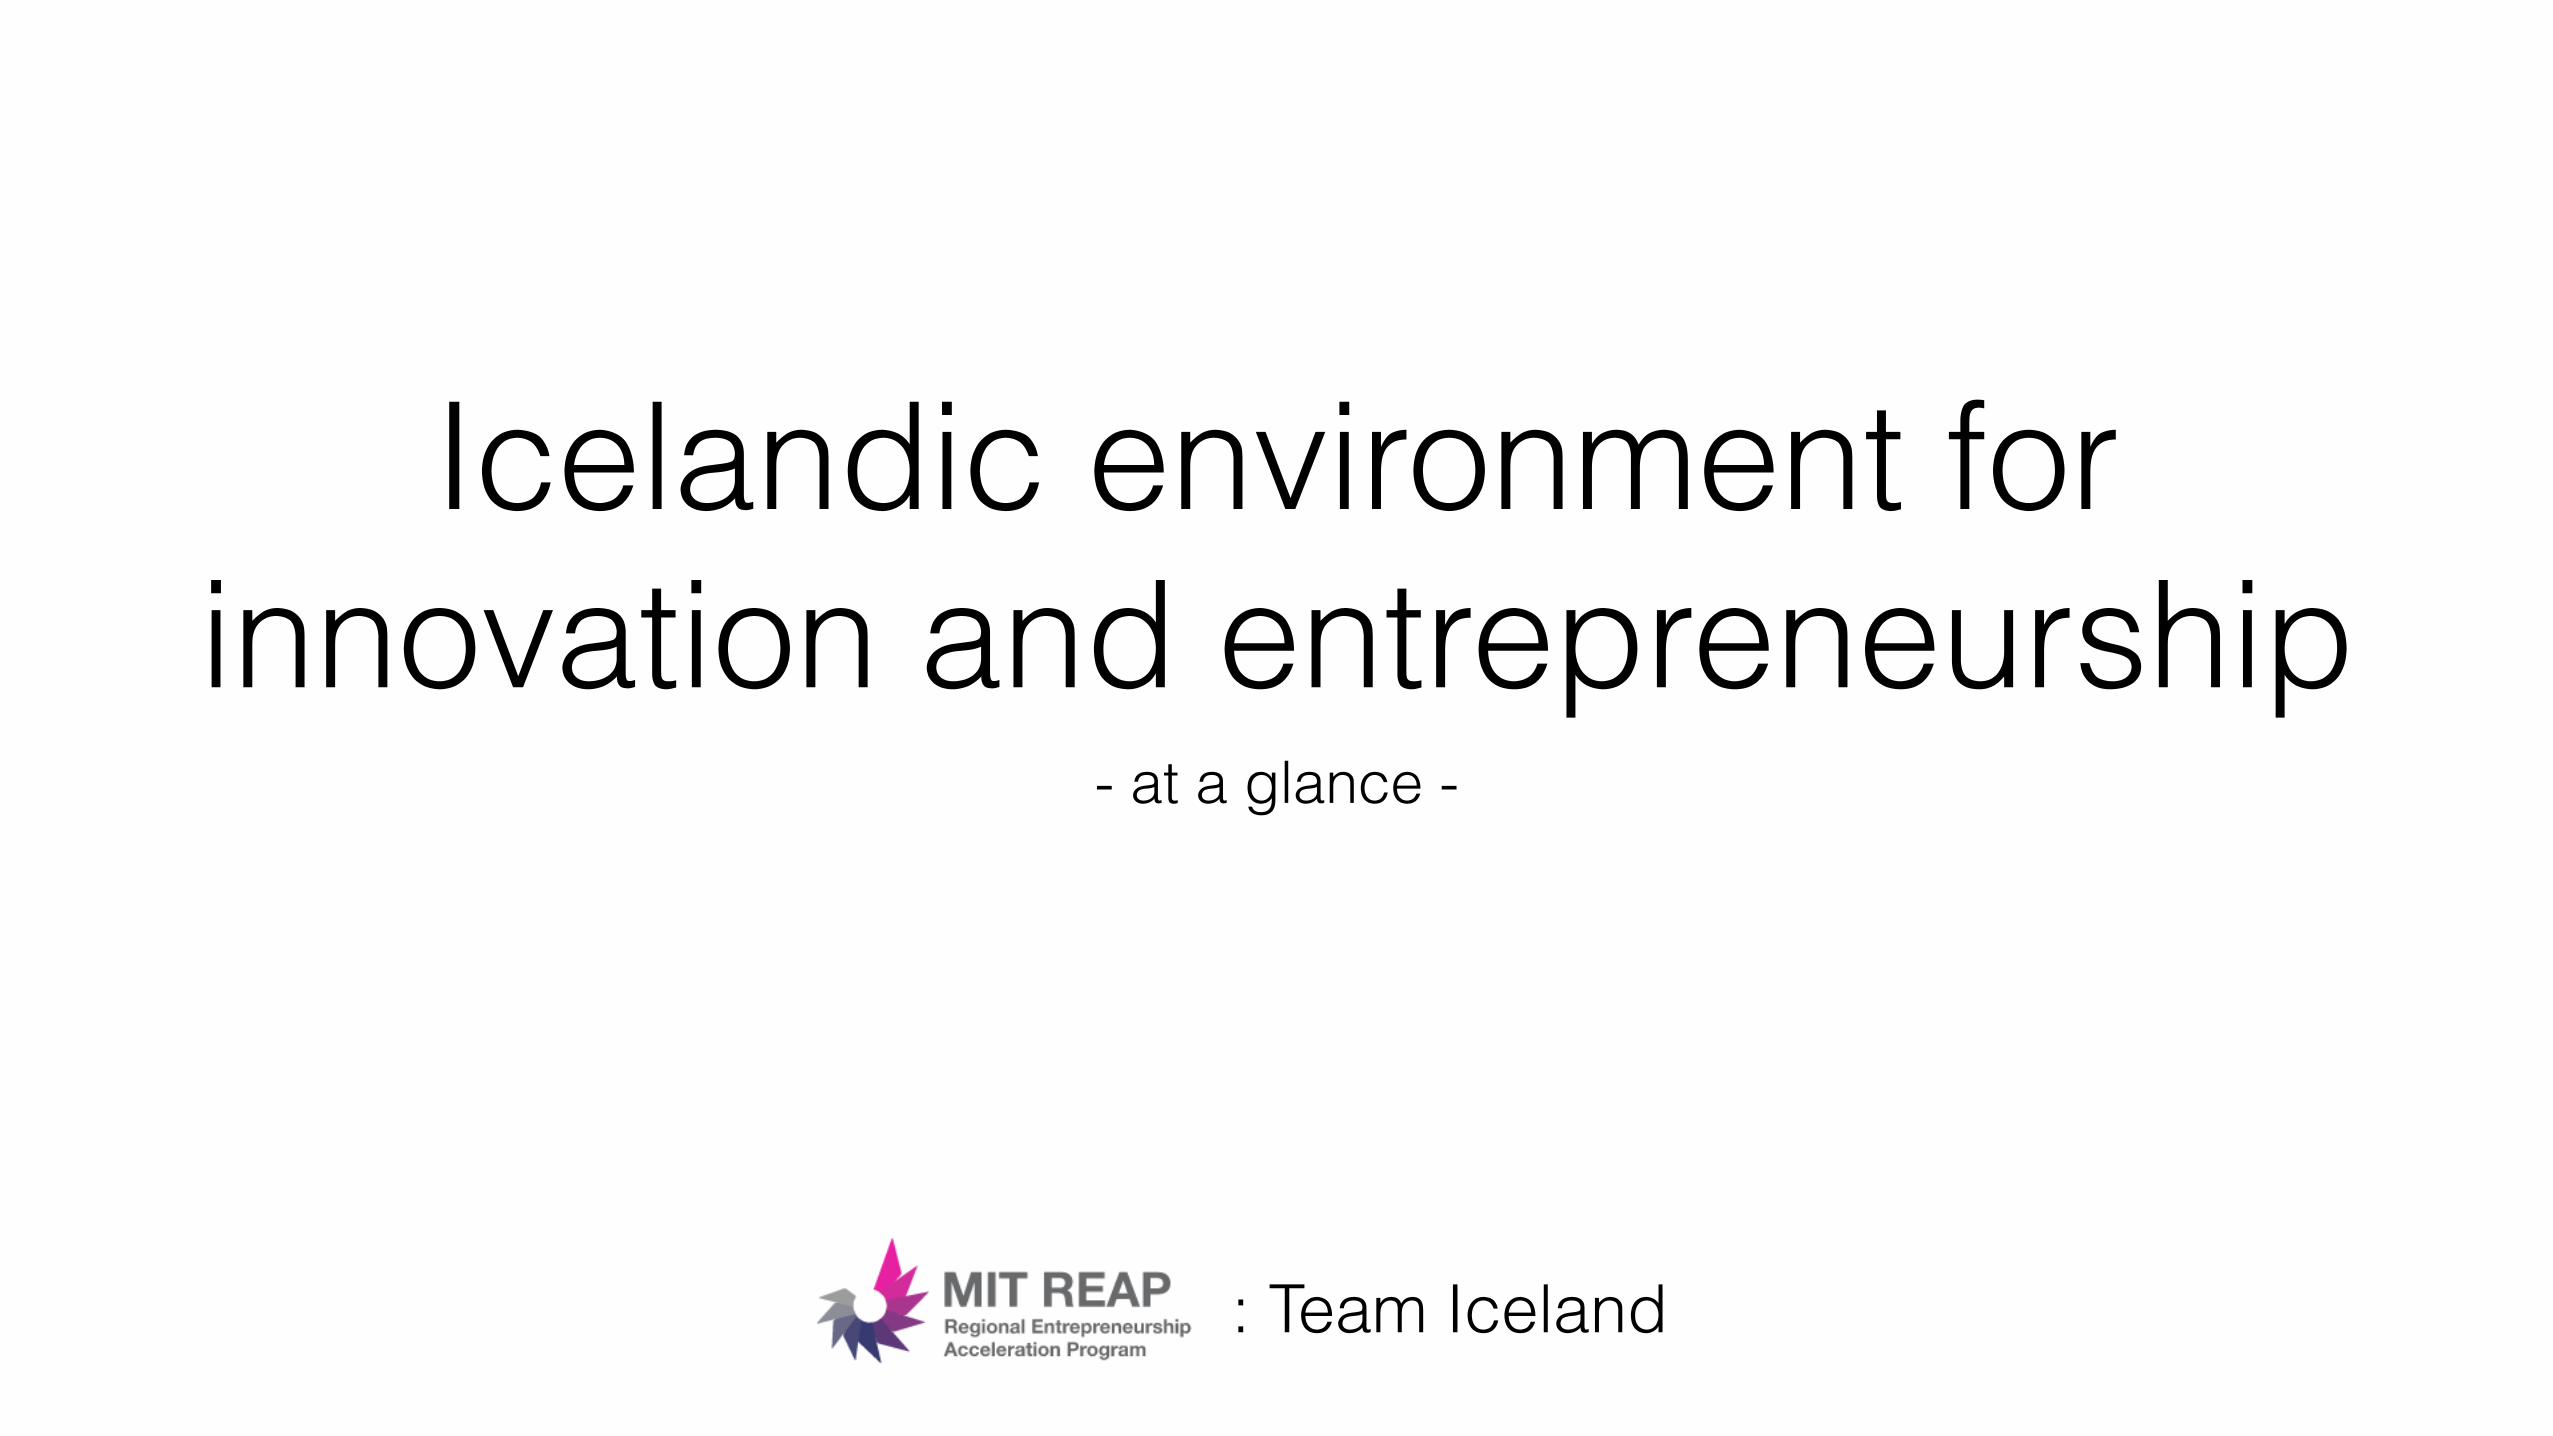
The population is increasingly - yet still not highly - diverse…
10
Source: Statistics Iceland
0
100,000
200,000
300,000
400,000
2000 2002 2004 2006 2008 2010 2012 2014 2016
Population by country of birth Population by country of birth 2016
Born in Iceland
All other countriess of birth
0 100,000 200,000 300,000
All other countries
Thailand
United Kingdom
Lithuania
Philippines
Germany
Sweden
United States
Denmark
Poland
Iceland

...but recently with opposite immigration trends for Icelandic and foreign citizens - possibly a sign of “brain drain”
11
Net immigration by citizenship
Source: Statistics Iceland
-6,000
-4,000
-2,000
0
2,000
4,000
6,000
8,000
10,000
12,000
2000 2002 2004 2006 2008 2010 2012 2014
Icelandic citizens
Foreign citizens

Technological infrastructure is strong…
12
Households with internet access (top 20, Europe 2014)
Source: Statistics Iceland
0 10 20 30 40 50 60 70 80 90 100
PolandHungarySlovenia
Czech RepublicSlovakia
AustriaMalta
IrelandBelgium
FranceEstonia
GermanySwedenFinland
United KingdomNorway
DenmarkIceland
NetherlandsLuxembourg
%

0
0.1
0.2
0.3
0.4
2007 2008 2009 2010 2011 2012 2013 2014 2015
...and technology adoption very high
13
Source: Post and Telecommunications Administration in Iceland
Broadband connections per capita Mobile subscriptions per capitaFiber optic xDSLOther
0
0.2
0.4
0.6
0.8
1
1.2
1.4
2007 2008 2009 2010 2011 2012 2013 2014 2015

Entrepreneurship levels are rather high…
14
New business registrations (per 1,000 people ages 15-64, top 20 countries 2014)
Source: World Bank
0 5 10 15 20 25 30 35
MauritiusNetherlands
GeorgiaIreland
MongoliaMontenegro
SwedenNorway
ChileBulgariaIceland
SingaporeLatvia
BotswanaCyprus
AustraliaEstonia
New ZealandMalta
Hong Kong SAR, China
0 100 200 300 400PortugalBelgium
AustraliaCzech Republic
KazakhstanPolandCanada
NetherlandsIsrael
ItalyIceland
MonacoRussian Federation
Iran, Islamic Rep.Switzerland
SwedenNorwayFrance
LuxembourgUnited Kingdom
SingaporeDenmark
AustriaFinland
New ZealandChina
GermanyUnited States
JapanKorea, Rep.
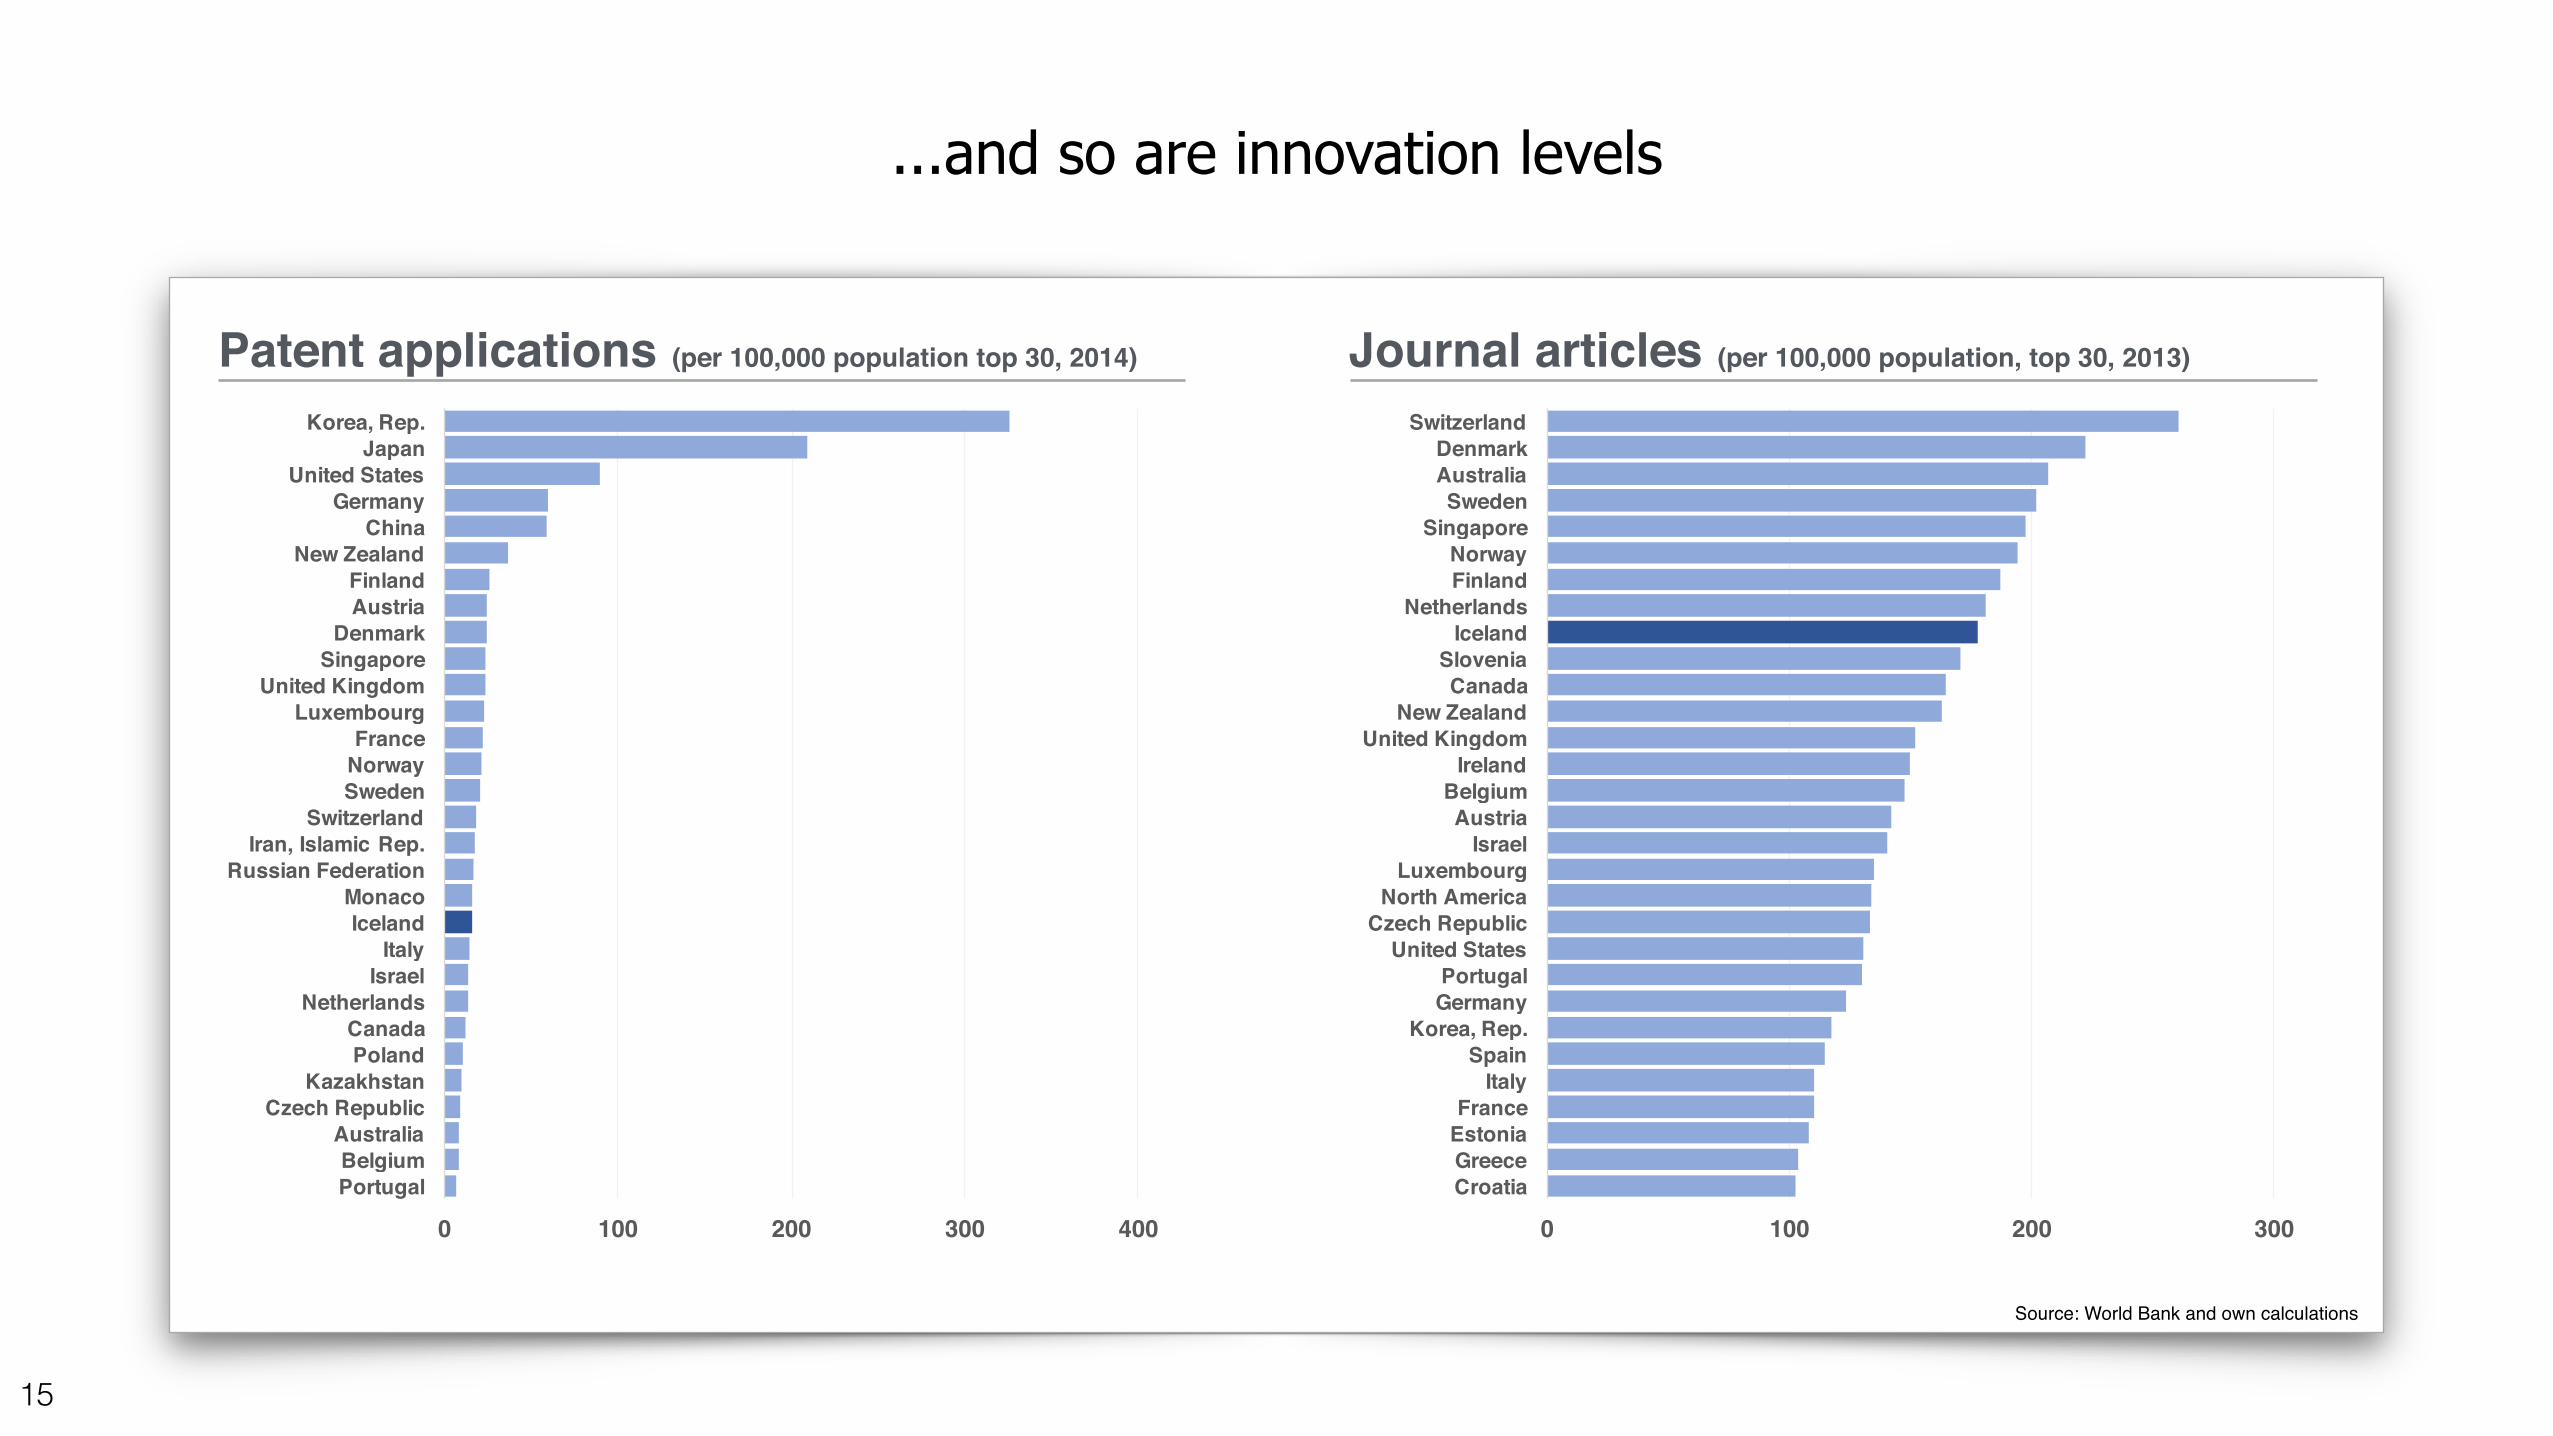
...and so are innovation levels
15
Patent applications (per 100,000 population top 30, 2014)
Source: World Bank and own calculations
0 100 200 300CroatiaGreeceEstoniaFrance
ItalySpain
Korea, Rep.GermanyPortugal
United StatesCzech Republic
North AmericaLuxembourg
IsraelAustria
BelgiumIreland
United KingdomNew Zealand
CanadaSlovenia
IcelandNetherlands
FinlandNorway
SingaporeSweden
AustraliaDenmark
Switzerland
Journal articles (per 100,000 population, top 30, 2013)
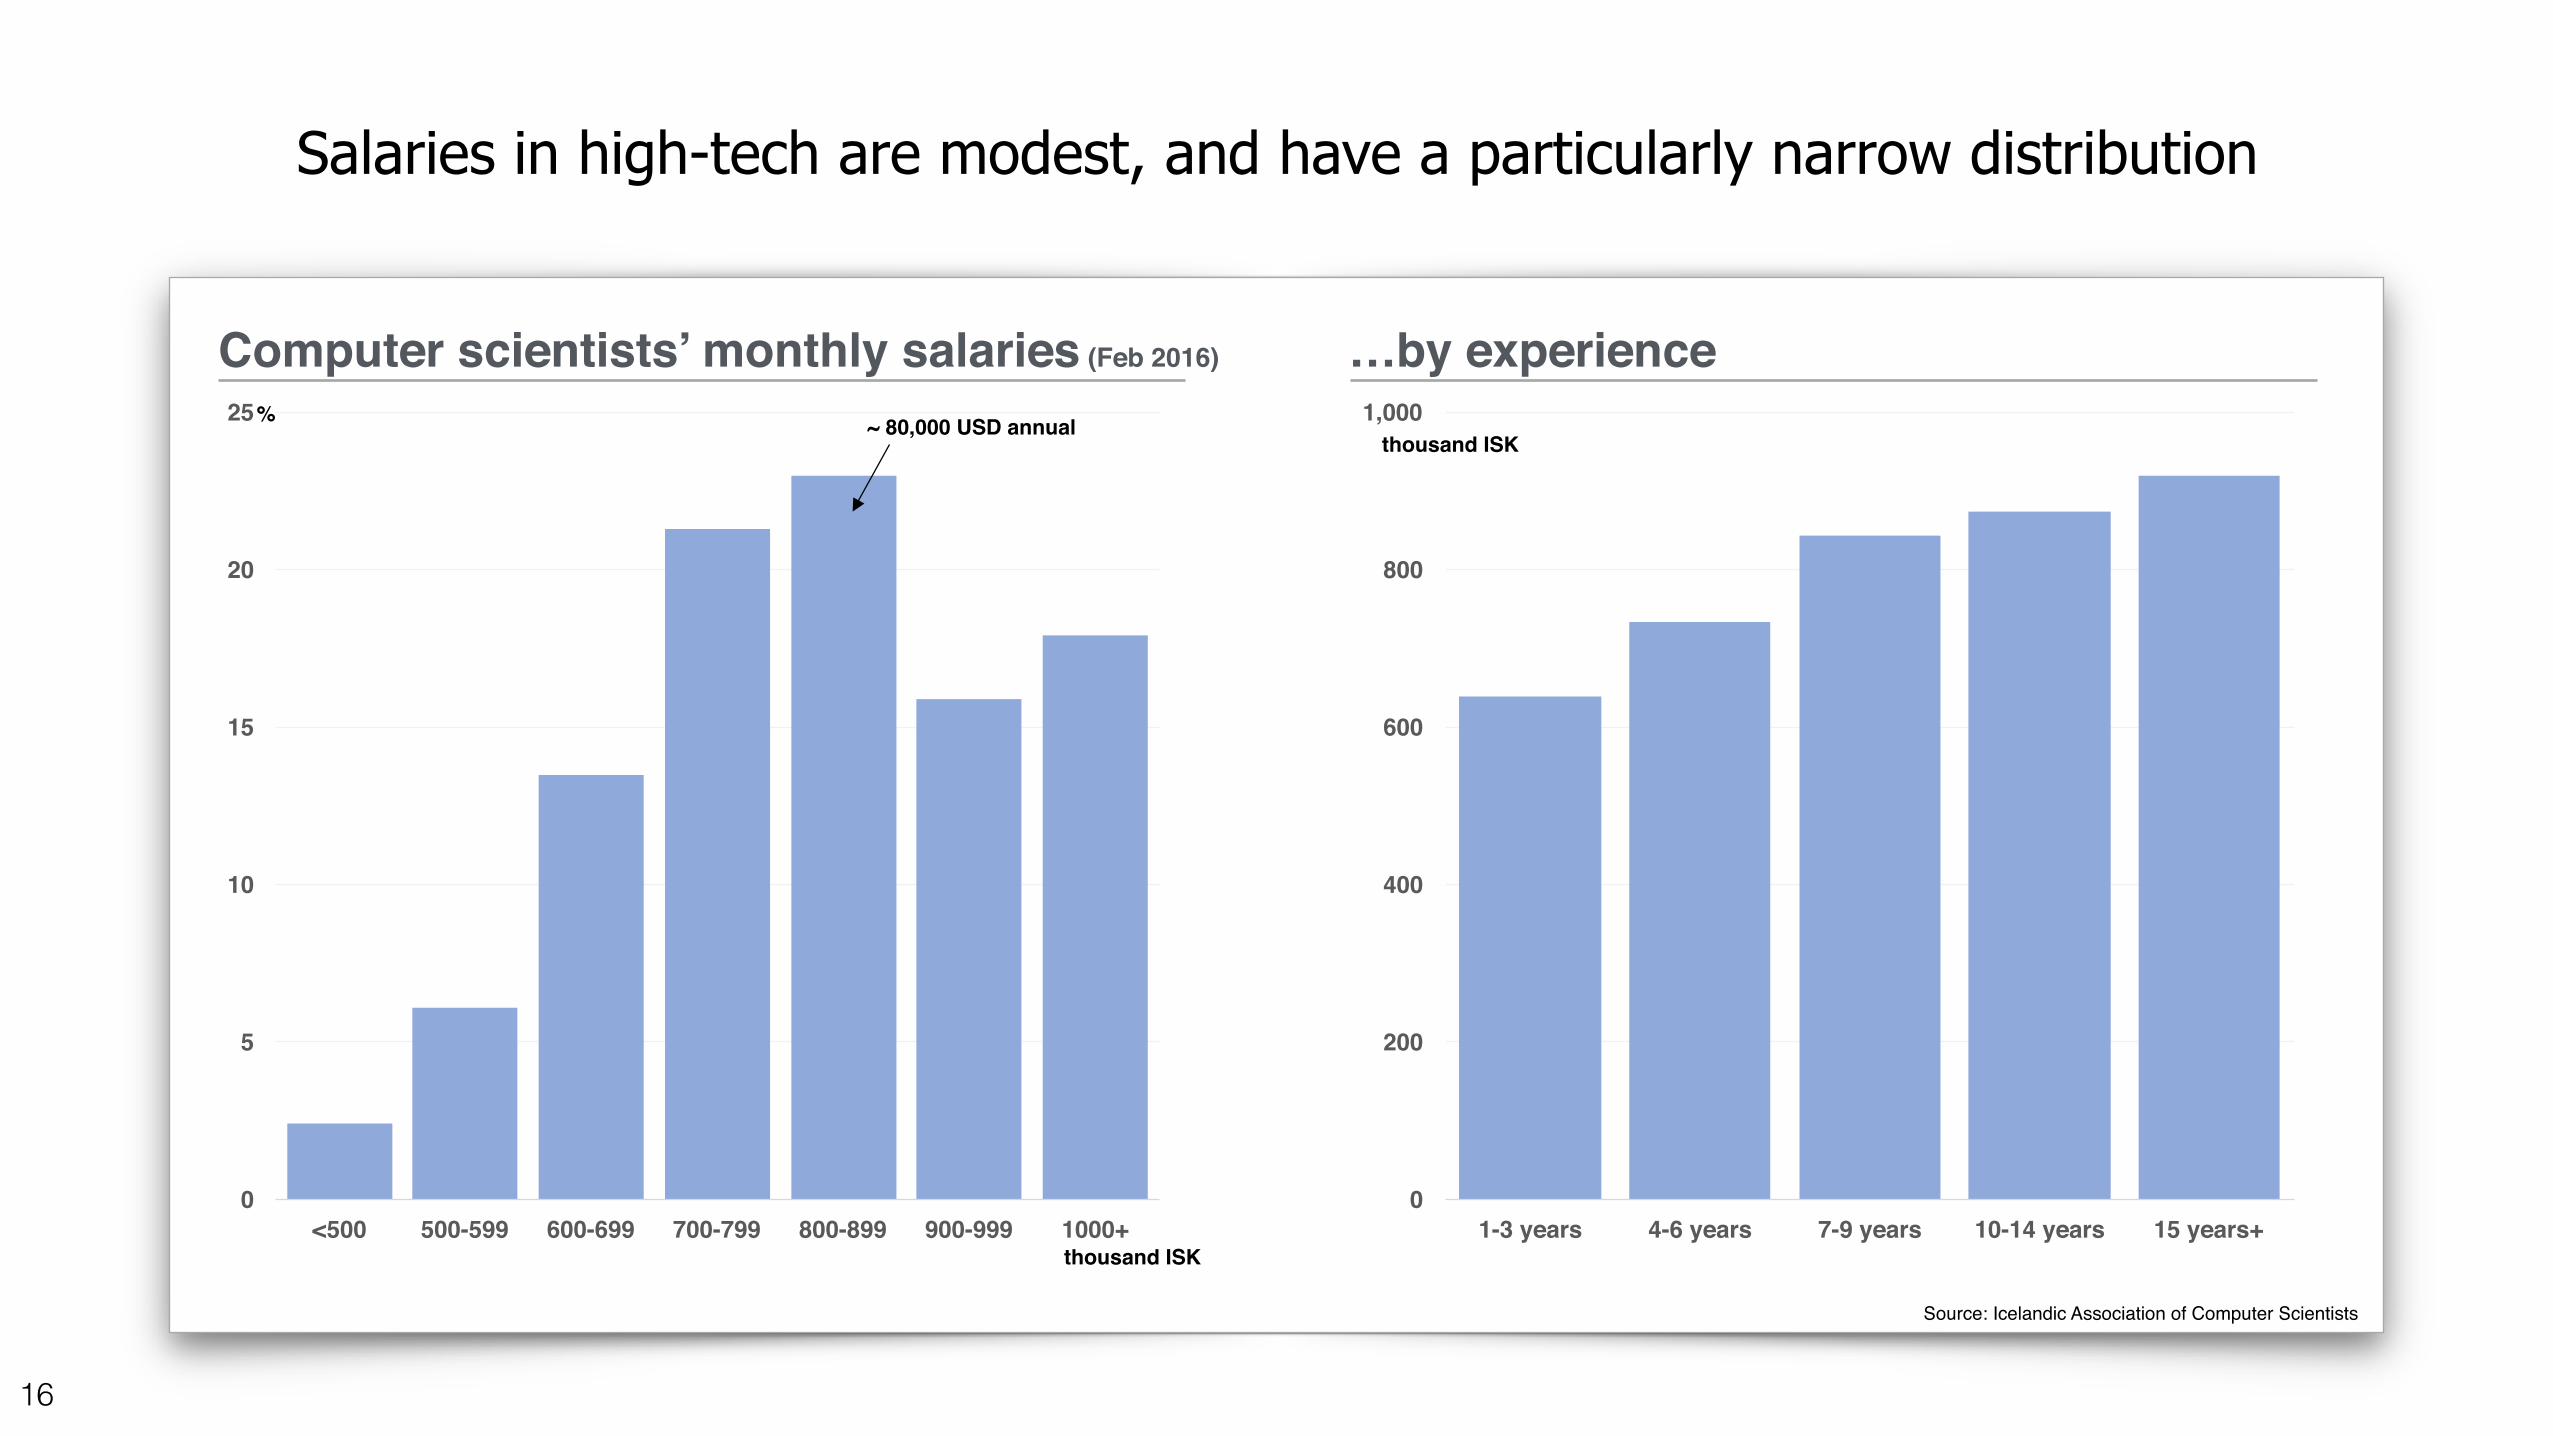
Salaries in high-tech are modest, and have a particularly narrow distribution
16
Source: Icelandic Association of Computer Scientists
Computer scientists’ monthly salaries (Feb 2016) …by experience
0
200
400
600
800
1,000
1-3 years 4-6 years 7-9 years 10-14 years 15 years+0
5
10
15
20
25
<500 500-599 600-699 700-799 800-899 900-999 1000+
~ 80,000 USD annual%thousand ISK
thousand ISK

National R&D investment level is high, …
17
R&D expenditures as percentage of GDP (top 20, Europe 2015)
Source: Eurostat via Statistics Iceland
0 1 2 3 4
SlovakiaSpain
PortugalLuxembourg
ItalyHungaryEstonia
United KingdomNorway
Czech RepublicNetherlands
IcelandSlovenia
FranceBelgium
GermanyFinnlandDenmark
AustriaSweden
%

0
5
10
15
20
25
2014 2015 20160
50
100
150
200
2014 2015 2016
…early stage funding activity is decent, …
18
Source: Northstack (subject to change)
Number of deals by type Value of deals by type (undisclosed amounts excluded)
OtherVentureSeed
OtherVentureSeed
M$
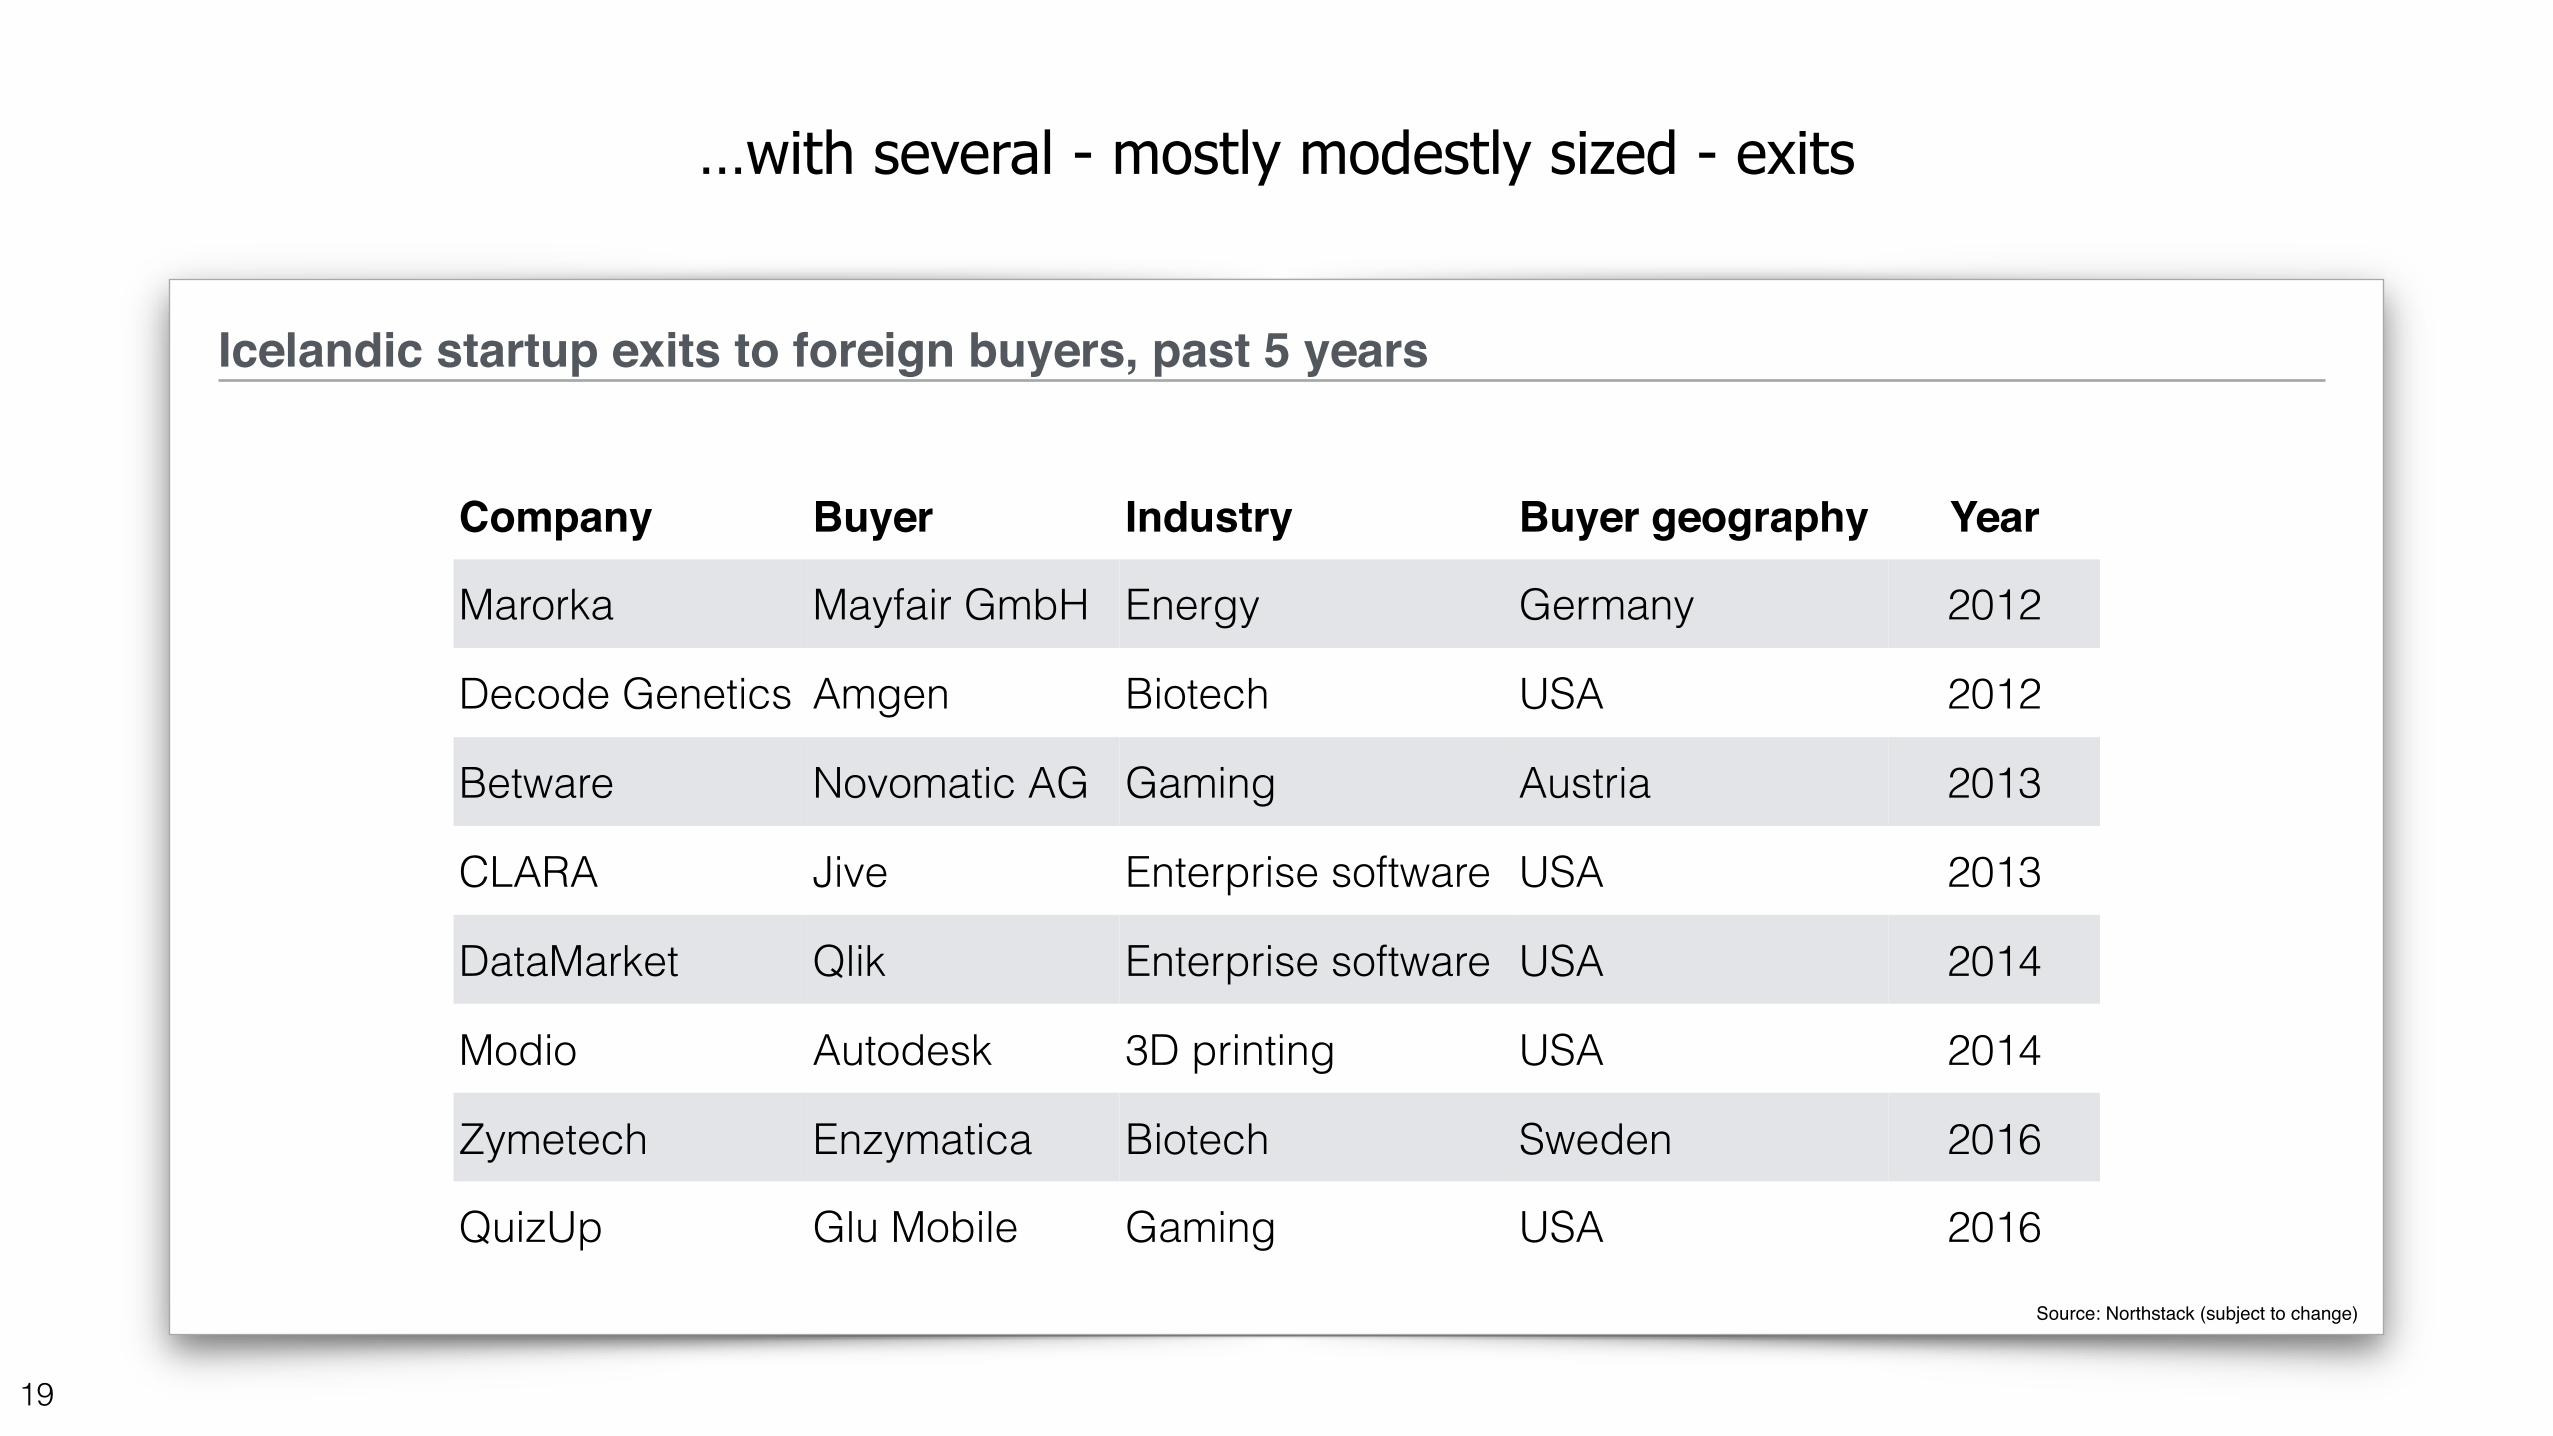
…with several - mostly modestly sized - exits
19
Icelandic startup exits to foreign buyers, past 5 years
Source: Northstack (subject to change)
Company Buyer Industry Buyer geography Year
Marorka Mayfair GmbH Energy Germany 2012
Decode Genetics Amgen Biotech USA 2012
Betware Novomatic AG Gaming Austria 2013
CLARA Jive Enterprise software USA 2013
DataMarket Qlik Enterprise software USA 2014
Modio Autodesk 3D printing USA 2014
Zymetech Enzymatica Biotech Sweden 2016
QuizUp Glu Mobile Gaming USA 2016