Embed Size (px)
Citation preview
Interactive Brokers Group (IBKR)
How Do You Analyze & Value Rapid Growth?

In 1975, Charles Schwab disrupted the investing industry with discounted trading fees. By cutting costs and overhead it could undercut the full-service brokers on price.
By the boom of 1999, Schwab’s market cap
exceeded that of all the full-service brokers.
Is a competitor doing to Schwab what Schwab
did to Merrill Lynch et. al.?

Ticker:
IBKR
Stock Price:
$27
Market Cap:
~1.57B
EV:
FY2014 P/E:
Interactive Brokers

Background

Business Overview
• IBG began as a market maker in 1977
• Launched brokerage business in 1993
• As of 3Q14, 97% of pre-tax income is from brokerage segment
• Largest US e-broker by number of trades
• Offers access to 100+ markets in 24 countries
• #1 e-broker in Barron’s for past 3 years
• Highly automated & efficient - $1.2M revenue per employee

The Wealth Management Ecosystem
FinancingBanks, Investors
IT
Labor
GovernmentRegulation
Individual
InvestorsUltra-High Net Worth
High Net Worth
Mass Affluent
DIY Investors
ExchangesCME
NDAQ
ICE
CBOE
IEX
Dark Pools
Wealth ManagementE-Brokers, Wirehouses, RIAs,
Broker/Dealers
IntermediariesHedge Funds
Mutual Funds

Competition in the U.S. Wealth Management Industry
Business
Model
Customer
Segment
Low Touch
High Touch
DIYMass Affluent
$100,000-1,000,000HNW
$1,000,000-5,000,000
UHNW
$5,000,000+
DIRECT PROVIDERS (MUTUAL FUND SUPERMARKETS & E-BROKERS)
SCHW ETFC AMTD IBKR FIDELITY VANGUARD T. ROWE PRICE
INSURANCE BROKER/DEALER
AMERIPRISE
WIREHOUSES
BAC WFC
REGIONAL BROKER/DEALER
Raymond James Stifel Financial
BANK BROKER/DEA;ER
BNP Paribas Credit Suisee UBS

The E-Broker Industry Has Attractive Economic Characteristics
• Low asset-intensity and reinvestment
needs
• High fixed costs and scale advantages
• High switching costs. Once customers
open an account, inertia takes over.
• Very high ROICs
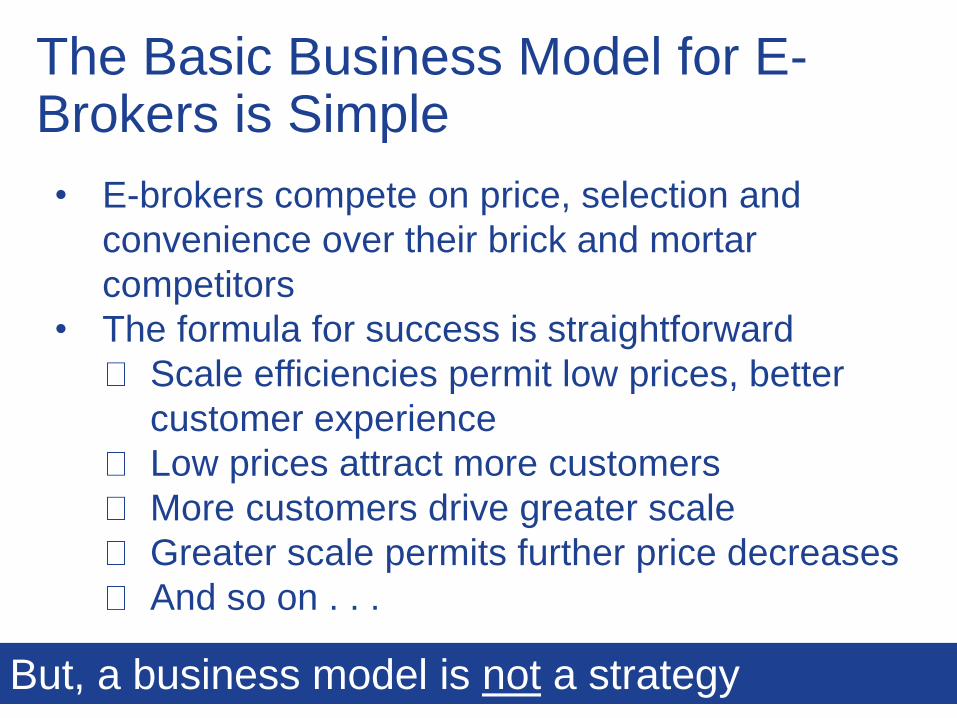
The Basic Business Model for E-Brokers is Simple
• E-brokers compete on price, selection and
convenience over their brick and mortar
competitors
• The formula for success is straightforward
Scale efficiencies permit low prices, better
customer experience
Low prices attract more customers
More customers drive greater scale
Greater scale permits further price decreases
And so on . . .
But, a business model is not a strategy.

Competitors’ “Strategy”• Schwab, E-Trade and Ameritrade serve the
same customers, meet the same needs and sell
at the same relative price. This is not a strategy.
• All 3 target the Mass Affluent segment and offer
basic stock trading and low commissions
complemented by higher-end wealth
management services.
• The best they can hope is the emergence of a
cozy oligopoly.
• In an industry where $/million traded has been
dropping for 40 years, this is unlikely.

IBG’s competitive strategy is fundamentally different.
• Basic business model is the same as the
other e-brokers
• But, IBG meets the “idiosyncratic” needs of
only a segment of the customers & offers
only a subset of the industry’s services
• IBG does not try to be all things to all people

Trade Offs Embedded in IBG’s Strategy• No physical locations
• No in-person service to customers
• No educational services or other amenities for
novice investors
• No banking services
• No sale of order flow revenue
• No asset management fees

IBG’s Target Customer
• Target Customer -
• Low Cost
• Self-Service/Reduced Hand Holding
• Latest in trading technology
• Derivatives expertise
• Worldwide access/Unusually broad
product offerings
• Frequent trading
• Examples: hedge funds, mutual funds,
introducing brokers, proprietary trading
groups and financial advisors and active
individual traders

Target Market
Management understands this trade off:
“We believe that the better the prices we get for
our customers, the better their performance will be
and the more business they will bring to us. On
the other hand, our competitors believe that most
customers can’t tell the difference between good
and bad executions. I think we both could be right.
As a result, they end up with the customers who
can’t tell the difference and we end up with those
who can.”
- Thomas Peterffy, CEO, Q3 2014 Earnings Call

Impact of IBG’s Strategic Choices
• IBG is using its cost advantages to compete on
price, gain share and drive its competitors out of
this segment of the business.
• Competitors are focused on asset management
and administration fees and de-emphasizing
trading revenue.
• IBG carved out a niche that relies on high
volume/low price. Competitors are not
interested.
IBG’s targeted strategy & defendable niche
results in structural advantages.

Revenue Sources of the Major E-Brokers
Schwab, E*Trade & Ameritrade are in the asset-
gathering business. IBG is in the trading business.
IBG Schwab
Ameritrade1
E-Trade
1. Ameritrade remains a strong player in trading because of its strong options business.

Growth is accelerating
Source: IBG Investor Presentation, 11/14.

Key Growth Rates
Item 5 Year CAGR
Revenue (Brokerage Only) 15%
Pre-Tax Income (Brokerage
Only)*
18%
Total Accounts 16%
Customer Equity 32%
Total Customer DARTs 10%
Margin Receivable 43%
*Excludes 2013 non-recurring expense.

Competitive Advantages

Competitive Advantage #1 – Cost Structure/Pricing
2013 Expenses
Per Trade
100 Share
Commission
Amount
$25K Margin
Loan Rate
Charles Schwab $28.71 $8.95 8.00%
E*TRADE
$27.02
$7.99 7.94%
Ameritrade $16.33 $9.99 8.50%
Interactive Brokers $2.75 $1.00 1.57%
Source: Expenses per trade are per my calculations. Prices are per IBG website.
IBG dramatically undercuts competitors on costs
and price.
IBG can be profitable at a price level that leaves their
competitors losing money.

Better
Customer
Experience
Virtuous Circle of Scale Advantages
More Traffic
More
Selection
Lower
Cost
Structure
Lower
Prices
Better
Execution Growth
Based on a napkin sketch prepared by Jeff Bezos to illustrate Amazon’s
model.

Operating Leverage at Work
Operating expenses are growing much slower than
revenue.
Brokerage Revenue & Operating Expense, 2005-13*
Growth spreads fixed costs across more sales, thus
reducing cost per unit.
*2013 expenses does not include non-recurring expense of $64.

Changing Business Mix
Operating Income by Segment, 2005-2013
The declining market maker business masks the
high growth of the brokerage business.

Competitive Advantage #2 – Best Customer ExperienceIBG offers compelling advantages to its target
customer:
• Best Execution - IBG does not sell order flow
• Widest Breadth of Product - 5 million equities,
mutual funds, ETFs, options and futures from 24
countries.
• Superior Trading Technology
Scale provides ability to invest heavily in
customer experience.
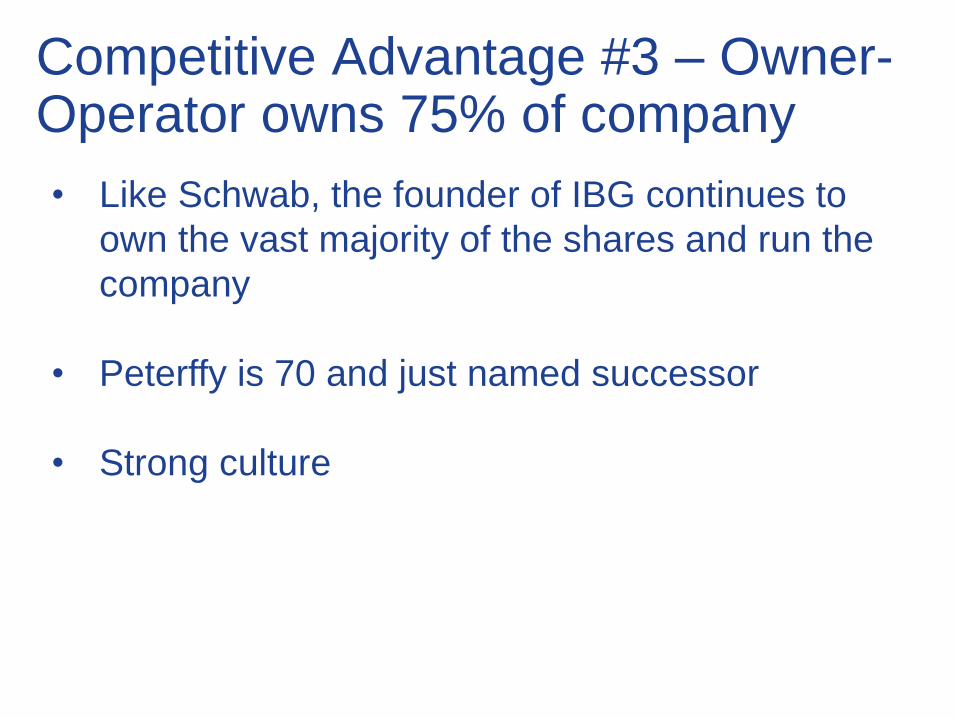
Competitive Advantage #3 – Owner-Operator owns 75% of company
• Like Schwab, the founder of IBG continues to
own the vast majority of the shares and run the
company
• Peterffy is 70 and just named successor
• Strong culture

Valuation Process*
*This process was inspired by Charlie Munger & Prof. Sanjay Bakshi, See “The Final Relaxo Lecture”

Step #1 Identify Future Value Drivers
The critical driver for IBG will be sales growth
(rather than capital turns, expense reduction, etc.)
driven by (1) business volume growth and (2)
average realization growth propelled by changes in
customer mix, product mix, inflation and price
power of the business.
The table below shows historical results.
2006 2007 2008 2009 2010 2011 2012 2013 8 Yr. CAGR 5 Yr. CAGR
Net Revenue USD Millions 298.4 425.2 505.8 474.4 547.3 691.5 670.4 814 15% 14%
Total Trades Millions 50 77 94 87 94 112 104 125 14% 9%
Margin Receivable USD Millions 0.85 1.91 1.55 3.23 7 7 9.85 13.6 49% 43%
Commission/DART USD 4.48 4.27 3.86 4.36 4.35 4.07 4.24 4.23 -1% -1%

Step #2 Project the Future Drivers Forward
The average annual growth in DARTs over the past
8 years was 14% and over the past 5 years was
10%.
I assume that DARTs will grow at 10% per year for
a decade. This means that in 2023, IBG will be
doing 1,294K DARTs versus 499K in 2013.
The margin receivable has been growing at 49%
rate for the past 8 years. This is not sustainable. I
assume a 20% CAGR for the next 10 years.
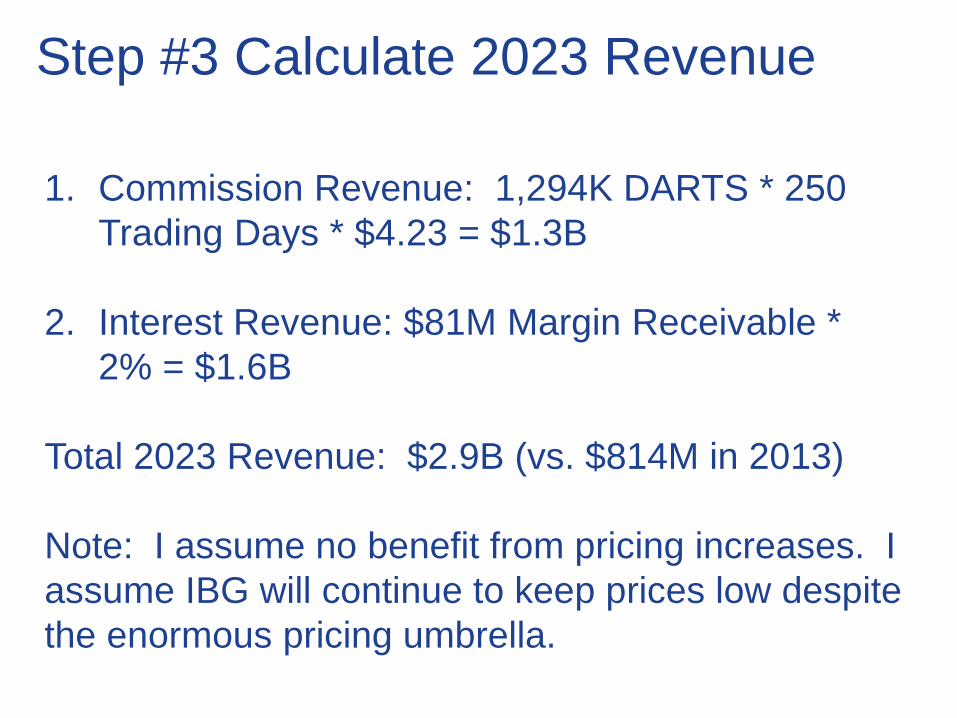
Step #3 Calculate 2023 Revenue
1. Commission Revenue: 1,294K DARTS * 250
Trading Days * $4.23 = $1.3B
2. Interest Revenue: $81M Margin Receivable *
2% = $1.6B
Total 2023 Revenue: $2.9B (vs. $814M in 2013)
Note: I assume no benefit from pricing increases. I
assume IBG will continue to keep prices low despite
the enormous pricing umbrella.

Step #4 Calculate 2023 Value
• After-Tax Income: $2.9B 2023 Revenue * 50%
Margin* – 35% income tax = $968MM
• $968MM * 15 P/E = $14.5B
• Current value = $10.2B (12/8/14)
Assumptions:
1. I used 5 year average margin. I assume no
benefit from further cost reductions or scale.
2. I assigned no value to the market maker
business.

Why Am I Comfortable Making 10 Year Projections?• The industry has been successful since the late
1990s
• IBG’s competitive advantages are sustainable
• Stock trading volume has been increasing for 200
years and is likely to continue.
Thus, (1) IBG can continue to grow faster than the
industry for at least 10 years and (2) even after a
decade of growth there should be plenty of growth
ahead.

Does it make any sense at this value?• Based on my conservative estimates, IBG stock will
appreciate 40% over the next 10 years with limited
risk.
• This is an annual return of 3.42% and not
particularly attractive.


![Interactive Brokers Group (IBKR) Q1 2016 Results - Earnings Call … · 2016. 4. 20. · First Quarter Financial Results Conference Call. [Operator Instructions] As a reminder, this](https://img.pdfslide.us/doc/110x75/5ff0d03c70df2535280c3724/interactive-brokers-group-ibkr-q1-2016-results-earnings-call-2016-4-20.jpg)